EXPLORING ENVIRONMENTAL FLOW REGIMES ENVIRONMENTAL FLOW REGIMES ... 3.2 Sesan ecosystems and...
49
MEKONG CPWF| Optimising cascades of hydropower Assessing the impact of land use change on reservoir sediment loads – Yali, Viet Nam EXPLORING ENVIRONMENTAL FLOW REGIMES Case study of the Lower Se San River April, 2014 P. Meynell, J, Carew-Reid, T. Räsänen, S. Tilleard, T. Ketelsen MK3 Optimising cascades of hydropower FISHERIES & ENVIRONMENT
Transcript of EXPLORING ENVIRONMENTAL FLOW REGIMES ENVIRONMENTAL FLOW REGIMES ... 3.2 Sesan ecosystems and...
MEKONG CPWF| Optimising cascades of hydropower Assessing the impact of land use change on reservoir sediment loads – Yali, Viet Nam
EXPLORING ENVIRONMENTAL FLOW REGIMES
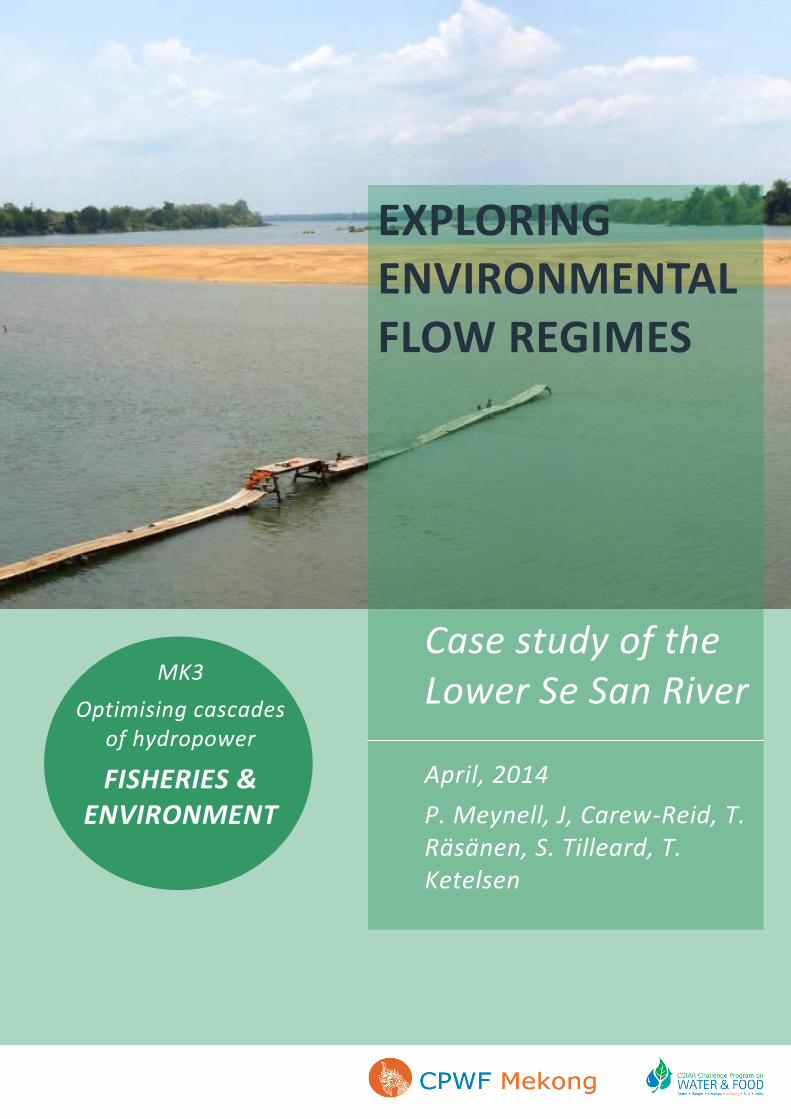
Case study of the Lower Se San River
April, 2014
P. Meynell, J, Carew-Reid, T. Räsänen, S. Tilleard, T. Ketelsen
MK3
Optimising cascades of hydropower
FISHERIES & ENVIRONMENT

MEKONG CPWF| Optimising cascades of hydropower (MK3) Exploring environmental flows in the Lower Se San River Basin
ii
.
Authors Peter-John Meynell (ICEM), Jeremy Carew-Reid (ICEM), Timo Räsänen (Aalto), Simon Tilleard (ICEM), Tarek Ketelsen (ICEM)
Produced by Mekong Challenge Program for Water & Food Project 3 – Optimising cascades of hydropower for multiple use Lead by ICEM – International Centre for Environmental Management
Suggested citation Meynell, P., Carew-Reid, J., Räsänen, T., Tilleard, S., Ketelsen, T.. 2014. Exploring environmental flows: case study of the Lower Se San River. Project report: Challenge Program on Water & Food Mekong project MK3 “Optimizing the management of a cascade of reservoirs at the catchment level”. ICEM – International Centre for Environmental Management, Hanoi Vietnam, 2014
More information www.optimisingcascades.org | www.icem.com.au
Image Cover image: Se San River, Cambodia. (photo credit: P. Meynell)
Project Team Peter-john Meynell (Team Leader), Jeremy Carew-Reid, Peter Ward, Tarek Ketelsen, Matti Kummu, Timo Räsänen, Marko Keskinen, Eric Baran, Olivier Joffre, Simon Tilleard, Vikas Godara, Luke Taylor, Truong Hong, Tranh Thi Minh Hue, Paradis Someth, Chantha Sochiva, Khamfeuane Sioudom, Mai Ky Vinh, Tran Thanh Cong
Copyright 2014 ICEM - International Centre for Environmental Management 6A Lane 49, Tô Ngoc Vân| Tay Ho, HA NOI | Socialist Republic of Viet Nam
MEKONG CPWF| Optimising cascades of hydropower (MK3) Exploring environmental flows in the Lower Se San River Basin
iii
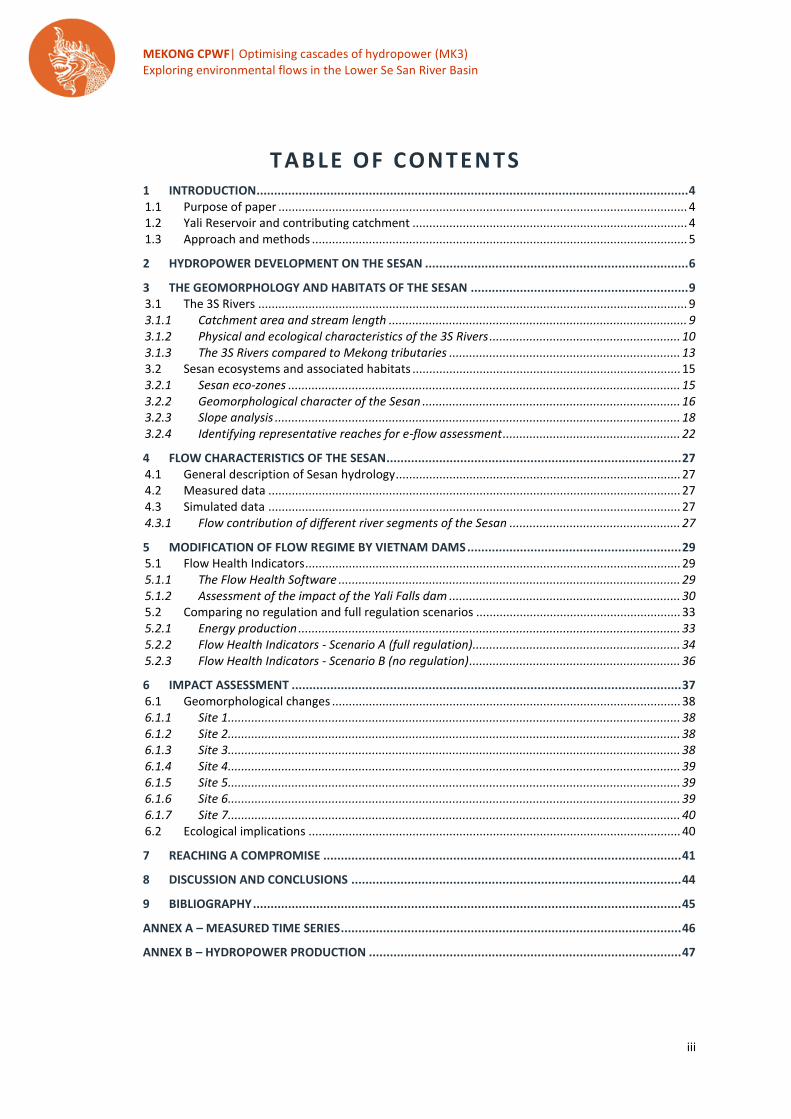
TABLE OF CONTENTS 1 INTRODUCTION ........................................................................................................................... 4 1.1 Purpose of paper .......................................................................................................................... 4 1.2 Yali Reservoir and contributing catchment .................................................................................. 4 1.3 Approach and methods ................................................................................................................ 5
2 HYDROPOWER DEVELOPMENT ON THE SESAN ........................................................................... 6
3 THE GEOMORPHOLOGY AND HABITATS OF THE SESAN .............................................................. 9 3.1 The 3S Rivers ................................................................................................................................ 9 3.1.1 Catchment area and stream length ......................................................................................... 9 3.1.2 Physical and ecological characteristics of the 3S Rivers ......................................................... 10 3.1.3 The 3S Rivers compared to Mekong tributaries ..................................................................... 13 3.2 Sesan ecosystems and associated habitats ................................................................................ 15 3.2.1 Sesan eco-zones ..................................................................................................................... 15 3.2.2 Geomorphological character of the Sesan ............................................................................. 16 3.2.3 Slope analysis ......................................................................................................................... 18 3.2.4 Identifying representative reaches for e-flow assessment ..................................................... 22
4 FLOW CHARACTERISTICS OF THE SESAN .................................................................................... 27 4.1 General description of Sesan hydrology ..................................................................................... 27 4.2 Measured data ........................................................................................................................... 27 4.3 Simulated data ........................................................................................................................... 27 4.3.1 Flow contribution of different river segments of the Sesan ................................................... 27
5 MODIFICATION OF FLOW REGIME BY VIETNAM DAMS ............................................................. 29 5.1 Flow Health Indicators ................................................................................................................ 29 5.1.1 The Flow Health Software ...................................................................................................... 29 5.1.2 Assessment of the impact of the Yali Falls dam ..................................................................... 30 5.2 Comparing no regulation and full regulation scenarios ............................................................. 33 5.2.1 Energy production .................................................................................................................. 33 5.2.2 Flow Health Indicators - Scenario A (full regulation).............................................................. 34 5.2.3 Flow Health Indicators - Scenario B (no regulation) ............................................................... 36
6 IMPACT ASSESSMENT ............................................................................................................... 37 6.1 Geomorphological changes ........................................................................................................ 38 6.1.1 Site 1....................................................................................................................................... 38 6.1.2 Site 2....................................................................................................................................... 38 6.1.3 Site 3....................................................................................................................................... 38 6.1.4 Site 4....................................................................................................................................... 39 6.1.5 Site 5....................................................................................................................................... 39 6.1.6 Site 6....................................................................................................................................... 39 6.1.7 Site 7....................................................................................................................................... 40 6.2 Ecological implications ............................................................................................................... 40
7 REACHING A COMPROMISE ...................................................................................................... 41
8 DISCUSSION AND CONCLUSIONS .............................................................................................. 44
9 BIBLIOGRAPHY .......................................................................................................................... 45
ANNEX A – MEASURED TIME SERIES ................................................................................................. 46
ANNEX B – HYDROPOWER PRODUCTION ......................................................................................... 47
MEKONG CPWF| Optimising cascades of hydropower (MK3) Exploring environmental flows in the Lower Se San River Basin
4
1 INTRODUCTION
1 . 1 P U R P O S E O F P A P E R
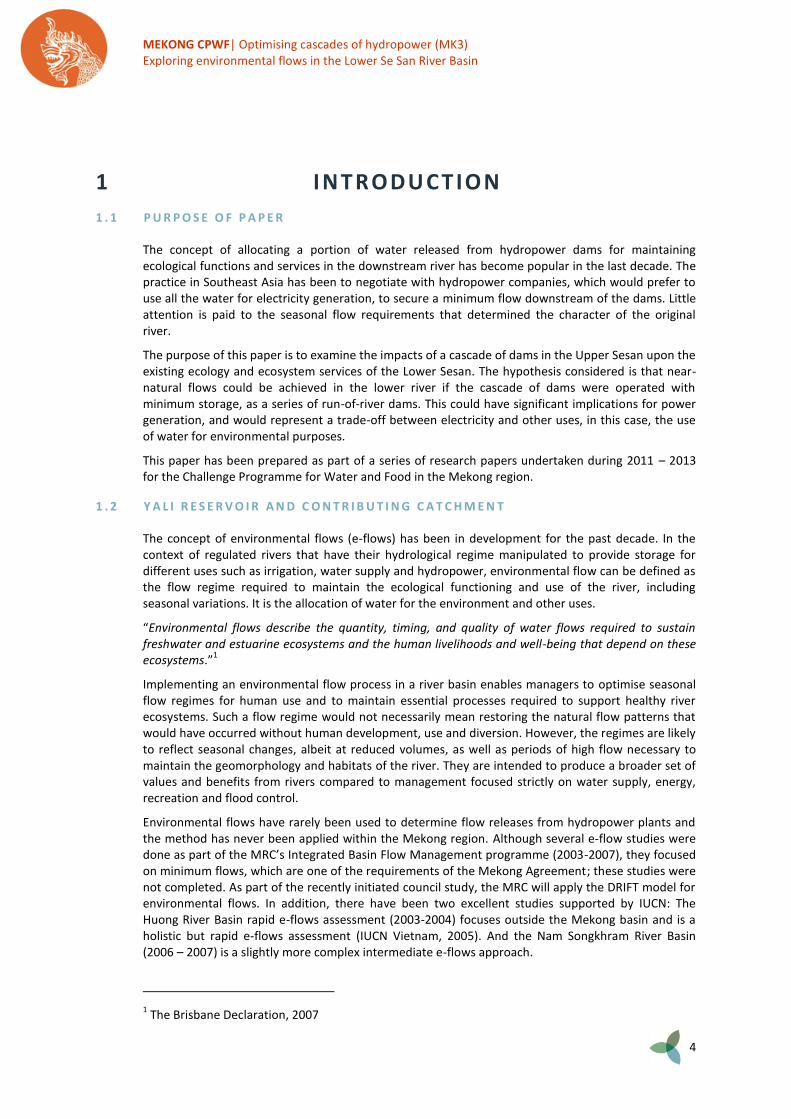
The concept of allocating a portion of water released from hydropower dams for maintaining ecological functions and services in the downstream river has become popular in the last decade. The practice in Southeast Asia has been to negotiate with hydropower companies, which would prefer to use all the water for electricity generation, to secure a minimum flow downstream of the dams. Little attention is paid to the seasonal flow requirements that determined the character of the original river.
The purpose of this paper is to examine the impacts of a cascade of dams in the Upper Sesan upon the existing ecology and ecosystem services of the Lower Sesan. The hypothesis considered is that near-natural flows could be achieved in the lower river if the cascade of dams were operated with minimum storage, as a series of run-of-river dams. This could have significant implications for power generation, and would represent a trade-off between electricity and other uses, in this case, the use of water for environmental purposes.
This paper has been prepared as part of a series of research papers undertaken during 2011 – 2013 for the Challenge Programme for Water and Food in the Mekong region.
1 . 2 Y A L I R E S E R V O I R A N D C O N T R I B U T I N G C A T C H M E N T
The concept of environmental flows (e-flows) has been in development for the past decade. In the context of regulated rivers that have their hydrological regime manipulated to provide storage for different uses such as irrigation, water supply and hydropower, environmental flow can be defined as the flow regime required to maintain the ecological functioning and use of the river, including seasonal variations. It is the allocation of water for the environment and other uses.
“Environmental flows describe the quantity, timing, and quality of water flows required to sustain freshwater and estuarine ecosystems and the human livelihoods and well-being that depend on these ecosystems.”
1
Implementing an environmental flow process in a river basin enables managers to optimise seasonal flow regimes for human use and to maintain essential processes required to support healthy river ecosystems. Such a flow regime would not necessarily mean restoring the natural flow patterns that would have occurred without human development, use and diversion. However, the regimes are likely to reflect seasonal changes, albeit at reduced volumes, as well as periods of high flow necessary to maintain the geomorphology and habitats of the river. They are intended to produce a broader set of values and benefits from rivers compared to management focused strictly on water supply, energy, recreation and flood control.
Environmental flows have rarely been used to determine flow releases from hydropower plants and the method has never been applied within the Mekong region. Although several e-flow studies were done as part of the MRC’s Integrated Basin Flow Management programme (2003-2007), they focused on minimum flows, which are one of the requirements of the Mekong Agreement; these studies were not completed. As part of the recently initiated council study, the MRC will apply the DRIFT model for environmental flows. In addition, there have been two excellent studies supported by IUCN: The Huong River Basin rapid e-flows assessment (2003-2004) focuses outside the Mekong basin and is a holistic but rapid e-flows assessment (IUCN Vietnam, 2005). And the Nam Songkhram River Basin (2006 – 2007) is a slightly more complex intermediate e-flows approach.
1 The Brisbane Declaration, 2007

MEKONG CPWF| Optimising cascades of hydropower (MK3) Exploring environmental flows in the Lower Se San River Basin
5
One of the key challenges in e-flows assessments is linking hydrological changes to ecological impacts. This is particularly difficult in the complex system of the Mekong with its unique flood pulse cycle. Nevertheless, e-flows processes have substantial potential in the Mekong Basin to assist river basin managers grapple with competing demands and the need for environmental sustainability. At present, however, the tool has only been used in academic or technical settings.
In practice, environmental flows require a negotiated agreement between the different water users and stakeholders. The technicalities of flow requirements do not necessarily define this agreement, which would be a trade-off between the different uses. The IUCN’s 2003 publication “Flow” highlights the negotiation process (Dyson, 2003).
1 . 3 A P P R O A C H A N D M E T H O D S
This paper begins with an impact assessment with a focus on the ecology and ecosystem services of the river. The first part of the paper describes the existing and proposed hydropower projects on the Sesan River. The baseline of river geomorphology and habitats is described for the lower part of the river, up to the Yali Falls hydropower project. Important areas for fish spawning and feeding are identified.
The second part of the paper describes the hydrology of the Sesan and the original flow regime in the river before Yali dam was built. A number of key flow characteristics that determine environmental flows have been analysed using the Flow Health modelling tool. This is followed by a discussion of the changes in the flow regime that have occurred over the past 15 years as a result of hydropower operation. These changes in the flow health characteristics are compared with the original flow regime.
The possible impacts of these changes upon the geomorphology and habitats are then discussed, together with implications for biodiversity and productivity of the river and other ecosystem services. In addition to water flow, the other important flow component is sediment transport, where changes in the quantity of sediment moving down the river affect the geomorphology and habitats over time. These changes will be linked to the flow health characteristics described above.
The paper questions whether the hydropower dams on the Upper Sesan should be operated as run-of-river dams. In such operations, the reservoirs are maintained at more or less constant levels and inflows are passed on to the next dam downstream. This mimics the natural flows in the catchment without passing on sediment in the same way. The impacts of reverting to such a natural flow regime on electricity generation will be considered in this paper.
The methods and sources of information that have been used during this analysis include:
Ecological character of the Sesan River as described by (Meynell P.-J. , 2012) Definition of different reaches of the Lower Sesan, through application of Google Earth
visualisation and geomorphological classification as described by (Baran, 2012) Hydrological data from 1985 to 2006 captured at monitoring stations on the Sesan, as
provided by the MRC Hydrological modelling of the Sesan River using VMod as described by (Rasanen, 2012) Application of the Flow Health software as developed by (Gippel C. M., 2012) Information on the existing and proposed hydropower dams on the Sesan from the MRC
Hydropower Database 2010.

MEKONG CPWF| Optimising cascades of hydropower (MK3) Exploring environmental flows in the Lower Se San River Basin
6
2 H YD ROP OWER D EV ELOPME NT ON TH E SESAN
The first major hydropower project on the Sesan River was built at Yali Falls. The Yali Falls dam is the second largest in Vietnam and is located at the Gia Lai and Kon Tum provinces of the Central Highlands of Viet Nam, about 70 kilometres from the Cambodian border. Construction of the 69-metre high dam was begun in 1993 and completed in 1996, with the 64.5-square kilometre reservoir becoming fully operational in 2001. It has an installed capacity of 720 megawatts of hydropower.
Since then, a total of six other major hydropower projects have been constructed on the Upper Sesan in Vietnam. Two of these, Plei Krong and Upper Kon Tum, provide more storage capacity during the dry season and are located above Yali. Four dams are downstream of Yali, with Sesan 4 having the largest storage capacity and the other three being run-of-river dams. Sesan 4A is the lowest dam in the cascade and is intended as a flow regulating dam with an operating drawdown of about 5 metres.
The total installed capacity of hydropower in Vietnam is 1,829 MW, with an annual production of 8,558 Gigawatt hour. This is achieved with an active storage of 2,129 million cubic metres and a reservoir area of 198 km
2.
No dams have yet been built on the Sesan in Cambodia, although Lower Sesan 2 has been approved. There are three dams proposed for the mainstream on the Sesan, namely Sesan 1/5, which would be located on the border with Vietnam and would be a joint project between the two nations; Lower Sesan 3, which would have a very large reservoir area; and Lower Sesan 2, which would be located below the confluence of the Sesan and the Srepok rivers. Two smaller hydropower projects, Prek Liang 1 and 2, are proposed for a tributary of the Sesan in Cambodia.
If all the projects get built, the total installed capacity of hydropower in Cambodia would be 873 MW with an annual production of 5,144 GWh. This would be achieved with an active storage of 996 million m
3 and a reservoir area of 838 km
2. Table 2-1 provides some statistics about these existing and
proposed dams and Figure 2-1 shows the map with approximate locations in the Sesan River system.
Table 2-1: Existing and planned large hydropower dams on the Sesan River
Some comparative indices for these hydropower projects are shown in Table 2-2. For example, some of the upstream dams in Vietnam have high power densities (MW/km
2) compared to the very low
densities of the reservoir dams in Cambodia. This index represents the effectiveness of the inundated area in generating electricity and is indicative of trade-off with other land uses. It is also an indicator of the contribution of the dam to averting climate change by virtue of displacing fossil fuel-based power generation. If the index is more than 10, the scheme is successful in displacing fossil fuels; if it is between 5 and 10, the performance is moderate; and below 5, the performance is poor. On the Sesan, some run-of-river dams perform much better than some larger storage dams on this metric.
HPP name Country/ProvinceCommission
year
Active
storage
Reservoir
area
Reservoir
full supply
level
Reservoir
minimum
operating
level
Average
flow
Design
flow
Rated
head
Installed
capacity
Mean
annual
energy
[mcm] [km2] [masl] [masl] [m3/s] [m3/s] [m] [MW] [GWh]
Upper Kontum Vietnam/Kontum 2011 122.7 7.4 1,170 1,143 15.2 30.5 904.1 250 1,056.4
Plei Krong Vietnam/Kontum 2008 948 53.3 570 537 128 367.6 31 100 417.2
Yali Vietnam/Kontum, Gia Lai 2001 779 65 515 490 262 424 190 720 3,658.6
Se San 3 Vietnam/Gia Lai 2006 3.8 3.4 304 303.2 274 486 60.5 260 1,224.0
Se San 3A Vietnam/Gia Lai 2007 4 8.5 239 238.5 283 500 21.5 96 475.0
Se San 4 Vietnam/Gia Lai 2009 264.2 58.4 215 210 328.9 719 56 360 1,420.1
Se San 4A Vietnam/Gia Lai 2012 7.5 1.7 150 145 330 469 3 43 307.0
Total in Vietnam 2,129.2 197.7 1,829 8,558.3
Se San 1Vietnam/Gia Lai,
Cambodia/Rattanakiri2021 3.4 10.6 141 140 395 319 32 90 479.7
Prek Liang 2 Cambodia/Rattanakiri NA 180 11.9 515 496 17.7 17.7 168 25 186.0
Prek Liang 1 Cambodia/Rattanakiri NA 110 7 330 310 27.2 27.2 153 35 189.0
Lower Sesan 3 Cambodia/Rattanakiri NA 323 414 150 147 500 500 58.5 243 1,977.0
Lower Sesan 2 Cambodia/Stung Treng 2016 379.4 394 75 74 1304 2119.2 26.2 480 2,311.8
Total proposed in Cambodia 995.8 837.5 873 5,143.5
MEKONG CPWF| Optimising cascades of hydropower (MK3) Exploring environmental flows in the Lower Se San River Basin
7
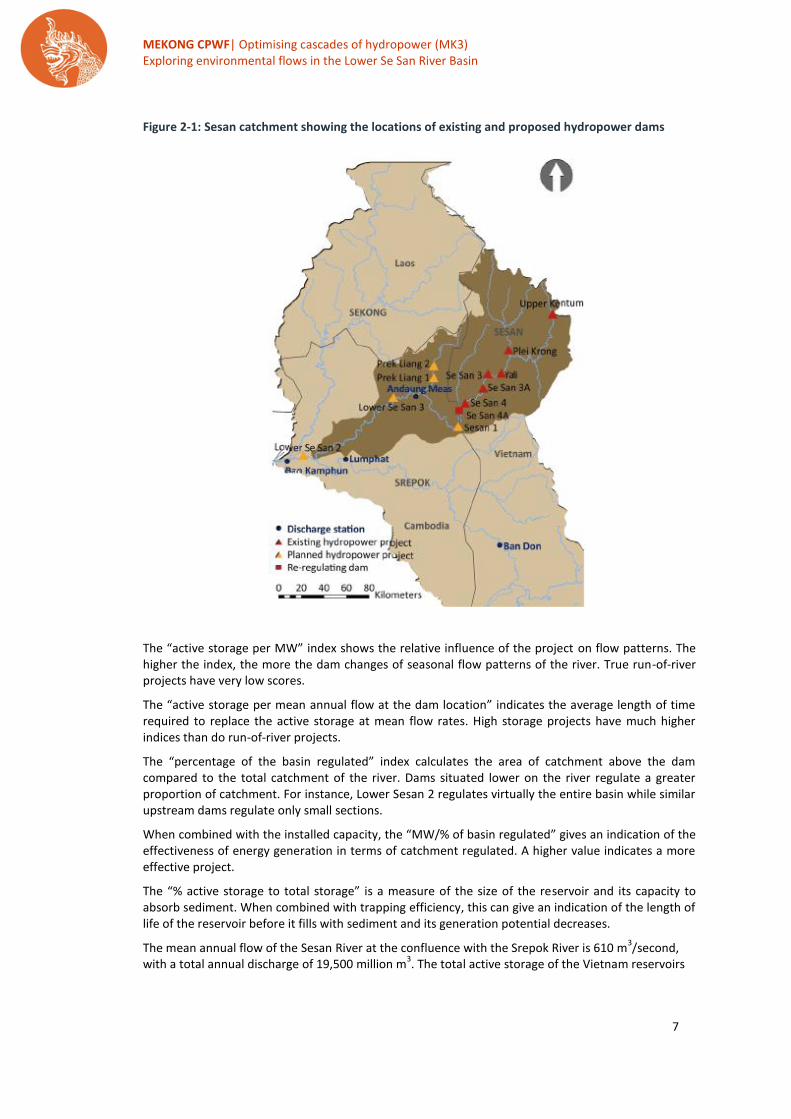
Figure 2-1: Sesan catchment showing the locations of existing and proposed hydropower dams
The “active storage per MW” index shows the relative influence of the project on flow patterns. The higher the index, the more the dam changes of seasonal flow patterns of the river. True run-of-river projects have very low scores.
The “active storage per mean annual flow at the dam location” indicates the average length of time required to replace the active storage at mean flow rates. High storage projects have much higher indices than do run-of-river projects.
The “percentage of the basin regulated” index calculates the area of catchment above the dam compared to the total catchment of the river. Dams situated lower on the river regulate a greater proportion of catchment. For instance, Lower Sesan 2 regulates virtually the entire basin while similar upstream dams regulate only small sections.
When combined with the installed capacity, the “MW/% of basin regulated” gives an indication of the effectiveness of energy generation in terms of catchment regulated. A higher value indicates a more effective project.
The “% active storage to total storage” is a measure of the size of the reservoir and its capacity to absorb sediment. When combined with trapping efficiency, this can give an indication of the length of life of the reservoir before it fills with sediment and its generation potential decreases.
The mean annual flow of the Sesan River at the confluence with the Srepok River is 610 m3/second,
with a total annual discharge of 19,500 million m3. The total active storage of the Vietnam reservoirs
MEKONG CPWF| Optimising cascades of hydropower (MK3) Exploring environmental flows in the Lower Se San River Basin
8
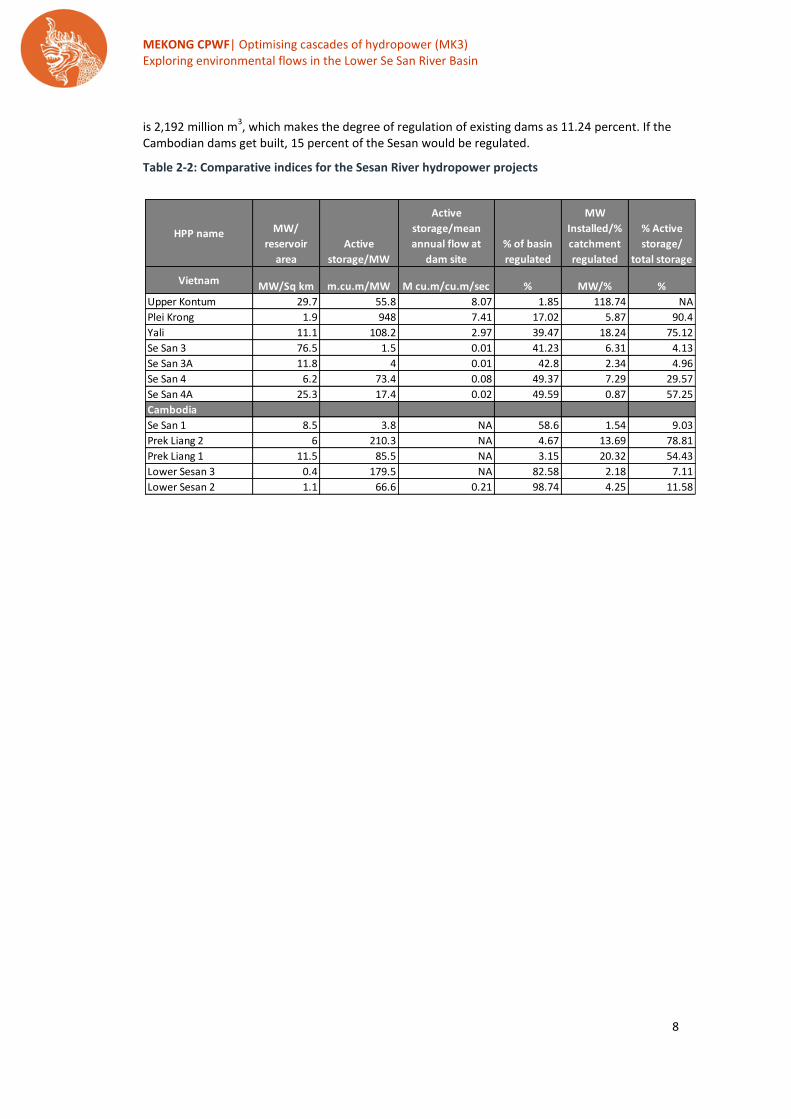
is 2,192 million m3, which makes the degree of regulation of existing dams as 11.24 percent. If the
Cambodian dams get built, 15 percent of the Sesan would be regulated.
Table 2-2: Comparative indices for the Sesan River hydropower projects
HPP name MW/
reservoir
area
Active
storage/MW
Active
storage/mean
annual flow at
dam site
% of basin
regulated
MW
Installed/%
catchment
regulated
% Active
storage/
total storage
Vietnam MW/Sq km m.cu.m/MW M cu.m/cu.m/sec % MW/% %
Upper Kontum 29.7 55.8 8.07 1.85 118.74 NA
Plei Krong 1.9 948 7.41 17.02 5.87 90.4
Yali 11.1 108.2 2.97 39.47 18.24 75.12
Se San 3 76.5 1.5 0.01 41.23 6.31 4.13
Se San 3A 11.8 4 0.01 42.8 2.34 4.96
Se San 4 6.2 73.4 0.08 49.37 7.29 29.57
Se San 4A 25.3 17.4 0.02 49.59 0.87 57.25
Cambodia
Se San 1 8.5 3.8 NA 58.6 1.54 9.03
Prek Liang 2 6 210.3 NA 4.67 13.69 78.81
Prek Liang 1 11.5 85.5 NA 3.15 20.32 54.43
Lower Sesan 3 0.4 179.5 NA 82.58 2.18 7.11
Lower Sesan 2 1.1 66.6 0.21 98.74 4.25 11.58

MEKONG CPWF| Optimising cascades of hydropower (MK3) Exploring environmental flows in the Lower Se San River Basin
9
3 TH E G EOMORP H OLOGY AN D HABITATS OF TH E SESAN
3 . 1 T H E 3 S R I V E R S
3 . 1 . 1 C a t c h m e n t a r e a a n d s t r e a m l e n g t h The Sesan River is the middle of the 3S Rivers (Sekong, Sesan and Srepok) that together make up one of the most important tributaries of the Mekong River system. The Sesan is one of the most significant tributaries of the Mekong. With a catchment area of 18,888 km
2, it is the eighth largest of the
tributaries2, excluding the Delta, as shown in Table 3-1 and Figure 3-1. It is the smallest of the three
rivers of the 3S Rivers, which together cover a total of 78,645 km2 3
.
Table 3-1: Catchment areas and stream order lengths of the largest tributaries of the Mekong
The Sesan arises in the Kon Tum massif in the Central Highlands of Vietnam, flows through Kon Tum and Gia Lai provinces into Cambodia and discharges into the Mekong near Stung Treng, some 3,900 km from the source. All the different stream orders flow for a total of 2,785 km.
2The large tributaries are classified as those over 5,000 km
2.
3 Meynell, PJ (2012)
Catchment
area
Distance of
confluence
from the
source
Length of
all stream
orders
sq km km km
72 NAM MUN 70,574 KP 3,632 12,192
60 NAM CHI 49,133 KP *3,632 9,303
103 DELTA 48,235 D 4,313 5,467
86 SRE POK 30,942 KM *3,900 6,729
71 SE KONG 28,815 KM 3,901 4,932
1 NAM OU 26,033 NH 2,443 5,740
66 SE BANG HIENG 19,958 AMR 3,496 5,114
77 SE SAN 18,888 KM *3,900 2,785
24 NAM NGUM 16,906 NH 3,039 3,365
82 ST. SEN 16,360 NTS TS 3,182
83 ST.MONGKOL BOREY 14,966 NTS TS 3,171
29 NAM CADINH 14,822 AMR 3,173 2,981
42 NAM SONGKHRAM 13,123 KP 3,265 2,759
5 NAM MAE KOK 10,701 NH 2,115 1,833
59 SE BANG FAI 10,407 AMR 3,364 1,583
81 ST.SRENG 9,986 NTS TS 2,091
3 NAM THA 8,918 NH 2,203 1,029
87 SIEM BOK 8,851 NTS 2,258
91 ST.CHINIT 8,237 NTS TS 1,748
15 NAM KHAN 7,490 NH 2,467 1,454
16 NAM MAE ING 7,267 NH 2,176 1,682
74 SE DONE 7,229 AMR 3,677 2,249
101 ST.BARIBO 7,154 CM TS 2,192
6 NAM SUONG 6,578 NH 2,453 1,070
104 PREK THNOT 6,124 CM 4,285 1,740
98 ST.PURSAT 5,965 CM TS 1,597
102 PREK CHHLONG 5,957 VU 4,077 1,713
GRAND TOTAL LARGE TRIBUTARIES 479,616 91,962
GRAND TOTAL FOR LMB 624,654 120,333
Code No. Tributary Geological
zone
Code
Northern highlands NH
Annamite range AMR
Loei Petchuan Fold Belt LFB
Khorat Plateau KP
Bolevan Plateau BP
North Tonle Sap NTS
Kontum Massif KM
Cardamon mountains CM
Tonle Sap TS
Volcanic Uplands VU
Delta D

MEKONG CPWF| Optimising cascades of hydropower (MK3) Exploring environmental flows in the Lower Se San River Basin
10
Figure 3-1: Catchments of the Lower Mekong Basin
3 . 1 . 2 P h y s i c a l a n d e c o l o g i c a l c h a r a c t e r i s t i c s o f t h e 3 S R i v e r s
The 3S Rivers arise from volcanic geological formations in the Central Highlands of Vietnam. The longest river with the largest number of streams is the Srepok, followed by the Sekong and Sesan. All three rivers have a middle range of proportions of length, at stream orders 1 and 2, and the Sesan stands out as having a higher proportion of stream length, at stream orders 3 and 4. The Srepok is the more complex river with a higher proportion of length, at stream orders 5 and 6. The Sekong is the steepest river, especially for second order streams, followed by the Srepok and the Sesan. The Sekong mostly flows at levels over 1,500 metres above sea level and extends down to elevations less than 100 masl. The Sesan and Srepok have similar elevation profiles to each other.
Sekong
Sesan
Srepok

MEKONG CPWF| Optimising cascades of hydropower (MK3) Exploring environmental flows in the Lower Se San River Basin
11
Table 3-2: Physical characteristics of the 3S Rivers
The rivers pass through five different ecological zones4: high elevation moist broadleaf forests
(HEMBF), mid-elevation moist broadleaf forests (MEMBF), mid-elevation dry broadleaf forests (MEDBF), low elevation dry broadleaf forests (LEDBF) and a small amount of floodplain and wetland (FP). The distribution of these eco-zones throughout the Lower Mekong Basin is shown in Figure 3-2, with an inset showing greater detail for the 3S Rivers.
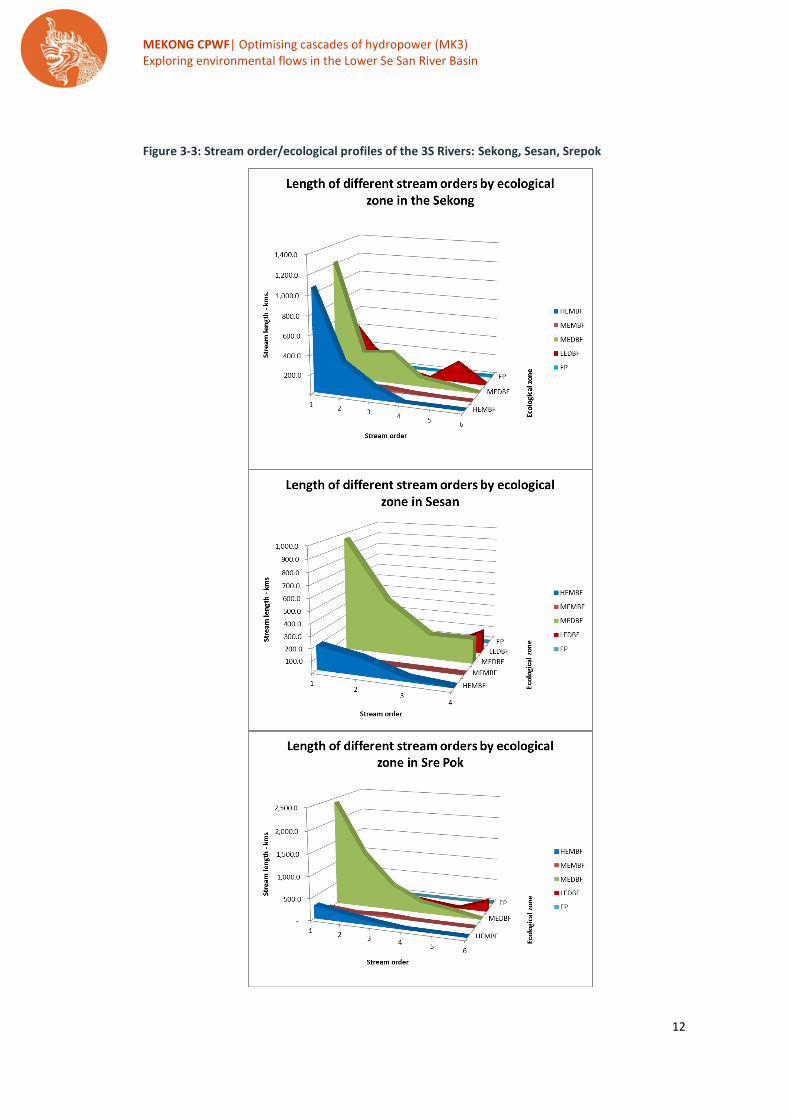
Figure 3-3 shows a comparison of the ecological profiles of the stream orders of each of the 3S Rivers. The Sesan flows through predominantly MEDBF, with a smaller amount of HEDBF, especially at lower stream orders. The Srepok also mainly flows through MEDBF, with a smaller amount of LEDBF at higher stream orders. In contrast, the Sekong has a more complex profile than the Sesan and Srepok, with significant proportions of its lower stream orders flowing through HEMBF, MEDBF and LEDBF.
Figure 3-2: Ecological zone classification for greater Mekong and for 3S rivers (Inset)
Source: Meynell, PJ (2012)
4 These ecological zones reflect the type of ecosystem that would naturally have been in the area
before human land use changes. They are based on factors such as soils, slope, elevation and rainfall.
Stream
density
Length number 1 & 2 3 & 4 5 & 61st order
streams
2nd order
streams<100 masl 100 masl 500 masl 1000 masl 1500 masl
sq km km number % % % % % km/sq km % % % % %
71 SE KONG 28,815 4,931.56 357 81.63 13.32 5.05 2.03 0.77 0.171 9.0 36.7 37.5 15.8 0.9
77 SE SAN 18,888 2,784.70 253 78.05 21.95 0.94 0.28 0.147 11.3 49.1 39.0 0.6
86 SRE POK 30,942 6,729.10 626 76.63 17.37 6.01 0.99 0.39 0.217 4.0 67.5 28.3 0.2
Code
Catchment
area Tributary
Total length and number
of all stream orders
Stream orders length as
% of total length Average slope Elevation - % lengths of tributary over
Sesan River
MEKONG CPWF| Optimising cascades of hydropower (MK3) Exploring environmental flows in the Lower Se San River Basin
12
Figure 3-3: Stream order/ecological profiles of the 3S Rivers: Sekong, Sesan, Srepok
MEKONG CPWF| Optimising cascades of hydropower (MK3) Exploring environmental flows in the Lower Se San River Basin
13
3 . 1 . 3 T h e 3 S R i v e r s c o m p a r e d t o M e k o n g t r i b u t a r i e s
Each of the 3S Rivers can be categorised among the 25 largest tributaries of the Mekong with a catchment area of more than 5,000 km
2. In an assessment of the ecological significance of the
Mekong, the 3S Rivers consistently featured amongst the group of large tributaries that contribute to ecological diversity, ecological uniqueness, productivity and degree of modification (Meynell P. , 2012).
The 3S Rivers are also the most significant of the Mekong’s tributaries in terms of ecosystem diversity and uniqueness. Table 3-3 shows the position of the 3S Rivers among other large tributaries of the Mekong with respect to various parameters of ecosystem diversity. The coloured blocks in each column indicate that the river is in the top 80
th percentile of the large tributaries.
Of the 3S Rivers, the Sekong is the most significant with the largest slope, highest elevation at source and greatest elevation range. It scores the highest on the ecological zone diversity index and has the greatest proportion of forested areas within the catchment. It also scores highly for fish species diversity and biodiversity interest (this is an index based upon the proportion of protected areas and key biodiversity areas in the catchment).
In contrast, the Sesan and Srepok score less highly on these parameters. The Sesan scores highly for the greatest proportion of natural wetlands in the catchment and the greatest proportion of migratory fish species and biodiversity interest. The Srepok has a high ecological zone diversity index, fish species diversity and biodiversity interest. compares the ecosystem uniqueness parameters for the large tributaries of the Mekong. Again, the 3S Rivers are among the highest scoring of the tributaries, with the Sesan scoring highly for having the most restricted ecological zones, the greatest proportion of natural wetlands and presence of important wetland areas. The Sesan also scores highly for the numbers of endangered fish and other species. Sekong and Srepok have profiles similar to each other, with a high proportion of important wetland areas, fish species diversity and numbers of endangered fish and other species.
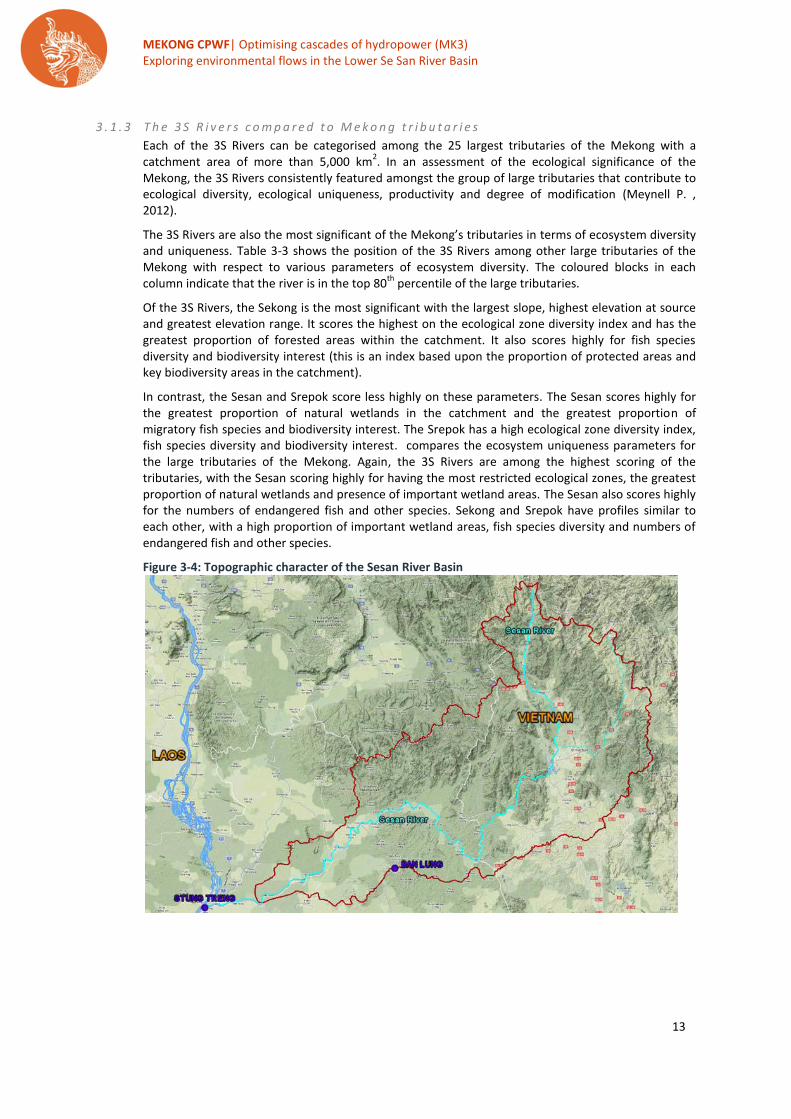
Figure 3-4: Topographic character of the Sesan River Basin

MEKONG CPWF| Optimising cascades of hydropower (MK3) Exploring environmental flows in the Lower Se San River Basin
14
Table 3-3: Parameters indicative of ecosystem diversity in large tributaries of the Mekong
Code TributarySize
category
Catchment
area
Stream
length
Geological
zone
Ph
ysic
al P
aram
ete
rs
Stre
am d
ensi
ty
Gre
ates
t Sl
op
e
Hig
hes
t el
evat
ion
of
sou
rce
Gre
ates
t El
evat
ion
ran
ge
Eco
logi
cal c
har
acte
r
Eco
logi
cal d
iver
sity
ind
ex
Hig
hes
t Fo
rest
ed a
reas
in c
atch
men
t
Gre
ates
t %
of
nat
ura
l wet
lan
ds
Bio
div
ers
ity
and
Fis
h
Fish
sp
ecie
s d
iver
sity
Mig
rato
ry f
ish
sp
ecie
s %
Bio
div
ersi
ty in
tere
st (
PA
s an
d K
BA
s)
sq km km
1 NAM OU 3 26,033 5,740 NH
3 NAM THA 3 8,918 1,029 NH
5 NAM MAE KOK 3 10,701 1,833 NH
6 NAM SUONG 3 6,578 1,070 NH
15 NAM KHAN 3 7,490 1,454 NH
16 NAM MAE ING 3 7,267 1,682 NH
24 NAM NGUM 3 16,906 3,365 NH
29 NAM CADINH 3 14,822 2,981 AMR
42 NAM SONGKHRAM 3 13,123 2,759 KP
59 SE BANG FAI 3 10,407 1,583 AMR
60 NAM CHI 3 49,133 9,303 KP
66 SE BANG HIENG 3 19,958 5,114 AMR
71 SE KONG 3 28,815 4,932 KM
72 NAM MUN 3 70,574 12,192 KP
74 SE DONE 3 7,229 2,249 AMR
77 SE SAN 3 18,888 2,785 KM
81 ST.SRENG 3 9,986 2,091 NTS
82 ST. SEN 3 16,360 3,182 NTS
83 ST.MONGKOL BOREY 3 14,966 3,171 NTS
86 SRE POK 3 30,942 6,729 KM
87 SIEM BOK 3 8,851 2,258 NTS
91 ST.CHINIT 3 8,237 1,748 NTS
98 ST.PURSAT 3 5,965 1,597 CM
101 ST.BARIBO 3 7,154 2,192 CM
102 PREK CHHLONG 3 5,957 1,713 VU
103 DELTA 3 48,235 5,467 D
104 PREK THNOT 3 6,124 1,740 CM

MEKONG CPWF| Optimising cascades of hydropower (MK3) Exploring environmental flows in the Lower Se San River Basin
15
Table 3-4: Parameters indicative of ecosystem uniqueness in large tributaries of the Mekong
3 . 2 S E S A N E C O S Y S T E M S A N D A S S O C I A T E D H A B I T A T S
3 . 2 . 1 S e s a n e c o - z o n e s The Sesan River flows through three main ecological zones, as detailed earlier: high elevation moist boadleaf forest, mid-elevation dry broadleaf forest and low elevation dry broadleaf forest. The distribution, by stream length, is shown in Table 3-5. The largest proportion occurs in mid-elevation dry broadleaf forests.
Figure 2-1 shows that most of this region is in Vietnam, while most of the low elevation dry broadleaf forest zone occurs in Cambodia. High elevation eco-zones occur entirely within the headwaters of the Sesan River in Vietnam. The important wetland/floodplain areas occur just below the confluence with the Srepok and are not recorded here.
Code TributarySize
category
Catchment
area
Stream
length
Geological
zone
Ph
ysic
al P
aram
ete
rs
Stre
am d
ensi
ty
Gre
ates
t Sl
op
e
Hig
hes
t el
evat
ion
of
sou
rce
Lim
ited
ele
vati
on
ran
ge
Ge
olo
gica
l ch
arac
ter
Gre
ates
t p
rop
ort
ion
of
Lim
esto
ne
Eco
logi
cal c
har
acte
r
Res
tric
ted
Eco
logi
cal z
on
e
Gre
ates
t %
of
nat
ura
l wet
lan
ds
Pre
sen
ce o
f im
po
rtan
t w
etla
nd
s
Bio
div
ers
ity
and
Fis
h
Fish
sp
ecie
s d
iver
sity
End
emic
sp
ecie
s %
End
ange
red
fis
h s
pec
ies
nu
mb
ers
End
ange
red
sp
ecie
s
sq km km
1 NAM OU 3 26,033 5,740 NH
3 NAM THA 3 8,918 1,029 NH
5 NAM MAE KOK 3 10,701 1,833 NH
6 NAM SUONG 3 6,578 1,070 NH
15 NAM KHAN 3 7,490 1,454 NH
16 NAM MAE ING 3 7,267 1,682 NH
24 NAM NGUM 3 16,906 3,365 NH
29 NAM CADINH 3 14,822 2,981 AMR
42 NAM SONGKHRAM 3 13,123 2,759 KP
59 SE BANG FAI 3 10,407 1,583 AMR
60 NAM CHI 3 49,133 9,303 KP
66 SE BANG HIENG 3 19,958 5,114 AMR
71 SE KONG 3 28,815 4,932 KM
72 NAM MUN 3 70,574 12,192 KP
74 SE DONE 3 7,229 2,249 AMR
77 SE SAN 3 18,888 2,785 KM
81 ST.SRENG 3 9,986 2,091 NTS
82 ST. SEN 3 16,360 3,182 NTS
83 ST.MONGKOL BOREY 3 14,966 3,171 NTS
86 SRE POK 3 30,942 6,729 KM
87 SIEM BOK 3 8,851 2,258 NTS
91 ST.CHINIT 3 8,237 1,748 NTS
98 ST.PURSAT 3 5,965 1,597 CM
101 ST.BARIBO 3 7,154 2,192 CM
102 PREK CHHLONG 3 5,957 1,713 VU
103 DELTA 3 48,235 5,467 D
104 PREK THNOT 3 6,124 1,740 CM
MEKONG CPWF| Optimising cascades of hydropower (MK3) Exploring environmental flows in the Lower Se San River Basin
16
Table 3-5. Distribution of stream orders of the Sesan in different ecological zones
Ecological zone Stream order, kms
% of length
1 2 3 4 Total
length
High Elevation, Moist Broadleaf Forest 204.2 141.0 27.1 372.3 13.4
Mid Elevation Dry Broadleaf Forest 956.5 455.1 199.8 202.8 1,814.2 65.1
Low Elevation Dry Broadleaf Forest 273.2 143.4 181.6 598.2 21.5
Total 1,433.9 739.6 226.9 384.4 2,784.8
3 . 2 . 2 G e o m o r p h o l o g i c a l c h a r a c t e r o f t h e S e s a n
Within these main eco-zones, a study looking into the geomorphological character and habitats of the Sesan and its importance for fish has identified the following distinct geomorphological zones of the river (Baran, 2012). The geomorphological zones are shown in Figure 3-5 through Figure 3-8. .
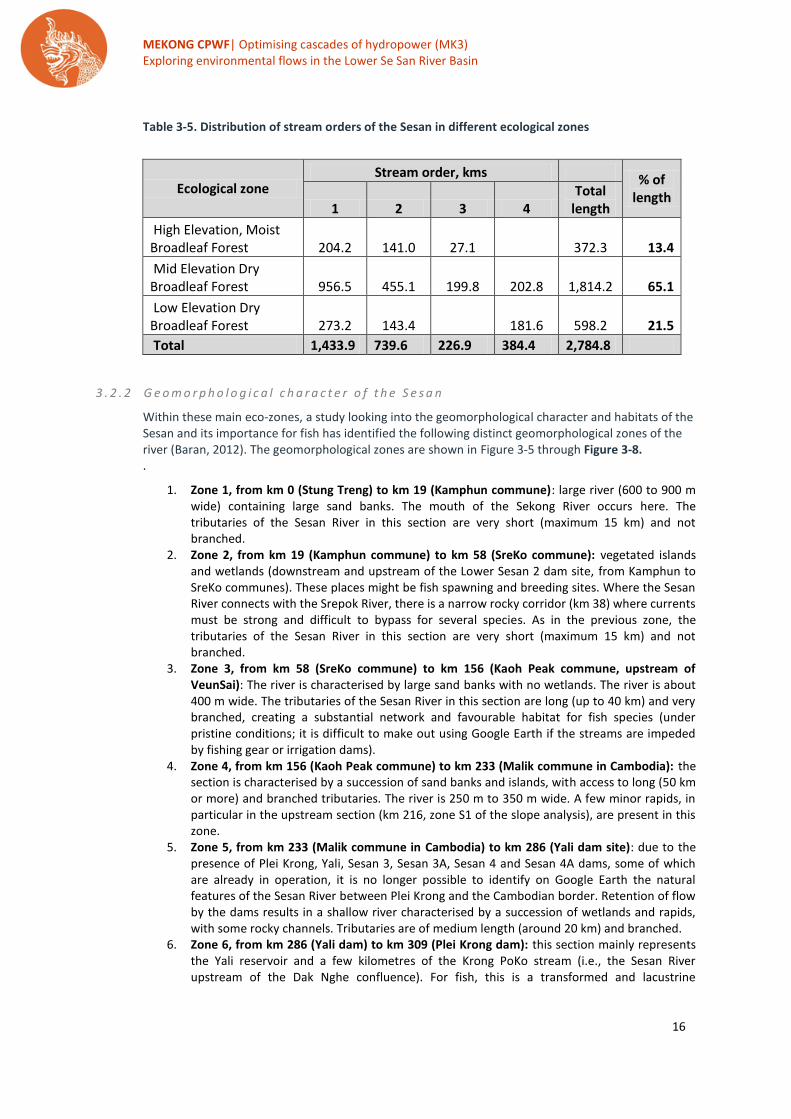
1. Zone 1, from km 0 (Stung Treng) to km 19 (Kamphun commune): large river (600 to 900 m wide) containing large sand banks. The mouth of the Sekong River occurs here. The tributaries of the Sesan River in this section are very short (maximum 15 km) and not branched.
2. Zone 2, from km 19 (Kamphun commune) to km 58 (SreKo commune): vegetated islands and wetlands (downstream and upstream of the Lower Sesan 2 dam site, from Kamphun to SreKo communes). These places might be fish spawning and breeding sites. Where the Sesan River connects with the Srepok River, there is a narrow rocky corridor (km 38) where currents must be strong and difficult to bypass for several species. As in the previous zone, the tributaries of the Sesan River in this section are very short (maximum 15 km) and not branched.
3. Zone 3, from km 58 (SreKo commune) to km 156 (Kaoh Peak commune, upstream of VeunSai): The river is characterised by large sand banks with no wetlands. The river is about 400 m wide. The tributaries of the Sesan River in this section are long (up to 40 km) and very branched, creating a substantial network and favourable habitat for fish species (under pristine conditions; it is difficult to make out using Google Earth if the streams are impeded by fishing gear or irrigation dams).
4. Zone 4, from km 156 (Kaoh Peak commune) to km 233 (Malik commune in Cambodia): the section is characterised by a succession of sand banks and islands, with access to long (50 km or more) and branched tributaries. The river is 250 m to 350 m wide. A few minor rapids, in particular in the upstream section (km 216, zone S1 of the slope analysis), are present in this zone.
5. Zone 5, from km 233 (Malik commune in Cambodia) to km 286 (Yali dam site): due to the presence of Plei Krong, Yali, Sesan 3, Sesan 3A, Sesan 4 and Sesan 4A dams, some of which are already in operation, it is no longer possible to identify on Google Earth the natural features of the Sesan River between Plei Krong and the Cambodian border. Retention of flow by the dams results in a shallow river characterised by a succession of wetlands and rapids, with some rocky channels. Tributaries are of medium length (around 20 km) and branched.
6. Zone 6, from km 286 (Yali dam) to km 309 (Plei Krong dam): this section mainly represents the Yali reservoir and a few kilometres of the Krong PoKo stream (i.e., the Sesan River upstream of the Dak Nghe confluence). For fish, this is a transformed and lacustrine
MEKONG CPWF| Optimising cascades of hydropower (MK3) Exploring environmental flows in the Lower Se San River Basin
17
environment, subject to large-scale variability. Migrations are restricted to the river upstream of the Dak Nghe River, as much as the numerous local irrigation dams allow.
7. Zone 7, from km 309 (Plei Krong dam) to km 361 (NgokTu commune): this section is relatively narrow (50 m to 100 m width) and is characterised by a succession of wetlands, sand banks and rocky channels. The size of the river and the abundance of wetlands make this zone favourable for fish.
8. Zone 8, from km 361 (NgokTu commune) to km 420 (TT. DakGlei commune): the river becomes very narrow (around 20 m width) and is a meandering mountain stream. The river contains a diversity of habitats (wetlands, streams, rocky channels, and sand banks), although the image resolution on Google Earth does not allow one to distinguish them precisely. There might be rapids between km 361 and km 372.
Figure 3-5: Google Earth image of Sesan River in Stung Treng Province, Cambodia, showing the geomorphological character of the river
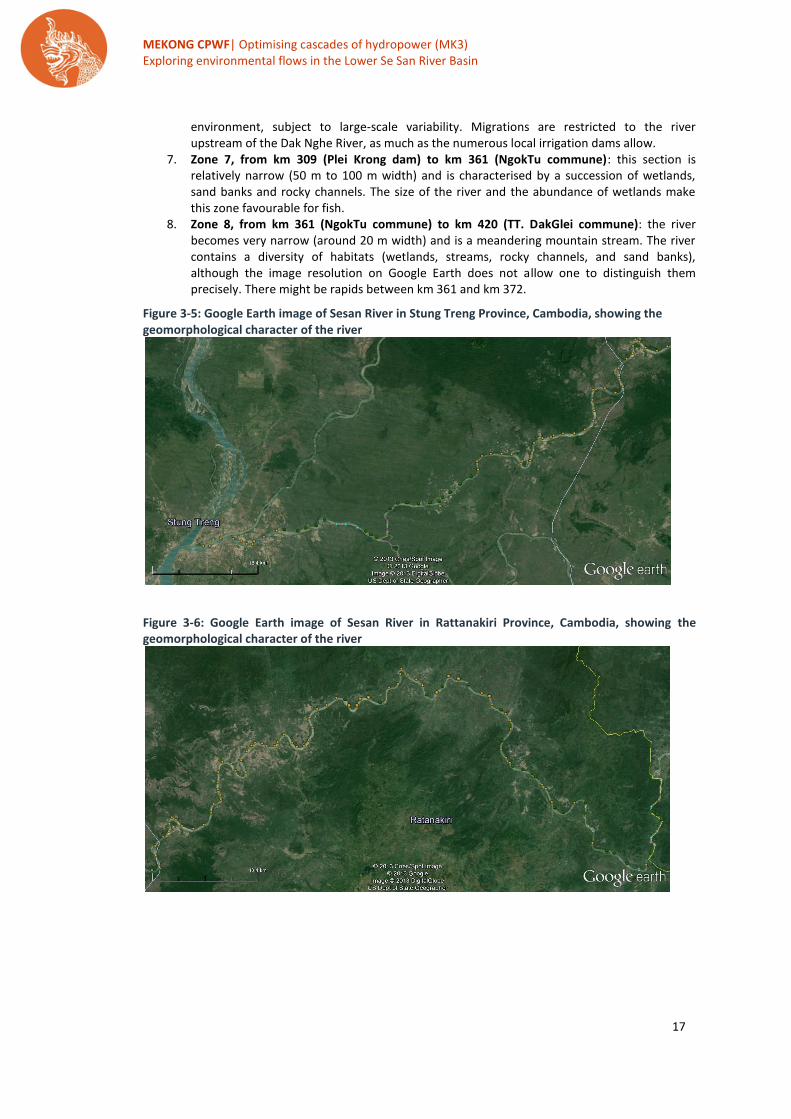
Figure 3-6: Google Earth image of Sesan River in Rattanakiri Province, Cambodia, showing the geomorphological character of the river
MEKONG CPWF| Optimising cascades of hydropower (MK3) Exploring environmental flows in the Lower Se San River Basin
18
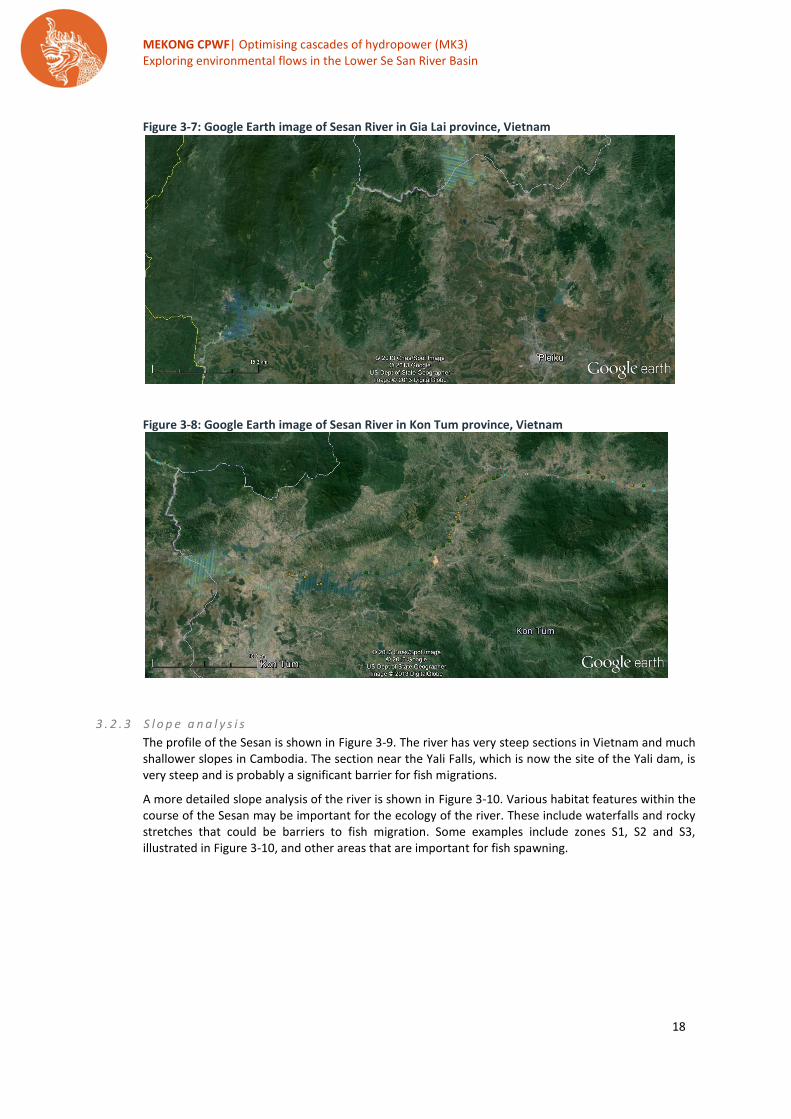
Figure 3-7: Google Earth image of Sesan River in Gia Lai province, Vietnam
Figure 3-8: Google Earth image of Sesan River in Kon Tum province, Vietnam
3 . 2 . 3 S l o p e a n a l y s i s
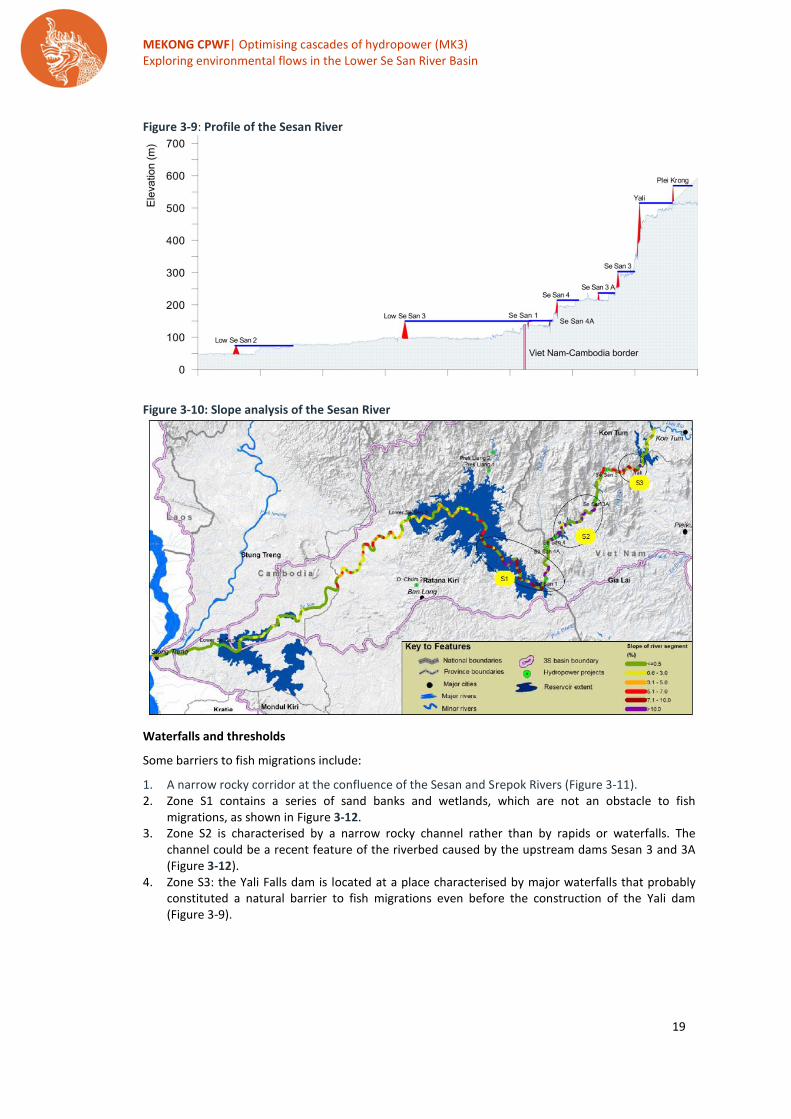
The profile of the Sesan is shown in Figure 3-9. The river has very steep sections in Vietnam and much shallower slopes in Cambodia. The section near the Yali Falls, which is now the site of the Yali dam, is very steep and is probably a significant barrier for fish migrations.
A more detailed slope analysis of the river is shown in Figure 3-10. Various habitat features within the course of the Sesan may be important for the ecology of the river. These include waterfalls and rocky stretches that could be barriers to fish migration. Some examples include zones S1, S2 and S3, illustrated in Figure 3-10, and other areas that are important for fish spawning.
MEKONG CPWF| Optimising cascades of hydropower (MK3) Exploring environmental flows in the Lower Se San River Basin
19
Figure 3-9: Profile of the Sesan River
Figure 3-10: Slope analysis of the Sesan River
Waterfalls and thresholds
Some barriers to fish migrations include:
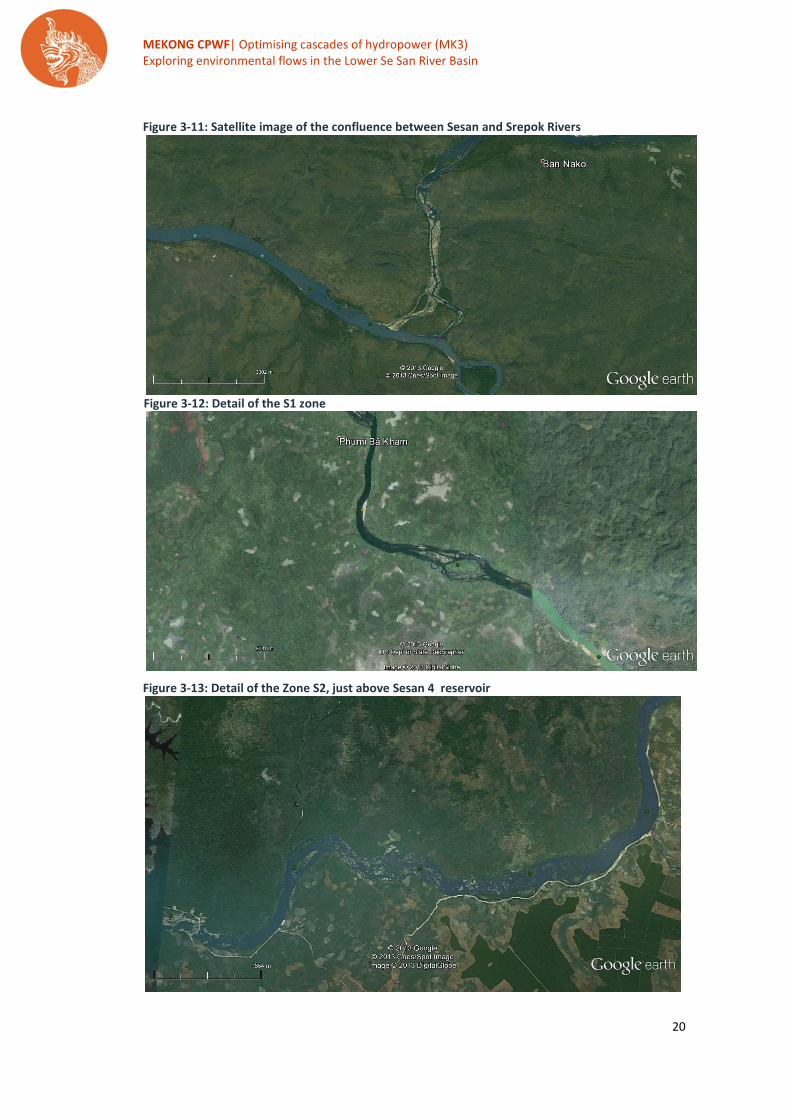
1. A narrow rocky corridor at the confluence of the Sesan and Srepok Rivers (Figure 3-11). 2. Zone S1 contains a series of sand banks and wetlands, which are not an obstacle to fish
migrations, as shown in Figure 3-12. 3. Zone S2 is characterised by a narrow rocky channel rather than by rapids or waterfalls. The
channel could be a recent feature of the riverbed caused by the upstream dams Sesan 3 and 3A (Figure 3-12).
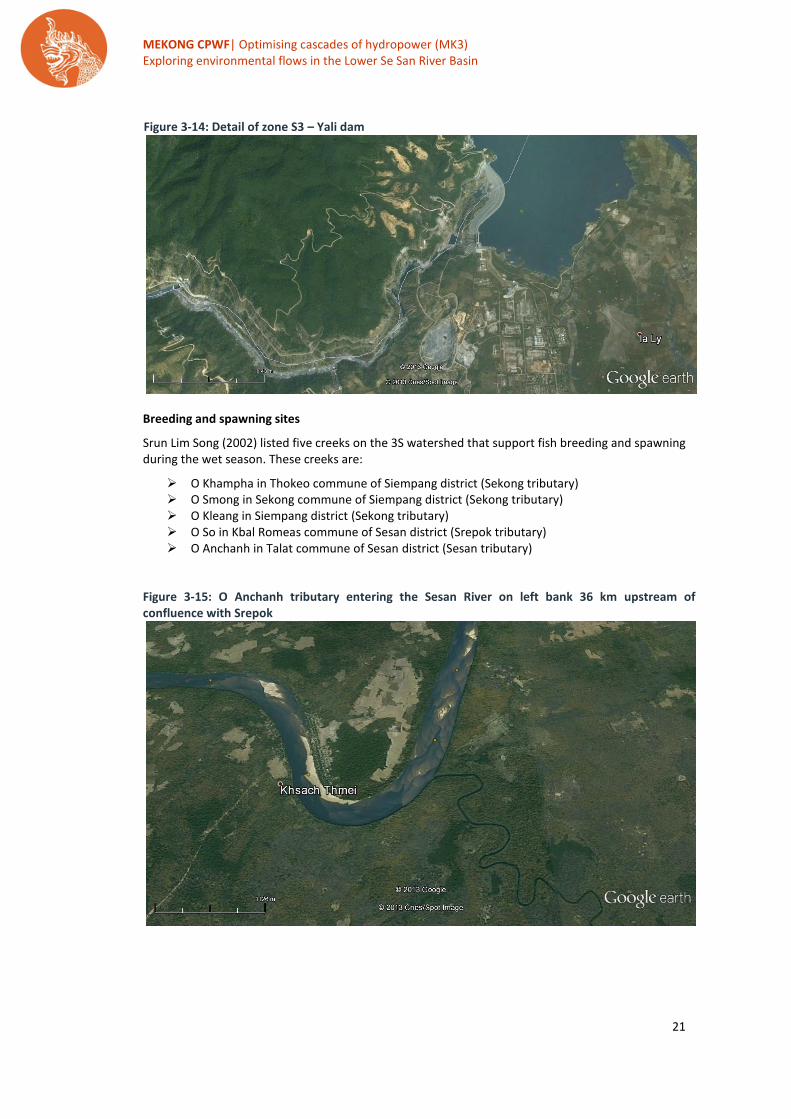
4. Zone S3: the Yali Falls dam is located at a place characterised by major waterfalls that probably constituted a natural barrier to fish migrations even before the construction of the Yali dam (Figure 3-9).
MEKONG CPWF| Optimising cascades of hydropower (MK3) Exploring environmental flows in the Lower Se San River Basin
20
Figure 3-11: Satellite image of the confluence between Sesan and Srepok Rivers
Figure 3-12: Detail of the S1 zone
Figure 3-13: Detail of the Zone S2, just above Sesan 4 reservoir
MEKONG CPWF| Optimising cascades of hydropower (MK3) Exploring environmental flows in the Lower Se San River Basin
21
Figure 3-14: Detail of zone S3 – Yali dam
Breeding and spawning sites
Srun Lim Song (2002) listed five creeks on the 3S watershed that support fish breeding and spawning during the wet season. These creeks are:
O Khampha in Thokeo commune of Siempang district (Sekong tributary) O Smong in Sekong commune of Siempang district (Sekong tributary) O Kleang in Siempang district (Sekong tributary) O So in Kbal Romeas commune of Sesan district (Srepok tributary) O Anchanh in Talat commune of Sesan district (Sesan tributary)
Figure 3-15: O Anchanh tributary entering the Sesan River on left bank 36 km upstream of confluence with Srepok

MEKONG CPWF| Optimising cascades of hydropower (MK3) Exploring environmental flows in the Lower Se San River Basin
22
3 . 2 . 4 I d e n t i f y i n g r e p r e s e n t a t i v e r e a c h e s f o r e - f l o w a s s e s s m e n t
The Sesan can be divided into two parts: the Upper Sesan in Vietnam and the Lower Sesan in Cambodia. The Upper Sesan has already been extensively modified with six large hydropower projects in cascade and an additional one under construction at the headwaters. The stretches of regulated but flowing water in the river sections between consecutive reservoirs vary between 3.5 km and 24 km, as shown in Table 3-6. The largest length of free flowing but regulated river is on the Dak Bla tributary, between the Upper Kon Tum dam and the headwaters of the Yali reservoir, and extends 112 km. Excluding the reservoirs of Plei Krong and Upper Kon Tum, about 22 percent of the Sesan in Vietnam is covered by the reservoirs.
In Cambodia, the Lower Sesan River consists of 257 km of free flowing water, with flows regulated by the Vietnamese dams. If Lower Sesan 2 and 3 dams get built, there would be about 5 km of free flowing but regulated river between Sesan 1 dam and the head of the Lower Sesan 3 dam. There would be about 90 km of regulated flows between Lower Sesan 3 and the head of the Lower Sesan 2 dam. About 45 percent of the Sesan in Cambodia would be covered by the reservoirs (see Table 3-6).
Table 3-6: Lengths of flowing river between the dams on the Upper and Lower Sesan
Reach From To Length Flowing
but regulated
Min. flows
Reservoir
km km km km
Plei Krong reservoir head
Plei Krong dam 30 30
12 Plei Krong dam Yali reservoir head 5.8 5.8
Upper Kon Tum reservoir
Upper Kon Tum dam
11 Upper Kon Tum Yali reservoir head 112 112
10 Yali reservoir head Yali dam 16 16
9 Yali dam Sesan 3 dam 16 3.5 5.5 7
8 Sesan 3 dam Sesan 3A dam 18 4.8 13.2
7 Sesan 3A dam Sesan 4 dam 32 24 8
6 Sesan 4 dam Sesan 4A dam 5.7 5.7
5 Sesan 4 dam
Cambodia border (Sesan 1)
19.6 19.6
Length of Sesan in Vietnam (Upper Sesan) 255.1 169.7 5.5 79.9
4 Cambodia Border Proposed Lower Sesan 3
72.6 5.2 57.4
3 Lower Sesan 3 Proposed Lower Sesan 2
150 90 60
2 Lower Sesan 2 Confluence with Sekong
26.3 26.3
1 Confluence with Sekong Confluence with Mekong
7.8 7.8
Length of Sesan in Cambodia (Lower Sesan) 256.7 129.3 117.4
Total Sesan 511.8 299 5.5 197.3
It is clear from the above figures that the lengths of flowing rivers in the Upper Sesan are very limited and heavily influenced by the flows released by the dams. Due to this modification, a preliminary analysis of environmental flows in the Upper Sesan would not be fruitful.
The Lower Sesan is as yet unmodified and represents at least 257 km of free flowing stretches regulated by Sesan 4A, which is a regulating dam that is meant to balance out peak discharges from the Vietnamese dams. For this study on environmental flows, we will be considering only the Lower Sesan in Cambodia.
MEKONG CPWF| Optimising cascades of hydropower (MK3) Exploring environmental flows in the Lower Se San River Basin
23
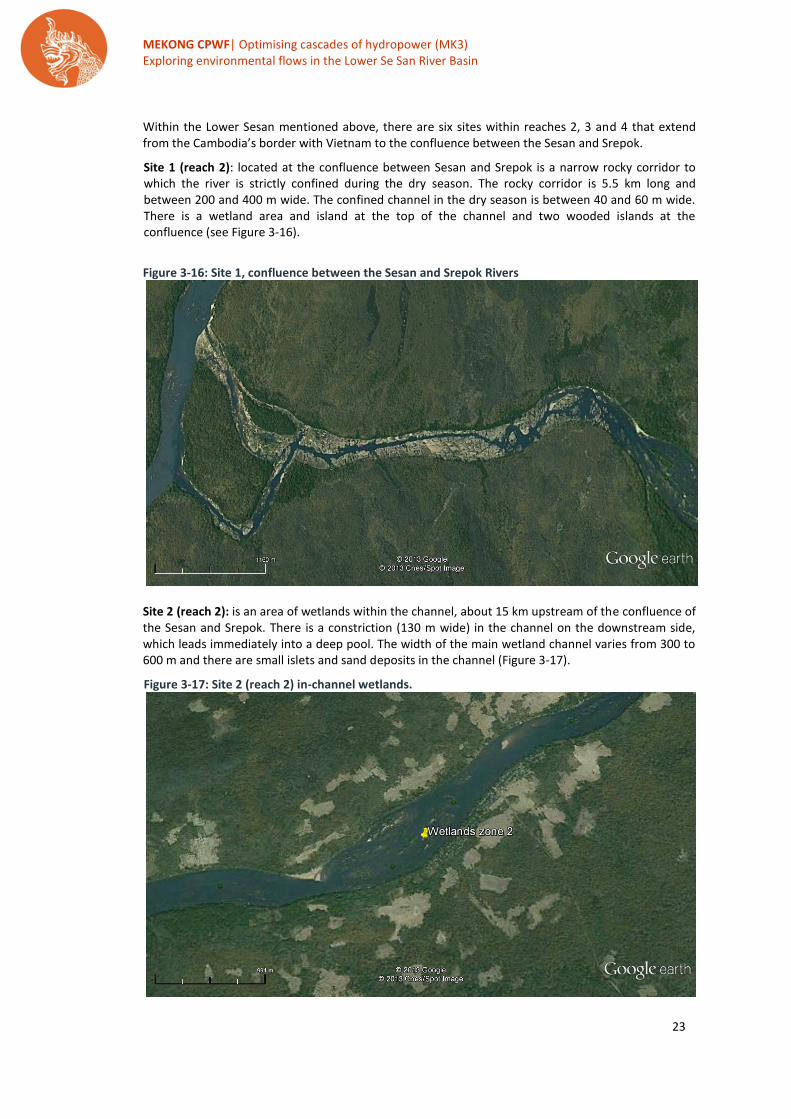
Within the Lower Sesan mentioned above, there are six sites within reaches 2, 3 and 4 that extend from the Cambodia’s border with Vietnam to the confluence between the Sesan and Srepok.
Site 1 (reach 2): located at the confluence between Sesan and Srepok is a narrow rocky corridor to which the river is strictly confined during the dry season. The rocky corridor is 5.5 km long and between 200 and 400 m wide. The confined channel in the dry season is between 40 and 60 m wide. There is a wetland area and island at the top of the channel and two wooded islands at the confluence (see Figure 3-16).
Figure 3-16: Site 1, confluence between the Sesan and Srepok Rivers
Site 2 (reach 2): is an area of wetlands within the channel, about 15 km upstream of the confluence of the Sesan and Srepok. There is a constriction (130 m wide) in the channel on the downstream side, which leads immediately into a deep pool. The width of the main wetland channel varies from 300 to 600 m and there are small islets and sand deposits in the channel (Figure 3-17).
Figure 3-17: Site 2 (reach 2) in-channel wetlands.
MEKONG CPWF| Optimising cascades of hydropower (MK3) Exploring environmental flows in the Lower Se San River Basin
24
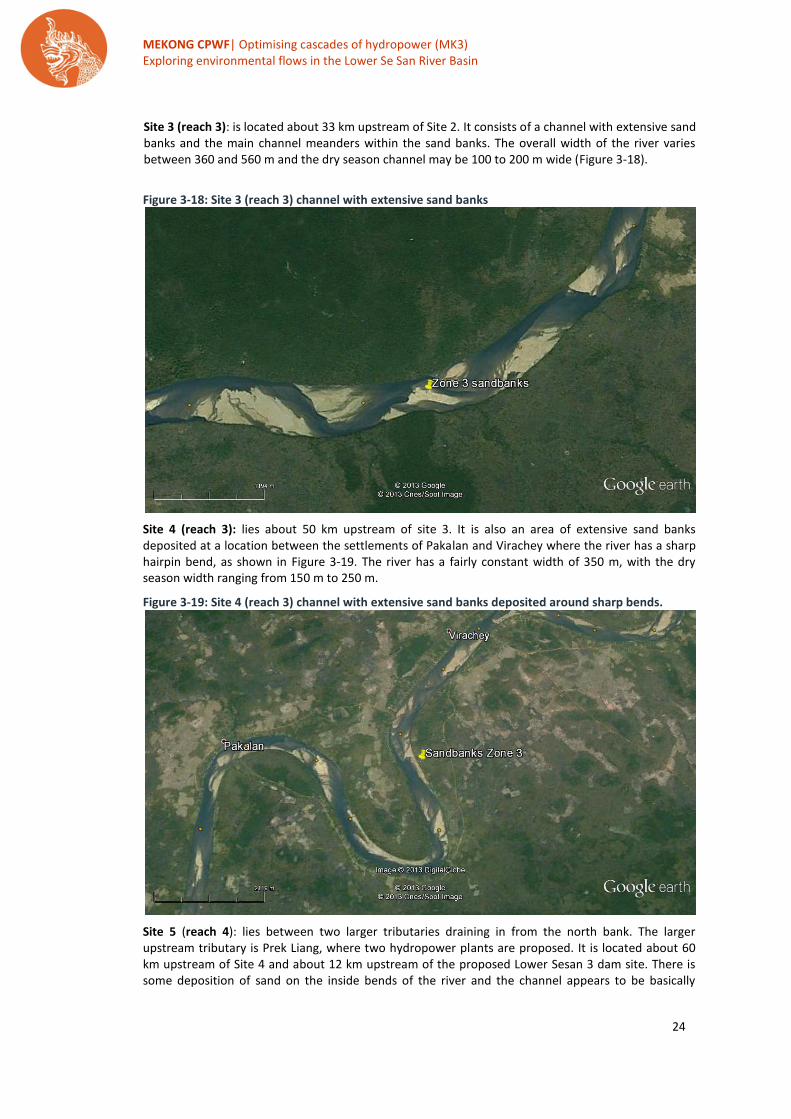
Site 3 (reach 3): is located about 33 km upstream of Site 2. It consists of a channel with extensive sand banks and the main channel meanders within the sand banks. The overall width of the river varies between 360 and 560 m and the dry season channel may be 100 to 200 m wide (Figure 3-18).
Figure 3-18: Site 3 (reach 3) channel with extensive sand banks
Site 4 (reach 3): lies about 50 km upstream of site 3. It is also an area of extensive sand banks deposited at a location between the settlements of Pakalan and Virachey where the river has a sharp hairpin bend, as shown in Figure 3-19. The river has a fairly constant width of 350 m, with the dry season width ranging from 150 m to 250 m.
Figure 3-19: Site 4 (reach 3) channel with extensive sand banks deposited around sharp bends.
Site 5 (reach 4): lies between two larger tributaries draining in from the north bank. The larger upstream tributary is Prek Liang, where two hydropower plants are proposed. It is located about 60 km upstream of Site 4 and about 12 km upstream of the proposed Lower Sesan 3 dam site. There is some deposition of sand on the inside bends of the river and the channel appears to be basically

MEKONG CPWF| Optimising cascades of hydropower (MK3) Exploring environmental flows in the Lower Se San River Basin
25
sandy. The width of the river in this area between the two tributaries varies between 150 m to 300 m (Figure 3-20).
Figure 3-20: Site 5 (Reach 4), Depositing river channel between two larger tributaries
Site 6 (reach 4): lies about 24 km upstream of site 5 and consists of a stretch of river with in-channel wetlands, rocks and riffles (Figure 3-21). The channel width ranges from 220 m immediately before the wetland area to about 240 m downstream of the area. The in-channel wetland area is 400 m wide. Figure 3-21: Site 6 (reach 4) in-channel wetlands, rocks and riffles
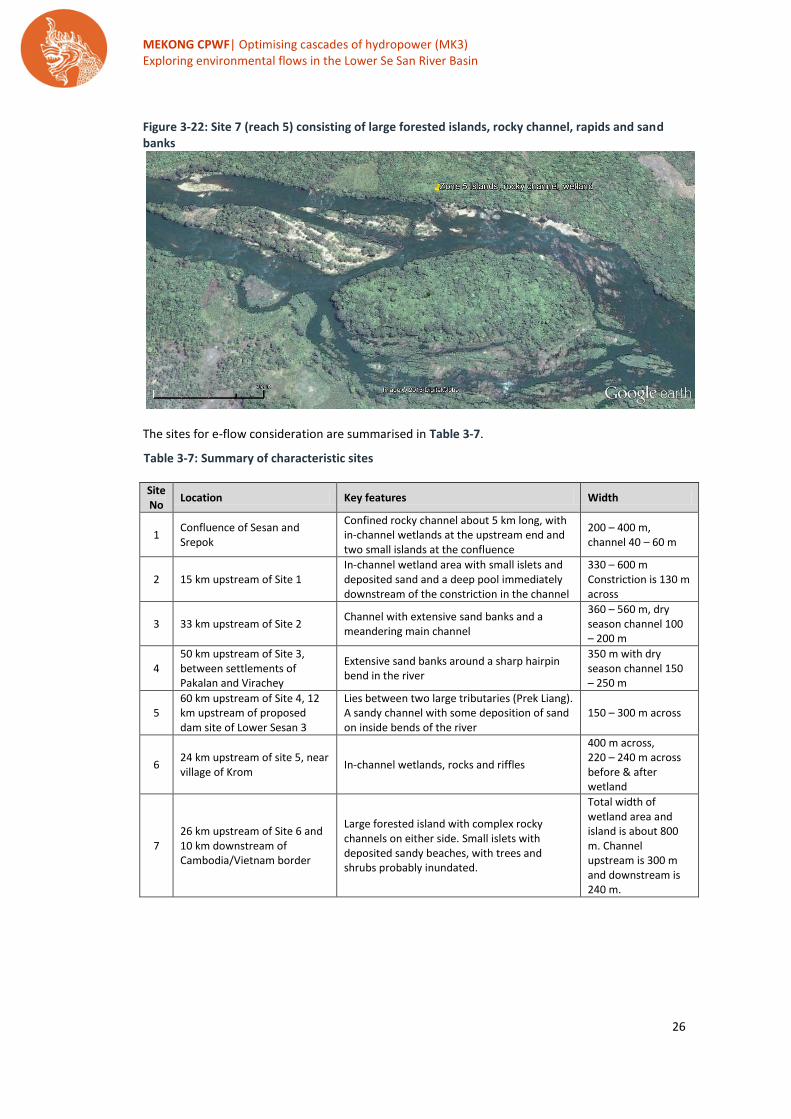
Site 7 (reach 5): located on the Cambodian side of reach 5, site 7 is about 26 km upstream from site 6. It consists of a large forested island located closer to the left bank of the river. Complex rocky channels and rapids surround the island. There are a number of other islets, some with deposited sandy beaches. The islets have trees and shrubs growing on them and are likely to be inundated at high flows.
MEKONG CPWF| Optimising cascades of hydropower (MK3) Exploring environmental flows in the Lower Se San River Basin
26
Figure 3-22: Site 7 (reach 5) consisting of large forested islands, rocky channel, rapids and sand banks
The sites for e-flow consideration are summarised in Table 3-7.
Table 3-7: Summary of characteristic sites Site No
Location Key features Width
1 Confluence of Sesan and Srepok
Confined rocky channel about 5 km long, with in-channel wetlands at the upstream end and two small islands at the confluence
200 – 400 m, channel 40 – 60 m
2 15 km upstream of Site 1 In-channel wetland area with small islets and deposited sand and a deep pool immediately downstream of the constriction in the channel
330 – 600 m Constriction is 130 m across
3 33 km upstream of Site 2 Channel with extensive sand banks and a meandering main channel
360 – 560 m, dry season channel 100 – 200 m
4 50 km upstream of Site 3, between settlements of Pakalan and Virachey
Extensive sand banks around a sharp hairpin bend in the river
350 m with dry season channel 150 – 250 m
5 60 km upstream of Site 4, 12 km upstream of proposed dam site of Lower Sesan 3
Lies between two large tributaries (Prek Liang). A sandy channel with some deposition of sand on inside bends of the river
150 – 300 m across
6 24 km upstream of site 5, near village of Krom
In-channel wetlands, rocks and riffles
400 m across, 220 – 240 m across before & after wetland
7 26 km upstream of Site 6 and 10 km downstream of Cambodia/Vietnam border
Large forested island with complex rocky channels on either side. Small islets with deposited sandy beaches, with trees and shrubs probably inundated.
Total width of wetland area and island is about 800 m. Channel upstream is 300 m and downstream is 240 m.
MEKONG CPWF| Optimising cascades of hydropower (MK3) Exploring environmental flows in the Lower Se San River Basin
27
4 FLOW CH ARACTERIST ICS OF TH E SESAN
In this chapter, the flow characteristics of Lower Sesan River have been analysed for the lower part of the catchment (Cambodian side). The analyses were performed using measured and simulated discharge data from the mainstream of the Sesan River. The measured discharge data was obtained from the Mekong River Commission hydrological database (MRC, 2011) and the simulated data was obtained using a validated distributed hydrological model, VMod. The modelling methodology is explained in detail in Räsänen et al. (2012).
The data and results presented in this report are the best available information on the hydrology of the Sesan. However, the results should be interpreted with care as the data used in the analyses and to drive and validate the hydrological model was not comprehensive and suffered quality problems. Visual observation of the hydrological time series (Annex A) reveals possible non-stationary and quality problems with the data. The early part of the time series appears to be smoother than the latter part, suggesting changes in flow measurement frequency. Measurements taken early in the process may not have captured short-lived high flow events. The hydrological model was calibrated mainly at Ban Kamphun, which is below the confluence of the Sesan and Srepok and therefore, the accuracy of the model in replicating the magnitude of peak floods in the Sesan is not perfect; the model tended to underestimate them. Thus, the data and derived results must be interpreted with caution even though they are the best available approximations of the actual river flows of the Sesan.
4 . 1 G E N E R A L D E S C R I P T I O N O F S E S A N H Y D R O L O G Y
Two climate phenomena are the key drivers of Sesan Basin hydrology: the Southwest monsoon occurs during the summer when temperature differences between land and the Indian Ocean force moisture-laden air to precipitate over the basin’s mountains. Secondly, storms from the East Sea meet the Truong San Range at landfall and become tropical depressions as they cross the range, dropping large amounts of rainfall across vast swathes of land. The combination of these events divides the calendar into wet and dry periods.
The pattern of Sesan hydrology approximates that of the Mekong River, with a dry season from December to April/May and a wet season running from May to November. The hydrograph exhibits a leading peak in June before the second and larger peak in August/September (Figure 4-2). Lowest flows generally occur in March.
4 . 2 M E A S U R E D D A T A
The measured daily discharge data from Voeun Sai (see location in Figure 2-1) for the period 1986 to 2005 is shown in Annex A. The time series reveals the influence of upstream hydropower operations on the flow regime. The Yali dam in Vietnam started operation in 2001. Between 2001 and 2005, the dam caused more high frequency variations in the flow regime during dry seasons.
4 . 3 S I M U L A T E D D A T A
4 . 3 . 1 F l o w c o n t r i b u t i o n o f d i f f e r e n t r i v e r s e g m e n t s o f t h e S e s a n The simulated daily flow data was extracted from nine locations (Figure 4-1). The sites were selected such that they form river segments that capture the contributions of the major tributaries. The most upstream site is the Sesan 1 dam site and it represents the flow contribution of the Upper Sesan catchment (i.e., the Vietnamese part of the catchment).
The flow of the Lower Sesan is highly sensitive to changes in flow of the upper catchment. The comparison of daily flow at each site (Figure 4-2) shows that majority (66 percent) of the annual flow in the Lower Sesan originates from the upper part the catchment. Seasonal comparison reveals that during the dry season, 72.4 percent of the flow originates from the upper part the catchment. During

MEKONG CPWF| Optimising cascades of hydropower (MK3) Exploring environmental flows in the Lower Se San River Basin
28
the wet season, 64.8 percent of the flow originates from there. And in April, 79 percent of the flow originates from the upper part the catchment.
On the Lower Sesan catchment, there is only one large tributary that contributes significantly to the flow of the Sesan. That tributary, Prek Liang, enters the Sesan just upstream of Andaung Meas (Figure 4-1). The segment contributes 16 percent to the annual flow of the Sesan. It contributes 9 percent during the dry season and 18 percent during the wet season.
Figure 4-1 The flow sites from distributed hydrological model VMod (modeling details are shown in Räsänen et al. (2012))
Figure 4-2 Simulated natural average daily flow from nine sites
0
2000
4000
6000
8000
10000
12000
14000
16000
1-J
an
16
-Jan
31
-Jan
15
-…
1-M
ar
16
-…
31
-…
15
-…
30
-…
15
-…
30
-…
14
-…
29
-…
14
-Ju
l
29
-Ju
l
13
-…
28
-…
12
-…
27
-…
12
-…
27
-…
11
-…
26
-…
11
-…
26
-…
Dai
ly f
low
[m
3/s
]
TS5
TS4
TS3
Voeun Sai
Lower Sesan 3
A
MEKONG CPWF| Optimising cascades of hydropower (MK3) Exploring environmental flows in the Lower Se San River Basin
29
5 MOD IF ICATION OF FLOW REGIME BY V IETNAM D AMS
The following section analyses the modification of the Lower Sesan flow by the dams in the upper catchment. The large dams operating on the Upper Sesan in Vietnam have been outlined in Chapter 2. The combined active storage of the reservoirs on the Upper Sesan is 2,129.2 million m
3 for a reservoir
area of 197.7 km2, which means the degree of regulation of existing dams is 11.24 percent. Flows
from nearly 50 percent of the Sesan River basin are effectively regulated.
The designed flow of the Sesan 4A dam is specified as 469 m3/sec, compared to the mean annual flow
in the river at that point of 330 m3/sec before it passes into Cambodia. This is an increase of 142
percent over the original mean flow. Sesan 4A is intended as a regulating dam, that is, it has little daily fluctuation. However, discussions with villagers downstream of the border indicate that there may still be considerable daily fluctuation, with water level changes of up to 1 m over a single day.
5 . 1 F L O W H E A L T H I N D I C A T O R S
5 . 1 . 1 T h e F l o w H e a l t h S o f t w a r e
The Flow Health software was developed by the International Water Centre to assist in the assessment, design and management of river flow regimes. Its main function is to provide indicator scores for hydrology in river health assessments. It is used as a tool to assist in environmental flow assessments (Gippel et al, 2012).
The Flow Health software performs a purely hydrological analysis to calculate indicators of flow health. The indicators used in the program characterise attributes of the flow regime in terms of the main ecologically relevant flow components. These are necessarily general and direct links between the hydrological indicators and ecological impacts are not defined within the program. Linking the flow indicators to particular risks for the downstream ecosystems is open to interpretation by the user.
The software calculates nine sub-indicators and accumulates them into an annual Flow Health Index for a reference period that represents the river in a natural flow state. The indicators for a test period are then calculated and compared to the reference indicators. The indicator score ranges from zero to one, with a higher score indicating a flow regime closer to the reference period. The nine sub-indicators used by the software are outlined in Table 5-1, along with a description of the key flow conditions for healthy ecosystems on the Sesan, that is, the flow “events” that trigger responses in aquatic organisms and maintain habitats.
Table 5-1. Flow Health Indicators and their relevance for ecosystems in the Sesan
Flow
condition
sub-indicator
Description Key flow condition for healthy ecosystems?
High Flow
(HF)
Sum of monthly flows in natural
high flow period
Yes. During high flows, water levels rise above low
flow levels but do not overflow the channel banks
(e.g., following extreme rainfall events). These flows
are important for flushing of pools, nutrient
transport and may trigger breeding and migration.
Low Flow (LF) Sum of monthly flows in the
natural low flow period
Yes. Determines the amount and characteristics of
aquatic habitat that is available for most of the year.

MEKONG CPWF| Optimising cascades of hydropower (MK3) Exploring environmental flows in the Lower Se San River Basin
30
Flow
condition
sub-indicator
Description Key flow condition for healthy ecosystems?
Highest
Monthly (HM) Highest monthly flow in the year Not a key indicator for the Sesan
Lowest
Monthly (LM) Lowest monthly flow in the year Not a key indicator for the Sesan
Persistently
Higher (PH)
Measure of how many sequential
months in the natural low flow
season were higher than expected
Yes. During persistently higher flows, water levels
rise above low flow levels but do not overflow the
channel banks. Important for flushing of pools,
nutrient transport and may support breeding and
migration.
Persistently
Lower (PL)
Measure of how many sequential
months were lower than expected Not a key indicator for the Sesan
Persistently
Very Low (PVL
Measure of how many sequential
months were much lower than
expected
Yes. During persistently very low flows, deep pools
are important as fish refuges. May allow natives to
outcompete generalist invasive species that are not
adapted to extreme low flows. Also necessary for
floodplain plants.
Seasonality
Flow Shift
(SFS)
Measure of the degree to which
the seasonality of the monthly
flows has been altered (detects
shifting of the months of high and
low flow to other times of the
year)
Yes. Timing of the seasons is an important breeding
and migration trigger.
Flood Flow
Interval (FFI)
Measure of the time interval
between the last significant flood
month (intended to detect reduced
flood frequency)
Yes. Ecologically important for a wide range of
reasons including spawning and breeding,
food/nutrient enrichment and genetic diversity.
5 . 1 . 2 A s s e s s m e n t o f t h e i m p a c t o f t h e Y a l i F a l l s d a m
Analysis of the impact of dams on the flow regime of the Sesan focused on six key flow conditions that are important for downstream healthy ecosystems (Figure 5-1 a, b and c). Measured flow data from three stations on the Sesan located in Cambodia – Andaung Meas in geomorphological Zone 3, Voeun Sai in geomorphological Zone 2 and Ban Kamphun in geomorphological Zone 1 (see Figure 2-1 for locations) – were analysed for a baseline reference period before the construction of the Yali Falls dam (1985-1996) and compared to the period since construction began (1997 – 2005). All three sites are located downstream of the Yali Falls dam and show a similar pattern of impacts on the natural flow regime. The impact lessens slightly further downstream of the dam (Figure 5-1). However, these results should be viewed with caution, as there could be variations in flow due to dam impacts and the poor data quality of some measurements.
At all three sites, there is a slight reduction in the flood flow interval for some or all years during the period 1995 to 2000. This sub-indicator is a measure of flood frequency. The result may be due to the
MEKONG CPWF| Optimising cascades of hydropower (MK3) Exploring environmental flows in the Lower Se San River Basin
31
filling of the Yali dam during this period. Since the dam became operational in 2001, the flood flow interval has been similar to the pre-dam construction period. The time series analysed only extends to the end of 2004, but it is likely that the construction of dams in 2006 to 2009, 2011 and 2012 had similar impacts on the flood flow interval.
Since construction of the Yali Falls dam began, there has been a clear decrease in the seasonality flow shifts sub-indicator at all sites. Closer analysis of the time series shows that the month with the lowest flow has shifted to March from April, and occasionally to February. The highest flow month is has also occurred earlier, in August, rather than in September. The change in seasonality is important because it can disrupt the natural timing of flow pulses and base flows that stimulate the behavior of aquatic organisms whose life cycle has adapted to a particular seasonal flow pattern (Gippel et al, 2012).
Construction of the Yali Falls dam has not affected the persistently very low flow sub-indicator. This indicator is a measure of how many sequential months experienced much lower flow than during the reference period. No change in the sub-indicator is evidence that the construction of the dam has not increased the periods of very low flow (i.e., the flow is less than or equal to the 1
st percentile flow in
the reference series).
At all three sites, the persistently higher sub-indicator has shown a marked decrease since the sealing of the Yali Falls dam in 1996. This is particularly noticeable for the years 2000 to 2001 where the indicator dropped to almost zero at all sites. The sub-indicator reflects the period of time when the flow is persistently (i.e., for two or more consecutive months) notably higher than expected in the low flow period (i.e., exceeding the 75
th percentile of the reference period). The sharp decrease in the
sub-indicator since the sealing of the Yali Falls dam indicates a smoothing out of the low flows by the removal of natural high flow pulses that are regulated by the dam.
Analysis of the low flow sub-indicator at all three sites shows a slight decrease since the sealing of Yali Falls dam in 1996. This is evidence of a slight decrease in flow volumes during the low flow period. Decreasing low flow volumes is significant as it determines the amount and characteristics of aquatic habitat that is available throughout the year. An anomaly in the data is noted for 1988 where the low flow sub-indicator drops to zero, indicating a very dry year.
The high flow sub-indicator is largely unaffected by the construction of the Yali Falls dam. This indicates that construction of the dam has not impacted the high flow volumes downstream. Two exceptions were in 1988 and 1998 when the sub-indicator dropped to zero at all three sites. This may indicate that both years were naturally dry with little rainfall. If this were the case then, in 1998, the dry conditions would have been further exacerbated by the new Yali Falls dam, which would have further restricted the flow downstream. Since 1998, the high flow sub-indicator has returned to 1, indicating high flows similar to the reference period.

MEKONG CPWF| Optimising cascades of hydropower (MK3) Exploring environmental flows in the Lower Se San River Basin
32
Figure 5-1. Flow health sub-indicator scores for measured flows at a) Voeun Sai, b) AndaungMeas and c) Ban Kamphun
0
1
2
3
4
5
6
19
86
19
87
19
88
19
89
19
90
19
91
19
92
19
93
19
94
19
95
19
96
19
97
19
98
19
99
20
00
20
01
20
02
20
03
20
04
Sub
-in
dic
ato
r sc
ore
s
Year
Flood flow interval (FFI)
Seasonality flow shift (SFS)
Persistently very low (PVL)
Persistently higher (PH)
Low flow (LF)
High flow (HF)
0
1
2
3
4
5
6
1986
1987
1988
1989
1990
1991
1992
1993
1994
1995
1996
1997
1998
19
99
20
00
20
01
20
02
20
03
20
04
20
05
2006
Sub
-in
dic
ato
r sc
ore
s
Year
Flood flow interval (FFI)
Seasonality flow shift (SFS)
Persistently very low (PVL)
Persistently higher (PH)
Low flow (LF)
High flow (HF)
0
1
2
3
4
5
6
19
86
19
87
19
88
19
89
19
90
19
91
19
92
19
93
19
94
19
95
19
96
19
97
19
98
19
99
20
00
20
01
20
02
20
03
20
04
Sub
-in
dic
ato
r sc
ore
s
Year
Flood flow interval (FFI)
Seasonality flow shift (SFS)
Persistently very low (PVL)
Persistently higher (PH)
Low flow (LF)
High flow (HF)
a)
Reference period Test period
Yali Falls dam fully operational Sealing of Yali Falls dam
b) Voeun Sai
Sealing of Yali Falls dam Yali Falls dam fully operational
c) Ban Kamphun Sealing of Yali Falls dam Yali Falls dam fully operational
MEKONG CPWF| Optimising cascades of hydropower (MK3) Exploring environmental flows in the Lower Se San River Basin
33
5 . 2 C O M P A R I N G N O R E G U L A T I O N A N D F U L L R E G U L A T I O N S C E N A R I O S
The 11 existing and planned hydropower projects on the Sesan catchment were simulated using a
combination of distributed hydrological model VMod and dynamic programming tool CSUDP (see full
description of methodology in Räsänen et al. (2012)). The goal was to quantify the decrease in
hydropower generation caused by the requirement to maintain natural flow regimes of the river. The
simulations were performed for the period 2002 to 2006 with a weekly time step. The locations of the
eleven simulated hydropower projects are shown in Figure 2-1 and their technical characteristics are
shown in Table 2-1.
The 11 projects were simulated using two scenarios:
i. Full regulation: In the “A. Full regulation” scenario, the simulation allowed each project to
use freely the full storage capacity of reservoirs in order to maximise energy production.
ii. No regulation: In the “B. No regulation” scenario, the reservoir levels of all projects were
kept constant at the full supply level so that the natural flow regime was passed through the
dam unaltered. In scenario B simulations, each hydropower project was allowed to use only 3
million m3 of reservoir storage to improve the stability of the simulation/optimisation
process.
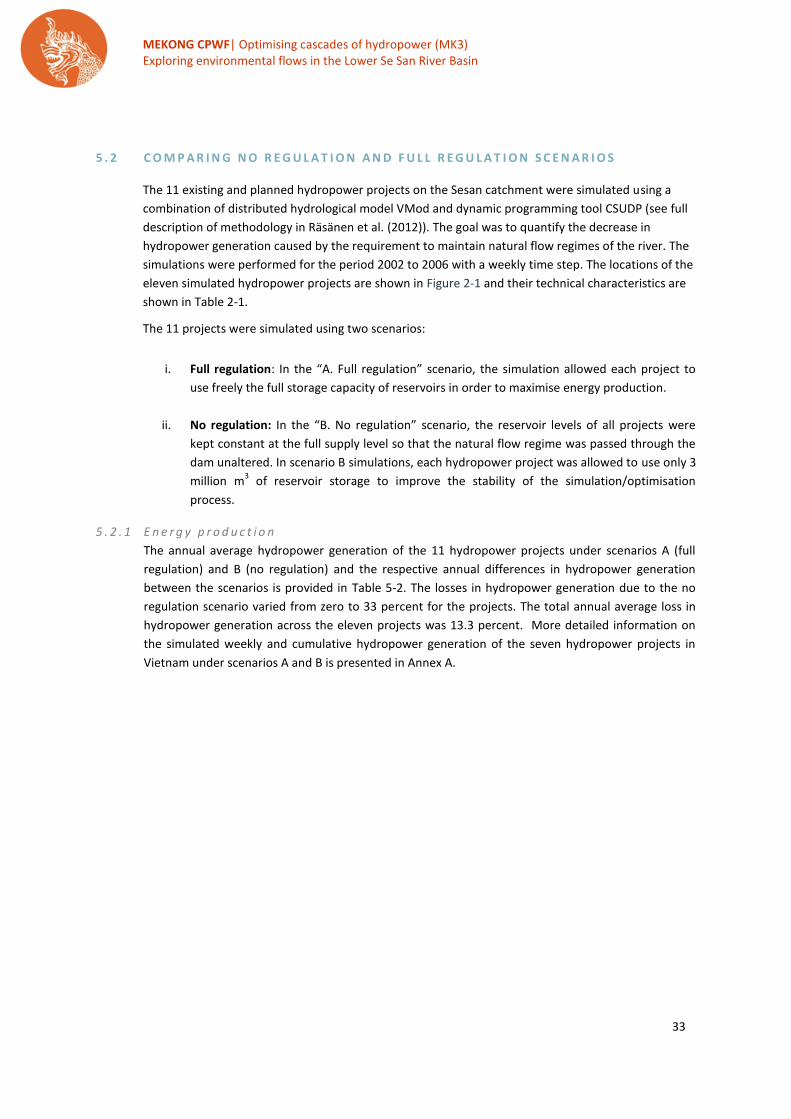
5 . 2 . 1 E n e r g y p r o d u c t i o n
The annual average hydropower generation of the 11 hydropower projects under scenarios A (full
regulation) and B (no regulation) and the respective annual differences in hydropower generation
between the scenarios is provided in Table 5-2. The losses in hydropower generation due to the no
regulation scenario varied from zero to 33 percent for the projects. The total annual average loss in
hydropower generation across the eleven projects was 13.3 percent. More detailed information on
the simulated weekly and cumulative hydropower generation of the seven hydropower projects in
Vietnam under scenarios A and B is presented in Annex A.
MEKONG CPWF| Optimising cascades of hydropower (MK3) Exploring environmental flows in the Lower Se San River Basin
34
Table 5-2. Simulated annual average hydropower generation of 11 hydropower projects: with full use of reservoir storage (full regulation) and without the use of reservoir storage (no regulation), and the corresponding reduction in hydropower generation for the period 2002 to 2006. In the simulation without the use of reservoir storage, the reservoir levels were kept at the full supply level.
Full regulation No regulation Reduction
[GWh] [GWh] [%]
Upper Kon Tum 998 820 17.9
Plei Krong 470 473 -0.6
Yali 3721 3202 14.0
Sesan 3 1184 1011 14.7
Sesan 3A 439 374 14.6
Sesan 4 1425 1304 8.5
Sesan 1 638 512 19.8
VIETNAM TOTAL 8875 7695 13.3
Prek Liang 2 238 166 30.2
Prek Liang 1 313 211 32.6
Lower Sesan 3 1626 1323 18.6
Lower Sesan 2 2196 2086 5.0
CAMBODIA TOTAL 4373 3786 13.4
TOTAL OF 11 PROJECTS 13248 11481 13.3
5 . 2 . 2 F l o w H e a l t h I n d i c a t o r s - S c e n a r i o A ( f u l l r e g u l a t i o n )
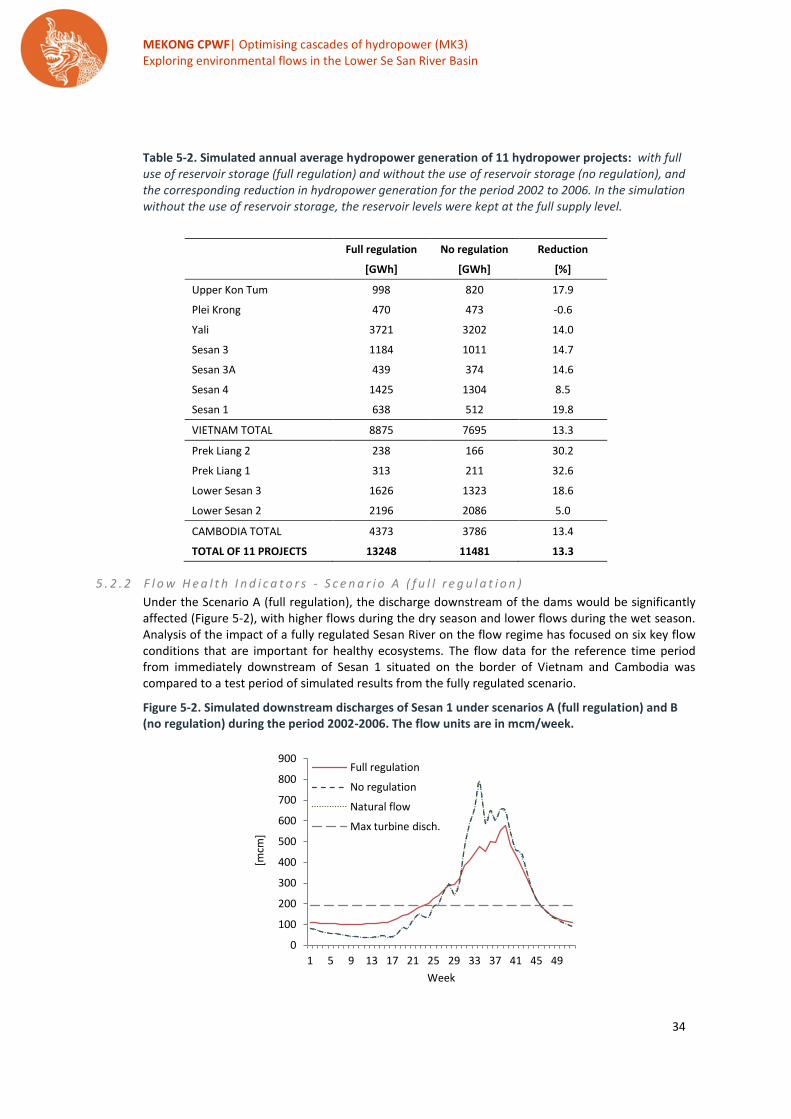
Under the Scenario A (full regulation), the discharge downstream of the dams would be significantly affected (Figure 5-2), with higher flows during the dry season and lower flows during the wet season. Analysis of the impact of a fully regulated Sesan River on the flow regime has focused on six key flow conditions that are important for healthy ecosystems. The flow data for the reference time period from immediately downstream of Sesan 1 situated on the border of Vietnam and Cambodia was compared to a test period of simulated results from the fully regulated scenario.
Figure 5-2. Simulated downstream discharges of Sesan 1 under scenarios A (full regulation) and B (no regulation) during the period 2002-2006. The flow units are in mcm/week.
0
100
200
300
400
500
600
700
800
900
1 5 9 13 17 21 25 29 33 37 41 45 49
[m
cm]
Week
Full regulation
No regulation
Natural flow
Max turbine disch.
MEKONG CPWF| Optimising cascades of hydropower (MK3) Exploring environmental flows in the Lower Se San River Basin
35
The flood flow interval sub-indicator, a measure of the period of time between floods, decreases under the impact of a fully regulated Sesan River. This indicates that the flood frequency decreases due to regulation of water by the dams. The flood flow interval steadily decreases from the start of the test period, indicating that major floods may not ever occur if the system is fully regulated. Reduced flood frequency may mean that events where the river overflow the banks and inundates floodplain wetlands will occur less often, which would severely impact the floodplain ecosystem health.
The seasonality flow shift sub-indicator does not exhibit any major changes for most years under the fully regulated scenario. In the 13
th year, the sub-indicator drops to zero but it also drops to zero in
two years during the reference period. Closer analysis of the time series shows that the low seasonality flow shift score in year 13 is due to a lower than normal flow in October and December and a much higher than normal flow in March. The low scores during the two reference years are due to similar deviations in the seasonal flow regime. This may mean that the zero score in the 13
th year is
due to strong inter-annual variability in flows rather than due to dam regulation.
Under fully regulated conditions, there are no major changes to the persistently very low sub-indicator. This result indicates that a fully regulated system would not increase the periods of very low flow (i.e., less than or equal to the 1
st percentile flow in the reference period).
There is a sharp decrease in the persistently higher sub-indicator under fully regulated conditions. This result indicates that there will be an increase in the amount of time when the flow is persistently (for two or more consecutive months) notably higher than the in the low flow period (i.e., exceeding the 75th percentile of flow in the low flow period). The increase in flow volume during the low flow period is likely because water stored during prior high flow periods got released.
The low flow sub-indicator shows a slight decrease under the fully regulated scenario. The score indicates a slight increase or decrease in flow volumes during low flow periods. It is evident from the daily discharge hydrograph located below Sesan 1 (Figure 5-3) that there is an increase in the low flow volumes.
Under the fully regulated scenario, the high flow sub-indicator remains unchanged except for one
year (year 13) when it drops sharply to zero. It returns to one the following year. This corresponds to
a drop in other high flow related sub-indicators and likely means that this year was an extreme dry
year. Closer analysis of the annual flow volumes showed that annual flow in this year is 3,000 m3 less
than the average for all other years combined. The unchanged high flow scores for the rest of the test
period indicates that the volume of flow during high flow periods will not change, except in extremely
dry years.

MEKONG CPWF| Optimising cascades of hydropower (MK3) Exploring environmental flows in the Lower Se San River Basin
36
Figure 5-3. Flow health sub-indicator scores for modeled full regulation scenario flows downstream of Sesan 1
5 . 2 . 3 F l o w H e a l t h I n d i c a t o r s - S c e n a r i o B ( n o r e g u l a t i o n )
Under Scenario B (no regulation), the discharge downstream of the dams is not affected compared to
the natural flow regime, that is, the flow regime without dams (Figure 5-2). Therefore, the flow health
indicators will not show any change from the natural regime and it can be assumed that there will be
limited impacts on the downstream ecosystems.
0
1
2
3
4
5
6
1 2 3 4 5 6 7 8 9 10 11 12 13 14 15
Sub
-in
dic
ato
r sc
ore
s
Flood flow interval (FFI)
Seasonality flow shift (SFS)
Persistently very low (PVL)
Persistently higher (PH)
Low flow (LF)
High flow (HF)
Reference period Test period
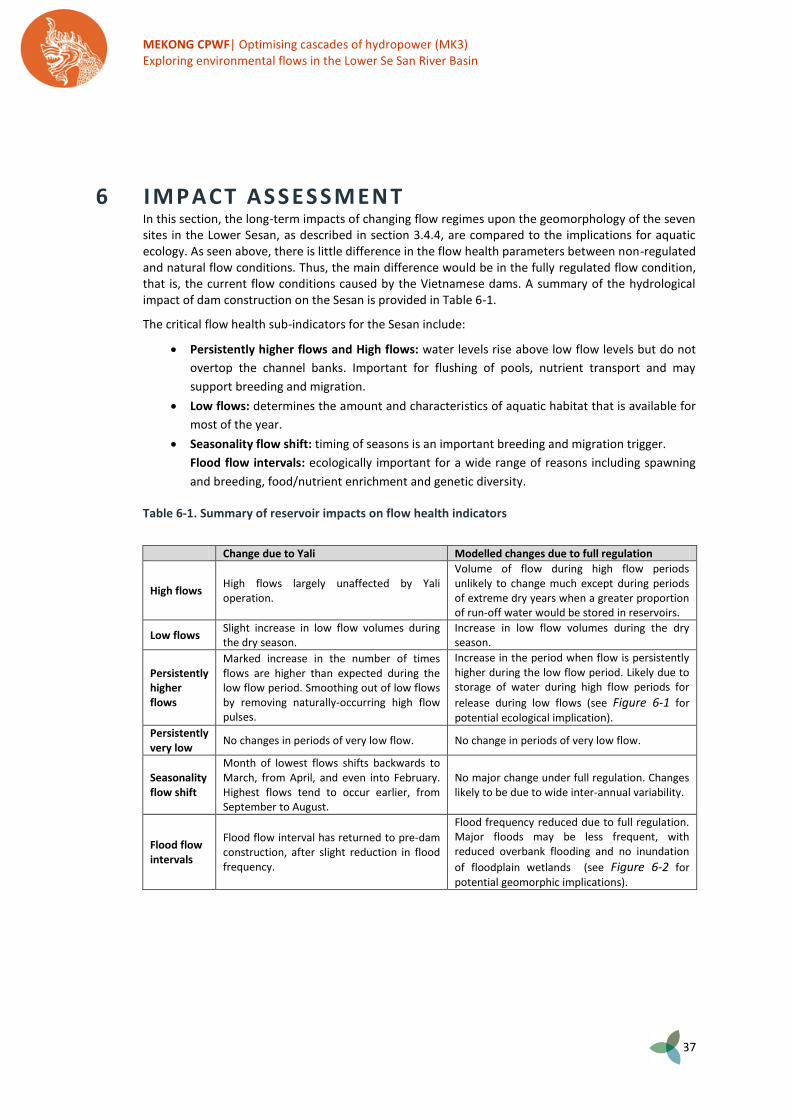
MEKONG CPWF| Optimising cascades of hydropower (MK3) Exploring environmental flows in the Lower Se San River Basin
37
6 IMP ACT ASSESSMENT In this section, the long-term impacts of changing flow regimes upon the geomorphology of the seven sites in the Lower Sesan, as described in section 3.4.4, are compared to the implications for aquatic ecology. As seen above, there is little difference in the flow health parameters between non-regulated and natural flow conditions. Thus, the main difference would be in the fully regulated flow condition, that is, the current flow conditions caused by the Vietnamese dams. A summary of the hydrological impact of dam construction on the Sesan is provided in Table 6-1.
The critical flow health sub-indicators for the Sesan include:
Persistently higher flows and High flows: water levels rise above low flow levels but do not
overtop the channel banks. Important for flushing of pools, nutrient transport and may
support breeding and migration.
Low flows: determines the amount and characteristics of aquatic habitat that is available for
most of the year.
Seasonality flow shift: timing of seasons is an important breeding and migration trigger.
Flood flow intervals: ecologically important for a wide range of reasons including spawning
and breeding, food/nutrient enrichment and genetic diversity.
Table 6-1. Summary of reservoir impacts on flow health indicators
Change due to Yali Modelled changes due to full regulation
High flows High flows largely unaffected by Yali operation.
Volume of flow during high flow periods unlikely to change much except during periods of extreme dry years when a greater proportion of run-off water would be stored in reservoirs.
Low flows Slight increase in low flow volumes during the dry season.
Increase in low flow volumes during the dry season.
Persistently higher flows
Marked increase in the number of times flows are higher than expected during the low flow period. Smoothing out of low flows by removing naturally-occurring high flow pulses.
Increase in the period when flow is persistently higher during the low flow period. Likely due to storage of water during high flow periods for
release during low flows (see Figure 6-1 for potential ecological implication).
Persistently very low
No changes in periods of very low flow. No change in periods of very low flow.
Seasonality flow shift
Month of lowest flows shifts backwards to March, from April, and even into February. Highest flows tend to occur earlier, from September to August.
No major change under full regulation. Changes likely to be due to wide inter-annual variability.
Flood flow intervals
Flood flow interval has returned to pre-dam construction, after slight reduction in flood frequency.
Flood frequency reduced due to full regulation. Major floods may be less frequent, with reduced overbank flooding and no inundation
of floodplain wetlands (see Figure 6-2 for potential geomorphic implications).

MEKONG CPWF| Optimising cascades of hydropower (MK3) Exploring environmental flows in the Lower Se San River Basin
38
6 . 1 G E O M O R P H O L O G I C A L C H A N G E S
The implications of these flow changes are discussed for each of the characteristic sites.
6 . 1 . 1 S i t e 1
The confluence of Sesan and Srepok is a confined rocky channel about 5 km long, with in-channel
wetlands at the upstream end and two small islands at the confluence. The wet season channel is 200
m to 400 m wide, with a permanent (dry season) channel 40 to 60 m wide (Figure 3-16). The
increased dry season flows would fill the permanent dry season channel to a greater extent, and may
cause a shift in the balance of flows between left and right channels at the confluence. That is, more
water would flow out of the right channel during the dry season. There would be little change in the
rock-confined channel since erosion of the rock is a very slow process, and erosive processes during
periods of high flows are reduced. With major flood events reduced under full regulation, there may
be a tendency for deeper areas within the rock channel to silt up and not be flushed out on an annual
basis. The wetland areas at the top end of the site would be more permanently inundated due to
higher low flows and water levels, and this may decrease the size and extent of the in-channel
wetlands.
6 . 1 . 2 S i t e 2
This in-channel wetland area has small islets, deposited sand and a deep pool immediately
downstream of a constriction in the channel. It is located 15 km upstream of Site 1. The overall width
of the channel is 330 m to 600 m across, with a 130 m wide constriction (Figure 3-17). The higher
water levels during the low flow period would mean that the in-channel wetlands are seasonally
exposed and their extent would likely shrink (Figure 6-1). The shrubs that live in these areas require
seasonal exposure for survival, and so this habitat would become smaller. These in-channel wetlands
are likely to be the most productive habitats providing both spawning sites and feeding grounds for
fish and other aquatic animals. With lower floods, the tendency for flushing of sand deposited at the
end of the dry season is likely to be reduced, leading to a gradual elevation of the river bed and
possible silting up of the deep pool downstream of the constriction in the channel.
Figure 6-1 Higher water levels during the low flow period may impact semi-aquatic vegetation due to changes in the pattern of flooding of in-channel wetlands
6 . 1 . 3 S i t e 3
The site, located 33 km upstream of Site 2, has extensive sand banks and a meandering main channel
between 360 m to 560 m wide and a dry season channel of 100 m to 200 m (Figure 3-18). The sand
banks are the most dynamic geomorphological feature of the river, with the sand moving
downstream during the wet season and the sand banks reforming in similar places depending on the
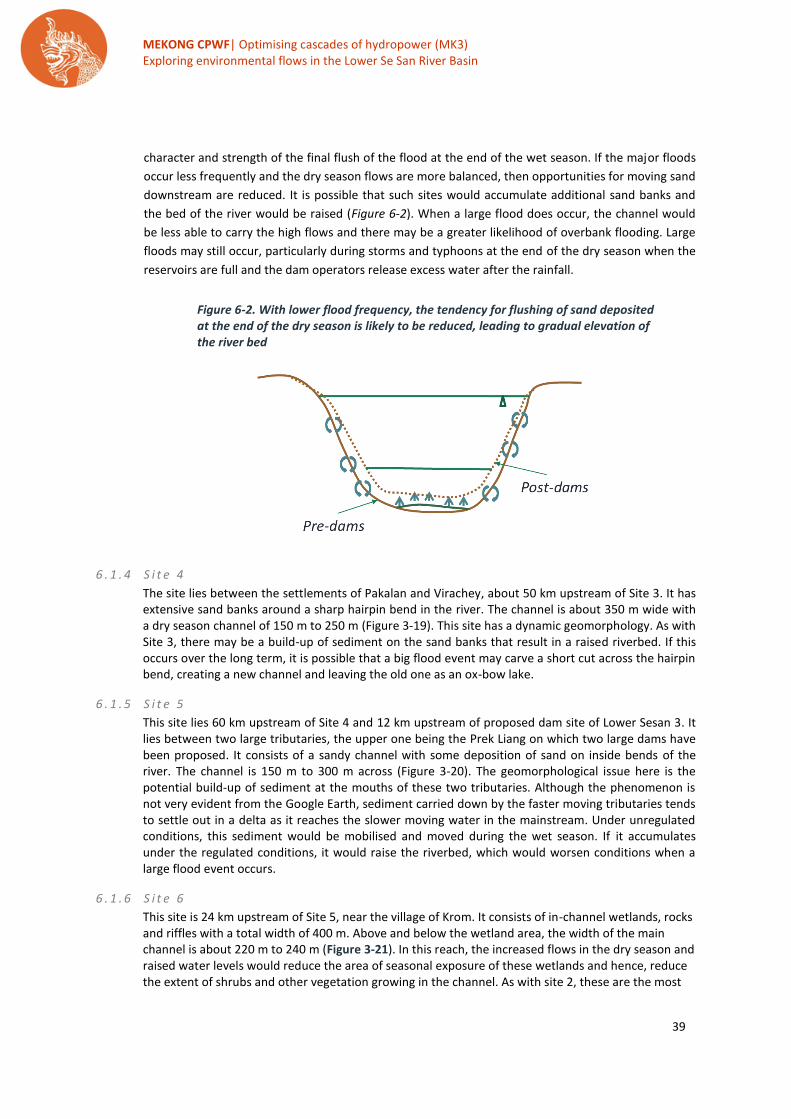
MEKONG CPWF| Optimising cascades of hydropower (MK3) Exploring environmental flows in the Lower Se San River Basin
39
character and strength of the final flush of the flood at the end of the wet season. If the major floods
occur less frequently and the dry season flows are more balanced, then opportunities for moving sand
downstream are reduced. It is possible that such sites would accumulate additional sand banks and
the bed of the river would be raised (Figure 6-2). When a large flood does occur, the channel would
be less able to carry the high flows and there may be a greater likelihood of overbank flooding. Large
floods may still occur, particularly during storms and typhoons at the end of the dry season when the
reservoirs are full and the dam operators release excess water after the rainfall.
Figure 6-2. With lower flood frequency, the tendency for flushing of sand deposited at the end of the dry season is likely to be reduced, leading to gradual elevation of the river bed
6 . 1 . 4 S i t e 4
The site lies between the settlements of Pakalan and Virachey, about 50 km upstream of Site 3. It has extensive sand banks around a sharp hairpin bend in the river. The channel is about 350 m wide with a dry season channel of 150 m to 250 m (Figure 3-19). This site has a dynamic geomorphology. As with Site 3, there may be a build-up of sediment on the sand banks that result in a raised riverbed. If this occurs over the long term, it is possible that a big flood event may carve a short cut across the hairpin bend, creating a new channel and leaving the old one as an ox-bow lake.
6 . 1 . 5 S i t e 5
This site lies 60 km upstream of Site 4 and 12 km upstream of proposed dam site of Lower Sesan 3. It lies between two large tributaries, the upper one being the Prek Liang on which two large dams have been proposed. It consists of a sandy channel with some deposition of sand on inside bends of the river. The channel is 150 m to 300 m across (Figure 3-20). The geomorphological issue here is the potential build-up of sediment at the mouths of these two tributaries. Although the phenomenon is not very evident from the Google Earth, sediment carried down by the faster moving tributaries tends to settle out in a delta as it reaches the slower moving water in the mainstream. Under unregulated conditions, this sediment would be mobilised and moved during the wet season. If it accumulates under the regulated conditions, it would raise the riverbed, which would worsen conditions when a large flood event occurs.
6 . 1 . 6 S i t e 6
This site is 24 km upstream of Site 5, near the village of Krom. It consists of in-channel wetlands, rocks and riffles with a total width of 400 m. Above and below the wetland area, the width of the main channel is about 220 m to 240 m (Figure 3-21). In this reach, the increased flows in the dry season and raised water levels would reduce the area of seasonal exposure of these wetlands and hence, reduce the extent of shrubs and other vegetation growing in the channel. As with site 2, these are the most
MEKONG CPWF| Optimising cascades of hydropower (MK3) Exploring environmental flows in the Lower Se San River Basin
40
productive and diverse habitats in the river and the opportunities for fish spawning and feeding will be reduced. The rocks and riffles also promote fish spawning and if these are located in deeper water due to higher water levels during the dry season and early arrival of the wet season, the water may not be oxygenated enough to be attractive spawning sites.
6 . 1 . 7 S i t e 7
This site is 26 km upstream of Site 6 and 10 km downstream of the Cambodia - Vietnam border. It consists of a large forested island with complex rocky channels on either side. There are small islets with deposited sandy beaches and trees and shrubs that would probably be inundated in high flows. The total width of wetland area and island is about 800 m, with the width of the channel upstream being 300 m and the width downstream being 240 m (Figure 3-22). The rocky channels would be maintained with the changes in regulation, but with the deeper water levels during the dry season, the overall character of the channels may change, with less exposed rock, less oxygenation and permanent inundation of the shrub areas. This would lead to loss of those species that require exposure during low flows. There may be increased deposition of sediment and growth of the sandy beaches round the islands, if this is not regularly moved on by the high flows. The forested island would also be maintained.
6 . 2 E C O L O G I C A L I M P L I C A T I O N S
There are a number of ecological implications associated with these flow changes. Those associated with the changes in habitat include:
Reduction in the extent of in-channel wetlands, with seasonally exposed shrubs. This is likely
to reduce some of the most productive areas for spawning and feeding of fish and other
aquatic animals.
Increased depth of water flowing over rocks, riffles and gravel beds may lead to reduced
growth of algae on these rocks due to reduced light penetration, and hence loss of some
primary productivity and food for fish and aquatic animals that graze on the algae growing on
the rocks. Riffles and gravel beds are also important spawning areas for fish and these may
become less attractive, especially if they silt up.
Build-up of sediment and raised bed levels impede natural flows. Sandbars and beaches tend
to be the least diverse and productive habitats in the river.
Changes in the seasonality of the flows, with a tendency for the lowest flows occurring earlier
(March or even February) and the highest flows occurring earlier (August). Fish migrations,
local movements and long distance migrations often triggered by flushes of water at the early
onset of the rains. With increased regulation by the dams in Vietnam, these early flushes will
be captured in the reservoirs, which would be at their lowest water levels and not passed on
downstream. The balancing effects of regulated dry season flows will tend to dampen such
early flushes and minimise the effects of this migration trigger.
Over the long-term, increased regulation would change the ecological character of the river, making it
less diverse and productive as a fishery.

MEKONG CPWF| Optimising cascades of hydropower (MK3) Exploring environmental flows in the Lower Se San River Basin
41
7 REACH ING A COMP ROMIS E
Analysis of the energy production, flow and ecological impacts of two opposite hydropower management scenarios – full regulation and no regulation – have shown that:
The no regulation scenario optimises flow and ecosystem health but causes a 13.3 percent
decrease in overall energy production compared to the full regulation scenario.
The full regulation scenario optimises the production of energy but will have significant
impacts on downstream channel morphology and in-channel wetlands.
The key to achieving implementable environmental flows is reaching a compromise that minimises the potential impacts on downstream ecosystems while ensuring adequate production for reservoir operators. Therefore, any environmental flow regime to be implemented would need to be a balance between the no regulation and full regulation scenarios.
One of the main impacts of dams on downstream hydrology is a dampening of flow variability throughout the year as the reservoir stores water during the wet season and releases water during the dry season. This leads to higher flows during dry season months and lower flows during wet season months. The full regulation scenario modelling described in Section 5.2 represents a decrease in the monthly flow variability of between 10 to 20 percent. The no-regulation scenario does not impact the variability of monthly average flows.
To investigate potential energy-environment compromises, we conducted a sensitivity analysis of Flow Health Indicator scores for changes in monthly flow regulation. We tested the sensitivity of flow health sub-indicators to potential levels of regulation by creating a time series of decreasing variability between monthly average flows. The decrease in monthly average flow variability of the full regulation scenario (20 percent) was used as the worst-case scenario and the no regulation scenario as the best case scenario. Figure 7-1 a illustrates the annual hydrology for a selection of the sensitivity analysis time series. The developed time series was assessed with and without a two year ARI flood flow.
The results of the sensitivity analysis, presented in Figure 7-1 (b and c), show that:
The importance of monthly average flow variability between seasons is different for each
sub-indicator.
The persistently higher sub-indicator, a measure of the duration of abnormally high flows
during the dry season, diminishes sharply to zero (orange column in Figure 7-1b) if the
variability between seasons is reduced by only 16 percent.
The low flow sub-indicator, a measure of the sum of monthly flows in the low flow period, is
sensitive to changes in monthly variability. The sub-indicator drops sharply when the monthly
variability is reduced by between 0 to 8 percent (dark purple column in Figure 7-1b).
The lowest monthly flow sub-indicator, a measure of the lowest average monthly flow in a
year, is sensitive to changes in monthly variability. The sub-indicator drops sharply when the
monthly variability is reduced by between 0 to 6 percent (dark purple column in Figure 7-1b).
The sub-indicator highest monthly flow (dark green column in Figure 7-1 b), which measures
the highest average monthly flow in a year, drops slightly in scenarios with more than 18
percent reduction in the variability between seasonal flows.

MEKONG CPWF| Optimising cascades of hydropower (MK3) Exploring environmental flows in the Lower Se San River Basin
42
The high flow, highest monthly flow, persistently lower, persistently very low and
seasonality flow shift sub-indicators are not greatly affected by reducing the variability
between monthly average flows within a year (Figure 7-1 b).
The combined flow health indicator diminishes with decreasing variability of average
monthly flows. The most significant drops occur between 2 to 4 percent and 16 to 18 percent
reductions in the variability between average monthly flows (Figure 7-1b).
The provision of a flood flow every two years greatly increases the flood flow interval sub-
indicator and, therefore, the overall flow health score, with only a minor increase required in
the average annual flow volume (Figure 7-1c).
Figure 7-1. Sensitivity analysis of flow health indicators to different levels of regulation: Note that the MAF is the same for all scenarios.
0
500
1,000
1,500
2,000
2,500
3,000
Jan Feb Mar Apr May Jun Jul Aug Sep Oct Nov Dec
Mo
nth
ly a
vera
ge
flo
w (
m3/s
)
0% (Natural) 4% 8% 10% 14% 18% 20%
0
0.1
0.2
0.3
0.4
0.5
0.6
0.7
0.8
0.9
1
0
1
2
3
4
5
6
7
8
9
0%(Natural)
2% 4% 6% 8% 10% 12% 14% 16% 18% 20%
Flo
w H
ealt
h in
dic
ato
r sc
ore
Flo
w H
ealt
h s
ub
-in
dic
ato
r sc
ore
Percentage reduction in variability between monthly average flows
High Flow Highest monthly flow Low Flow Lowest Monthly Flow
Persistently Higher Persistently Lower Persistenly Very Low Seasonality Flow Shift
Flood Flow Interval Flow Health Indicator
a) Illustration of scenarios showing hydrograph for 0% (natural), 4%, 8%, 10%, 14%, 16 and 20% reduction in variability between monthly flows. Note that the MAF is the same for all scenarios. 100% reduction in the variability between flows means that all monthly flows are equal.
b) Sensitivity analysis of flow health indicators – without large flood event every two years

MEKONG CPWF| Optimising cascades of hydropower (MK3) Exploring environmental flows in the Lower Se San River Basin
43
The above results indicate that when developing an environmental flow regime for the Sesan, two key considerations are: i) to avoid impacts on downstream ecology and geomorphology, the reduction in the variability between monthly average flows cannot exceed 4 percent; and ii) the inclusion of a flood event at a regular interval, such as every two years, would greatly increase the environmental and geomorphic functions downstream.
0
0.1
0.2
0.3
0.4
0.5
0.6
0.7
0.8
0.9
1
0
1
2
3
4
5
6
7
8
9
0%(Natural)
2% 4% 6% 8% 10% 12% 14% 16% 18% 20%
Flo
w H
ealt
h in
dic
ato
r sc
ore
Flo
w h
ealt
h s
ub
-in
dic
ato
r sc
ore
Percentage reduction in variability betweeen monthly average flows
High Flow Highest monthly flow Low Flow Lowest Monthly Flow
Persistently Higher Persistently Lower Persistenly Very Low Seasonality Flow Shift
Flood Flow Interval Flow Health Indicator
c) Sensitivity analysis of flow health indicators – with large flood event every two years
MEKONG CPWF| Optimising cascades of hydropower (MK3) Exploring environmental flows in the Lower Se San River Basin
44
8 D ISCUSSION AND CONCL USIONS
This brief study illustrates the benefits of using an environmental flow approach to review the impacts of regulating the Upper Sesan Basin in Vietnam on the Lower Sesan in Cambodia before dam construction starts in the lower part of the basin. The study used two main tools for this purpose: Google Earth, which was used to identify the geomorphological characteristics and key habitats of the Sesan River, and the flow health modelling tool to simulate different flow regimes of the Lower Sesan.
These flow regimes covered an initial reference period in the 1990s before large dams in Vietnam became operational and a reference period after the Yali dam was constructed. Two additional simulations assumed, in one flow regime scenario, full regulation of the river by all the dams in Vietnam, and in another scenario, that all the dams in Vietnam were operated as run-of-river dams. It was found that the latter simulation was similar to the initial reference period.
The impacts on the geomorphology, habitats and associated ecological implications were considered for seven characteristic sites containing some of the key habitats in the river – confined rock channels, in-channel wetlands, rocks, rapids and riffles and deposited sediments, sandbars and beaches. Without field surveys, it was difficult to specifically assess these impacts. Nevertheless, characteristic sites could be surveyed through Google Maps in some detail to assess the ecological implications of hydrological changes.
Comparing two simulated flow regimes is useful because the simulations represent two extremes. The paper highlighted the trade-offs when dams with no regulation are used to generate hydropower, resulting in flows that would be similar to the original flow regime, i.e., with minimal impact on the habitats and ecosystems of the river. The losses in hydropower generation due to the no regulation scenario varied from zero to 33 percent between the individual projects. The total annual average loss in hydropower generation across the 11 projects was 13.3 percent.
This illustrated the relatively low margin of loss in hydropower potential that would result if the original flow regime were maintained. However, even such a relatively low percentage would restrict the economic viability of these projects. The paper considered environmental trade-offs by increasing the degree of regulation and storage. Using a sensitivity analysis, the study looked at the impacts of the different degrees of regulation (seasonal variability in flows) upon the Flow Health Index (FHI). A four percent reduction in seasonal variability produced an indicator score that would still be acceptable, especially compared to the 20 percent reduction in seasonal variability that would result with full regulation. The indicator score would be improved if significant flows that triggered floods and inundated banks were to be released every two years to clear out the system.
MEKONG CPWF| Optimising cascades of hydropower (MK3) Exploring environmental flows in the Lower Se San River Basin
45
9 BIBL IOG RAPH Y
Baran, E. S. (2012). FISH AND FISHERIES IN THE SESAN RIVER BASIN. Hanoi: ICEM/CPWF.
Dyson, M. B. (2003). Flow. The essentials of environmental flows. Gland, Switzerland and Cambridge
UK: IUCN.
Gippel, C. M. (2012). Flow Health - Software to assess the deviation of river flows from reference and
to design a monthly environmental flow regime. Technical Manual and User Guide, Version
2.0. Brisbane: ACEDP Australia-China Environment Development Partnership, River Health
and Environmental Flow in China. International WaterCentre, Brisbane, Fluvial Systems Pty
Ltd, Stockton, and Yorb Pty Ltd, Brisbane.
Gippel, C. Z. (2011). River health assessment in China: comparison and development of indicators of
hydrological health. . Brisbane: ACEDP Australia-China Environment Development
Partnership, International Water Centre Pty Ltd.
IUCN Vietnam. (2005). Environmental Flows: Rapid Environmental Flow Assessment for the Huong
River Basin, Central Vietnam. Hanoi, Vietnam: IUCN Vietnam.
Meynell, P.-J. (2012). Assessing the Ecological Significance of the Mekong Tributaries. Volumes 1 and
2. Report prepared for the Mekong River Commission. Vientiane, Lao PDR: Mekong River
Commission.
MRC (2011) Hydrological database. Vientiane Lao PDR, Mekong River Commission
Rasanen, T. (2012). Sekong-Sesan-Srepok VMod hydrological modelling report. Hanoi: ICEM/CPWF.
RÄSÄNEN, T. A., JOFFRE, O., SOMETH, P. & KUMMU, M. (2012) Trade-offs between hydropower and
irrigation development and their cumulative hydrological impacts – A case study: Sesan River
basin. Project report: Challenge Program on Water & Food Mekong project MK3 “Optimizing
the management of a cascade of reservoirs at the catchment level”. Aalto University, Finland;
International Centre for Environmental Management (ICEM), Vietnam; Institute of
Technology of Cambodia.

MEKONG CPWF| Optimising cascades of hydropower (MK3) Exploring environmental flows in the Lower Se San River Basin
46
ANNEX A – MEASURED TIME SERIES Figure 0-1 Daily Discharge measurements from Voeun Sai (see location in Figure 2-1) from the period 1986-2005.
0
1000
2000
3000
4000
5000
6000
1-…
1-…
1-…
1-…
1-…
1-…
1-…
1-…
1-…
1-…
1-…
1-…
1-…
1-…
1-…
1-…
1-…
1-…
1-…
1-…
[m3
/s]
A. 1986-1990
0
1000
2000
3000
4000
5000
6000
1-…
1-…
1-J
ul-
…
1-…
1-…
1-…
1-J
ul-
…
1-…
1-…
1-…
1-J
ul-
…
1-…
1-…
1-…
1-J
ul-
…
1-…
1-…
1-…
1-J
ul-
…
1-…
[m3
/s]
B. 1991-1995
0
1000
2000
3000
4000
5000
6000
1-…
1-…
1-…
1-…
1-…
1-…
1-…
1-…
1-…
1-…
1-…
1-…
1-…
1-…
1-…
1-…
1-…
1-…
1-…
1-…
[m3
/s]
C. 1996-2000
0
1000
2000
3000
4000
5000
6000
1-…
1-…
1-…
1-…
1-…
1-…
1-…
1-…
1-…
1-…
1-…
1-…
1-…
1-…
1-…
1-…
1-…
1-…
1-…
1-…
[m3
/s]
D. 2001-2005
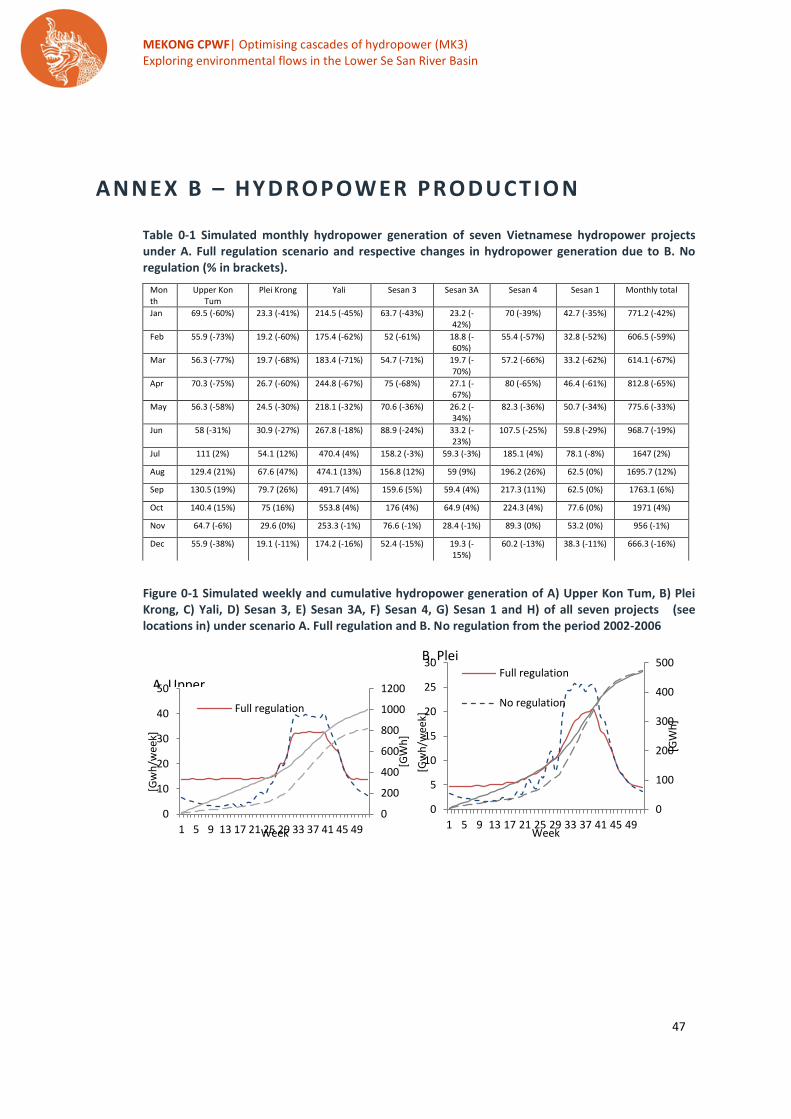
MEKONG CPWF| Optimising cascades of hydropower (MK3) Exploring environmental flows in the Lower Se San River Basin
47
ANNEX B – HYD ROP OWER P RODUCTIO N
Table 0-1 Simulated monthly hydropower generation of seven Vietnamese hydropower projects under A. Full regulation scenario and respective changes in hydropower generation due to B. No regulation (% in brackets).
Month
Upper Kon Tum
Plei Krong Yali Sesan 3 Sesan 3A Sesan 4 Sesan 1 Monthly total
Jan 69.5 (-60%) 23.3 (-41%) 214.5 (-45%) 63.7 (-43%) 23.2 (-42%)
70 (-39%) 42.7 (-35%) 771.2 (-42%)
Feb 55.9 (-73%) 19.2 (-60%) 175.4 (-62%) 52 (-61%) 18.8 (-60%)
55.4 (-57%) 32.8 (-52%) 606.5 (-59%)
Mar 56.3 (-77%) 19.7 (-68%) 183.4 (-71%) 54.7 (-71%) 19.7 (-70%)
57.2 (-66%) 33.2 (-62%) 614.1 (-67%)
Apr 70.3 (-75%) 26.7 (-60%) 244.8 (-67%) 75 (-68%) 27.1 (-67%)
80 (-65%) 46.4 (-61%) 812.8 (-65%)
May 56.3 (-58%) 24.5 (-30%) 218.1 (-32%) 70.6 (-36%) 26.2 (-34%)
82.3 (-36%) 50.7 (-34%) 775.6 (-33%)
Jun 58 (-31%) 30.9 (-27%) 267.8 (-18%) 88.9 (-24%) 33.2 (-23%)
107.5 (-25%) 59.8 (-29%) 968.7 (-19%)
Jul 111 (2%) 54.1 (12%) 470.4 (4%) 158.2 (-3%) 59.3 (-3%) 185.1 (4%) 78.1 (-8%) 1647 (2%)
Aug 129.4 (21%) 67.6 (47%) 474.1 (13%) 156.8 (12%) 59 (9%) 196.2 (26%) 62.5 (0%) 1695.7 (12%)
Sep 130.5 (19%) 79.7 (26%) 491.7 (4%) 159.6 (5%) 59.4 (4%) 217.3 (11%) 62.5 (0%) 1763.1 (6%)
Oct 140.4 (15%) 75 (16%) 553.8 (4%) 176 (4%) 64.9 (4%) 224.3 (4%) 77.6 (0%) 1971 (4%)
Nov 64.7 (-6%) 29.6 (0%) 253.3 (-1%) 76.6 (-1%) 28.4 (-1%) 89.3 (0%) 53.2 (0%) 956 (-1%)
Dec 55.9 (-38%) 19.1 (-11%) 174.2 (-16%) 52.4 (-15%) 19.3 (-15%)
60.2 (-13%) 38.3 (-11%) 666.3 (-16%)
Figure 0-1 Simulated weekly and cumulative hydropower generation of A) Upper Kon Tum, B) Plei Krong, C) Yali, D) Sesan 3, E) Sesan 3A, F) Sesan 4, G) Sesan 1 and H) of all seven projects (see locations in) under scenario A. Full regulation and B. No regulation from the period 2002-2006
0
200
400
600
800
1000
1200
0
10
20
30
40
50
1 5 9 13 17 21 25 29 33 37 41 45 49
[GW
h]
[G
wh
/wee
k]
Week
Full regulation
A. Upper
0
100
200
300
400
500
0
5
10
15
20
25
30
1 5 9 13 17 21 25 29 33 37 41 45 49
[GW
h]
[G
wh
/wee
k]
Week
Full regulation
No regulation
B. Plei
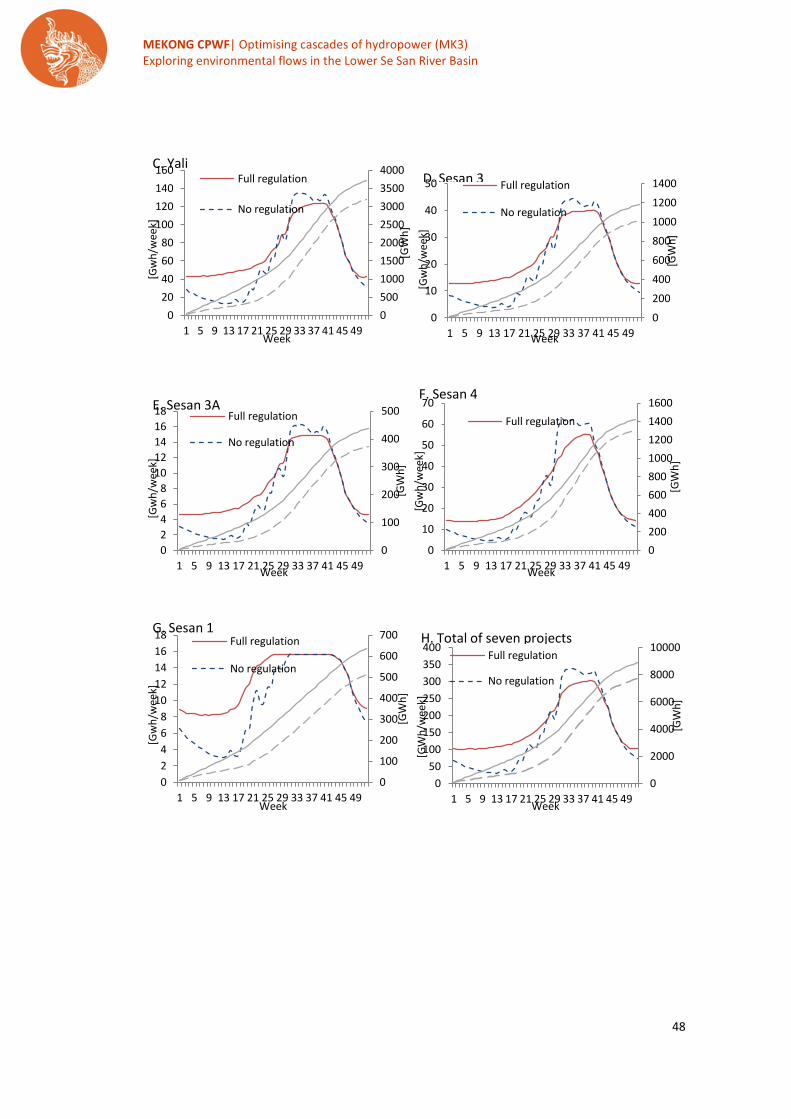
MEKONG CPWF| Optimising cascades of hydropower (MK3) Exploring environmental flows in the Lower Se San River Basin
48
0
500
1000
1500
2000
2500
3000
3500
4000
0
20
40
60
80
100
120
140
160
1 5 9 13 17 21 25 29 33 37 41 45 49
[GW
h]
[G
wh
/wee
k]
Week
Full regulation
No regulation
C. Yali
0
200
400
600
800
1000
1200
1400
0
10
20
30
40
50
1 5 9 13 17 21 25 29 33 37 41 45 49
[GW
h]
[G
wh
/wee
k]
Week
Full regulation
No regulation
D. Sesan 3
0
100
200
300
400
500
0
2
4
6
8
10
12
14
16
18
1 5 9 13 17 21 25 29 33 37 41 45 49
[GW
h]
[G
wh
/wee
k]
Week
Full regulation
No regulation
E. Sesan 3A
0
200
400
600
800
1000
1200
1400
1600
0
10
20
30
40
50
60
70
1 5 9 13 17 21 25 29 33 37 41 45 49
[GW
h]
[G
wh
/wee
k]
Week
Full regulation
F. Sesan 4
0
100
200
300
400
500
600
700
0
2
4
6
8
10
12
14
16
18
1 5 9 13 17 21 25 29 33 37 41 45 49
[GW
h]
[G
wh
/wee
k]
Week
Full regulation
No regulation
G. Sesan 1
0
2000
4000
6000
8000
10000
0
50
100
150
200
250
300
350
400
1 5 9 13 17 21 25 29 33 37 41 45 49
[GW
h]
[GW
h/w
eek]
Week
Full regulation
No regulation
H. Total of seven projects

MEKONG CPWF| Optimising cascades of hydropower (MK3) Exploring environmental flows in the Lower Se San River Basin
49
Figure 0-2 Simulated relative A, B) weekly and C, D) cumulative hydropower generation of seven Vietnamese hydropower projects under A. Full regulation and B. No regulation during the period 2002-2006.
0
50
100
150
200
250
300
350
400
1 5 9 13 17 21 25 29 33 37 41 45 49
[GW
h/w
eek]
Week
Sesan 1 Sesan 4 Sesan 3A Sesan 3 Yali Plei Krong Upper Kontum
A. Full regulation
0
50
100
150
200
250
300
350
400
1 5 9 13 17 21 25 29 33 37 41 45 49 [G
Wh
/wee
k]
Week
Sesan 1 Sesan 4 Sesan 3A Sesan 3 Yali Plei Krong Upper Kontum
B. No regulation
0
1000
2000
3000
4000
5000
6000
7000
8000
9000
10000
1 5 9 13 17 21 25 29 33 37 41 45 49
[GW
h]
Week
Sesan 1 Sesan 4 Sesan 3A Sesan 3 Yali Plei Krong Upper Kontum
C. Full
0
1000
2000
3000
4000
5000
6000
7000
8000
9000
10000
1 5 9 13 17 21 25 29 33 37 41 45 49
[GW
h]
Week
Sesan 1 Sesan 4 Sesan 3A Sesan 3 Yali Plei Krong Upper Kontum
D. No regulation