Exploratory study of the three-dimensional morphological ...
20
HAL Id: hal-02562623 https://hal-amu.archives-ouvertes.fr/hal-02562623 Submitted on 5 Jul 2021 HAL is a multi-disciplinary open access archive for the deposit and dissemination of sci- entific research documents, whether they are pub- lished or not. The documents may come from teaching and research institutions in France or abroad, or from public or private research centers. L’archive ouverte pluridisciplinaire HAL, est destinée au dépôt et à la diffusion de documents scientifiques de niveau recherche, publiés ou non, émanant des établissements d’enseignement et de recherche français ou étrangers, des laboratoires publics ou privés. Exploratory study of the three-dimensional morphological variation of the jaw associated to teeth loss Sonia Guevara Perez, Michel Behr, Lionel Thollon To cite this version: Sonia Guevara Perez, Michel Behr, Lionel Thollon. Exploratory study of the three-dimensional mor- phological variation of the jaw associated to teeth loss. Journal of Stomatology, Oral and Maxillofacial Surgery, Elsevier Masson, 2019, 120 (6), pp523-528. hal-02562623
Transcript of Exploratory study of the three-dimensional morphological ...
HAL Id: hal-02562623https://hal-amu.archives-ouvertes.fr/hal-02562623
Submitted on 5 Jul 2021
HAL is a multi-disciplinary open accessarchive for the deposit and dissemination of sci-entific research documents, whether they are pub-lished or not. The documents may come fromteaching and research institutions in France orabroad, or from public or private research centers.
L’archive ouverte pluridisciplinaire HAL, estdestinée au dépôt et à la diffusion de documentsscientifiques de niveau recherche, publiés ou non,émanant des établissements d’enseignement et derecherche français ou étrangers, des laboratoirespublics ou privés.
Exploratory study of the three-dimensionalmorphological variation of the jaw associated to teeth
lossSonia Guevara Perez, Michel Behr, Lionel Thollon
To cite this version:Sonia Guevara Perez, Michel Behr, Lionel Thollon. Exploratory study of the three-dimensional mor-phological variation of the jaw associated to teeth loss. Journal of Stomatology, Oral and MaxillofacialSurgery, Elsevier Masson, 2019, 120 (6), pp523-528. �hal-02562623�
Exploratory study of the three-dimensional morphological variation of the
jaw associated to teeth loss.
Sonia V. Guevara Pereza,b, Michel Behrb, Lionel Thollonb
a Universidad Nacional de Colombia. Department of Oral Health. 11001 Bogota-Colombia
b IFSTTAR-Laboratory of Applied Biomechanics UMR T24, Aix-Marseille Université, 13916 Marseille, France.
e-mail adresess:
Sonia V. Guevara Perez: [email protected]; [email protected]
Lionel Thollon: [email protected]
Michel Behr: [email protected]
CORRESPONDING AUTHOR:
S. V. Guevara Pérez
Aix-Marseille Université, IFSTTAR, LBA UMR T24, F-13016, Marseille
Bd. P. Dramard, Faculty of Medicine, North Sector
13916 Marseille Cedex 20. Tél : +33 (0)4 91 65 80 00 Fax : +33 (0)4 91 65 80 19
FRANCE
Email : [email protected]; [email protected]
Funding: This research was partially funded by a mobility grants program (Colfuturo-
ASCUN-Embassy of France-Colombia)
© 2019 published by Elsevier. This manuscript is made available under the Elsevier user licensehttps://www.elsevier.com/open-access/userlicense/1.0/
Version of Record: https://www.sciencedirect.com/science/article/pii/S2468785519301053Manuscript_1f10f2a2707f2e22d44860218e19e778
Exploratory study of the three-dimensional morphological variation of the
jaw associated to teeth loss.
ABSTRACT
Purpose: The aim of this study is to evaluate the morphological variability in mandibles
with different types of edentulism, comparing the use of traditional morphometrics and
tridimensional geometric morphometrics.
Methods: Traditional morphometrics and geometric morphometrics (GM) exploratory
analysis, by principal components (PCs) and PC scores, were performed on a sample
of 24 cadaveric hemi mandibles. A digital reconstruction of 3D surfaces of each
specimen was obtained by CT scans segmentation. The mandibles were divided in
three groups: full dentition (G1), partial edentition (G2) and total edentition (G3). The
results of the two methods were compared in relation to the morphological variability
determined with each method.
Results: Both methods were consistent in terms of morphological variability between
the defined groups. The main shape variations observed were a decrease in
mandibular body height, a widening of the cross sectional morphology on the
symphysis, a shorten-narrowed Ramus and a deeper sigmoid notch, in the partially or
totally edentition groups, compared to the full dentition group.
Discussion: The general patterns of morphological variations associated with
edentulism that have been reported in literature could be visualized with GM method,
which had not been previously used for this purpose. The GM methods could offer a
more detailed definition of shape variations, which is critical in a clinical context.
Moreover, GM allowed defining configurations of mean morphologies and an image
library with different types of morphological variations.
KEYWORDS: Morphometrics geometrics; mandible; tooth loss; image processing
1. INTRODUCTION
Many factors have been related to morphologic variability of human mandible, as age,
gender, genetic and functional factors. [1-6] Mandibular bone experience morphological
changes through postnatal growth, due to a process that involves a selective resorption
and deposition of bone, to bring about the required three-dimensional growth
changes.[7] The development of the mandible is influenced by dental eruption, skull
development and masticatory forces. [8, 9] In the adult age, the presence or absence
of teeth is the main factor determining their morphology. [10-12] Some recent studies
have also stated that the dental condition plays a more important role in the
mandibular morphological changes than age or gender.[12-14]
Many local and systemic factors have been proposed to influence post-extraction
resorption in the mandible. These local factors can be functional, such as the presence
or absence of prostheses and associated components, the absence of mechanical
stress and muscular strength. They can be anatomical, such as facial shape,
mandibular morphology, bone quality, muscle attachments. Finally, these local factors
can also be inflammatory, such as periodontal disease, pre-existing infections, and
local inflammatory mediators. Mainly associated systemic factors are age and gender,
bone quality, levels of hormone regulators of bone metabolism and calcium level.[10]
The remodeling process that occurs with tooth loss was studied previously, through the
observation of the distribution and patterns of resorptive and repository fields in
mandibles at different stages of edentition.[11] More recently, expected patterns for
modifications in the alveolar shape after tooth loss were proposed.[15] The process of
atrophy of alveolus is cumulative and irreversible, and depends on numerous factors;
generating an inter-individual variation in post-extraction remodeling.[10, 16]
Numerous studies have evaluated the mandibular morphological changes associated
with edentition by traditional morphometrics (linear and angle measurements). [11, 12,
14, 16-19] In recent years the generalized use of 3D medical images is offering new
possibilities in using advanced 3D morphometric tools.[20]
Geometric morphometrics (GM) is a multivariate approach that studies morphological
variation in terms of the relative location of anatomical landmarks in the Euclidean
space. The most used method in GM is the Procrustes superimposition analysis [20,
21], that consists in locating different landmarks coordinates in the same reference
system by three geometrical transformations: translation, scaling and rotation. When
non-shape variation is eliminated, the variables become shape variables and may be
used to compare samples statistically. This method allows exploring shape variations
of an anatomic structure, independently of size variations; and the variation can be
visualized in their anatomical context, providing a wide range of applications in the
fields of biology, genetics, phylogeny and anthropology. [22, 23]
In this context, the aim of this study was to evaluate the morphological variability in
mandibles with diverse types of edentulism, comparing the use of traditional
morphometrics and tridimensional geometric morphometrics (GM).
2. MATERIALS AND METHODS
A sample of 24 human hemi mandibles dissected from 12 cadavers (8 males, 4
females) with average age 74 ± 8 from the Thanatopraxy Department of the Faculty of
Medicine of Aix-Marseille University, were selected for the study. The protocol satisfies
the ethical standards of the University. Inclusion criteria were as follows: adults over
50, at different stages of edentition, no visible bone pathology or bone trauma, and no
dental implants. Both hemi mandibles of each specimen was measured, but for GM
analysis, each side was defined as a classifier for each specimen and not as
independent variable, in agreement with previous recommendations.[24] The
specimens were then classified in three groups: G1(full dentition) (N=8), G2 (partial
edentition)(N=6), G3 (total edentition) (N=10). A CT Scan was performed on each
specimen using a SIEMENS Somatom Sensation Cardiac 64® scan (SIEMENS
Munich, Germany) (RAI orientation, data collection diameter 500mm, reconstruction
diameter 132mm, 512x512x455 pixels, slice thickness 0.6mm, KVP 120, 304mA, 1000
msec). To obtain 3D digital models, the DICOM files were segmented with MIMICS
(Materialise, Leuven, Belgium). The segmentation process consisted in isolating a
target tissue or region based on its cortical and trabecular bone density thresholds. A
3D surface reconstruction was then calculated based on the series of bi-dimensional
masks, with a quality configuration of a smoothing factor set to 0,5 and interpolation set
to “by contour”. For toothed mandibles, teeth were eliminated from the reconstruction
process by editing the bi dimensional mask with a Boolean subtraction of the tooth
crown tissues. The 3D surface mesh obtained for each specimen was recorded in .stl
format. All mandibles were oriented with their geometric center as the origin 0 in the
three axes X,Y and Z; positioned in a left hemi mandible view and transformed into
polygon file format (.ply) with 3D editor (Microsoft Corp. Washington, UE).
2.1. Morphometric analysis
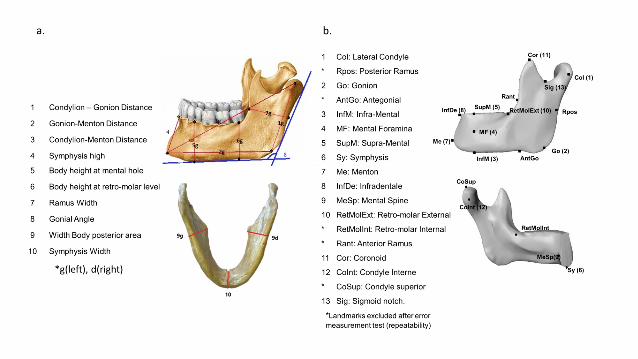
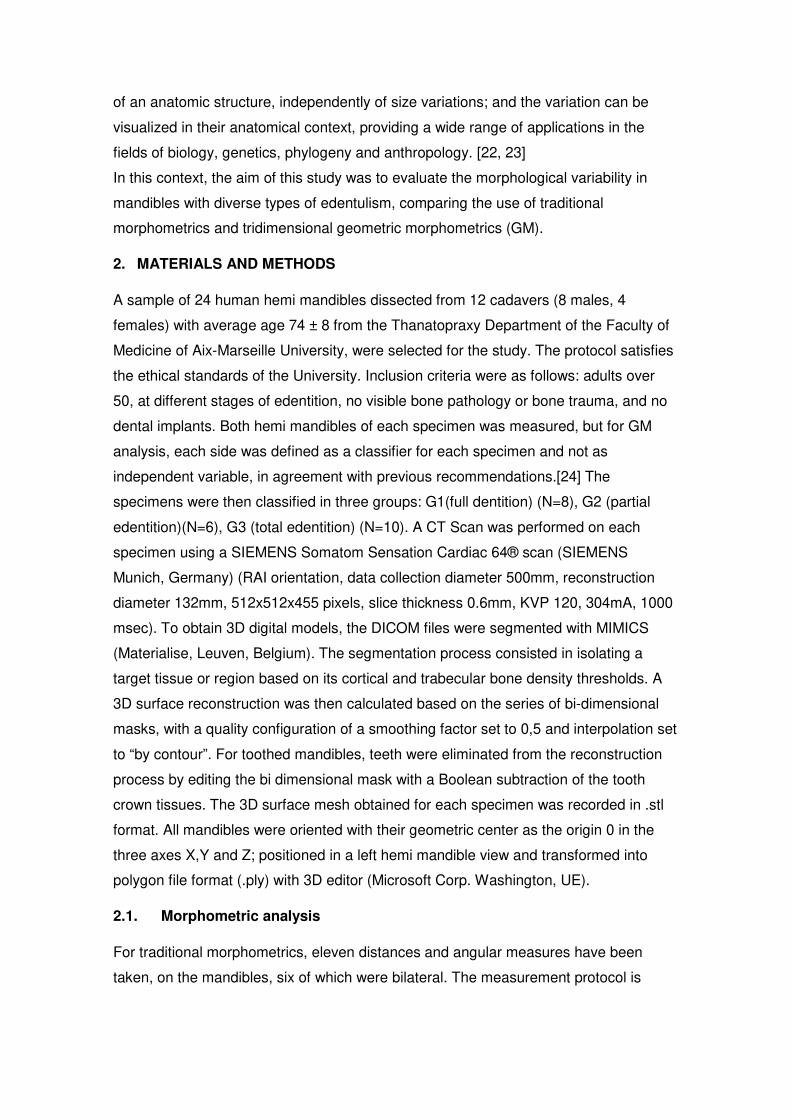
For traditional morphometrics, eleven distances and angular measures have been
taken, on the mandibles, six of which were bilateral. The measurement protocol is
illustrated in Fig.1a. The software PAST [25] was used for summary statistics and
Principal component analysis (PCA) of the samples.
For GM, 3D coordinates data was collected for 18 landmarks that are illustrated in
Fig.1b, using Landmark Editor software V 3.0. [26] The landmarks were selected to
best cover the overall shape of the mandibular body and ramus. However after the
measurement errors, only 13 landmarks were kept for the subsequent analysis
(Fig.1b). The same evaluator measured all hemi-mandibles twice, at two different
moments.
A significant amount of variation among replicas could be attributed to repetitions, if the
mean square for the error repetition value was found 10% higher than the mean square
for the “individual” term. [27] To estimate the measurement error of each landmark and
the linear and angle measurement, the software PAST [25] and the raw coordinates of
the repetitions were used to evaluate the absolute mean error and to compute the
intraclass correlation coefficient (ICC) for each.
2.2. Geometric morphometrics analysis
The GM analysis was performed with open source software Morpho J V 1.06. [28]
Landmarks coordinates were superimposed using the Generalized Procrustes Analysis
(GPA) method and projected to the shape tangent space. This method is based on
superimposing landmark configurations using least-square estimates for rotation and
translation parameters with configurations scaled in a common unit size (centroid size).
The process is iterated to compute the general mean shape and the mean shape for
each group, [22, 23] so size and shape can be analyzed separately. Kruskal-Wallis test
was used on centroid size data to test for significant size differences among groups.
[25] The fitted coordinates after GPA were analyzed by a principal component analysis
(PCA) of Procrustes ANOVA, using side as a classifier for effect in the analysis. In this
way only the symmetric component for computing Procrustes and covariance
component due to Individuals was shown. The PCA would explain progressively
smaller amounts of the total morphologic variance. Visualization of shape variation of
the total data set and mean morphology of each group were performed by warping a
3D surface model of mandible using the landmark Editor software [26, 29] and the
distance between average morphologies was computed using the mesh distance tool
in Meshlab software. The detailed methods of geometric morphometry used are shown
in a previous publication. [30]
3. RESULTS
Repeatability error by Procrustes ANOVA was found lower than 1% (p<0,0001). The
landmarks Rpost, AntGo, RetMolInt, Rant and CoSup (see Fig.1b) were excluded
because of an ICC lower than 0.85 and/or a mean difference between repetitions
superior to 1mm, in at least one axis. All other landmarks and linear measurements
gave an ICC over 0.9 and mean differences under 0.9mm. The Kruskal-Wallis test for
equal medians on the Centroid size data did not reveal a significant difference between
the three groups (p=0.76).
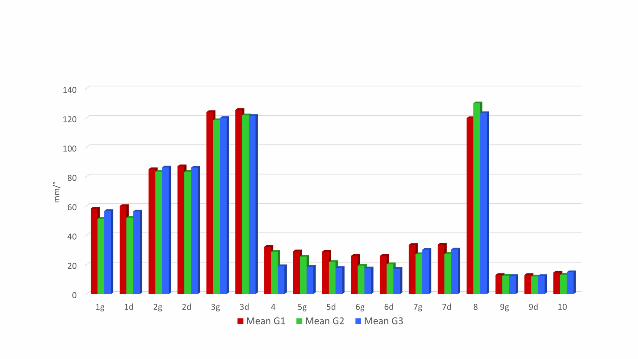
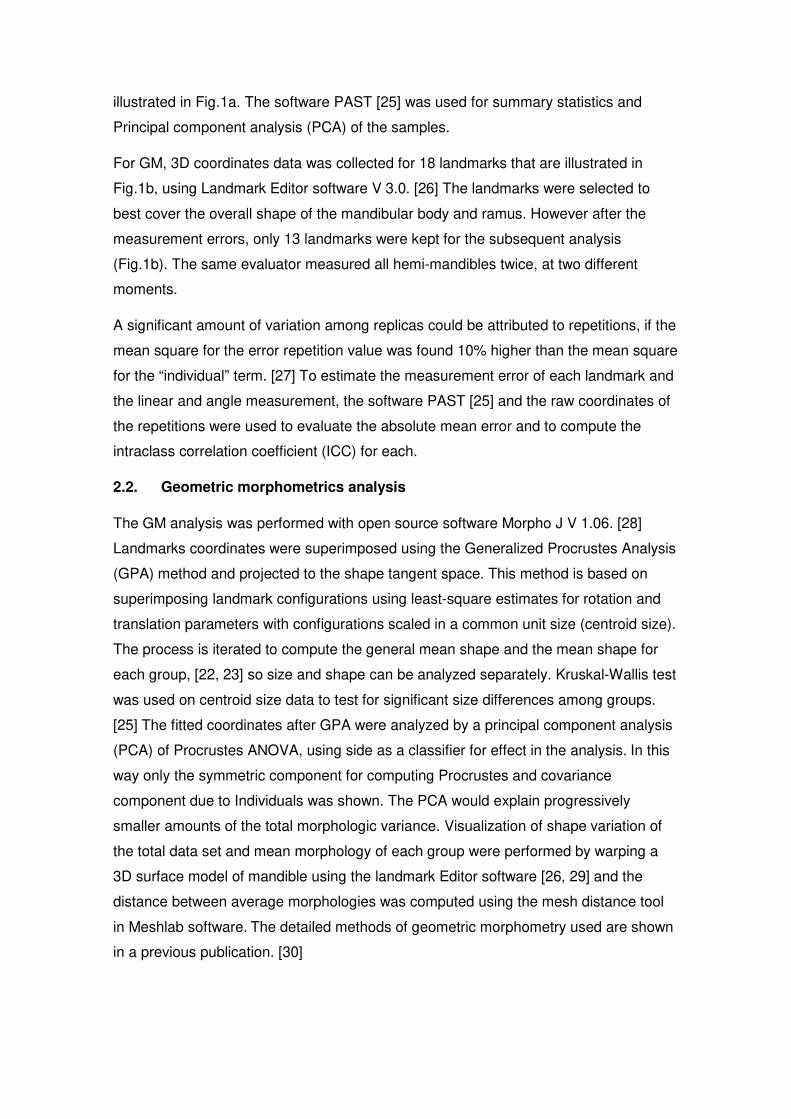
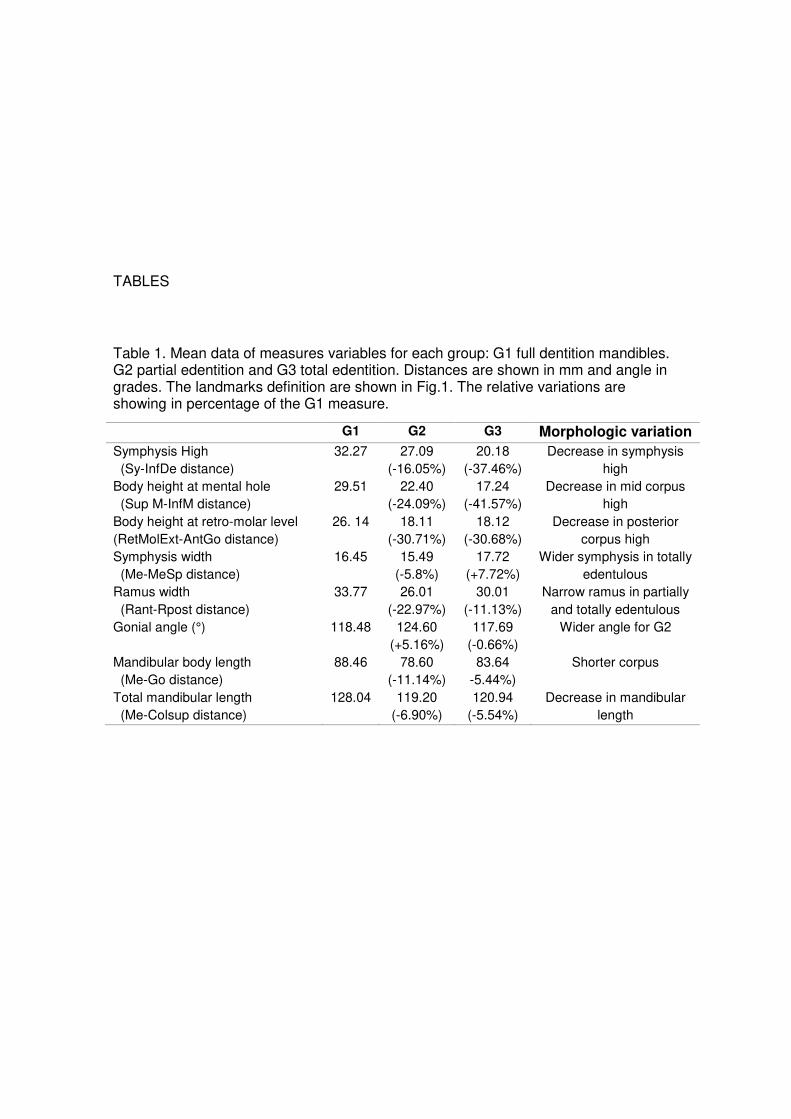
The main morphological variations observed by means of traditional morphometry are
summarized in Table 1, with the averages of each variable compared for each group.
Fig. 2 shows the bar graphic for means of length and angle measurements for the three
groups. The main shape variations in G2 and G3 compared with G1 were: decrease in
the height of the mandibular mid body by 24% in G2 and 41% in G3, decrease of
symphysis height by 16% in G2 and 37% in G3, decrease in posterior mandibular
height by 30% and a deeper sigmoid notch in both groups, a widening (7,7%) of the
cross sectional morphology on the symphysis in G3. The ten first PCs eigenvalues of
the fitted coordinates after PCA of Procrustes ANOVA (GM) and PCA for linear and
angular measures (Traditional morphometrics) are shown in Table 2.
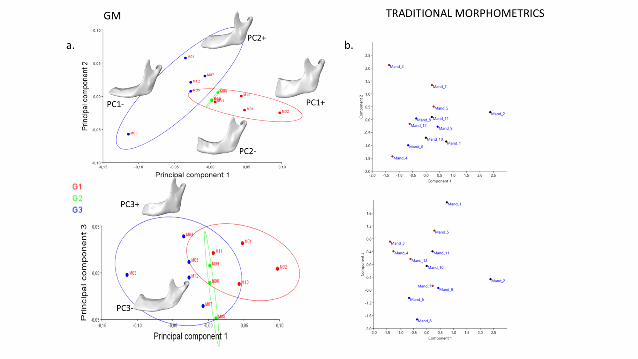
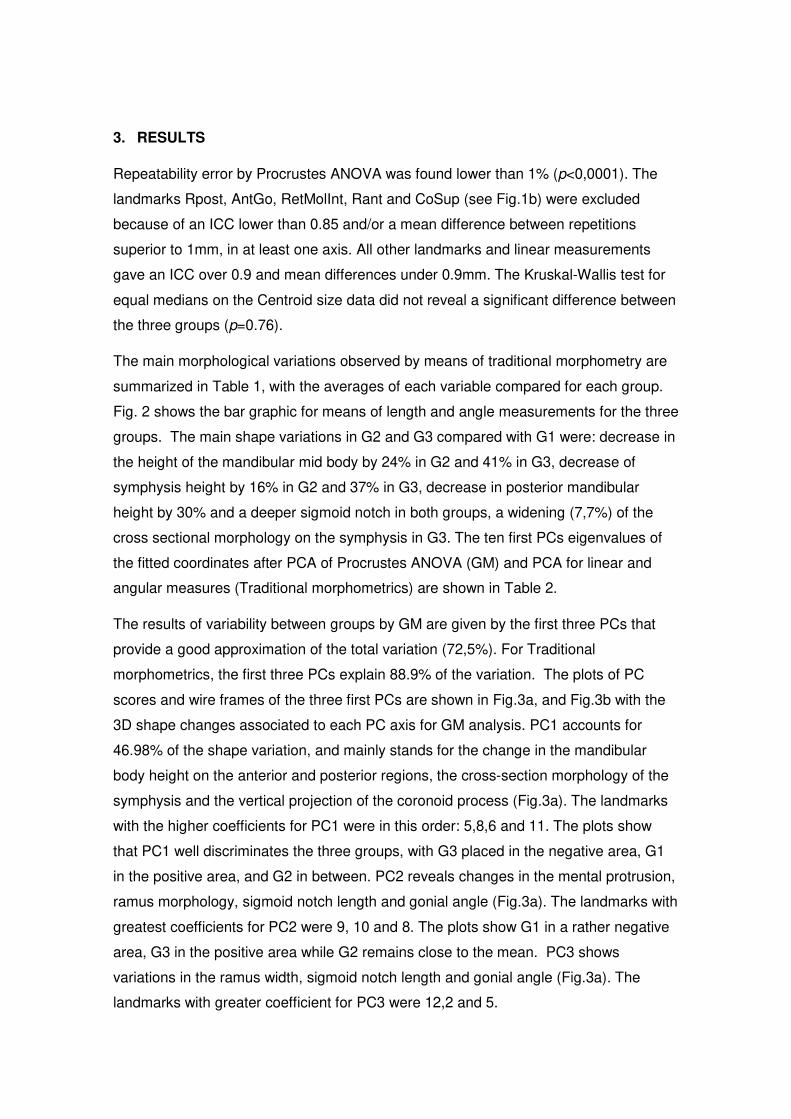
The results of variability between groups by GM are given by the first three PCs that
provide a good approximation of the total variation (72,5%). For Traditional
morphometrics, the first three PCs explain 88.9% of the variation. The plots of PC
scores and wire frames of the three first PCs are shown in Fig.3a, and Fig.3b with the
3D shape changes associated to each PC axis for GM analysis. PC1 accounts for
46.98% of the shape variation, and mainly stands for the change in the mandibular
body height on the anterior and posterior regions, the cross-section morphology of the
symphysis and the vertical projection of the coronoid process (Fig.3a). The landmarks
with the higher coefficients for PC1 were in this order: 5,8,6 and 11. The plots show
that PC1 well discriminates the three groups, with G3 placed in the negative area, G1
in the positive area, and G2 in between. PC2 reveals changes in the mental protrusion,
ramus morphology, sigmoid notch length and gonial angle (Fig.3a). The landmarks with
greatest coefficients for PC2 were 9, 10 and 8. The plots show G1 in a rather negative
area, G3 in the positive area while G2 remains close to the mean. PC3 shows
variations in the ramus width, sigmoid notch length and gonial angle (Fig.3a). The
landmarks with greater coefficient for PC3 were 12,2 and 5.
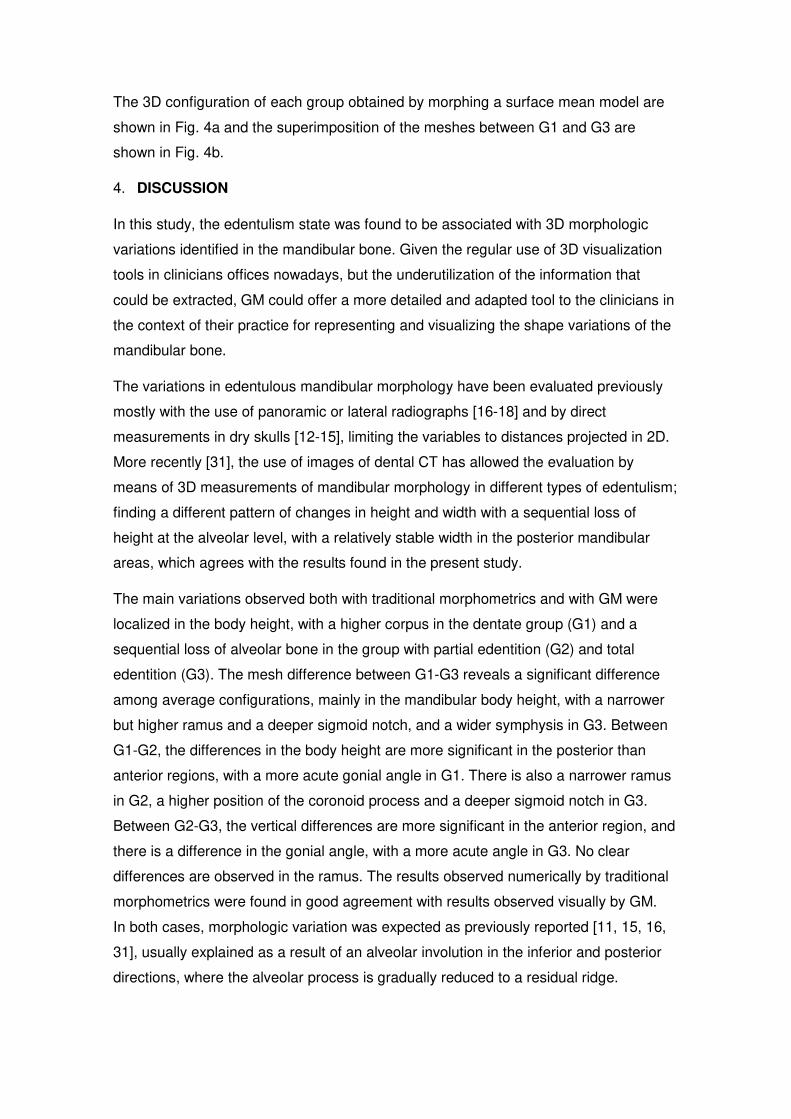
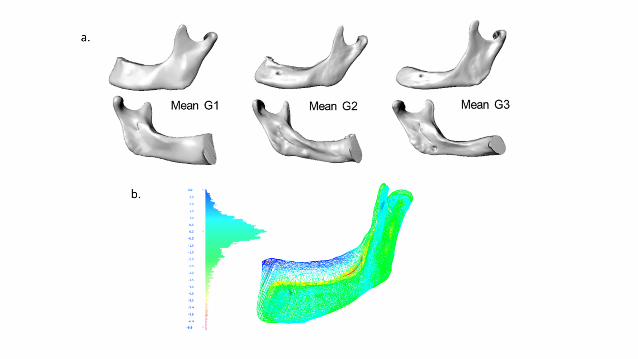
The 3D configuration of each group obtained by morphing a surface mean model are
shown in Fig. 4a and the superimposition of the meshes between G1 and G3 are
shown in Fig. 4b.
4. DISCUSSION
In this study, the edentulism state was found to be associated with 3D morphologic
variations identified in the mandibular bone. Given the regular use of 3D visualization
tools in clinicians offices nowadays, but the underutilization of the information that
could be extracted, GM could offer a more detailed and adapted tool to the clinicians in
the context of their practice for representing and visualizing the shape variations of the
mandibular bone.
The variations in edentulous mandibular morphology have been evaluated previously
mostly with the use of panoramic or lateral radiographs [16-18] and by direct
measurements in dry skulls [12-15], limiting the variables to distances projected in 2D.
More recently [31], the use of images of dental CT has allowed the evaluation by
means of 3D measurements of mandibular morphology in different types of edentulism;
finding a different pattern of changes in height and width with a sequential loss of
height at the alveolar level, with a relatively stable width in the posterior mandibular
areas, which agrees with the results found in the present study.
The main variations observed both with traditional morphometrics and with GM were
localized in the body height, with a higher corpus in the dentate group (G1) and a
sequential loss of alveolar bone in the group with partial edentition (G2) and total
edentition (G3). The mesh difference between G1-G3 reveals a significant difference
among average configurations, mainly in the mandibular body height, with a narrower
but higher ramus and a deeper sigmoid notch, and a wider symphysis in G3. Between
G1-G2, the differences in the body height are more significant in the posterior than
anterior regions, with a more acute gonial angle in G1. There is also a narrower ramus
in G2, a higher position of the coronoid process and a deeper sigmoid notch in G3.
Between G2-G3, the vertical differences are more significant in the anterior region, and
there is a difference in the gonial angle, with a more acute angle in G3. No clear
differences are observed in the ramus. The results observed numerically by traditional
morphometrics were found in good agreement with results observed visually by GM.
In both cases, morphologic variation was expected as previously reported [11, 15, 16,
31], usually explained as a result of an alveolar involution in the inferior and posterior
directions, where the alveolar process is gradually reduced to a residual ridge.
The cross-sectional morphology of the symphysis revealed a difference between
groups, with not only a decrease in height but also a widening in the groups with partial
or total edentulism. In agreement with these observations are the depository fields, on
the buccal and lingual sides of the mandibular basal body, with an increase of the
corpus breadth observed by Enlow [11]. However, Cawood and Howell [15] reported
that the shape of the basilar process of the mandible remains relatively stable despite
significant changes in the alveolar process in both the vertical and horizontal axes.
The first two PCs not only indicate the vertical changes in the mandibular morphology
associated to edentulousness, but also the alterations on the mental protrusion, ramus
and sigmoid notch morphology. The changes in the mental protuberance that have
been described previously as a depository remodeling field [11] were also observed
here in the chin region.
Additionally, the GM analysis revealed a higher location of the coronoid process, with a
deeper sigmoid notch, in contrast with what has been reported previously [14] where
no differences between mandibular notches were found.
Changes relative to a forward rotation and downward angulation of the mandibular
corpus associated with edentulism [14, 17] were observed on the PC3; nevertheless,
only the partial edentition group displayed a wider gonial angle than the total or non-
edentulous groups. In the present study the opening of the gonial angle described in
previous works was not clearly observed, the cause of which possibly being that the
point of reference used here was the lateral condyle and not the posterior condyle,
perhaps disguising subtle changes at the neck or condylar head that influence the
gonial angle.
Recently Sella-Tunis et al.[6] reported a strong correlation of muscle size and
mandibular shape in young adult individuals, which was not evidenced by traditional
morphometry.
As anticipated, the edentition was found to affect in a predictable way the mandibular
morphology. The main shape variations observed by the two methods were a decrease
of mandibular body height, a widening in the cross sectional morphology on the
symphysis, a shorten-narrowed Ramus and a deeper sigmoid notch, in the partial or
total edentition groups, compared to the full dentition group. In this study, the small
number of samples made it difficult to statistically record significant results and to
correlate the results to other variables such as gender or function. Nevertheless, in an
exploratory approach, the general patterns of morphological variations associated with
edentition which have been reported in literature could be measured by traditional
morphometrics and visualized with 3D GM. This methodology should provide a more
accurate and detailed definition of shape variations, which is critical in a clinical
context. It is also necessary to increase the number of samples to improve statistical
power.
Ethical approval: All procedures performed in studies involving human cadavers were
in accordance with the ethical standards of the institutional research committee and
with the 1964 Helsinki declaration and its later amendments or comparable ethical
standards.
Informed consent: This article does not contain patient data.
Declarations of interest: none.
5. ACKNOWLEDGMENTS
Authors would like to acknowledge the contribution of Dr. Kathia Chaumoître
(Radiology Service-Hospital Nord-Marseille) for her collaboration.
6. REFERENCES
[1] Morant GM, Adyanthaya NK. A BIOMETRIC STUDY OF THE HUMAN MANDIBLE. Biometrika.
1936;28(1-2):84-122.
[2] Humphrey LT, Dean MC, Stringer CB. Morphological variation in great ape and modern
human mandibles. J Anat. 1999;195 ( Pt 4):491-513. PubMed PMID: 10634689; PubMed
Central PMCID: PMCPMC1468021.
[3] Nicholson E, Harvati K. Quantitative analysis of human mandibular shape using three-
dimensional geometric morphometrics. Am J Phys Anthropol. 2006;131(3):368-83. doi:
10.1002/ajpa.20425. PubMed PMID: 16617436.
[4] Puisoru M, Forna N, Fatu AM, Fatu R, Fatu C. Analysis of mandibular variability in humans of
different geographic areas. Annals of Anatomy-Anatomischer Anzeiger. 2006;188(6):547-54.
doi: 10.1016/j.aanat.2006.05.015. PubMed PMID: WOS:000242378700010.
[5] Swasty D, Lee J, Huang JC, Maki K, Gansky SA, Hatcher D, et al. Cross-sectional human
mandibular morphology as assessed in vivo by cone-beam computed tomography in patients
with different vertical facial dimensions. American Journal of Orthodontics and Dentofacial
Orthopedics. 2011;139(4, Supplement):e377-e89. doi:
http://dx.doi.org/10.1016/j.ajodo.2009.10.039.
[6] Sella-Tunis T, Pokhojaev A, Sarig R, O'Higgins P, May H. Human mandibular shape is
associated with masticatory muscle force. Sci Rep. 2018;8(1):6042. Epub 2018/04/16. doi:
10.1038/s41598-018-24293-3. PubMed PMID: 29662127; PubMed Central PMCID:
PMCPMC5902585.
[7] Enlow DH. A morphogenetic analysis of facial growth. Am J Orthod. 1966;52(4):283-99.
PubMed PMID: 5217789.
[8] Coquerelle M, Bookstein FL, Braga J, Halazonetis DJ, Weber GW, Mitteroecker P. Sexual
dimorphism of the human mandible and its association with dental development. Am J Phys
Anthropol. 2011;145(2):192-202. Epub 2011/03/01. doi: 10.1002/ajpa.21485. PubMed PMID:
21365613.
[9] Franklin D, Cardini A, O'Higgins P, Oxnard CE, Dadour I. Mandibular morphology as an
indicator of human subadult age: geometric morphometric approaches. Forensic Sci Med
Pathol. 2008;4(2):91-9. doi: 10.1007/s12024-007-9015-7. PubMed PMID: 19291478.
[10] Kingsmill VJ. Post-extraction remodeling of the adult mandible. Critical Reviews in Oral
Biology & Medicine. 1999;10(3):384-404. PubMed PMID: WOS:000085741400009.
[11] Enlow DH, Bianco HJ, Eklund S. REMODELING OF EDENTULOUS MANDIBLE. Journal of
Prosthetic Dentistry. 1976;36(6):685-93. doi: 10.1016/0022-3913(76)90035-4. PubMed PMID:
WOS:A1976CN33300012.
[12] Chrcanovic BR, Abreu MH, Custódio AL. Morphological variation in dentate and
edentulous human mandibles. Surg Radiol Anat. 2011;33(3):203-13. Epub 2010/09/29. doi:
10.1007/s00276-010-0731-4. PubMed PMID: 20878404.
[13] Ozturk CN, Ozturk C, Bozkurt M, Uygur HS, Papay FA, Zins JE. Dentition, bone loss, and the
aging of the mandible. Aesthet Surg J. 2013;33(7):967-74. Epub 2013/09/10. doi:
10.1177/1090820X13503473. PubMed PMID: 24023258.
[14] Hutchinson EF, Farella M, Kramer B. Importance of teeth in maintaining the morphology
of the adult mandible in humans. Eur J Oral Sci. 2015;123(5):341-9. Epub 2015/08/19. doi:
10.1111/eos.12203. PubMed PMID: 26287722.
[15] Cawood JI, Howell RA. A classification of the edentulous jaws. International Journal of Oral
and Maxillofacial Surgery. 1988;17(4):232-6. doi: http://dx.doi.org/10.1016/S0901-
5027(88)80047-X.
[16] Mercier P, Lafontant R. Residual alveolar ridge atrophy: classification and influence of
facial morphology. J Prosthet Dent. 1979;41(1):90-100. PubMed PMID: 281529.
[17] Huumonen S, Sipila K, Haikola B, Tapio M, Soderholm AL, Remes-Lyly T, et al. Influence of
edentulousness on gonial angle, ramus and condylar height. Journal of Oral Rehabilitation.
2010;37(1):34-8. doi: 10.1111/j.1365-2842.2009.02022.x. PubMed PMID:
WOS:000272581700006.
[18] Uma M, Shetty R, Shenoy KK. Cephalometric: evaluation of influence of edentulousness on
mandibular morphology: a comparative study. J Indian Prosthodont Soc. 2013;13(3):269-73.
doi: 10.1007/s13191-012-0213-y. PubMed PMID: 24431746; PubMed Central PMCID:
PMCPMC3732722.
[19] Okşayan R, Asarkaya B, Palta N, Şimşek İ, Sökücü O, İşman E. Effects of edentulism on
mandibular morphology: evaluation of panoramic radiographs. ScientificWorldJournal.
2014;2014:254932. doi: 10.1155/2014/254932. PubMed PMID: 25202718; PubMed Central
PMCID: PMCPMC4151542.
[20] Mantini S, Ripani M. Modern morphometry: new perspectives in physical anthropology. N
Biotechnol. 2009;25(5):325-30. Epub 2009/04/05. doi: 10.1016/j.nbt.2009.03.009. PubMed
PMID: 19491048.
[21] Toro Ibacache MV, Manriquez Soto G, Suazo Galdames I. Morfometría Geométrica y el
Estudio de las Formas Biológicas: De la Morfología Descriptiva a la Morfología Cuantitativa.
International Journal of Morphology. 2010;28:977-90.
[22] Adams DC, Rohlf FJ, Slice DE. Geometric morphometrics: Ten years of progress following
the ‘revolution’. Italian Journal of Zoology. 2004;71(1):5-16. doi:
10.1080/11250000409356545.
[23] Klingenberg CP. Visualizations in geometric morphometrics: how to read and how to make
graphs showing shape changes. Italian Journal of Mammalogy. 2013;24(1):15-24. Epub 2013-
03-05. doi: 10.4404/hystrix-24.1-7691.
[24] Klingenberg CP, Barluenga M, Meyer A. Shape analysis of symmetric structures:
quantifying variation among individuals and asymmetry. Evolution. 2002;56(10):1909-20.
PubMed PMID: 12449478.
[25] Hammer Ø, Harper DAT, Ryan PD. PAST: Paleontological statistics software package for
education and data analysis. Palaeontologia Electronica. 2001;4(1):9.
[26] Wiley DF, N. Amenta, D. A. Alcantara, D. Ghosh, Y. J. Kil, E., Delson WH-S, F. J. Rohlf, K. St.
John, and B. Hamann, editors. Evolutionary Morphing. Proceedings of IEEE Visualization
2005 VIS '05; 2005; Minneapolis.
[27] Fruciano C. Measurement error in geometric morphometrics. Dev Genes Evol.
2016;226(3):139-58. Epub 2016/04/01. doi: 10.1007/s00427-016-0537-4. PubMed PMID:
27038025.
[28] Klingenberg CP. MorphoJ: an integrated software package for geometric morphometrics.
Mol Ecol Resour. 2011;11(2):353-7. Epub 2010/10/05. doi: 10.1111/j.1755-0998.2010.02924.x.
PubMed PMID: 21429143.
[29] Drake AG, Klingenberg CP. Large-scale diversification of skull shape in domestic dogs:
disparity and modularity. Am Nat. 2010;175(3):289-301. doi: 10.1086/650372. PubMed PMID:
20095825.
[30] Guevara Perez SV, de la Rosa Castolo G, Thollon L, Behr M. A 3D characterization method
of geometric variation in edentulous mandibles. Morphologie. 2018 Dec;102(339):255-262.
doi: 10.1016/j.morpho.2018.08.001. PubMed PMID:30197034.
[31] Sbordone C, Toti P, Brevi B, Martuscelli R, Sbordone L, Di Spirito F. Computed
tomography-aided descriptive analysis of maxillary and mandibular atrophies. J Stomatol Oral
Maxillofac Surg. 2018 Dec. In press. https://doi.org/10.1016/j.jormas.2018.12.006.
TABLES
Table 1. Mean data of measures variables for each group: G1 full dentition mandibles. G2 partial edentition and G3 total edentition. Distances are shown in mm and angle in grades. The landmarks definition are shown in Fig.1. The relative variations are showing in percentage of the G1 measure.
G1 G2 G3 Morphologic variation
Symphysis High
(Sy-InfDe distance)
32.27 27.09
(-16.05%)
20.18
(-37.46%)
Decrease in symphysis
high
Body height at mental hole
(Sup M-InfM distance)
29.51 22.40
(-24.09%)
17.24
(-41.57%)
Decrease in mid corpus
high
Body height at retro-molar level
(RetMolExt-AntGo distance)
26. 14 18.11
(-30.71%)
18.12
(-30.68%)
Decrease in posterior
corpus high
Symphysis width
(Me-MeSp distance)
16.45 15.49
(-5.8%)
17.72
(+7.72%)
Wider symphysis in totally
edentulous
Ramus width
(Rant-Rpost distance)
33.77 26.01
(-22.97%)
30.01
(-11.13%)
Narrow ramus in partially
and totally edentulous
Gonial angle (°) 118.48 124.60
(+5.16%)
117.69
(-0.66%)
Wider angle for G2
Mandibular body length
(Me-Go distance)
88.46 78.60
(-11.14%)
83.64
-5.44%)
Shorter corpus
Total mandibular length
(Me-Colsup distance)
128.04 119.20
(-6.90%)
120.94
(-5.54%)
Decrease in mandibular
length
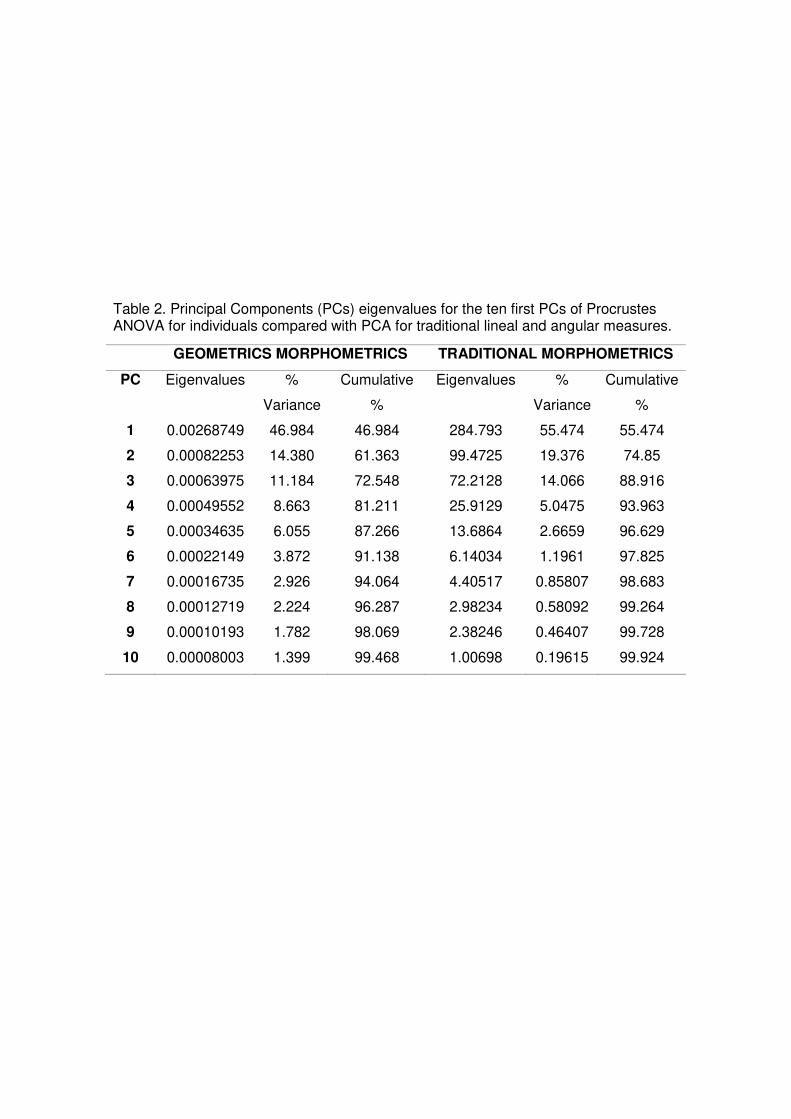
Table 2. Principal Components (PCs) eigenvalues for the ten first PCs of Procrustes ANOVA for individuals compared with PCA for traditional lineal and angular measures.
GEOMETRICS MORPHOMETRICS TRADITIONAL MORPHOMETRICS
PC Eigenvalues %
Variance
Cumulative
%
Eigenvalues %
Variance
Cumulative
%
1 0.00268749 46.984 46.984 284.793 55.474 55.474
2 0.00082253 14.380 61.363 99.4725 19.376 74.85
3 0.00063975 11.184 72.548 72.2128 14.066 88.916
4 0.00049552 8.663 81.211 25.9129 5.0475 93.963
5 0.00034635 6.055 87.266 13.6864 2.6659 96.629
6 0.00022149 3.872 91.138 6.14034 1.1961 97.825
7 0.00016735 2.926 94.064 4.40517 0.85807 98.683
8 0.00012719 2.224 96.287 2.98234 0.58092 99.264
9 0.00010193 1.782 98.069 2.38246 0.46407 99.728
10 0.00008003 1.399 99.468 1.00698 0.19615 99.924
FIGURE CAPTIONS
Fig. 1 Measurement protocol on the mandible for linear and angular measurements
with traditional morphometrics (a.), and landmarks definition for geometrics
morphometrics (b.)
Fig. 2 Bar graphic for means of lineal and angle measurements for the three groups of
mandibles, the variables definition are shown in the Fig 1a.
Fig. 3 Principal Components (PC) analyzed for mandibular shape with the three groups
combined plots for the three first PCs scores: a) Plots for PC1 Vs PC2 and PC1 Vs
PC3 obtained by GM and shape changes associated to three first PCs on the positive
and negative score direction (scale factor 0.1 and -0.1 respectively). b) Plots for PC1
Vs PC2 and PC1 Vs PC3 obtained by traditional morphometrics.
Fig. 4 Shape difference between the group’s average configurations. a) 3D surface
models of each group average. b) Superimposition of the meshes between G1 and
G3.