
Exploratory Data Analysis of Indian Hotel Benchmarking Dataset ...
23
U.S.- India Joint Center for Building Energy Research and Development (CBERD) Exploratory Data Analysis of Indian Hotel Benchmarking Dataset: Key Findings and Recommendations India team: Saket Sarraf, Shilpi Anand United States team: Paul Mathew Technical Report July 2014
-
Upload
hoangnguyet -
Category
Documents
-
view
225 -
download
1
Transcript of Exploratory Data Analysis of Indian Hotel Benchmarking Dataset ...
U.S.- India Joint
Center for Building Energy Research and Development
(CBERD)
Exploratory Data Analysis of Indian Hotel Benchmarking Dataset: Key Findings and
Recommendations
India team: Saket Sarraf, Shilpi Anand United States team: Paul Mathew
Technical Report
July 2014

This page is intentionally left blank

Acknowledgements
The U.S. Department of Energy (DOE) and the Department of Science and Technology (DST),
Government of India (GOI) provided joint funding for work under the U.S.–India Partnership to
Advance Clean Energy Research (PACE-R) program’s “U.S.–India Joint Center for Building Energy
Research and Development” (CBERD) project. The Assistant Secretary for Energy Efficiency and
Renewable Energy, Office of Building Technology, State and Community Programs, of the U.S. DOE
under Contract No. DE-AC02-05CH11231 supports the U.S. CBERD activity. The DST, GOI,
administered by Indo-U.S. Science and Technology Forum, supports the Indian CBERD activity.
CBERD thanks Schneider Electric India for supporting this analysis effort. Contact info: Saket Sarraf Email ID: [email protected] Paul Mathew Email ID: [email protected]
Disclaimer
This document was prepared as an account of work sponsored by the United States Government.
While this document is believed to contain correct information, neither the United States Government
nor any agency thereof, nor The Regents of the University of California, nor any of their employees,
makes any warranty, express or implied, or assumes any legal responsibility for the accuracy,
completeness, or usefulness of any information, apparatus, product, or process disclosed, or represents
that its use would not infringe privately owned rights. Reference herein to any specific commercial
product, process, or service by its trade name, trademark, manufacturer, or otherwise, does not
necessarily constitute or imply its endorsement, recommendation, or favoring by the United States
Government or any agency thereof, or The Regents of the University of California. The views and
opinions of authors expressed herein do not necessarily state or reflect those of the United States
Government or any agency thereof or The Regents of the University of California.
Please cite this document as:

This page is intentionally left blank
Centre for advanced Research in Building Science & Energy
Document No. - Task 2.2/01/14-15
Exploratory Data Analysis of Indian Hotel Benchmarking Dataset: Key Findings and
Recommendations
Author
India team: Saket Sarraf, Shilpi Anand
United States team: Paul Mathew
July, 2014
i
Table of Contents 1 Motivation 1
2 Scope of this Analysis 1
3 Dataset features 1
3.1 Sampling distribution 1
3.2 Area and Climate 2
4 UNIVARIATE ANALYSIS - KEY FINDINGS 3
4.1 Hotel Size 3
4.2 Number of Rooms 4
4.3 Energy Management Variables 4
4.4 Events 5
4.5 Installed Loads – Hotels vs. Hospitals 5
4.6 AC Capacity 6
4.7 Energy Sources 6
4.8 Grid electricity percentage of total site energy by location 7
4.9 Energy End uses 7
4.10 Correlation- Between the area variables with site total energy use. 7
4.11 Correlation- Number of Rooms, Pools, Spa rooms & Restaurant 8
5 BIVARIATE ANALYSIS - KEY FINDINGS 9
5.1 Site energy vs. Built-up Area, Number of Rooms 9
5.2 Site energy and Overnight guests, Restaurant covers 9
5.3 Energy Performance Index (EPI) and Hotel type 10
5.4 Energy Performance Index (EPI) and Climate 10
5.5 Energy Performance Index (EPI) and Size 11
5.6 EPI and year of construction 11
5.7 EPI and Energy management 12
5.8 EPI and Room occupancy 12
6 Regression analysis for Hotels 12
6.1 Data filter 12
6.2 Final variables 13
6.2.1 Dependent variable 13
6.2.2 Independent variable 13
6.3 Power transformation of the variables 13
6.4 Study of outliers in the regression equation 14
ii
6.5 Final regression and diagnostics 14
7 Conclusion 15
8 Recommendations 16
8.1 Recommendations for Benchmark model development 16
8.2 Policy Implications 16
List of Figures Figure 1: Distribution of hotels across cities 2 Figure 2: Distribution of hotels across climate zones 2 Figure 3: Distribution of hotels based on star rating 2 Figure 4: Distribution of hotels based on hotel type 2 Figure 5: Sampling distribution 2 Figure 6: Size of the hotels across various star ratings 3 Figure 7: Distribution across Business and Non business hotels 3 Figure 8: Distribution of rooms across various star-ratings hotels 4 Figure 9: Areas across Business and Non business hotels 4 Figure 10: Energy management variable responses 4 Figure 11: Number of events per year (number of conferences, number of weddings and number of wedding guests in a year) 5 Figure 12: Install loads density across Hotels and Hospitals 5 Figure 13: Air Condition capacity 6 Figure 14: Energy source- Percentage share of electricity and fuel type mix 6 Figure 15: Grid energy percentage of total site energy by location 7 Figure 16: Energy end use as percentage of total site energy 7 Figure 17: Correlation across various area variables 8 Figure 18: Correlation across number of rooms, pools, spa rooms and restaurants 8 Figure 19: Site energy vs. Built-up area 9 Figure 20: Site energy vs. number of rooms 9 Figure 21: Site energy vs. overnight guests 9 Figure 22: Site energy vs. restaurants convers per year 9 Figure 23: Area-based Energy Performance Index (EPI) and various star ratings 10 Figure 24: Room-based Energy Performance Index (EPI) and various star ratings 10 Figure 25: Area-based Energy Performance Index (EPI) and various star ratings 10 Figure 26: Room-based Energy Performance Index (EPI) and various star ratings 10 Figure 27: Area-based Energy Performance Index (EPI) and Built-up area excluding parking (m. sq.) 11 Figure 28: Room-based Energy Performance Index (EPI) and total number of rooms 11 Figure 29: Energy performance Index (EPI) and year of construction 11 Figure 30: Linear regression output 14 Figure 31: Modified linear regression (log transformation) 14 Figure 32: Log transformation details of the variable 14 Figure 33: Final regression equation 15 Figure 34: Residual plots (Final regression equation) 15 Figure 35: Diagnostics plots (Final regression) 15 Figure 36: Influence plot (Final regression) 15
1
1 MOTIVATION
The ECO-III Indian hotel benchmarking dataset affords an opportunity to extend current state of the art in order to develop a more robust performance rating (BEE Star Rating). It will also inform benchmarking program and policy implementation through data-driven analysis. This will improve the accuracy of existing hotel benchmark models by including more building asset and operational characteristics. This analysis will help analysing- (1) which characteristics should be included or excluded in model. (2) How strong is their relationship to the dependent variable i.e. energy use? (3) What is the marginal improvement in benchmarking accuracy as more characteristics are included?
2 SCOPE OF THIS ANALYSIS
Scopes of this analysis are as follows- Univariate (single-variable) analysis- This includes analysis for basic data trends; diagnostics and
data cleansing. Bivariate (two-variable) analysis- This analyze the nature and strength of relationship between two
variables using regression analysis. Screen and prioritize variables for inclusion in model. Multivariate (multiple variables) analysis - Conduct multivariate regression analysis with different
sets of variables. Assess impact on model accuracy with inclusion/exclusion of different variables.
3 DATASET FEATURES
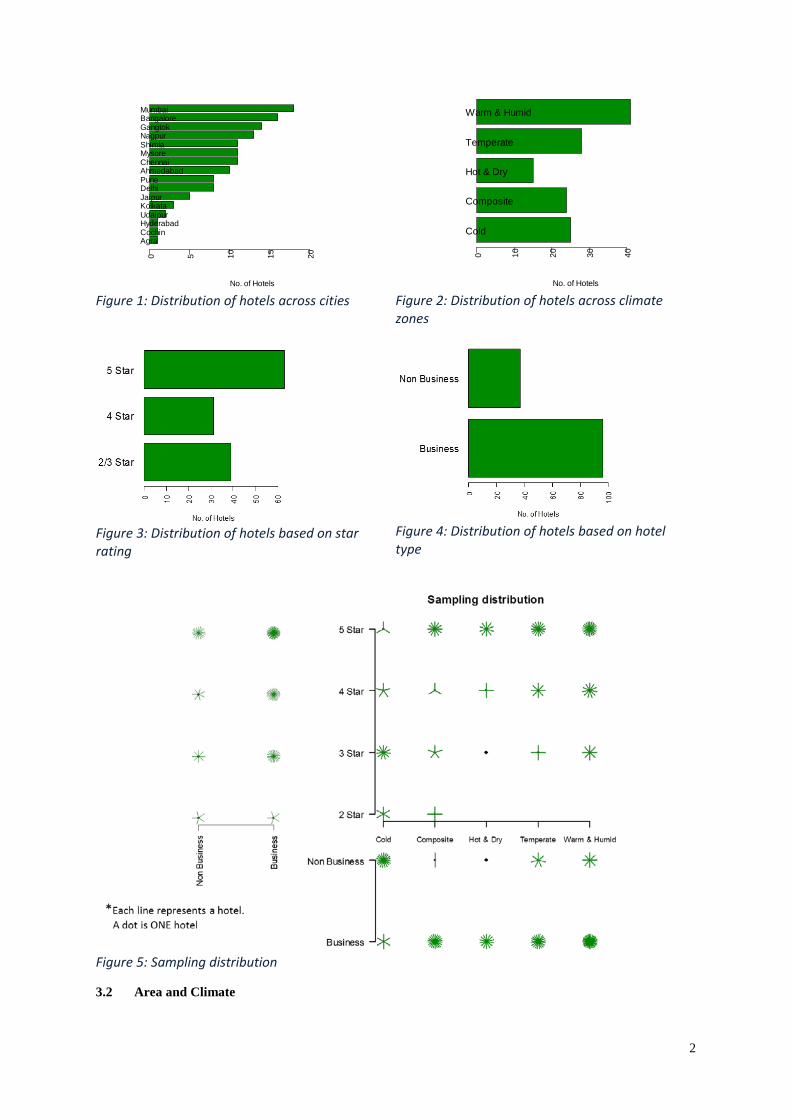
The data set consist of details from 133 buildings. Core fields include building size, location, energy use, hotel type, star rating, no. of rooms, occupancy. It also includes various measures of area: total built up, ex. Parking, carpet, service, etc. Many additional fields on system and use characteristics were also collected which includes- AC capacity, Installed loads for lighting, AC, plugs, EMCS, Audit, number of banquets, conference attendees, restaurants, Laundry service on site and so on, a total of 131 variables were collected. (Please refer Figure 1 Figure 2 Figure 3 and Figure 4)
All the climates are represented fairly well. Note that we have such a high number from Gangtok. This makes cold over-represented. Sample is focused on Business & Non business categories, Business hotels becomes the major part of Sample set. 2 star hotel are less in number, depicting this type can be ignored for the new data collection. New sample set can focus on 3, 4 and 5 star categories. 3.1 Sampling distribution The data collected tried to capture maximum dynamics of Indian hotel. Due to unavailability or inaccessibility of the required data. Figure 5 shows the sampling distribution, where 5-star category has the maximum number in the sample set representing business category of warm & humid climate. 2-star category only represent cold and composite climate. Business category is mostly less in number in cold climate, while in other climate fairly represented. Leisure or non-business formulates the major part of cold climate.
2
Figure 1: Distribution of hotels across cities
Figure 2: Distribution of hotels across climate zones
Figure 3: Distribution of hotels based on star rating
Figure 4: Distribution of hotels based on hotel type
Figure 5: Sampling distribution
3.2 Area and Climate
AgraCochinHyderabadUdaipurKolkataJaipurDelhiPuneAhmedabadChennaiMysoreShimlaNagpurGangtokBangaloreMumbai
No. of Hotels
0 5 10 15 20
Cold
Composite
Hot & Dry
Temperate
Warm & Humid
No. of Hotels
0 10 20 30 40
3
4 UNIVARIATE ANALYSIS - KEY FINDINGS
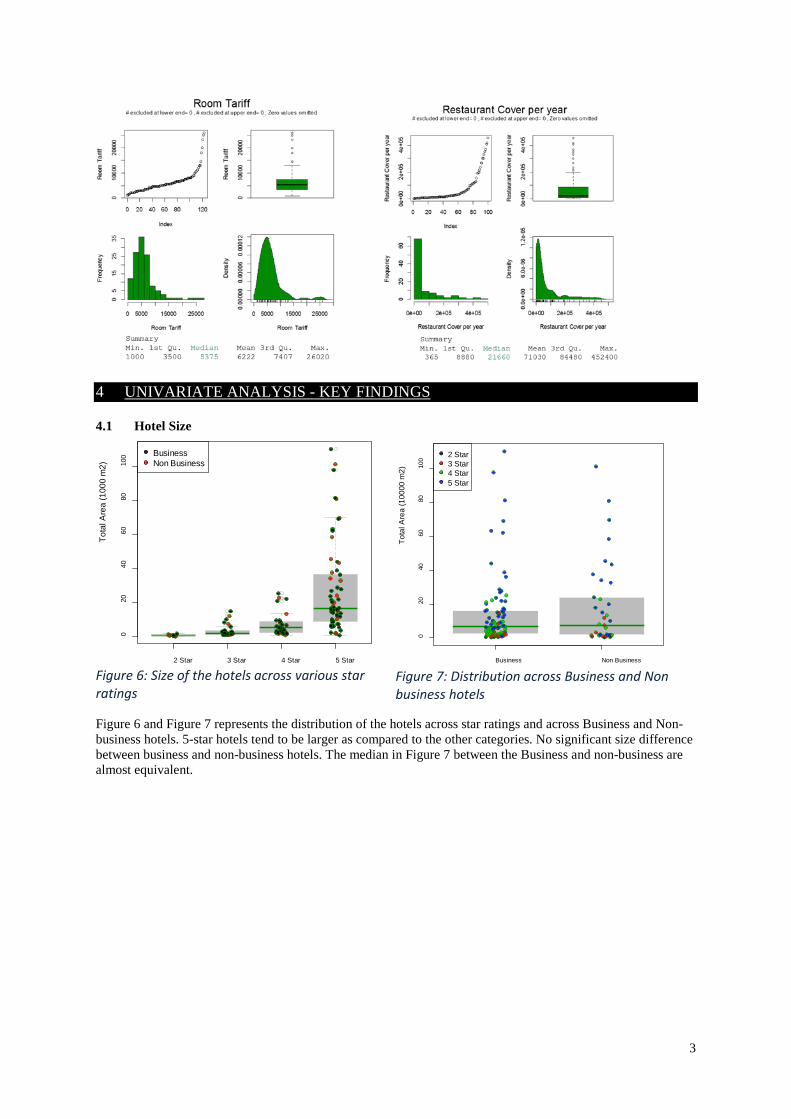
4.1 Hotel Size
Figure 6: Size of the hotels across various star ratings
Figure 7: Distribution across Business and Non business hotels
Figure 6 and Figure 7 represents the distribution of the hotels across star ratings and across Business and Non-business hotels. 5-star hotels tend to be larger as compared to the other categories. No significant size difference between business and non-business hotels. The median in Figure 7 between the Business and non-business are almost equivalent.
2 Star 3 Star 4 Star 5 Star
020
4060
8010
0
Tota
l Are
a (1
000
m2)
BusinessNon Business
Business Non Business
020
4060
8010
0
Tota
l Are
a (1
0000
m2)
2 Star3 Star4 Star5 Star
4
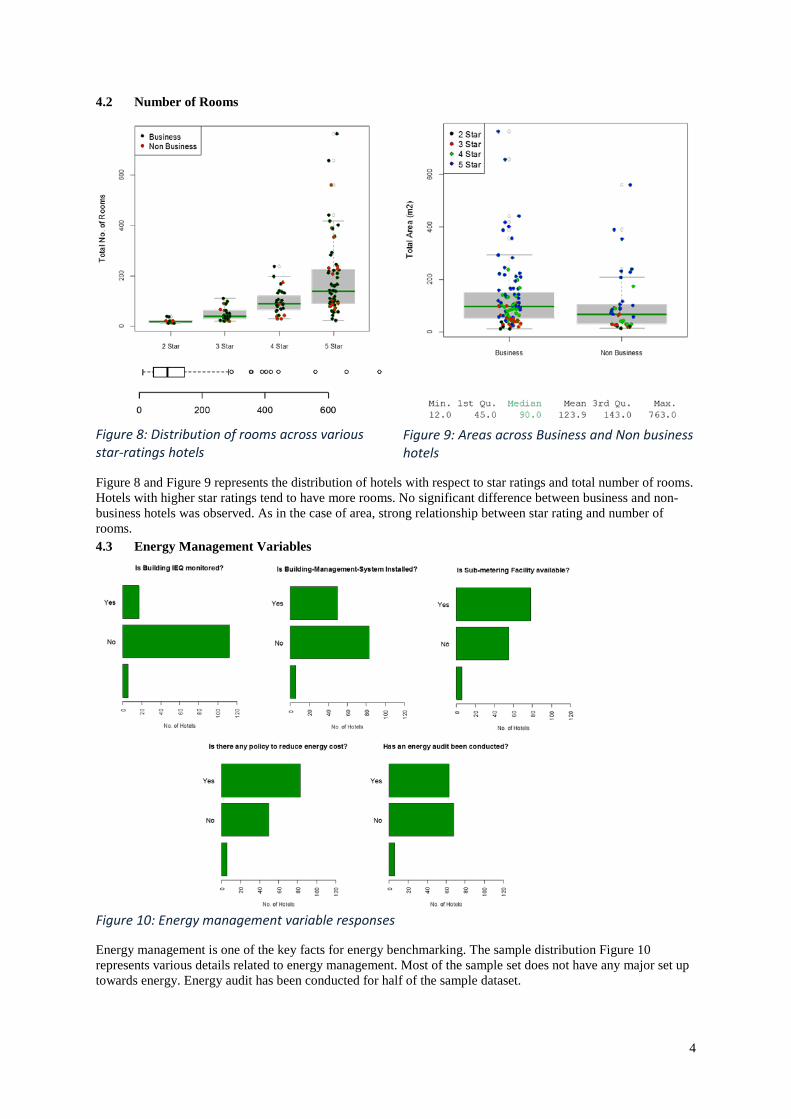
4.2 Number of Rooms
Figure 8: Distribution of rooms across various star-ratings hotels
Figure 9: Areas across Business and Non business hotels
Figure 8 and Figure 9 represents the distribution of hotels with respect to star ratings and total number of rooms. Hotels with higher star ratings tend to have more rooms. No significant difference between business and non-business hotels was observed. As in the case of area, strong relationship between star rating and number of rooms. 4.3 Energy Management Variables
Figure 10: Energy management variable responses
Energy management is one of the key facts for energy benchmarking. The sample distribution Figure 10 represents various details related to energy management. Most of the sample set does not have any major set up towards energy. Energy audit has been conducted for half of the sample dataset.
5
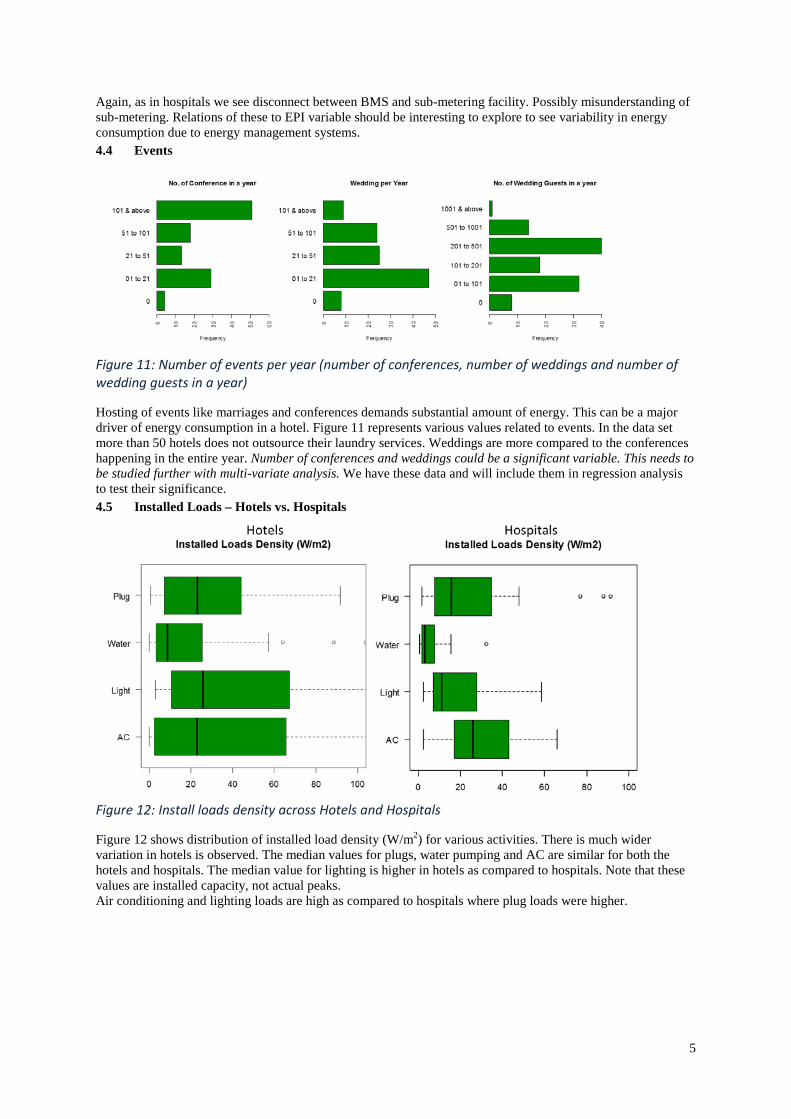
Again, as in hospitals we see disconnect between BMS and sub-metering facility. Possibly misunderstanding of sub-metering. Relations of these to EPI variable should be interesting to explore to see variability in energy consumption due to energy management systems. 4.4 Events
Figure 11: Number of events per year (number of conferences, number of weddings and number of wedding guests in a year)
Hosting of events like marriages and conferences demands substantial amount of energy. This can be a major driver of energy consumption in a hotel. Figure 11 represents various values related to events. In the data set more than 50 hotels does not outsource their laundry services. Weddings are more compared to the conferences happening in the entire year. Number of conferences and weddings could be a significant variable. This needs to be studied further with multi-variate analysis. We have these data and will include them in regression analysis to test their significance. 4.5 Installed Loads – Hotels vs. Hospitals
Figure 12: Install loads density across Hotels and Hospitals
Figure 12 shows distribution of installed load density (W/m2) for various activities. There is much wider variation in hotels is observed. The median values for plugs, water pumping and AC are similar for both the hotels and hospitals. The median value for lighting is higher in hotels as compared to hospitals. Note that these values are installed capacity, not actual peaks. Air conditioning and lighting loads are high as compared to hospitals where plug loads were higher.
6
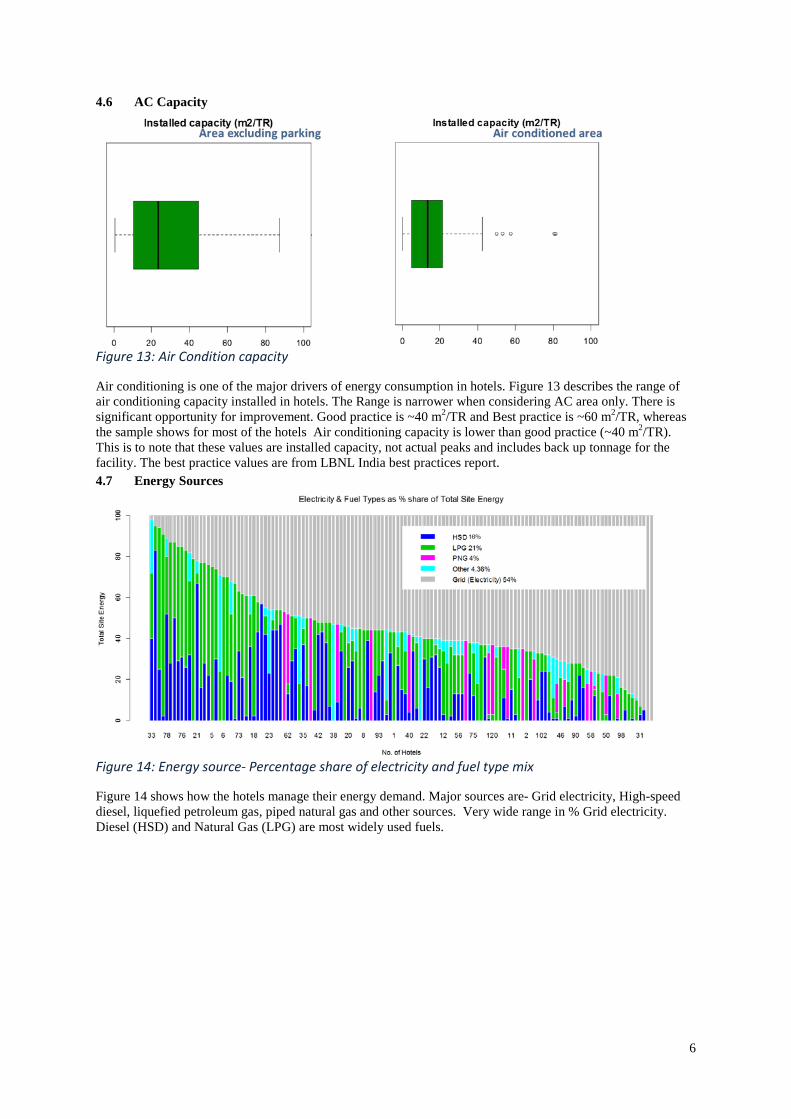
4.6 AC Capacity
Figure 13: Air Condition capacity
Air conditioning is one of the major drivers of energy consumption in hotels. Figure 13 describes the range of air conditioning capacity installed in hotels. The Range is narrower when considering AC area only. There is significant opportunity for improvement. Good practice is ~40 m2/TR and Best practice is ~60 m2/TR, whereas the sample shows for most of the hotels Air conditioning capacity is lower than good practice (~40 m2/TR). This is to note that these values are installed capacity, not actual peaks and includes back up tonnage for the facility. The best practice values are from LBNL India best practices report. 4.7 Energy Sources
Figure 14: Energy source- Percentage share of electricity and fuel type mix
Figure 14 shows how the hotels manage their energy demand. Major sources are- Grid electricity, High-speed diesel, liquefied petroleum gas, piped natural gas and other sources. Very wide range in % Grid electricity. Diesel (HSD) and Natural Gas (LPG) are most widely used fuels.
7
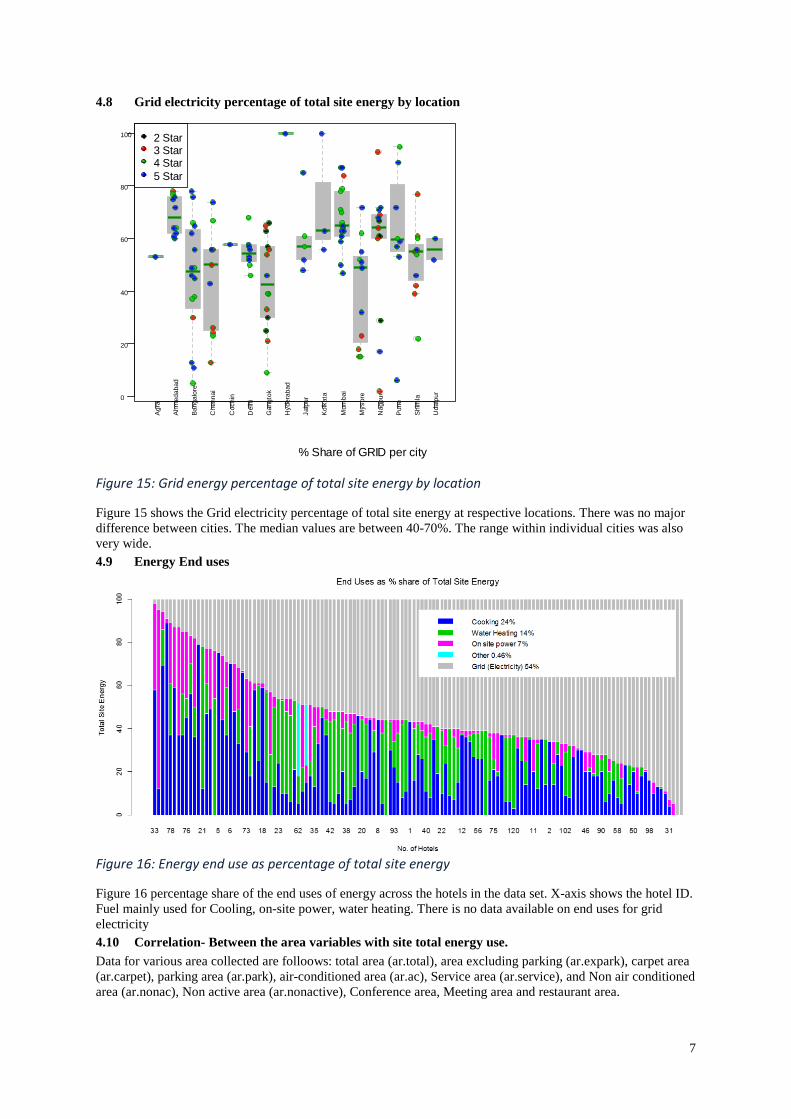
4.8 Grid electricity percentage of total site energy by location
Figure 15: Grid energy percentage of total site energy by location
Figure 15 shows the Grid electricity percentage of total site energy at respective locations. There was no major difference between cities. The median values are between 40-70%. The range within individual cities was also very wide. 4.9 Energy End uses
Figure 16: Energy end use as percentage of total site energy
Figure 16 percentage share of the end uses of energy across the hotels in the data set. X-axis shows the hotel ID. Fuel mainly used for Cooling, on-site power, water heating. There is no data available on end uses for grid electricity 4.10 Correlation- Between the area variables with site total energy use. Data for various area collected are folloows: total area (ar.total), area excluding parking (ar.expark), carpet area (ar.carpet), parking area (ar.park), air-conditioned area (ar.ac), Service area (ar.service), and Non air conditioned area (ar.nonac), Non active area (ar.nonactive), Conference area, Meeting area and restaurant area.
Agr
a
Ahm
edab
ad
Ban
galo
re
Che
nnai
Coc
hin
Del
hi
Gan
gtok
Hyd
erab
ad
Jaip
ur
Kol
kata
Mum
bai
Mys
ore
Nag
pur
Pun
e
Shi
mla
Uda
ipur0
20
40
60
80
100
% Share of GRID per city
2 Star3 Star4 Star5 Star
8
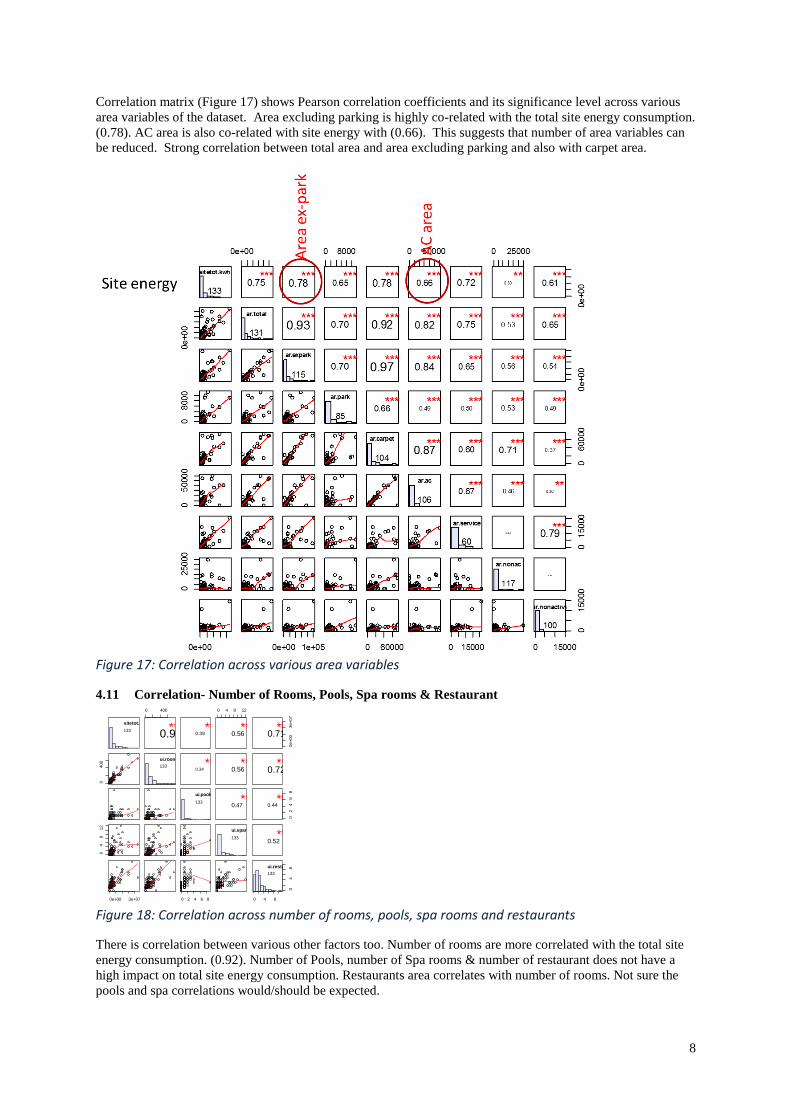
Correlation matrix (Figure 17) shows Pearson correlation coefficients and its significance level across various area variables of the dataset. Area excluding parking is highly co-related with the total site energy consumption. (0.78). AC area is also co-related with site energy with (0.66). This suggests that number of area variables can be reduced. Strong correlation between total area and area excluding parking and also with carpet area.
Figure 17: Correlation across various area variables
4.11 Correlation- Number of Rooms, Pools, Spa rooms & Restaurant
Figure 18: Correlation across number of rooms, pools, spa rooms and restaurants
There is correlation between various other factors too. Number of rooms are more correlated with the total site energy consumption. (0.92). Number of Pools, number of Spa rooms & number of restaurant does not have a high impact on total site energy consumption. Restaurants area correlates with number of rooms. Not sure the pools and spa correlations would/should be expected.
133sitetot.k
0 400
0.9** 0.39**
0 4 8 12
0.56**
0e+0
03e
+07
0.71**
040
0
133ui.room
0.34**
0.56** 0.72**
133
ui.pools
0.47**
02
46
8
0.44**
04
812
133
ui.sparo
0.52**
0e+00 3e+07 0 2 4 6 8 0 4 8
04
8
133ui.resta
9
5 BIVARIATE ANALYSIS - KEY FINDINGS
5.1 Site energy vs. Built-up Area, Number of Rooms
Figure 19: Site energy vs. Built-up area
Figure 20: Site energy vs. number of rooms
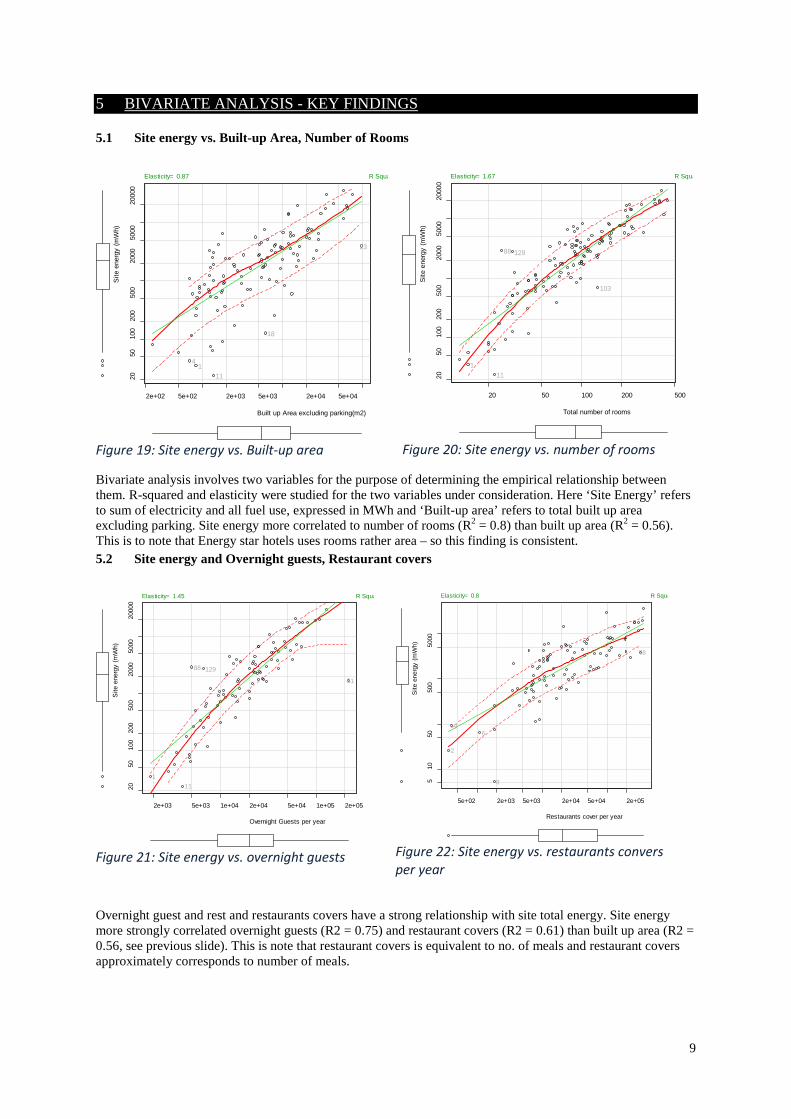
Bivariate analysis involves two variables for the purpose of determining the empirical relationship between them. R-squared and elasticity were studied for the two variables under consideration. Here ‘Site Energy’ refers to sum of electricity and all fuel use, expressed in MWh and ‘Built-up area’ refers to total built up area excluding parking. Site energy more correlated to number of rooms (R2 = 0.8) than built up area (R2 = 0.56). This is to note that Energy star hotels uses rooms rather area – so this finding is consistent. 5.2 Site energy and Overnight guests, Restaurant covers
Figure 21: Site energy vs. overnight guests
Figure 22: Site energy vs. restaurants convers per year
Overnight guest and rest and restaurants covers have a strong relationship with site total energy. Site energy more strongly correlated overnight guests (R2 = 0.75) and restaurant covers (R2 = 0.61) than built up area (R2 = 0.56, see previous slide). This is note that restaurant covers is equivalent to no. of meals and restaurant covers approximately corresponds to number of meals.
2e+02 5e+02 2e+03 5e+03 2e+04 5e+04
2050
100
200
500
2000
5000
2000
0
Built up Area excluding parking(m2)
Site
ene
rgy
(mW
h)
11
23
18
14
R Squa Elasticity= 0.87
20 50 100 200 500
2050
100
200
500
2000
5000
2000
0
Total number of roomsS
ite e
nerg
y (m
Wh)
88
11
129
103
1
R Squa Elasticity= 1.67
2e+03 5e+03 1e+04 2e+04 5e+04 1e+05 2e+05
2050
100
200
500
2000
5000
2000
0
Overnight Guests per year
Site
ene
rgy
(mW
h)
51
88
11
129
1
R Squa Elasticity= 1.45
5e+02 2e+03 5e+03 2e+04 5e+04 2e+05
510
5050
050
00
Restaurants cover per year
Site
ene
rgy
(mW
h)
8
2
9
78
6
R Squa Elasticity= 0.8
10
5.3 Energy Performance Index (EPI) and Hotel type
Figure 23: Area-based Energy Performance Index (EPI) and various star ratings
Figure 24: Room-based Energy Performance Index (EPI) and various star ratings
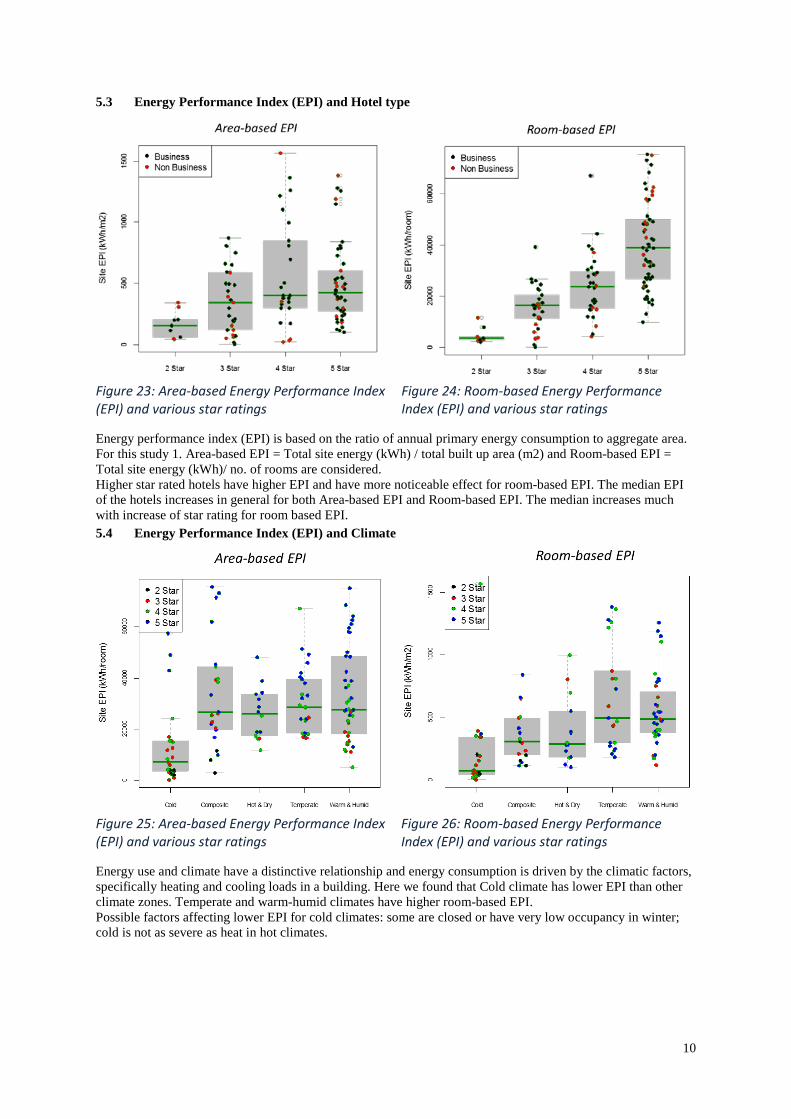
Energy performance index (EPI) is based on the ratio of annual primary energy consumption to aggregate area. For this study 1. Area-based EPI = Total site energy (kWh) / total built up area (m2) and Room-based EPI = Total site energy (kWh)/ no. of rooms are considered. Higher star rated hotels have higher EPI and have more noticeable effect for room-based EPI. The median EPI of the hotels increases in general for both Area-based EPI and Room-based EPI. The median increases much with increase of star rating for room based EPI. 5.4 Energy Performance Index (EPI) and Climate
Figure 25: Area-based Energy Performance Index (EPI) and various star ratings
Figure 26: Room-based Energy Performance Index (EPI) and various star ratings
Energy use and climate have a distinctive relationship and energy consumption is driven by the climatic factors, specifically heating and cooling loads in a building. Here we found that Cold climate has lower EPI than other climate zones. Temperate and warm-humid climates have higher room-based EPI. Possible factors affecting lower EPI for cold climates: some are closed or have very low occupancy in winter; cold is not as severe as heat in hot climates.
11
5.5 Energy Performance Index (EPI) and Size
Figure 27: Area-based Energy Performance Index (EPI) and Built-up area excluding parking (m. sq.)
Figure 28: Room-based Energy Performance Index (EPI) and total number of rooms
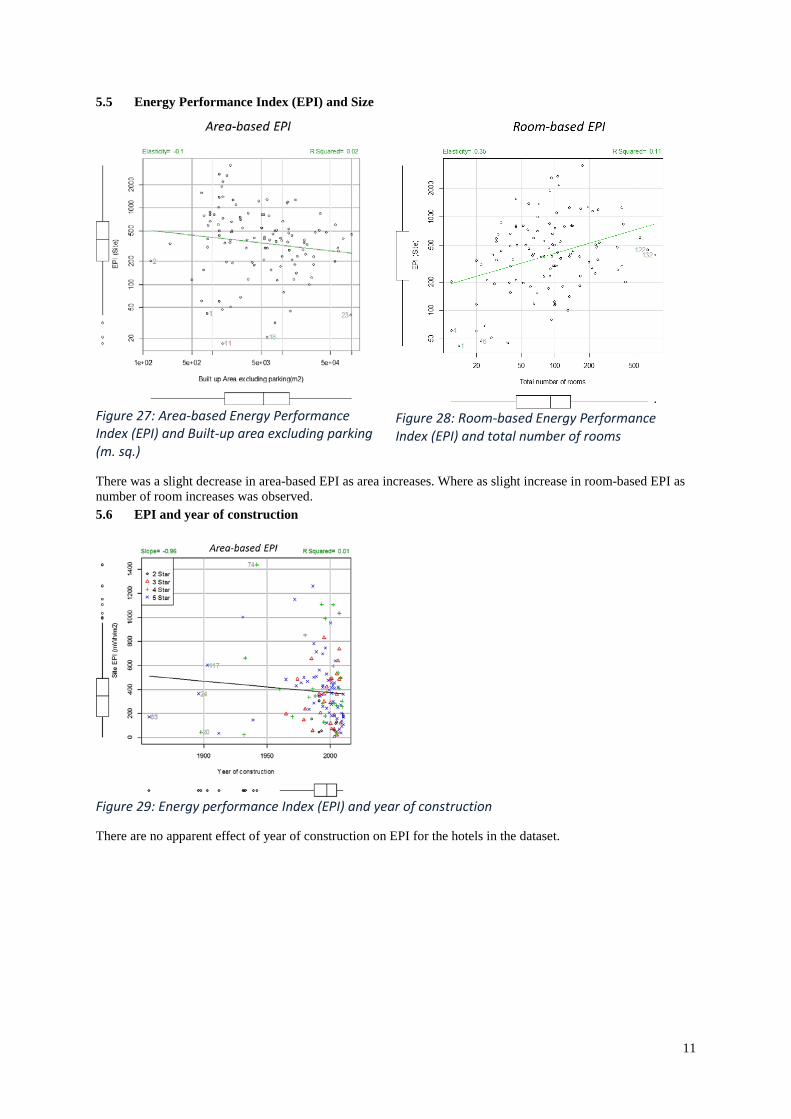
There was a slight decrease in area-based EPI as area increases. Where as slight increase in room-based EPI as number of room increases was observed. 5.6 EPI and year of construction
Figure 29: Energy performance Index (EPI) and year of construction
There are no apparent effect of year of construction on EPI for the hotels in the dataset.
12
5.7 EPI and Energy management
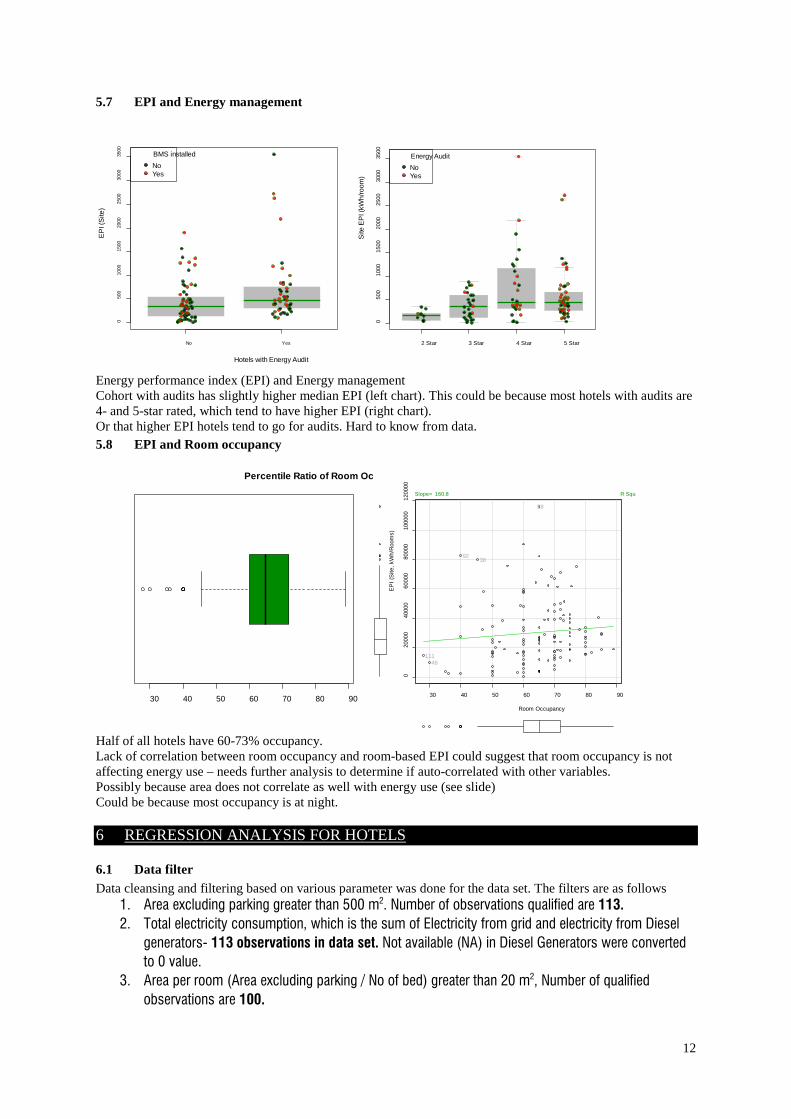
Energy performance index (EPI) and Energy management Cohort with audits has slightly higher median EPI (left chart). This could be because most hotels with audits are 4- and 5-star rated, which tend to have higher EPI (right chart). Or that higher EPI hotels tend to go for audits. Hard to know from data. 5.8 EPI and Room occupancy
Half of all hotels have 60-73% occupancy. Lack of correlation between room occupancy and room-based EPI could suggest that room occupancy is not affecting energy use – needs further analysis to determine if auto-correlated with other variables. Possibly because area does not correlate as well with energy use (see slide) Could be because most occupancy is at night.
6 REGRESSION ANALYSIS FOR HOTELS
6.1 Data filter Data cleansing and filtering based on various parameter was done for the data set. The filters are as follows
1. Area excluding parking greater than 500 m2. Number of observations qualified are 113. 2. Total electricity consumption, which is the sum of Electricity from grid and electricity from Diesel
generators- 113 observations in data set. Not available (NA) in Diesel Generators were converted to 0 value.
3. Area per room (Area excluding parking / No of bed) greater than 20 m2, Number of qualified observations are 100.
No Yes
050
010
0015
0020
0025
0030
0035
00
Hotels with Energy Audit
EP
I (S
ite)
BMS installedNoYes
2 Star 3 Star 4 Star 5 Star
050
010
0015
0020
0025
0030
0035
00
Site
EP
I (kW
h/ro
om)
Energy AuditNoYes
30 40 50 60 70 80 90
Percentile Ratio of Room Oc
30 40 50 60 70 80 90
020
000
4000
060
000
8000
010
0000
1200
00
Room Occupancy
EP
I (S
ite, k
Wh/
Roo
ms)
88
92
11148
38
R Squa Slope= 160.8
13
4. Area per room (Area excluding parking / No of bed) less than 600m2, Number of qualified observation are 99.
5. Energy Performance Index (EPI), which is Area excluding parking / total elec. Consumption, greater than 50, number of qualified observation are 81.
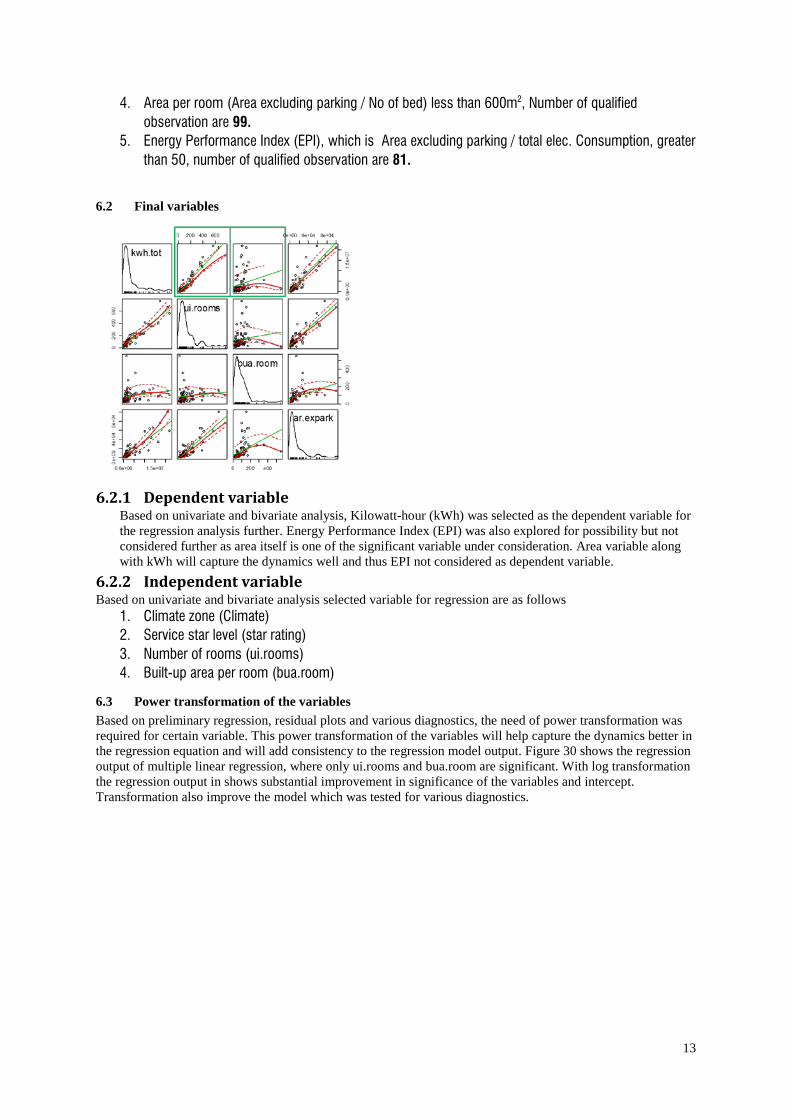
6.2 Final variables
6.2.1 Dependent variable
Based on univariate and bivariate analysis, Kilowatt-hour (kWh) was selected as the dependent variable for the regression analysis further. Energy Performance Index (EPI) was also explored for possibility but not considered further as area itself is one of the significant variable under consideration. Area variable along with kWh will capture the dynamics well and thus EPI not considered as dependent variable.
6.2.2 Independent variable Based on univariate and bivariate analysis selected variable for regression are as follows
1. Climate zone (Climate) 2. Service star level (star rating) 3. Number of rooms (ui.rooms) 4. Built-up area per room (bua.room)
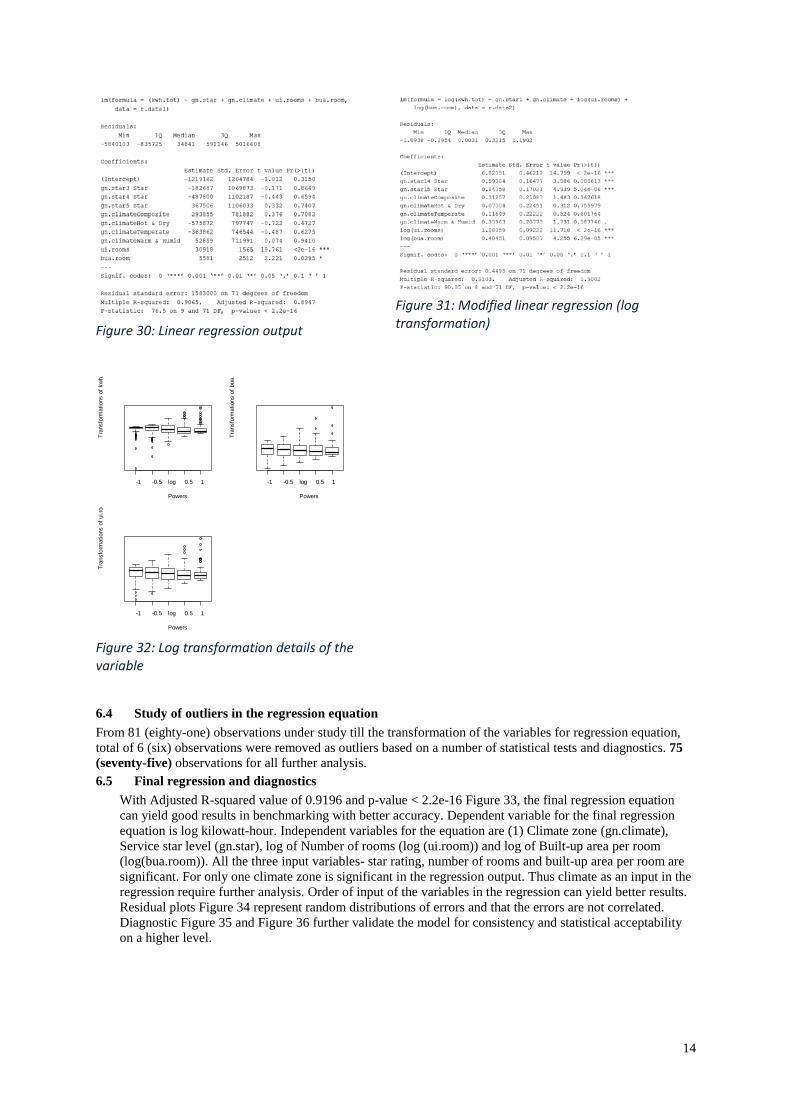
6.3 Power transformation of the variables Based on preliminary regression, residual plots and various diagnostics, the need of power transformation was required for certain variable. This power transformation of the variables will help capture the dynamics better in the regression equation and will add consistency to the regression model output. Figure 30 shows the regression output of multiple linear regression, where only ui.rooms and bua.room are significant. With log transformation the regression output in shows substantial improvement in significance of the variables and intercept. Transformation also improve the model which was tested for various diagnostics.
14
Figure 30: Linear regression output
Figure 31: Modified linear regression (log transformation)
Figure 32: Log transformation details of the variable
6.4 Study of outliers in the regression equation From 81 (eighty-one) observations under study till the transformation of the variables for regression equation, total of 6 (six) observations were removed as outliers based on a number of statistical tests and diagnostics. 75 (seventy-five) observations for all further analysis. 6.5 Final regression and diagnostics
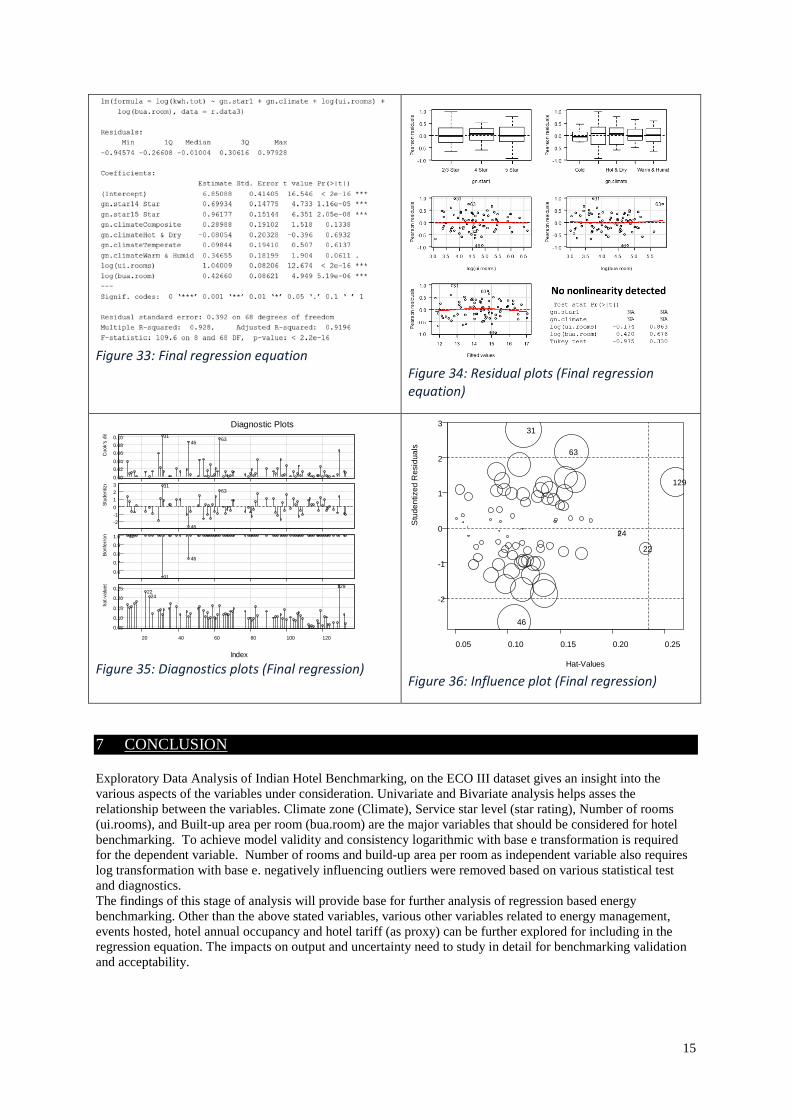
With Adjusted R-squared value of 0.9196 and p-value < 2.2e-16 Figure 33, the final regression equation can yield good results in benchmarking with better accuracy. Dependent variable for the final regression equation is log kilowatt-hour. Independent variables for the equation are (1) Climate zone (gn.climate), Service star level (gn.star), log of Number of rooms (log (ui.room)) and log of Built-up area per room (log(bua.room)). All the three input variables- star rating, number of rooms and built-up area per room are significant. For only one climate zone is significant in the regression output. Thus climate as an input in the regression require further analysis. Order of input of the variables in the regression can yield better results. Residual plots Figure 34 represent random distributions of errors and that the errors are not correlated. Diagnostic Figure 35 and Figure 36 further validate the model for consistency and statistical acceptability on a higher level.
-1 -0.5 log 0.5 1
Powers
Tran
sfor
mat
ions
of k
wh.
-1 -0.5 log 0.5 1
Powers
Tran
sfor
mat
ions
of b
ua.r
-1 -0.5 log 0.5 1
Powers
Tran
sfor
mat
ions
of u
i.roo
15
Figure 33: Final regression equation
Figure 34: Residual plots (Final regression equation)
Figure 35: Diagnostics plots (Final regression)
Figure 36: Influence plot (Final regression)
7 CONCLUSION
Exploratory Data Analysis of Indian Hotel Benchmarking, on the ECO III dataset gives an insight into the various aspects of the variables under consideration. Univariate and Bivariate analysis helps asses the relationship between the variables. Climate zone (Climate), Service star level (star rating), Number of rooms (ui.rooms), and Built-up area per room (bua.room) are the major variables that should be considered for hotel benchmarking. To achieve model validity and consistency logarithmic with base e transformation is required for the dependent variable. Number of rooms and build-up area per room as independent variable also requires log transformation with base e. negatively influencing outliers were removed based on various statistical test and diagnostics. The findings of this stage of analysis will provide base for further analysis of regression based energy benchmarking. Other than the above stated variables, various other variables related to energy management, events hosted, hotel annual occupancy and hotel tariff (as proxy) can be further explored for including in the regression equation. The impacts on output and uncertainty need to study in detail for benchmarking validation and acceptability.
0.000.020.040.060.080.10
Coo
k's
dis 31 6346
-2-10123
Stud
entiz
e
31
46
63
0.6
0.7
0.8
0.9
1.0
Bonf
erro
n
31
46
12
0.05
0.10
0.15
0.20
0.25
hat-v
alue
s
20 40 60 80 100 120
12922
24
Diagnostic Plots
Index0.05 0.10 0.15 0.20 0.25
-2
-1
0
1
2
3
Hat-Values
Stu
dent
ized
Res
idua
ls
22
24
31
46
63
129

16
8 RECOMMENDATIONS
8.1 Recommendations for Benchmark model development Caveat: These preliminary recommendations need to be confirmed on completing multi-variate analysis.
• Use room-based EPI rather than area-based EPI. This is also preferable in terms of data quality.
• Must include electricity and fuels in calculating EPI, given extent of fuel use.
– However, Electricity EPI can be used as a first step since it is highly correlated with site energy EPI.
– Need to determine appropriate source energy factors.
• Star rating and climate should be included as core independent variables.
• Need further analysis to determine if usage variables should be included as independent variables – number of guests, room occupancy rate, number of restaurant covers, and number of conferences.
8.2 Policy Implications • The wide range of EPI - even within same star rating and climate - confirms the value of benchmarking
hotels to identify efficiency opportunities.
• Need to assess if use of room-based rather than area-based EPI will affect program implementation.
• Important to get buy-in and confidence of hotel owner/operators that key characteristics such as star rating, no. of rooms, no. of overnight guests are appropriately addressed in benchmark model.
• Scatter in the data suggests that it is important to provide error range and confidence levels for benchmark values, especially if benchmarking is used for code compliance or certification programs.

![On Evaluating the Renaissance Benchmarking Suite: Variety ... · movie-lens Recommender for the MovieLens dataset using Spark ML [39]. data-parallel, compute-bound naive-bayes Multinomial](https://static.fdocuments.us/doc/165x107/5d670aa088c993c54d8b83c9/on-evaluating-the-renaissance-benchmarking-suite-variety-movie-lens-recommender.jpg)


![A New Stereo Benchmarking Dataset for Satellite Images · ests) in San Fernando, Argentina, as defined in the IARPA’s MVS Challenge dataset [7]. That challenge dataset, span-ning](https://static.fdocuments.us/doc/165x107/60a2bbf95511a421c422480a/a-new-stereo-benchmarking-dataset-for-satellite-images-ests-in-san-fernando-argentina.jpg)


