Exploration and Sizing of a Large Passenger Aircraft with ...
35
HAL Id: hal-01754791 https://hal.archives-ouvertes.fr/hal-01754791 Submitted on 30 Mar 2018 HAL is a multi-disciplinary open access archive for the deposit and dissemination of sci- entific research documents, whether they are pub- lished or not. The documents may come from teaching and research institutions in France or abroad, or from public or private research centers. L’archive ouverte pluridisciplinaire HAL, est destinée au dépôt et à la diffusion de documents scientifiques de niveau recherche, publiés ou non, émanant des établissements d’enseignement et de recherche français ou étrangers, des laboratoires publics ou privés. Exploration and Sizing of a Large Passenger Aircraft with Distributed Ducted Electric Fans Alessandro Sgueglia, Peter Schmollgruber, Nathalie Bartoli, Olivier Atinault, Emmanuel Bénard, Joseph Morlier To cite this version: Alessandro Sgueglia, Peter Schmollgruber, Nathalie Bartoli, Olivier Atinault, Emmanuel Bénard, et al.. Exploration and Sizing of a Large Passenger Aircraft with Distributed Ducted Electric Fans. AIAA - Scitech 2018, Jan 2018, Kissimmee, United States. pp. 1-33. hal-01754791
Transcript of Exploration and Sizing of a Large Passenger Aircraft with ...

HAL Id: hal-01754791https://hal.archives-ouvertes.fr/hal-01754791
Submitted on 30 Mar 2018
HAL is a multi-disciplinary open accessarchive for the deposit and dissemination of sci-entific research documents, whether they are pub-lished or not. The documents may come fromteaching and research institutions in France orabroad, or from public or private research centers.
L’archive ouverte pluridisciplinaire HAL, estdestinée au dépôt et à la diffusion de documentsscientifiques de niveau recherche, publiés ou non,émanant des établissements d’enseignement et derecherche français ou étrangers, des laboratoirespublics ou privés.
Exploration and Sizing of a Large Passenger Aircraftwith Distributed Ducted Electric Fans
Alessandro Sgueglia, Peter Schmollgruber, Nathalie Bartoli, Olivier Atinault,Emmanuel Bénard, Joseph Morlier
To cite this version:Alessandro Sgueglia, Peter Schmollgruber, Nathalie Bartoli, Olivier Atinault, Emmanuel Bénard, etal.. Exploration and Sizing of a Large Passenger Aircraft with Distributed Ducted Electric Fans.AIAA - Scitech 2018, Jan 2018, Kissimmee, United States. pp. 1-33. hal-01754791

an author's https://oatao.univ-toulouse.fr/19580
https://doi.org/10.2514/6.2018-1745
Sgueglia, Alessandro and Schmollgruber, Peter and Bartoli, Nathalie and Atinault, Olivier and Bénard, Emmanuel
and Morlier, Joseph Exploration and Sizing of a Large Passenger Aircraft with Distributed Electric Ducted Fans.
(2018) In: AIAA - Scitech 2018, 8 January 2018 - 12 January 2018 (Kissimmee, United States).

Exploration and Sizing of a Large Passenger Aircraft
with Distributed Ducted Electric Fans
Alessandro Sgueglia∗, Peter Schmollgruber†, Nathalie Bartoli†
ONERA - The French Aerospace Lab
2 avenue Edouard Belin, 31055 Toulouse, France
Olivier Atinault‡
ONERA - The French Aerospace Lab
8 rue des Vertugadins, 92190 Meudon, France
Emmanuel Benard§
ISAE - Institut Superieur de l’Aeronautique et de l’Espace
10 avenue Edouard Belin, 31055 Toulouse, France
Joseph Morlier¶
Institut Clement Ader (ICA), CNRS, ISAE-Supaero, UPS, INSA, Mines-Albi
3 rue Caroline Aigle, 31400 Toulouse, France
In order to reduce the CO2 emissions, a disruptive concept in aircraft propulsion hasto be considered. As studied in the past years hybrid distributed electric propulsion is apromising option. In this work the feasibility of a new concept aircraft, using this technol-ogy, has been studied. Two different energy sources have been used: fuel based engines andbatteries. The latters have been chosen because of their flexibility during operations andtheir promising improvements over next years. The technological horizon considered inthis study is the 2035: thus some critical hypotheses have been made for electrical compo-nents, airframe and propulsion. Due to the uncertainty associated to these data, sensivityanalyses have been performed in order to assess the impact of technologies variations. Toevaluate the advantages of the proposed concept, a comparison with a conventional aircraft(EIS 2035), based on evolutions of today’s technology (airframe, propulsion, aerodynamics)has been made.
Nomenclature
AC Alternate CurrentA/C AircraftANOVA Analysis of VarianceC TorqueCT Thrust coefficientCE Conventional EngineCoG Center of GravityCD Drag coefficientCl 2D lift coefficient
∗Ph.D. candidate, ISAE Supaero & ONERA, Information Processing and Systems Department, AIAA Student Member†Research Engineer, Information Processing and Systems Department, AIAA Member.‡Research Engineer, Aerodynamic, Aeroelasticity and Acoustic Department.§Professor, Aircraft Design, AIAA Member.¶Professor, Structural Mechanics, AIAA Member.

CL 3D lift coefficientDC Direct currentDEP Distributed Electric PropulsionDoD Depth of DischargeEIS Entry Into ServiceEM Electric MotorsE/m Specific energy densityE/V Energy densityFC Fuel Consumption∆H Variation of total enthalpym Mass flowMDA Multidisciplinary Design AnalysisMDO Multidisciplinary Design OptimizationMFW Maximum Fuel WeightMLG Main Landing GearMLW Maximum Landing WeightMTOW Maximum Takeoff WeightN Number of enginesOEI One Engine InoperativeOWE Operational Weight Emptyp PressureP PowerPL PayloadP/m Specific power densityP/V Power densityr RadiusR Gas constant for airS SurfaceSM Static MarginSoC State of ChargeT ThrustTLAR Top Level Aircraft RequirementsxDSM eXtended Design Structure Matrixx Coordinate of a generic componenty Vector containing the parameters of a generic componentV VolumeV∞ Freestream velocity
Subscriptbatt Batteryblow Blowingdiss DissipatedEM Electric Motorfan Fangen GeneratorIC Inverter/Converterref Reference parameters Static parametert Total parameterw Wing
Greek lettersα Angle of attackγ Gas heat capacity ratioδ Power rateθ Temperature
η Efficiencyρ DensityΩ Rotational speed, in rpm
I. Introduction
In the next decades, due to the cost of fuel and the increasing number of aircraft flying everyday, the worldof aviation will cope with more stringent environmental constraints and traffic density increase. Both
ACARE (Advisory Council or Aviation Research and Innovation in Europe)1 and NASA2 published theirtargets in terms of environmental impact within the next years. In Table 1 the noise, emissions and energyconsumption reduction according to ACARE for the next years are reported: the fuel and energy consump-tion have to be drastically reduced to meet the 2050 goals.
Table 1. ACARE targets for the next years1
Target parameter [%] 2025 2035 2050
Noise -10.0 -11.0 -15.0
Emissions -81.0 -84.0 -90.0
Fuel\Energy consumption -49.0 -60.0 -75.0
To achieve these objectives, disruptive changes at the aircraft level have to be made. Fostered by theprogress made in the automotive industry, aeronautics found an interest in hybrid propulsion. An idea is tomerge this concept and distributed propulsion, where the engines are distributed along the wing. As shownby Kirner3 and Ko et al.,4 distributed propulsion increases performance in fuel consumption, noise, emissionand handling qualities. The resulting Distributed Electric Propulsion (DEP) technology has been appliedfor different aircraft configuration (such as the N+3 Aircraft generation from NASA5): results show a dragreduction (which leads to a minor fuel consumption) and also a better efficiency due to the aero propulsiveeffects.
This work presents the exploration and the sizing of a large passenger aircraft with distributed electricducted fans, EIS 2035. The objective is to carry out a Multidisciplinary Design Analysis (MDA) in orderto consider all the coupling between the disciplines: airframe, hybrid electric propulsion and aerodynamics.The aero propulsive effects are also considered, in order to converge towards a disruptive concept.
In the first part of the paper the proposed concept is described, then the propulsive chain architectureis presented, including a review of the key components and their models. The second part is dedicated totheir integration in the in-house aircraft sizing code developed by ONERA and ISAE-Supaero, identifiedas FAST.6 Then the design mission is presented, and the hypothesis for the 2035 technology horizon arediscussed. Finally, the performance of the integrated design are presented, and the conclusions regardingthe feasibility of such vehicle are reported.
II. Electric hybrid aircraft concept
The aircraft definitive concept is shown in Fig. 1: for the modelisation it has been used OpenVSP,7 afree tool for visualization and VLM computation. New components are added to the aircraft architectures:
• Turbogenerators, which are the ensemble of a fuel burning engine and a converter device;
• Batteries (not shown in figure) which provide electric power and are located in the cargo;
• Electric motor and ducted fan, in the nacelle on the wing upper surface;
• DC/DC and DC/AC converter (called respectively converter and inverter8) in order to provide thecurrent in the right mode and at the same voltage;

• Cables for the current transport, including a cooling system and protections.
Detailed models of each component are described in the next section. The wing-body airframe is theusual ”tube and wing” configuration, and no changes on that part have been done. For the engine positions,different choices are possible:9 upper-wing trailing edge engines, lower-wing leading edge engines and imbed-ded engines. In this work they are located in the upper part of the wing, at the trailing edge. This allowssome advantages in terms of blowing: from an internal project in the frame of the EU program CleanSky2,10 it has been estimated the 2D maximum lift coefficient in the zone affected by the engines varies from4 to 5. For the results presented later it has been used the mean value of 4.5. This effect has three mainadvantages:
• If the approach speed constraint is used for the wing sizing, the wing surface is reduced.
• High-lift devices are no more needed for takeoff and landing, leading to a minor wing weight.
• It is possible to have a shorter takeoff length.
Figure 1. Hybrid aircraft concept proposed with distributed electric ducted fan - modelisation in OpenVSP7
Also, in previous works9 the engines are mounted near the tip, since it is on that zone the stall beginsand a higher CL is needed. In this concept they are located on the inner part in order to not increase thestructure at the tip: a twist has to be added in order to make the stall begin in the center part. The motorsalso provide some moment which partially balance the bending at the wing root: from an internal work atONERA, it has been estimated that the impact of the engine position on the wing weight is of 5%.
Another advantage of the DEP architecture is that the EM weight is reduced. In fact, the One EngineInoperative (OEI) condition (which is assumed as critical case for the design) is less stringent, as shown bySteiner et al.:11 in case of OEI condition, the supplementary power (and thus also thrust) required by theother engines is smaller; in particular the total power of a single motor increases with the ratio of N
N−1 ,being N the number of engines. It is clear that, when the number of engines increases, the effect of the OEIcondition becomes negligable, and the weight of each motor decreases. Aircraft is also sized in order to haveall the EM working, even if one of the energy source is inoperative.
Regarding the energy sources, the generators are located at the rear, on the fuselage, in order to reducethe pylons wetted area and the interferences with the wing. The batteries are instead located in the cargozone, half of them ahead the wing and the other half back the wing. This choice has been made because itis expected to find the center of gravity in proximity of the wing, and with this disposition the batteries donot drastically affect its position. Also, due to batteries location (in the cargo), the maximum payload isreduced since only part of the freight is available for luggages. A T-tail configuration has been used for theempennage.
In this work it has been decided to size the aircraft in order to fly fully electric at least to 3000ft. Thereason for this choice is that the mean atmospheric boundary layer height is of about 1km (it changesaccording to the atmospheric condition), and in that region the convective effects create turbulences whichmix the air12 (Fig. 2): when the emissions are in this region, the quality of the air is decreased, meanwhilefor greater altitude this effect is no more as relevant as it is in the boundary layer region.

Figure 2. Typical evolution of atmospheric boundary layer during the day. The convective boundary layerextension is shown12
III. Propulsive chain architecture
The generic scheme of the propulsive chain is shown in Fig. 3: it is referred to only one half wing, andthe number of batteries, generators, EM and fans are not specified since they are variables to be optimized.
In this kind of architecture batteries are coupled with a turbogenerator in order to supply power: theyare connected through an electrical node (called bus in this work), thus they can be defined as a serial ar-chitecture. Converters are placed after these components in order to bring the current at the right transportvoltage. The total power is then transferred to the inverters, which convert DC to AC current, required byelectric motors. EM work in parallel; each of them is connected to a ducted fan, which generates thrust.Since all the cables from batteries and generators are connected to the bus, from which the current is thentrasported to the EM, they are always operative, even if one energy source being inoperative.
The power available at each step of the chain is also specified in Fig. 3: η is the efficiency of a genericcomponent, P
V the power density, M the Mach number, z the altitude, N the number of electric motors, Tthe thrust and V∞ the velocity. In the following sections, each component is detailed.
Power is controlled using two different power rates, one for the batteries and another one for the gener-ators. It is then possible to write:
Ptot = δbattPbatt2 + δgenPgen2 (1)
having defined the battery and generator power rate as below:
δbatt =Pbatt
Pbatt,max(2)
δgen =Pgen
Pgen,max(3)
where Pbatt,2 and Pgen,2 are defined from Fig. 3. In previous works on hybrid architectures13,14, an hybridfactor has been defined in order to control how much of the total power had to be supplied by each source.In this work, there is no factor splitting the power required from the two sources: with the law presentedin Eq. (1) it is possible to have batteries and generators supply the maximum of their available power atthe same time. The advantage offered by this approach is that at takeoff or climb (critical conditions interms of power required), a failure of one energy source can be easily sustained: in case one of them beinginoperative, it is possible to ask more power from the second source.
Finally, the power required by secondary systems (such as the environmental control system, the iceprotection system, lighting and so on) have to be considered too: in this work it has been decided to use theestimation done by Seresinhe and Lawson15 for a More Electric Aircraft concept, similar to A320.

Figure 3. Distributed electric propulsion architecture
A. Gas turbine generator
One of the two power sources is the gas turbine generator: it is composed of a turboshaft engine connectedto a generator which converts shaft power to electrical power. The turboshaft has been modeled using GSP(Gasturbine Simulation Program), a software developed at NLR.16 The scheme is shown in Fig. 4. A singlecompressor has been used, meanwhile there are two turbines after the combustion chamber: the first is thehigh speed turbine, directly linked to the compressor, while the second is the low speed turbine. Since ithas to produce power, the main outputs are the power and the Power Specific Fuel Consumption (PSFC),which depend on the altitude and the Mach number. The design conditions are reported in Table 2. Theturboshaft engine has also been sized in order to supply enough power in case of failure of one energy sourcein cruise.
Figure 4. Turboshaft scheme, as modeled in GSP (software developed at NLR)16
The gas turbine is not included into the sizing process: once having obtained the curves of power andPSFC from GSP, they are provided to the software FAST and interpolated to get the value of interest. Anestimation of the weight is given in the work of Burguburu et al.:17 it is based on empirical data from a
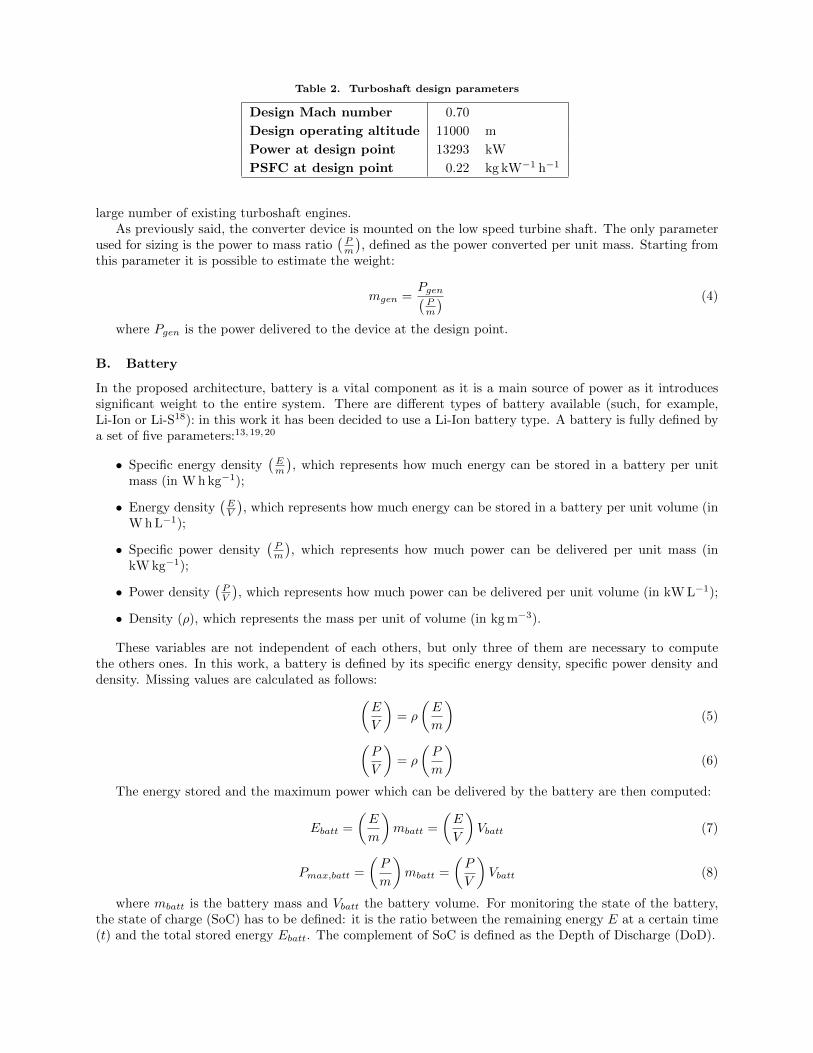
Table 2. Turboshaft design parameters
Design Mach number 0.70
Design operating altitude 11000 m
Power at design point 13293 kW
PSFC at design point 0.22 kg kW−1 h−1
large number of existing turboshaft engines.As previously said, the converter device is mounted on the low speed turbine shaft. The only parameter
used for sizing is the power to mass ratio(Pm
), defined as the power converted per unit mass. Starting from
this parameter it is possible to estimate the weight:
mgen =Pgen(Pm
) (4)
where Pgen is the power delivered to the device at the design point.
B. Battery
In the proposed architecture, battery is a vital component as it is a main source of power as it introducessignificant weight to the entire system. There are different types of battery available (such, for example,Li-Ion or Li-S18): in this work it has been decided to use a Li-Ion battery type. A battery is fully defined bya set of five parameters:13,19,20
• Specific energy density(Em
), which represents how much energy can be stored in a battery per unit
mass (in W h kg−1);
• Energy density(EV
), which represents how much energy can be stored in a battery per unit volume (in
W h L−1);
• Specific power density(Pm
), which represents how much power can be delivered per unit mass (in
kW kg−1);
• Power density(PV
), which represents how much power can be delivered per unit volume (in kW L−1);
• Density (ρ), which represents the mass per unit of volume (in kg m−3).
These variables are not independent of each others, but only three of them are necessary to computethe others ones. In this work, a battery is defined by its specific energy density, specific power density anddensity. Missing values are calculated as follows:(
E
V
)= ρ
(E
m
)(5)
(P
V
)= ρ
(P
m
)(6)
The energy stored and the maximum power which can be delivered by the battery are then computed:
Ebatt =
(E
m
)mbatt =
(E
V
)Vbatt (7)
Pmax,batt =
(P
m
)mbatt =
(P
V
)Vbatt (8)
where mbatt is the battery mass and Vbatt the battery volume. For monitoring the state of the battery,the state of charge (SoC) has to be defined: it is the ratio between the remaining energy E at a certain time(t) and the total stored energy Ebatt. The complement of SoC is defined as the Depth of Discharge (DoD).

SoC =E (t)
Ebatt= 1− Econs (t)
Ebatt(9)
DoD =Econs (t)
Ebatt= 1− SoC (10)
Due to safety reasons, the SoC can not be under a certain limit, which in general depends on the batterytype. For a Li-Ion battery the minimum limit for the SoC is 20%; therefore the following constraint will beused in the sizing process:
SoCfinal = 1−DoDfinal ≥ 0.2 (11)
C. Electric motor
Electric motors are the other main components of the hybrid propulsion: they convert electrical powerto mechanical power. The high reliability allows to work at very high efficiency; furthermore, as opposedto traditional combustion engine, their efficiency is independent from the altitude, which represents themain advantage.19 Performance of these electric motors is determined by their torque and rotational speedcharateristics. In this work it has been decided to use AC current based motors, since they are lighter thanDC current based. Electric motors have also a very high efficiency (about 0.95); inefficiencies can be causedby various factors and are of different types19 (but a complete analysis of them is beyond the scope of thiswork, in which only the total efficiency is defined).The major requirement for electric motors is the power to mass ratio, defined as the power that deliveredper mass unit. Once the maximum power required by the electric motor is known, it is possible to estimateits weight:
mEM =Pmax,EM(
Pm
) (12)
In subsequent steps the rotational speed and the torque are computed according to the fan requirement,and the motor is then fully defined.
D. DC/DC and DC/AC transformers
In order to convert current within the energy chain, converters and inverters are used. Performance of thesedevices depends on their efficiency, which is around 0.9. Since the architectures of inverter and converter aresimilar, it is possible to compute directly their total weight with the equation
mIC =PinverterNEM + PconverterNgen + PconverterNbatt(
Pm
) (13)
where(Pm
)is the power to mass ratio, NEM the number of electric motors, Ngen the number of generators
and Nbatt the number of batteries.
E. Cables
The cables have to transport current from one device to another within the hybrid architecture. They aresized in order to carry a certain current, which must be below the maximum allowed threshold. The current,and so the sizing, depends on the voltage used for the transport. First the current which flows through acable is computed as
i =P
∆V(14)
Then a check has to be done in order to be sure that value is lower than the maximum current. If itis not, more cables have to be installed; the number is computed dividing the value of current with themaximum one:
Ncable =
[i
imax
](15)

where the square brackets represents the integer part of iimax
. Finally, according to EM, generators andbatteries positions, it is possible to estimate the cable length and so the weight:
mcable = Ncable
(mL
)Lcable (16)
where mL is the cable linear density. Installation and Healt Monitoring System have to be included in the
weight calculation: preliminary works at ONERA10 show an increasing in weight of 30% for the installationand of 5% for the HMS. Typical values for the cables’ parameters are reported in Table 3.21
Table 3. Values used for the cables sizing
imax 360 A
∆V 2160 V
m/L 1.0 kg m−1
F. Cooling system
All the components have their efficiency: this means that not all the power generated by batteries orgenerators is converted into electrical power, but part of them is converted into heat. It consists of twodifferent devices: heat exchanger and air cooling systems. The first are devices which surrounds the cablesand artificially dissipate the power. The amount of power to dissipate is:
Pdiss = (1− ηbatt)Pbatt,maxNbatt + (1− ηgen)Pgen,maxNgen + (1− ηEM )PEM,maxNEM (17)
The heat exchangers introduce a penalty in mass: in the framework of an internal project at ONERA,the penalty has been estimated to be 1t.10 This value is based also on the work of Anton.22
The air cooling system is used instead to have cold air that circulates into the system: it consists of someair inlet placed on the fuselage. It does not introduce weight but a penalty on the drag coefficient:23 in thesame internal project mentioned, the impact has been estimated to be of 5% on the CD. Penalties due tothe cooling system are summed up in Table 4.
Table 4. Penalties due to the cooling system considered in this work (estimation from an internal work atONERA)
Mass +1 t
CD +5 %
G. Fan
The ducted fans are the last devices in the energy chain: they are directly connected to the electric motor.The design point for the preliminary sizing has been chosen as the beginning of the cruise.
As the fans are directly connected to electric motors, the torque and rotational speeds have to be thesame for both: if the motor torque is too small, a resize of the fan has to be carried out, or a gearbox mustbe added. In Fig. 5 the scheme of a ducted electric fan is shown, meanwhile in Fig. 6 a 3D rendering isgiven, where the elements are drawn separately in order to understand the architecture. Due to technologicallimits, there is a minimum for the fan diameter: if it is too small, it is not possible to design the fan. Inorder to avoid this situation, the operating Mach number should not exceed the value of 0.7. In AppendixB the fan sizing, based on isoentropic equations, is fully described.
Since the air passes through the fan, the wetted area of the duct is relevant for aerodynamic calculations.It is computed considering the total area of the external duct, the disk created by the actuator, the centralduct and the total area of the electric motor.

Figure 5. General scheme of a ducted electric fan with its different parts
Figure 6. Three-dimensional rendering of a ducted electric fan
IV. Description of the sizing tool FAST
FAST, which stands for Fixed-wing Aircraft Sizing Tool,6 is an aircraft sizing code, fully developed inPython 2.7, based on the point mass approach to estimate the required fuel consumption for a given set ofTop Level Aircraft Requirements (TLAR). It performs a Multidisciplinary Design Analysis (MDA), takinginto account different key disciplines: aerodynamics, structure/weight and propulsion. In the traditionalversion of FAST, there are 19 different modules, divided into three main categories: management, analysis,and wrapper modules. A common .xml file is used both for reading the input and writing the output: it isdivided into different sections for geometry, aerodynamics, propulsion and code configuration.
The FAST code has been modified in order to consider also the hybrid architecture sizing. New moduleshave been added, into the new category ”HybridDEP”; here below there is a rapid description:
• Battery.py: this module contains the battery model and the functions used for computing the actualSoC, the weight, the volume, the energy and the maximum power available. Battery sizing is alsoincluded.
• Cable.py: this module contains the definition of the cable function used for computing the maximumcurrent, the diameter and the weight.
• DuctedFan.py: this module contains the functions used for sizing the ducted fan and computing thepower required for the condition of interest.
• ElectricMotor.py: this module contains the definition of the electric motor and the function usedfor its sizing.
• HybridEngine.py: this module is the main module for the propulsion, since it calls the components’modules for computing both the power and the thrust (as in Fig. 3) according to the actual requirementduring flight phase and the PSFC to estimate the fuel consumption.
The standard mass breakdown module using the French norm AIR 2001/D24 has also been modified.Since it considers only a classical ”tube and wing” configuration, there are no references on the hybrid ar-chitecture, such as batteries or cables. Thus five new elements have been added in the propulsion category.

The detailed structure is presented in appendix A (Table 16). Finally, two new sections in the .xml inputfile have been added: one contains all the parameters for the hybrid distributed electric propulsion, whilethe other contains an estimation of the secondary systems power.
The FAST workflow is presented in Fig. 7: since from a method’s point of view it can be considered as aMDA, an eXtended Design Strucutre Matrix (xDSM) scheme25 has been used to describe the main process.Under this format, each rectangular box represents an analysis (e.g. a function or computational code).Input variables related to the analysis are placed vertically while outputs are placed horizontally. Thickgray lines represent data dependencies whereas thin black lines represent process connections. The order ofexecution is established by the component number. Finally, the superscript notation defined by Lambe etal.25 has been used.
Algorithm 1 details the different steps based on the input given by the work of Pornet et al.13 and Cinaret al.,14 which describe a sizing process for electric aircrafts. Respect to the original version, a new analysis isadded at step 2; all the other blocks have been indirectly modified due to the presence of the new propulsivearchitecture.
Algorithm 1 FAST algorithm
Require: Initial design parameters (TLAR)Ensure: Sized aircraft, drag polars, masses, design mission trajectory
0: Initialize the values. Estimate weight, wing surfaces initial values, using methods from ISAE & Airbusdesign manual,26 as initialization of DEP components.repeat
1: Initialize the loop.2:Battery sizing. Batteries are sized respect to two different criteria: the power at the takeoff and theenergy consumed; the latter is divided by 0.8 in order to consider the 20% safety margin of SoC. UsingEq. (7) and Eq. (8), battery volume is computed, then the maximum value is taken. Finally, using thesame equations, power and energy available are defined. At the first iteration the initial value of volumefrom step 0 is used, since there is no information about the energy consumption.3: Wing sizing. Wing area is sized with respect to fuel capacity and approach speed. As for the battery,at the first iteration no wing sizing is performed, as there is no information about the fuel consumption.4: Compute initial geometry.5: Resize the geometry in order to match the center of gravity and stability constraints.6: Aerodynamic calculation.7: Mass breakdown calculation. For the DEP components, the weight estimation is based according tovalues from previous loop;8: Design mission simulation. The mission includes: take off, initial climb (up to 1500ft), climb to cruisealtitude, cruise, descent, alternate flight of 200NM, 45 minutes of holding, landing and taxi in. For thecruise two approaches are possible (step and cruise climb); more details will be provided in section V.For the Hybrid-Electric concept, the balance equation is written in terms of power instead of thrust;at each step the code computes the fuel and energy consumption and updates the aircraft weight andbattery SoC.9: Update the MTOW.10: Check if the convergence criteria is satisfied; if not proceed to next iteration. The convergence isreached when the relative difference between the Operating Weight Empty (OWE) computed at step7 and step 8 is less than 0.05%. If this condition is satisfied, the code check that the mission fuel islower than the maximum fuel that can be stored, as that the battery SoC is greater than 20%: if theseconditions are fulfilled, the sizing loop is over, otherwise it proceeds to next iteration.
until 10→ 1: MDA has converged
V. Design mission and sizing parameters
A. Design mission definition
In the FAST code, the design mission is made of two blocks: the first one represents the mission, and thesecond one is used for computing the reserve, according to certification rules.6 In particular, the reserve fuel

xmlfile
Initialbatteryvolumeratio
Vapproach
Npax
SM
req
Req.range
,Cruiseoption
,Gen
eratordata
0:In
itia
tor
1:PL(0
),M
TOW
(0),M
LW
(0),M
ZFW
(0),S
(0)
w
1,10
→2:
MD
A:
FA
ST
2:SOC
t,P
t takeoff
3:m
t f,M
LW
t,C
t Lm
ax
4:MTOW
t5
:Masses
t
2:B
atte
rysi
zin
g7
:Pbattery,E
battery
8:Pbattery,E
battery
3:
Win
gsi
zin
g
4:ywin
g
4:
Com
pu
tein
itia
lgeo
met
ry
5:A/C
(0)
A/C
10:A/C
5:
Res
ize
geo
met
ry6
:A/C
7:A/C
CL
(CD
),C
L(α
)10
:C
L(C
D),C
L(α
)
6:
Com
pu
teaer
od
y-
nam
ics
8:C
L(C
D),C
L(α
)
Masses
10:Masses
7:M
ass
bre
ak-
dow
n
8:Masses
9:OWE
Missionperform
ances
10:m
f,E
cons,Cruiselevels
8:G
lob
al
flig
ht
9:m
f,OWE
m,SoC
10:MTOW
9:
Up
dat
eM
TO
W
Figure 7. FAST xDSM. Black lines represent the main workflow; thick grey lines represent the data flow,meanwhile green blocks indicate an analysis, grey and white block an input/output data. Algorithm 1 detailsthe MDA.
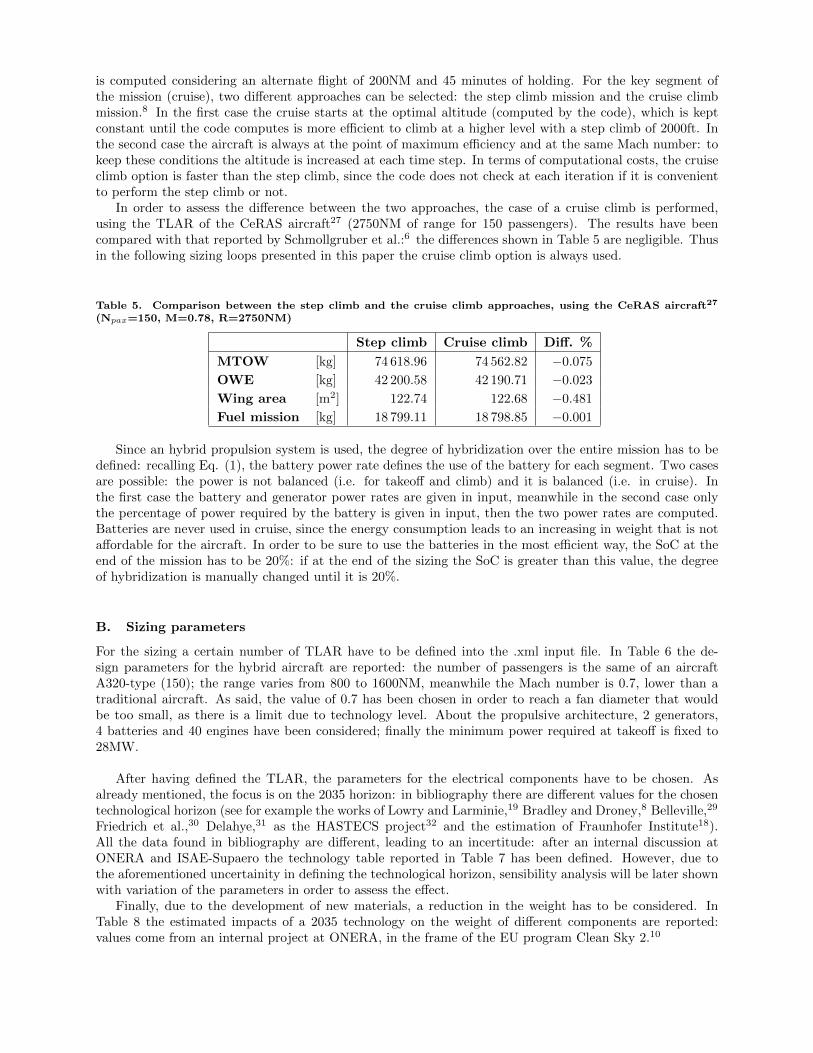
is computed considering an alternate flight of 200NM and 45 minutes of holding. For the key segment ofthe mission (cruise), two different approaches can be selected: the step climb mission and the cruise climbmission.8 In the first case the cruise starts at the optimal altitude (computed by the code), which is keptconstant until the code computes is more efficient to climb at a higher level with a step climb of 2000ft. Inthe second case the aircraft is always at the point of maximum efficiency and at the same Mach number: tokeep these conditions the altitude is increased at each time step. In terms of computational costs, the cruiseclimb option is faster than the step climb, since the code does not check at each iteration if it is convenientto perform the step climb or not.
In order to assess the difference between the two approaches, the case of a cruise climb is performed,using the TLAR of the CeRAS aircraft27 (2750NM of range for 150 passengers). The results have beencompared with that reported by Schmollgruber et al.:6 the differences shown in Table 5 are negligible. Thusin the following sizing loops presented in this paper the cruise climb option is always used.
Table 5. Comparison between the step climb and the cruise climb approaches, using the CeRAS aircraft27
(Npax=150, M=0.78, R=2750NM)
Step climb Cruise climb Diff. %
MTOW [kg] 74 618.96 74 562.82 −0.075
OWE [kg] 42 200.58 42 190.71 −0.023
Wing area [m2] 122.74 122.68 −0.481
Fuel mission [kg] 18 799.11 18 798.85 −0.001
Since an hybrid propulsion system is used, the degree of hybridization over the entire mission has to bedefined: recalling Eq. (1), the battery power rate defines the use of the battery for each segment. Two casesare possible: the power is not balanced (i.e. for takeoff and climb) and it is balanced (i.e. in cruise). Inthe first case the battery and generator power rates are given in input, meanwhile in the second case onlythe percentage of power required by the battery is given in input, then the two power rates are computed.Batteries are never used in cruise, since the energy consumption leads to an increasing in weight that is notaffordable for the aircraft. In order to be sure to use the batteries in the most efficient way, the SoC at theend of the mission has to be 20%: if at the end of the sizing the SoC is greater than this value, the degreeof hybridization is manually changed until it is 20%.
B. Sizing parameters
For the sizing a certain number of TLAR have to be defined into the .xml input file. In Table 6 the de-sign parameters for the hybrid aircraft are reported: the number of passengers is the same of an aircraftA320-type (150); the range varies from 800 to 1600NM, meanwhile the Mach number is 0.7, lower than atraditional aircraft. As said, the value of 0.7 has been chosen in order to reach a fan diameter that wouldbe too small, as there is a limit due to technology level. About the propulsive architecture, 2 generators,4 batteries and 40 engines have been considered; finally the minimum power required at takeoff is fixed to28MW.
After having defined the TLAR, the parameters for the electrical components have to be chosen. Asalready mentioned, the focus is on the 2035 horizon: in bibliography there are different values for the chosentechnological horizon (see for example the works of Lowry and Larminie,19 Bradley and Droney,8 Belleville,29
Friedrich et al.,30 Delahye,31 as the HASTECS project32 and the estimation of Fraunhofer Institute18).All the data found in bibliography are different, leading to an incertitude: after an internal discussion atONERA and ISAE-Supaero the technology table reported in Table 7 has been defined. However, due tothe aforementioned uncertainity in defining the technological horizon, sensibility analysis will be later shownwith variation of the parameters in order to assess the effect.
Finally, due to the development of new materials, a reduction in the weight has to be considered. InTable 8 the estimated impacts of a 2035 technology on the weight of different components are reported:values come from an internal project at ONERA, in the frame of the EU program Clean Sky 2.10

Table 6. Design parameters for the hybrid aircraft with DEP considered
Range 800-1600 NM
Cruise Mach number 0.70
Number of passengers 150
Approach speed 132 kn
Wing span ≤36 m
Number of engines 40
Number of generators 2
Number of batteries 4
Minimum power at takeoff 28 MW
Table 7. Design parameters for the electric components for 2035 horizon
Battery Generator Electric motor IDC
Specific energy density [W h kg−1] 500 - - -
Energy density [W h L−1] 850 - - -
Specific power density [kW kg−1] 2.0 13.15 10.0 16.4
Power density [kW L−1] 3.4 - 20.0 -
Efficiency [-] 0.90 0.95 0.95 0.95
Table 8. Estimated impact of new materials on weight for 2035 horizon
Wing −10 %
Fuselage −5 %
Landing gear −5 %
Cabin seats −30 %
The wing weight reduction is valid only for a conventional aircraft: it is not possible to use compositesbecause of the level of current that flows in the cables in the wing. Thus, for the hybrid concept, no wingreduction is considered.
In the next section, where results are presented, the hybrid aircraft is compared with respect to a con-ventional aircraft: the last has the same TLAR reported in Table 6, the weight reduction reported in Table8, a maximum efficiency of 19 is assumed and the engine model is based on the CeRAS engine,27 with a SFCreduction of 20%.
VI. Preliminary results for the Hybrid-Electric Aircraft concept
As stated in the previous section (Table 6), the range is not fixed: in fact it is a variable to be explored inorder to find the breaking point from which the hybrid concept is advantageous with respect to a traditionalaircraft. The first parametric study shows the fuel consumption with respect to the range: the result ispresented in Fig. 8. For both the configurations (conventional and hybrid) the fuel consumption increaseswith the range, but it is possible to note a value (about 1200NM) for which the two configurations havethe same fuel consumption. Under that value the hybrid configuration is advantageous with respect to thetraditional one. This effects is due to the battery sizing: under the breaking value, the sizing criteria is thepower requirement at takeoff (which is 28MW), which means that the energy available is the same. Whenthe range is decreased, the MTOW is decreased too, and this leads to a final SoC greater than 0.20: it is thenpossible to change the degree of hybridization and save more fuel. On the contrary, when the range is higherthan 1200NM, the energy requirement becomes the most important criteria: batteries are resized and the in-creasing in weight make the hybrid architecture worse than the traditional one. For the rest of the work here

presented, the design range considered is 1200NM, with the mission hybridization reported in Table 9: sincethe battery is sized according the power requirements, there is more energy than needed for the mission fullyelectric until 3000ft; for this reason the entire climb segment is fully electric, with a battery power rate of 70%.
Figure 8. Fuel consumption with respect to the range variation, keeping constant all the others TLAR
Table 9. Different technological scenarios for evaluating the sensitivity to technology
δgen δbatt
Takeoff & Initial climb 0.0 1.0
Climb 0.0 0.7
Cruise comp. 0.0
Descent 0.3 0.0
Alternate climb 0.8 0.0
Alternate cruise comp. 0.0
Alternate descent 0.3 0.0
Holding comp. 0.0
Taxis segments 0.0 0.05
Table 10 shows the comparison for the two different configurations. In order to have a unique param-eter for comparison, the Payload Fuel Energy Efficiency (PFEE) has been used as figure of merit.33 Thisparameter is defined as the payload per range divided by the energy consummed:
PFEE =(PL)(Range)
Econs(18)
PFEE has been used since it contains the payload carried for a certain range, and the energy consummedfor the mission. The PFEE is similar for both configurations, which confirms the results that for the chosenrange the hybrid and the traditional aircraft are comparable (about 98kg km MJ−1), but for the first conceptthere are no emissions close to ground.
The OEI condition is already included in the FAST calculation, but is not critical in the design. Thecases in which one generator or two batteries are inoperative have been then considered as additional failurecases: the hypothesis made is that the failure occurs during takeoff. As explained in section II and sectionIII, the aircraft is designed in order to have all the EM operative, even if one energy source is inoperative.The fuel breakdown for these cases is reported in Table 11. In case one generator is inoperative, there are

Table 10. Comparison between the Hybrid-Electric concept and the conventional aircraft, EIS2035, for thedesired range of 1200NM
Hybrid Traditional Diff. %
Wing area [m2] 118.77 105.92 12.13
Maximum L/D [-] 17.2 19 10.46
Initial cruise altitude [kft] 31 36 16.13
MTOW [t] 80.08 57.20 40.01
OWE [t] 59.50 36.55 62.79
Block fuel [kg] 4750.26 4869 11 −2.44
Reserve fuel [kg] 2182.22 2172 48 0.44
Mission fuel [kg] 6932.49 7041 59 −1.55
Battery energy [W h] 1806.90 - -
PFEE [kg km MJ−1] 98.31 97.44 0.89
no differences in the takeoff and climb phase, since they are fully electric; then it is still possible to concludethe cruise, even if the fuel consumption is higher since more power is required to a single generator and thePSFC increases. For the reserve phase, the aircraft is not able to climb again for an alternate flight as thepower requirement for this segment is higher than the maximum power of a generator, and only 45 minutesof holding have been considered. In case two batteries are out, instead, it is not possible to have a fullyelectric segment and the help of the generator is required at each phase. No great differences are shown forthe reserve calculation, as for that phase only generators are used also in the baseline, but the fuel increasesfor the design flight.
This study has been performed in order to understand the behavior in case of failure, but it does notconsider yet the possible certification requirements (i.e. that if one source is inoperative the aircraft has toclimb to 500ft and then lands again); a detailed work has to be done in the future.
Table 11. Fuel breakdown comparison between the baseline and the scenarios of failure identified (one generatoror two batteries inoperatives)
No failure Generator out Batteries out
Taxi out [kg] 0 0 0
Takeoff [kg] 0 0 36.67
Initial climb [kg] 0 0 118.52
Climb [kg] 0 0 362.41
Cruise [kg] 4543.81 4984.86 4857.90
Descent [kg] 206.46 227.79 228.58
Alternate climb [kg] 562.62 - 604.35
Alternate cruise [kg] 325.39 - 365.10
Alternate descent [kg] 156.98 - 172.68
Holding [kg] 994.74 1102.73 1078.89
Block fuel [kg] 4750.26 5212.65 5604.13
Reserve fuel [kg] 2182.22 1259.11 2389.14
Mission fuel [kg] 6932.49 6471.76 7993.27
VII. Exploration of the design space
The technology data for 2035 are affected by uncertainty. In order to assess the effects of a differenttechnological level on the feasibility of the proposed concept, an exploration of the design space has been

performed in this section. Battery, generator, electric motor and gasturbine technologies variation have beenconsidered, as the effects of the engines number (to assess the DEP advantages) and the maximum 2D liftcoefficient variation. Table 12 reports the minimum and maximum values for the parameters of the hybridchain components. Some assumptions have been made:
• The TLAR used are the same used in the previous section (Table 6).
• The effect of each component has been studied separately, changing one component’s technology andkeeping all the others constant and equal to the baseline (Table 7, and reported also in Table 12 forsake of clarity).
• The mission hybridization is the same used for the baseline (Table 9): in case at the end of a simulationthe SoC is greater than 0.20 as required by equation (11), it has been changed in order to use all theavailable battery energy. Changes are always reported.
Table 12. Technology table for evaluating the sensitivity to technology
Minimum Maximum Baseline
Battery specific energy density [W h kg−1] 350 700 500
Battery specific power density [W kg−1] 1400 2800 2000
Battery efficiency [-] 0.85 0.95 0.9
Generator specific power density [kW kg−1] 6.57 19.72 13.15
Generator efficiency [-] 0.90 0.97 0.95
Electric motor specific power density [kW kg−1] 5 15 10
Electric motor efficiency [-] 0.90 0.98 0.95
Number of engines [-] 10 40 40
Max Cl [-] 4.0 5.0 4.5
Gasturbine PSFC variation [%] −10 10 0
For all the studies three key parameters have been considered as output: the MTOW, the wing area Swand the fuel consumption FC. They have been chosen since they are the most important parameters in adesign process. The results are presented in Fig. 10: each column represents the impact of one component’stechnology variation for the key parameters. The same scale has been used, in order to better understandthe effect of a variation on a single output (MTOW, Sw and FC). In the next sections the impact of eachparameter is described separately; for sake of clarity in Appendix C all the graphs are reported (from Fig.14 to Fig. 19), both in the common and real scales.
A. Impact of battery technology variation
In this section the variation of battery technology in the range defined in Table 12 has been studied; resultsare shown in the first colume of Fig. 10. The battery technology affects all the parameters considered:between the minimum and the maximum value, the MTOW is reduced of about 20%, the wing area ofabout 15% and the fuel consumption of about 18%. It is possible to note that from the first and the secondpoint (from an energy density of 350W h kg−1 to 500W h kg−1) the MTOW is reduced more than in thesecond segment: this happens because, for low values of
(Em
)batt
batteries are resized accorgind to the energy
requirement, leading to a divergence into the MTOW. In the last case ((Em
)batt
=700W h kg−1), instead, thesizing criteria is the power at the takeoff, and since the MTOW is reduced of 8% with respect to the baseline,there is more energy to use in batteries and the degree of hybridization for the alternate climb is changedrespect to what has been used in Table 9:
- δgenal,climb = 0.0
- δbattal,climb = 0.65

Thus, for the last point also the alternate climb is fully electric, leading to a major gain in fuel consump-tion.
B. Impact of generator technology variation
The generator technology is varied into the range identified in Table 12. Minimum and maximum valuescorrespond to a variation of ±50% respect to the design. The results correspond to the second column ofFig. 10. The effects on the MTOW, wing area and fuel consumption are smaller, compared to that of thebattery technology: the MTOW varies of about 4%, meanwhile the wing area is almost constant. The majoreffect is on the FC (about 7%): when the weight of the generator is decreased, the nacelle is smaller, andthus there is a little gain on the efficiency, which affects the FC.
C. Impact of electric motor technology variation
The variation of electric motor technology has then been studied, within the range presented in Table 12:as for the generator, minimum and maximum value of power to mass ratio have been defined considering avariation of ±50% with respect to power to mass ratio base value. Results are shown in the third column ofFig. 10: both on the MTOW and the fuel consumption there is a gain of about 7%, meanwhile the effect onthe wing area is not relevant. The effects are greater than that of the generator technology variation, butstill smaller than that of the battery technology variation.
D. Impact of engines number variation
In this section the effect of engines number has been considered: it varies from 10 to 40 (as reported in Table12). This parameter affects the maximum lift coefficient. In fact, as said earlier, the surface interested bythe blowing has a maximum Cl of about 4.5; the wing maximum CL is computed as:
CL,wingmax = Cl,maxSblowSw
(19)
where Sblow is the surface interested by blowing, shown also in Fig. 9 in red. From Eq. (19) it can bededuced that the maximum CL is reduced when Sblow is reduced, that is when the engines number is smaller.
Figure 9. Wing view. The red zone represents the surface interested by blowing, used for computing themaximum lift coefficient in Eq. (19)
Results of this study correspond to the fourth column of Fig. 10: there are no relevant effect on theMTOW and FC, meanwhile the wing area changes of about the 20%. This is explained because the wingarea is sized according the approach speed constraint, and when there are less engines the maximum CL issmalled, and this leads to a greater wing area to sustain the flight.

E. Impact of maximum 2D lift coefficient effects
The effect of maximum 2D lift coefficient has been considered: as already said, it is estimated to vary be-tween 4 and 5. Results are shown in the fifth column of Fig. 10. The only effect is on the wing area (whichis reduced of the 15%): this means that the main advantages in having a higher Cl are not in the FC, but inthe possibility to have a shorter takeoff field length and a smaller power at takeoff requirements (parameterthat affects the battery sizing).
F. Impact of PSFC variation
Finally, the effects of PSFC variation have been considered: the value is first decreased by 10% and thenincreased by the same amount with respect to the baseline (as in Table 12). Results are shown on the lastcolumn of Fig. 10: the main effect is in the FC, which varies of the 20% in the range considered. The resultis expected, since the PSFC mainly depends on the combustion process efficiency. The effect on the MTOWand the wing area is instead negligible (less than 1%).
These analyses show that, when the technologies improve, in general the performances are better (MTOWand fuel consumption are reduced), meanwhile the study on the number of engines clearly shows the advan-tage in using a DEP architecture. It is also possible to note that a linear change in a technology does notimply a linear change in the results: this happens because a reduction in the weight leads to a reduction inthe energy consumption, and so in a reduction in battery weight (if it is sized according to energy) or inthe fuel consumption (if it is sized according to power at takeoff, since more energy is available). In orderto better understand the effects of each parameter, a sensitivity analysis has been performed, based on themethod of the sparse polynomial chaos expansions, with a design of experiments made of 800 points. Fotits generation, a Latin Hybercube Sampling has been used. The idea is to identify the sensitivity index ofthe three key parameters (MTOW, Sw and FC) with respect to the design variables, in order to understandthe impact of each variable on a certain output. It is also possible to identify the interaction between thevariables, if there are.
VIII. Sensitivity studies with respect to technological levels
The analysis performed is based on the sparse polynomial chaos expansions method for computing globalsensitivity indices.34,35 This method has been selected since it allows to compute the sensitivity (Sobol)indices as the Montecarlo method, but it requires less points for the estimation. In this section it is assumedthat Y =M(X), where X = (Xi), i = 1, · · · , n (n being the number of design variables), is a random vectormodeling the input parameters (independent and uniformly distributed) andM is the numerical solver usedto compute a scalar quantity of interest Y (the sizing tool FAST in this work). Assuming that Y is a secondorder random variable, it can be shown that36
Y =∞∑i=0
Ciφi(X) (20)
where φii∈N is a polynomial basis orthogonal with respect to the probability density function (pdf)of X and Ci are unknown coefficients. Sparse polynomial chaos consists in the construction of a sparsepolynomial basis φiα∈A, where α = (α1, · · · , αn) is a multi index used to identify the polynomial actingwith the power αi on the variable Xi and A is a set of index α. In practice A is a subset of the set B which
contains all the index α up to a dimension d i.e. card(B) = (d+n)!d!n! . Objective of sparse approach is to find an
accurate polynomial basis φiα∈A such as card(A) << card(B). This is achieved by Least Angle Regressioni.e. unknown coefficients Ci are computed by iteratively solving a mean square problem and selecting, ateach iteration, the polynomial the most correlated with the residual.37 Finally, the following approximationis deduced:
Y ≈ Y =∑α∈A
Cαφα(X) (21)
Due to the orthogonality of the polynomial basis φiα∈A it is possible to write:
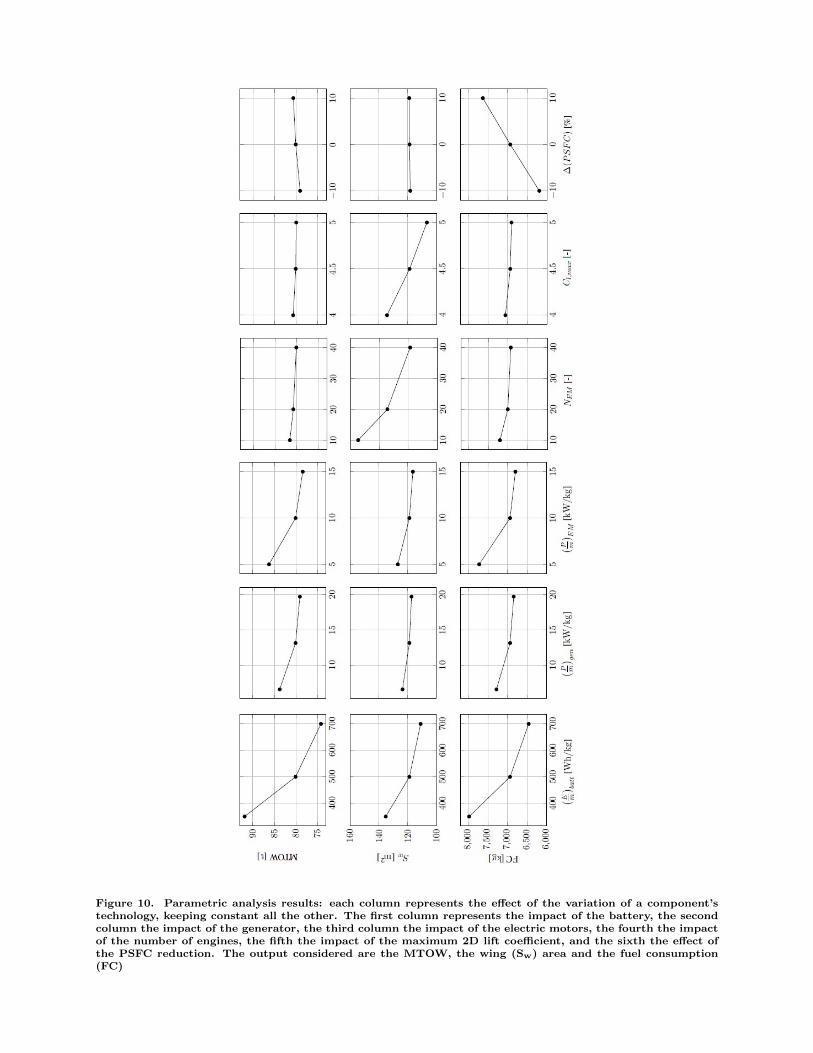
Figure 10. Parametric analysis results: each column represents the effect of the variation of a component’stechnology, keeping constant all the other. The first column represents the impact of the battery, the secondcolumn the impact of the generator, the third column the impact of the electric motors, the fourth the impactof the number of engines, the fifth the impact of the maximum 2D lift coefficient, and the sixth the effect ofthe PSFC reduction. The output considered are the MTOW, the wing (Sw) area and the fuel consumption(FC)

E[Y ] = C0
V ar[Y ] =∑α∈A C
2αE[φ2α(X)]
(22)
where E[Y ] is the mean value and V ar[Y ] is the variance of the answered variable (Y ).Sudret38 identifies the polynomial chaos expansion using the ANOVA decomposition, from which it is
possible to show that the first order sensitivity index of the variable Xi is
Si =
∑α∈Li C
2αE[φ2α(X)]
V ar[Y ](23)
where Li = α ∈ A/∀ j 6= i αj = 0; that is only the polynomials acting exclusively on variable Xi havebeen considered.
The total sensitivity index can also be computed:
STi =
∑α∈L+
iC2αE[φ2α(X)]
V ar[Y ](24)
where L+i = α ∈ A/αi 6= 0; that is all the polynomials acting on the variable Xi have been considered
(which means that all variance caused by its interaction, of any order, with any other input variables areincluded).
The idea is to determine the sensitivity indices relative to the technology component used in FAST forthe MTOW, the Sw and the FC. From the analysis the same parameters considered in Table 12 have beenconsidered, except for the battery specific power density (which from the table can be estimated to be 4times the specific energy density) and the number of engines (since this method only considers continuousvariables). For each variable it is possible to define the coefficient of variation CV:
CV =σ
µ(25)
where σ =√
(xmax−xmin)212 is the variance and µ = xmax−xmin
2 the mean value. It has been decided to
work keeping constant the CV for each variable: once that the mean value is fixed, it is possible to deducethe minimum and maximum values of variation. In Table 13 the mean values and the range of variationfor each parameter are reported. It has to be noted that, compared to Table 12, the range of variation issmaller.
Table 13. Mean values, minimum and maximum values for the parameters considered for the sensitivityanalysis (with CV =0.05 kept constant for all the variables).
Mean value Minimum Maximum
Battery specific energy density [W h kg−1] 500 456.70 543.30
Battery efficiency [-] 0.9 0.82 0.97
Generator power density [kW kg−1] 13.15 12.01 14.29
Generator efficiency [-] 0.9 0.82 0.97
EM power density [kW kg−1] 10 9.13 10.86
EM efficiency [-] 0.9 0.82 0.97
Cl,max [-] 4.5 4.11 4.89
PSFC reduction [%] 0 −8.66 8.66
A database of 800 points has been generated for the experiment (via a Latin Hypercube Sampling). Thecoefficient of variation used is 0.05 (which means that each variable changes of 5% between the minimumand maximum value). Results are shown in Table 14 and Fig. 11. The following conclusions can be deduced:
• MTOW is mostly affected by the battery technology (which has a sensitivity index of 0.86).

• The driving parameter for the FC is the PSFC reduction (sensitivity index is 0.64), but there is alsoan effect of the battery, due to the fact that when it is resized, the MTOW increases and so the FC.Also the EM efficiency has an effect: recalling the propulsive chain (Fig. 3), this parameter regulatesthe power required by generators, which affects the FC (with the same PSFC, more power means morefuel burnt).
• The wing area is finally driven by the maximum 2D lift coefficient (sensitivity index is 0.84); also forthis parameter there is a small effect of the battery technology, due to the fact that the sizing criteriafor the wing is the approach speed, and when the MTOW increases, a greater area is needed to sustainthe flight.
From Table 14 it is also possible to note that the sum of all the indices is about one (from 0.99 to1.07): this means that all the variance of the answered variables is explained, and there are no high orderinteractions between the input variables. Thus a study of the total sensitivity indices does not provide moreinformation than the first order indices. (see Eq. (24)).
Table 14. Sensitivity indices for MTOW, FC and Sw for the analysis considered (in bold the relevant values)
MTOW FC Sw
Battery specific energy density 0.8642 0.1799 0.1561
Battery efficiency 0.0002 0.0000 0.0000
Generator power density 0.0126 0.0561 0.0010
Generator efficiency 0.0004 0.0001 0.0000
EM power density 0.0001 0.0086 0.0000
EM efficiency 0.1070 0.1848 0.0003
Cl,max 0.0119 0.0089 0.8421
PSFC reduction 0.0003 0.6389 0.0000
Index sum 0.9968 1.0773 0.9995
Figure 11. Plot of sensitivity indices for MTOW, FC and Sw for the analysis considered.

Having fixed the CV, the range in which the parameters vary is smaller than the technological rangeestablished in Table 12. For this reason a second analysis has been performed, using the assumption madein the technological table (which means that the CV is not the same for each parameter anymore). A newdatabase of 800 points has been defined. Results are presented in Table 15 and Fig. 12. Compared to theprevious case, the effects are mostly due to the battery variation, except for the wing area, for which thereis still an effect of the maximum lift coefficient, even if it is reduced. This means that, until the uncertaintyin battery technology is as it has been hypotized, there is no gain in improving the technological level of theother components, since the sizing will be affected mostly by the battery parameters.
Table 15. Sensitivity indices for MTOW, FC and Sw, considering the range of variation defined in Table 12(in bold the relevant values)
MTOW FC Sw
Battery specific energy density 0.9358 0.7388 0.3792
Battery efficiency 0.0000 0.0001 0.0000
Generator power density 0.0569 0.0561 0.0223
Generator efficiency 0.0002 0.0001 0.0002
EM power density 0.0017 0.0086 0.0004
EM efficiency 0.0032 0.1848 0.0005
Cl,max 0.0015 0.0089 0.5953
PSFC reduction 0.0000 0.0026 0.0000
Index sum 0.9992 0.9975 0.9974
Figure 12. Plot of sensitivity indices for MTOW, FC and Sw, considering the range of variation defined inTable 12
In conclusion, with the current level of fidelity used in FAST, it is possible to consider the effects of thetechnology variation; results shown that the main driver for the design process is the battery.

IX. Conclusion & future perspectives
In this work the feasibility of a large passenger hybrid aircraft has been studied, in which a set of batteriesand generators work in sinergy in order to supply power. The proposed concept is based on a distributedelectric propulsion architecture, in which a certain number of ducted fans located along the wing provide thethrust necessary. A focus has been made on the advantages of such architecture (weight engine reductiondue to the less stringent OEI condition, blowing effects which increase the maximum lift coefficient). Someefforts have been also made in electrical components’ modeling and into the description of the propulsiveenergy chain. The technological hypotheses made refer to a 2035 horizon. All these aspects have been codedinto the FAST sizing tool and the modifications made have been presented. The sizing tool is based onempirical equations and low fidelity tool: its level of fidelity can be classified as low.
Results show that the hybrid concept has a potential gain up to a certain range, after which the batteriesweight become so large that the fuel consumption is increased compared with an aircraft with conventionalengines, for the same technological horizon. Once that the baseline has been assessed, two failure cases (forbatteries and generator) have been studied in order to understand if the aircraft can prevent the partial lossof one power source. A major investigation in the failure cases has to be considered in the future, according tonew certification that could require to not be able to fullfill all the mission: in that case particular attentionhas to be put into the maximum power can be lost. Also, in the proposed concept the assumption that allelectric motors work even if there is a energy source loss has been made: the case in which a loss of a energysource lead to a loss of a certain number of engines (which affects the maximum wing lift coefficient) has tobe considered too. However, the scenarios considered in this work are conservative in that sense.
Due to the uncertainity in the data for the 2035 horizon, an exploration of the design space, with thetechnology table available, and sensitivity analyses have been performed. The tradeoff shows that the mainparameter for the design process is the battery technology, with the PSFC reduction and maximum 2D liftcoefficient having minor effects on the FC and wing area. The conclusion of this analyses is that, until theuncertainty into the battery technology holds, an improving in others components’ technologies does notaffect the results in a relevant way.
From an analysis point of view, FAST performs a MDA: this means that it reaches a viable aircraft,which is not necessary the optimum one (respect to fuel consumption). Next step is to bring the sizing loophere described into a MDO framework. This work can be divided into different phases:
• First step is to choose a MDO framework and include the sizing loop into an optimization loop, in orderto find the set of TLAR and hybridization degree which minimize the energy and fuel consumption. Asuitable choice for the MDO framework could be OpenMDAO, an open software developed by NASAGlenn Research Centre, in collaboration with University of Michigan.39
• FAST is a tool based on a low fidelity level. A second step is then to study different fidelity levelsin FAST in order to assess the difference in results using multifidelity tools. These first two stepsconsidering different scenarios only regarding the battery technology.
• Finally, in order to better understand the effect of the technology level, a MDO formulation usinguncertainty quantification could be derived.40
Acknowledgments
The authors would like to thank:
• AIRBUS for the financial support in the frame of Chair CEDAR (Chair for Eco Design of AircRaft).
• The European Commission for the financial support within the frame of the Joint Technology InitiativeJTI Clean Sky 2, Large Passenger Aircraft Innovative Aircraft Demonstration Platform ”LPA IADP”(contract N CSJU-CS2-GAM-LPA-2014-2015-01).
• Michael Ridel and David Donjat for their contribution on cables and cooling system models as well asSylvain Dubreuil for his work on the sensitivity analysis.

References
1ACARE project, http://www.acare4europe.com/sria2F. Collier and R. Wahls, ARMD Stsrategic Thrust 3: Ultra-efficient Commercial Vehicles Subsonic Transport, Washington
DC, 24 May 20163R. Kirner, An Investigation into the Benefits of Distributed Propulsion on Advanced Aircraft Configurations, Ph.D. thesis,
Cranfield University, 20144A. Ko, J.A. Schetz and W.H. Mason, Assessment of the Potential Advantages of Distributed Propulsion for Aircraft,
International Society for Air Breathing Engines, ISABE-2003-1094, 20035E.M. Greitzer, P.A. Bonnefoy, E. De la Rosa Blanco, C.S. Dorbian, M. Drela, D.K. Hall, R.J. Hansman, J.I. Hileman,
R.H. Liebeck, J. Lovegren, P. Mody, J.A. Pertuze, S. Sat, W.S. Spakovszky, C.S. Tan, J.S. Hollman, J.E. Duda, N. Fitzgerald,J. Houghton, J.L. Kerrebrock, G.F. Kiwada, D. Kordonowy, J.C. Parris, J. Tylko, E.A. Wen and W.K/ Lord, N+3 AircraftConcept Design and Trade Studies, Final Report, vol.s 1&2, NASA/CD-2010-216794/VOL1-VOL2, 2010
6P. Schmollgruber, J. Bedouet, A. Sgueglia, S. Defoort, R. Lafage, N. Bartoli, Y. Gourinat and E. Benard, Use of aCertification Constraints Module for Aircraft Design Activities, 17th AIAA Aviation, Technology, Integration and OperationsConference, Denver, Colorado, 5-9 June 2017
7OpenVSP tool, http://www.openvsp.org8M.K. Bradley and C.K. Droney, Subsonic Ultra Green Aircraft Research: Phase II-VolumeII-Hybrid Electric Design
Exploration, NASA/CR-2015-218704/Volume II9A.T. Wick, J.R. Hooker, C.J. Hardin and C.H. Zeune, Integrated Aerodynamic Benefits of Distributed Propulsion, 53rd
AIAA Aerospace Sciences Meeting, AIAA SciTech Forum, Kissimee, Florida, 5-9 January 201510CleanSky Project, http://www.cleansky.eu/11H.-J. Steiner, P.C. Vranty, C. Gologan, K. Wieczorek, A.T. Isikveren and M. Hornung, Performance and Sizing of
Transport Aircraft Employing Electrically-Powered Distributed Propulsion, Deutscher Luft- und Raumfahrtkongress, Berlin,Germany, 2012
12Y. Li, J. Deng, C. Mu, Z. Xing and K. Du, Vertical Distribution of CO2 in the Atmospheric Boundary Layer: Charac-teristics and Impact of Meteorological Variables, Atmosperic Environment, Elsevier, Volume 91, July 2014
13C. Pornet, A. Seitz, A.T. Isikveren and M. Hornung, Methodology for Sizing and Performance Assessment of HybridEnergy Aircraft, Journal of Aircraft, January 2014. doi:10.2514/1.C032716
14G. Cinar, D.N. Mavris, M. Emeneth, A. Schneegans and Y. Fefermann, Sizing, Integration and Performance Evaluationof Hybrid Electric Propulsion Subsystem Architectures, 55th AIAA Aerospace Sciences Meeting, Grapevine, Texas, 9-13 January2017
15R. Seresinhe and C. Lawson, Electrical Load-Sizing Methodology to Aid Conceptual and Preliminary Design of LargeCommercial Aircraft, Journal of Aerospace Engineering, vol. 229(3), pp. 445-466, 2015
16W.P.J. Visser and M.J. Broomhead, GSP: A Generic Object-Oriented Gas Turbine Simulation Environment, NLR,NLR-TP-2000-267
17S. Burguburu and P.-M. Basset, Turboshaft Engine Presedesign and performance Assessment, 48thAIAA/ASME/SAE/ASEE Joint Propulsion Conference & Exhibit, Atlanta, Georgia, 30 July-1 August 2012
18Fraunhofer Institute for Systems and Innovation Research ISI, Technology Roadmap Energy Storage for Electric Mobility2030, http://www.isi.fraunhofer.de/isi-wAssets/docs/t/en/TRM-ESEM-2030_en_web.pdf
19J. Lowry and J. Larminie, Electric Vehicle Technology Explained, John Wiley & Sons, 2nd edition, 201220G. Cinar, D.N. Mavris, M. Emeneth, A. Schneegans and Y. Fefermann, Development of a parametric Power Generatin
and Distribution Subsystem Models at Conceptual Aircraft Design Stage, 55th AIAA Aerospace Sciences Meeting, Grapevine,Texas, 9-13 January 2017
21Ampere (Avion Motorisation rePartie Electrique de Recherche Eperimentale) project, https://www.onera.fr/sites/
default/files/actualites/breves/Fiche_AMPERE_VA.pdf22F. Anton, High-output Motor Technology for Hybrid-Electric Aircraft, eAircraft Electric & Hybrid Aerospace Technology
Symposium, Cologne, Germany, 16th November 201723S.F. Hoerner, Fluid-Dynamic Drag - Theoretical, Experimental and Statistical Information, published by the author,
196524Catalogue NORMES Defense 2016, Direction Generale de L’Armement (DGA), Ministre de la Defense Francaise, 201625A.B. Lambe and J.R.R.A. Martins, Extensions to the Design Structure Matrix for the Description of Multidiplinary
Design, Analysis, and Optimization Processes, Structural and Multidisciplinary Optimization, vol. 45, no. 2, pp.273-284, 201226W.P. Dupont and C. Colongo, Preliminary Design of a Commercial Transport Aircraft, class notes, ISAE-
Supaero&Airbus, English edition, 201427CeRAS - Central Reference Aircraft Data System, https://ceras.ilr.rwth-aachen.de/28M.K. Bradley and C.K. Droney, Subsonic Ultra Green Aircraft Research: Phase I Final Report, NASA, NASA/CR-2011-
216847, 201129M. Belleville, Simple Hybrid Propulsion Model for Hybrid Aircraft Design Space Exploration, MEA - More Electric
Aircraft conference, Toulouse, France, Febraury 201730C. Friedrich and P. Robertson, Hybrid-Electric Propulsion for Aircraft, Journal of Aircraft, vol. 52, n. 11, January 201531J. Delhaye, Electrical Technologies for Aviation of the Future, Airbus, 201532HASTECS project: programme de recherche aeronautique europeen mene par le Laplace, http://www.inp-toulouse.fr/
fr/la-recherche/l-excellence-autrement/l-actualite-recherche/hastecs.html33J.I. Hileman, J.B. Katz, J.G. Mantilla and G. Fleming, Payload Fuel Energy Efficiency as a Metric for Aviation Envi-
ronmental Performance, 26th International Congress of the Aeronautical Sciences, Alaska, 14-19 September 2008

34G. Blatman and B. Sudret, Efficient Computational of Global Sensitivity Indices Using Sparse Polynopmial ChaosExpansions, Reliability Engineering & System Safety, 95(11):1216-1229, 2010
35S. Dubreuil, M. Bervellier, F. Petutjean and M. Salaun, Construction of Bootstrap Confidence Intervals on SensitivityIndices Computed by Polynomial Chaos Expansion, Reliability Engineering & System Safety, 121(Supplement C):263-275, 2014
36R.H. Cameron and W.T. Martin, The Orthogonal Development of Non-Linear Functionals in Series of Fourier-HermiteFunctionals, Annals of Matehmatics, 48(2):385-392, 1947
37G. Blatman and B. Sudret, Adaptive Sparse Polynomial Chaos Expansion Based on Least Angle Regression, Journal ofComputational Physics, 230(6):2345-2367, 2011
38B. Sudret, Global Sensitivity Analysis Using Polynomial Chaos Expansions, Reliability Engineering & System Safety,98(7):964-979, 2008; Bayesian Networks in Dependability
39OpenMDAO software, http://openmdao.org/40L. Brevault, M. Balesdent, N. Berend and R. Le Riche, Decoupled MDO formulation for interdisciplinary coupling
satisfaction under uncertainty, AIAA Journal, Vol.54(1): 186-205, DOI: 10.2514/1.J054121, 2016

A. Mass breakdown standard
As mentioned in section IV, the mass breakdown standard used in FAST is based on the French normAIR 2001/D. The detailed mass breakdown is reported in Table 16: the aircraft has been divided into fivecategories: airframe, propulsion, systems and fixed installation, operational items and crew, plus fuel weightand payload. Each category has been divided into other subsections, one for each component, as clearlyshown in the table. In category B, the sections B4, B5, B6, B7 and B8 have been added in order to considerthe hybrid architecture too.
Table 16. Standard for mass breakdown used in FAST
A Airframe
A1 Wing
A2 Fuselage
A3 Horizontal and Vertical tail
A4 Flight controls
A5 Landing gear
A6 Pylons
A7 Paint
B Propulsion
B1 Engines
B2 Fuel and oil systems
B3 Unusable oil and fuel
B4 Cables and cooling system
B5 Batteries
B6 Generators
B7 IDC
B8 Bus protection
C Systems and fixed installations
C1 Power systems (APU, electrical and hydraulical system)
C2 Life support systems (Pressurization, de-icing, seats, ...)
C3 Instrument and navigation
C4 Transmissions
C5 Fixed operational systems (radar, cargo hold mechanization)
C6 Flight kit
D Operational items
E Crew
F Fuel
G Payload
B. Methodology of preliminary design of a ducted fan
In this section the methodology used for the sizing of a ducted fan is explained. The scheme of the fanis shown in Fig. 13. Knowing the operating condition and the compressor ratio, it is possible to deduce thepower required and then the size of the inlet and outlet area.
The input for the model are:
- Gas constants for the air: γ=1.4 and R=287J kg−1 K−1;
- Mach number in flight M0

Figure 13. Scheme of a ducted fan for the model presented
- Altitude z, from which it is possible to deduce the static pressure and temperature ps0 and θs0;
- The fan pressure ratio FPR, defined as the ratio between the total pressure at the exit and at the inletof the fan;
- A reference surface Sref , typically the wing surface;
- The non-dimensional thrust coefficient of one fan, defined as
CT =T
γ2 ps0M
20Sref
It has to be noted that the thrust coefficient is referred to the thrust required by a single ducted fan, andnot the total thrust. The process is described below.
1. The first step is to compute the total pressure and temperature at the inlet, using the de Saint-Venantrelations:
pt0 = ps0
(1 +
γ − 1
γM2
0
) γγ−1
θt0 = θs0
(1 +
γ − 1
γM2
0
)2. Then it is possible to compute the Mach number at the exit of the nozzle:
M3f =
√2
γ − 1
[(1 +
γ − 1
γM2
0
)FPR
γ−1γ − 1
]= f(M0,FPR)
This relation is obtained considering the nozzle adapted, that is the pressure at the exit of the nozzleis equal to the ambient pressure (p3f = ps0). It is also possible to compute the velocity ratio β asfollows:
β =V3fV0
=M3f
M0
√θ3fθ0
=M3f
M0
√√√√FPRγ−1γ
1 + γ−12 M2
0
1 + γ−12 M2
3f
= f(M0,FPR)
ηf being the polytropic efficiency of the fan. This value is introduced considering the ratio betweenthe total pressure and the total temperature through the fan:
θt3fθt0
=
(pt3fpt0
) γ−1γηf
If ηf=1 the compression is isentropic. In practice it is possible to compute the polytropic efficiencywith the semiempirical relation:
ηf = 0.98− 0.08 (FPR− 1)
which take into account the effect of the FPR: the higher is, the less the compression is efficient.
3. At this stage it is possible to compute the nozzle exit area:
S3f
Sref=CT2
FPRγ(1−ηf )−1
γηf
(1 + γ−1
2 M20
1 + γ−12 M2
3f
) 1γ−1
1
β2 − β = f(M0,FPR, CT )
Finally, supposing the section circular, it is possible to deduce the diameter:
D3f = 2
√A3f
π
4. At this step it is possible to compute the mass flow and then the power required by the fan. The massflow which exits from the nozzle is:
m = p3fM3fS3f
√γ
Rθ3f= p3fM3fS3f
√γ
Rθt3f
(1 +
γ − 1
2M2
3f
) 1+γ2(1−γ)
with pt3f = pt0FPR from the fan pressure ratio definition and Tt3f = Tt0FPRγ−1γηf .
The total enthalpy variation is then
∆H = cp(θt3f − θt0) =γR
γ − 1θt0
(FPR
γ−1γηf − 1
)and finally the power required by the fan is
Pfan = ∆Hm
5. It is finally possible to compute the fan area. For aerodynamic reasons, the Mach number at the fansection is 0.65, with this assumption the area is computed from the mass flow and the total conditionsas
Sfan =m
pt0Mfan
√γ
Rθt0
(1 + γ−1
2 M2fan
) 1+γ2(1−γ)
Knowing then the ratio between the hub and tip radius σ, it is possible to compute the fan radius:
rfan =
√Sfan
π(1− σ2)
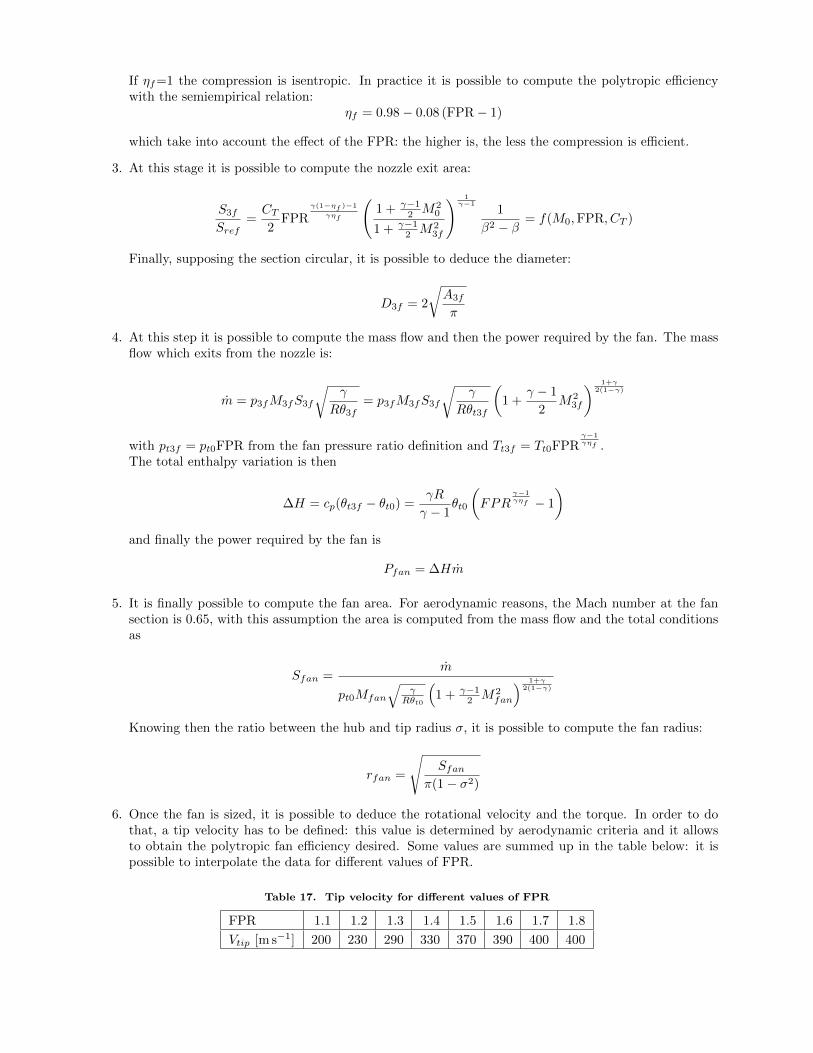
6. Once the fan is sized, it is possible to deduce the rotational velocity and the torque. In order to dothat, a tip velocity has to be defined: this value is determined by aerodynamic criteria and it allowsto obtain the polytropic fan efficiency desired. Some values are summed up in the table below: it ispossible to interpolate the data for different values of FPR.
Table 17. Tip velocity for different values of FPR
FPR 1.1 1.2 1.3 1.4 1.5 1.6 1.7 1.8
Vtip [m s−1] 200 230 290 330 370 390 400 400

The rotational speed, in round per minute, is then:
Ωfan =Vtiprfan
60
2π
and finally the torque, in N m, is
Cfan =Pfan
Ωfan2π60
The process just described has an error estimated of about 10%. It is still valid for off design conditions,the only difference is that a different value of FPR has to be found, in order to provide the same S3f . Inpractice a lower FPR corresponds to a lower RPM on a real fixed-pitch fan. This is automatically done inthe code.
C. Parametric analysis results
In this section the detailed results for the design space exploration (presented in Section VII) are reported.As explained, each study refers to a variation of only one technology, keeping all the others constant to thebase values (Table 12). The results are shown in a real and a normalized scale (the same used in Fig. 10),in order to better understand the overall effect of each variation.
Figure 14. Parametric analyses with respect to battery technology. (E/m) is the battery specific energydensity, MTOW the Maximum TakeOff Weight, Sw the wing area and FC the fuel consumption

Figure 15. Parametric analyses with respect to generator technology. (P/m) is the generator specific powerdensity, MTOW the Maximum TakeOff Weight, Sw the wing area and FC the fuel consumption
Figure 16. Parametric analyses with respect to electric motors technology. (P/m) is the electric motor specificpower density, MTOW the Maximum TakeOff Weight, Sw the wing area and FC the fuel consumption

Figure 17. Parametric analyses with respect to the number of engines. NEM is the number of engines (10, 20and 40), MTOW the Maximum TakeOff Weight, Sw the wing area and FC the fuel consumption
Figure 18. Parametric analyses with respect to maximum 2D lift coefficient. Cl,max is the maximum 2D liftcoefficient (4, 4.5 and 5), MTOW the Maximum TakeOff Weight, Sw the wing area and FC the fuel consumption

Figure 19. Parametric analyses with respect to PSFC variation. ∆(PSFC) is the PSFC reduction (-10%, 0%and +10%), MTOW the Maximum TakeOff Weight, Sw the wing area and FC the fuel consumption