
Explaining Market-to-Book - westga.edu - UWG - UWG | …bquest/2013/MarketToBook2013.pdf ·...
32
Explaining Market-to-Book 1 Explaining Market-to-Book The relative impact of firm performance, growth, and risk By Anurag Sharma, Ben Branch, Chetan Chgawla, and Liping Qiu Peer Reviewed Anurag Sharma [email protected] is an Associate Professor of Management, Ben Branch is a Professor of Finance, Chetan Chawla is a Ph.D. Candidate in Strategic Management, and Liping Qiu is a Ph.D. Candidate in Finance, Isenberg School of Management, University of Massachusetts, Amherst.
Transcript of Explaining Market-to-Book - westga.edu - UWG - UWG | …bquest/2013/MarketToBook2013.pdf ·...
Explaining Market-to-Book
1
Explaining Market-to-Book
The relative impact of firm performance, growth, and risk
By Anurag Sharma, Ben Branch, Chetan Chgawla, and Liping Qiu
Peer Reviewed
Anurag Sharma [email protected] is an Associate Professor of Management, Ben Branch is a Professor of Finance, Chetan Chawla is a Ph.D. Candidate in Strategic Management, and Liping Qiu is a Ph.D. Candidate in Finance, Isenberg School of Management, University of Massachusetts, Amherst.

Explaining Market-to-Book
2
ABSTRACT
The Market-to-Book ratio, as a rough proxy for Tobin’s q, has been a common measure of firm value for over two decades. The ratio has, however, had two distinct interpretations. One emphasizes it as reflecting efficiency and growth, and the other as proxy for risk. Herein we explore these interpretations in light of the constant growth discount model. We argue that both perspectives are theoretically sound. Upon testing these interpretations, we find that efficiency and growth variables explain the bulk of the variance in the MB ratio, and the contribution of risk is both mixed and limited. Our results suggest that the MB ratio largely reflects the success of managers in delivering strong operating performance and growth in the net assets of the firm.

Explaining Market-to-Book
3
The relation between the firm’s market price and book equity has long been of interest to researchers. The Market-to-Book (MB) ratio is widely used in the literature but in two very distinct ways. On the one hand, it is taken to indicate the value that the market places on the common equity or net assets of a company (Ceccagnoli, 2009; Lee & Makhija, 2009), or as a reflection of the ability of managers to use assets effectively and to grow the firm; on the other hand, the market-to-book ratio is linked to risk (Griffin & Lemmon, 2002; Liew & Vassalou, 2000). These two interpretations are embedded in the literatures of strategy and finance, respectively, and their use in research is driven by questions particular to the two disciplines. The drivers of both profit and risk are important for strategy scholars, of course, as managers’ actions to maximize the one and control the other are considered central to creating value (Bettis, 1983; Schendel & Hofer, 1979).
Herein we explore and empirically evaluate the two interpretations of the MB ratio. First we briefly review prior research in the two traditions and then discuss the relationship in light of the constant growth dividend discount model of valuation (cf. Varaiya, Kerin & Weeks, 1987). Finally, we report the results of our empirical study where we test relative effects that various measures of risk and accounting performance have on the Market-to-Book (MB) ratio.
Background & Literature
In a seminal paper, Tobin (1969) theorized that the economy-wide rate of capital goods investment was related to the ratio (q) of the market value of assets to the replacement costs of those assets. The changes in the rate of return brought about by a changing market value in relation to replacement cost, Tobin argued, regulated the rate of investment in durable goods. Conversely, increases in the marginal efficiency of capital (rate of return) pulled up its valuation in relation to cost.
Quickly coined Tobin’s q in honor of the author, this ratio of market value to reproduction cost was adapted from macroeconomics to the industry and firm level of analysis. Different authors have used slightly different formulations of Tobin’s q, all in an effort to capture the theoretical argument that relates market value to the cost of replacing those assets. Yet, the literature has shown equivalence among many of the formulations generally used. In a study of 400 industrial firms from 1978 to 1983, for instance, Varaiya, Kerin and Weeks (1987) showed that market-price to book-value ratio and Tobin’s q are equivalent measures of value creation both theoretically and empirically. In a study of 90 metal mining companies from 1989 through 1996, Adam and Goyal (2008) found a correlation of 0.70 between market to book-assets ratio and market to book-equity ratio.
Yet, the interpretations tended to differ in the strategy and finance literatures. In the strategy literature, for instance, the ratio is largely used to indicate the premium that the market pays for the net assets; a high MB ratio is taken to indicate a high marginal efficiency of capital (rate of return) and reflects high value-add by the management over the replacement cost of net assets. In the finance literature, where the relationship is operationalized in reverse, the Book-to-Market (BM) ratio is mainly seen as a proxy for bankruptcy risk; high BM ratio (or low MB ratio) is taken to indicate high risk to equity investors and, hence, higher the expected returns. Each is discussed below.
The earliest adaptations of Tobin’s insights were in industrial organization and in the merger literature in the banking industry. Notwithstanding the significant problems in measuring the replacement costs of assets, Lindenberg and Ross (1981) used the q ratio as a proxy for the presumed monopoly rents earned by firms. Similarly, Smirlock, Gilligan, and Marshall (1984) used market-to-book to examine the structure-conduct-performance paradigm. In a different vein, the studies in banking used market-to-book as a proxy for the premium paid in mergers (Rogowski & Simonson, 1987; Cheng, Gup & Wall, 1989).
Explaining Market-to-Book
4
Strategy Literature
That the MB ratio incorporates both historical accounting and forward-looking market indicators of firm performance provides a theoretical rationale for using the MB ratio as a measure of performance (Lee & Makhija, 2009; Ceccagnoli, 2009; Bharadwaj, Bharadwaj, & Konsynski, 1999). Earnings manipulation and other distortions, when present, usually affect the income statement and create errors in the earnings-based accounting measures of performance (Fisher & McGowan, 1983; Amit & Wernerfelt, 1990). Book value – a balance sheet variable – mitigates that problem because it is a cumulative variable and therefore somewhat less susceptible to manipulation by managers who are usually more concerned about the bottom line reported earnings. Because of its cumulative nature, the book value is also relatively more stable than annual earnings and cash flows. Clearly, being a residual computed as net of assets and liabilities, book value too is susceptible to measurement errors in the balance sheet.1 Yet, to the extent that such errors are not systematic, they tend to cancel out in large samples.
The MB ratio is also an attractive measure of performance because it indicates the differential between net assets of the firm and the valuation that the market assigns to them. That is, the ratio reflects the premium (or discount) that the market gives to the firm on its net assets and, as such, reflects the efficiency with which the market views the firm as being managed. High premiums suggest that every additional dollar invested in the net assets of the firm would yield attractive returns for the investors; conversely, low premiums indicate that the returns on additional investments are unlikely to be attractive. As such, consistent with the logic in Tobin’s original paper, the MB ratio reflects the incentives for additional capitalinvestments to grow the firm (Goranova, Dharwadkar, & Brandes, 2010; Lenox, Rockart & Lewin, 2010; Tong & Ruer, 2006). Consequently, Market-to-Book is indicative not only of efficiency in asset utilization but also of future growth potential.
The literature on the use of MB ratio as a dependent variable has burgeoned since the mid-1980s. The tradition in the strategy literature is now well-established to use market measures and especially market-to-book ratio as a measure of firm performance (for example, (Amit & Livnat, 1988; Amit & Wernerfelt, 1990; Anand & Singh, 1997; Barton, 1988; Becker & Gerhart, 1996; Chang, 2003; Cheng, Gup, & Wall, 1989; Cho & Pucik, 2005; Dushnitsky & Lenox, 2006; Dutta, Narasimhan, & Rajiv, 1999, 2005; Fombrun & Shanley, 1990; Huselid, 1995; Huselid, Jackson, & Schuler, 1997; Kor & Mahoney, 2005; Lu & Beamish, 2004; McDonald, Khanna, & Westphal, 2008; Montgomery & Wernerfelt, 1988; Morck, Shleifer, & Vishny, 1989; Murray, 1989; Nayyar, 1992, 1993; Rogowski & Simonson, 1989; Short, Ketchen Jr, Palmer, & Hult, 2007; Tanriverdi & Venkatraman, 2005; Varaiya, Kerin, & Weeks, 1987; Welbourne & Andrews, 1996; Wiggins & Ruefli, 2002).
Numerous studies on corporate diversification have used market-to-book as a measure of firm performance (e.g., Amit & Livnat, 1988; Anand & Singh 1997; Barton, 1988; David, O'Brien, & Yoshikawa, 2008; Kumar, 2010; Lu & Beamish, 2004; Montgomery & Wernerfelt, 1988; Nayyar, 1993; Tanriverdi & Venkatraman, 2005; Wernerfelt & Montgomery, 1988). The literature on organizational slack, for instance, has often used market-to-book as a measure of firm performance (Chakravarthy, 1986; Combs & Ketchen Jr, 1999; Davis & Stout, 1992; Gibbs, 1993; Iyer & Miller, 2008; O'Brien, 2003; Pitcher & Smith, 2001; Surroca, Tribo, & Waddock, 2010; Wang, Choi, & Li, 2008; Wang, He, & Mahoney, 2009). The relationship between market price and book value of the firm has also been extensively used in the literature on top management teams (e.g., Murray, 1989; Morck, Shleifer & Vishny, 1989), and on work practices (e.g., (Becker & Gerhart, 1996; Huselid, 1995; Huselid et al., 1997; Welbourne & Andrews, 1996)).
1 Because of accounting differences across industry and firms, book value is at best an approximate measure of
contributions to equity by the shareholders of the firm. See Fruhan (1979) and Vairaya et.al. (1987).

Explaining Market-to-Book
5
Strategy scholars have, in short, frequently used the ratio of market-to-book value as a key measure of firm performance – in terms of both efficiency and growth. For theoretical reasons as above and because of empirical precedence, along with our derivation in the section below, we expect that the market to book ratio correlates systematically with efficiency and growth measures of firm performance
Finance Literature
Scholars in Finance have seen the relationship of market-to-book value mostly as a proxy for risk and as correlating with the cross-section of returns to common equity holders. Note that, in the finance literature, the relationship is operationalized as the reciprocal of the MB ratio – as Book-to-Market (or BM ratio) – where book is the common equity or net assets. Yet, the two variables of interest, book value and market value, remain the same in the two traditions.
A few early efforts notwithstanding, it was not until the 1990s that a series of Fama and French papers spurred interest in the relationship between market and book value of the firm. In an early paper, the authors highlighted “several empirical contradictions” (1992a: 427) to the presumed sufficiency of beta (β) in explaining portfolio cross-sectional returns. Ever since, they have continued to highlight the prevailing anomalies as reflected in the disconnect between average cross-section of returns on equities and the market βs of the Sharpe (1964) and Lintner (1965) asset pricing model. The disconnect appears to hold true when using the consumption βs of the inter-temporal asset pricing model (Breeden, 1979; Reinganum, 1981; Breeden, Gibbons and Litzenberger, 1989). Furthermore, invoking Banz (1981), Bhandari (1988), Basu (1983) and Rosenberg, Reid and Lanstein (1985), Fama and French (1993) claimed that variables which aren’t part of the capital asset pricing theory, such as size, leverage, earnings-to-price, and book-to-market had reliable power to explain the cross section of average returns. Of these, size and book–to-market, in particular, absorbed the roles of leverage and earnings to price, and they “proxy for common risk factors in stock returns” 1993, p. 5). They argue in effect that, to the extent that assets are priced rationally, high book-to-market reflects high risk.
The initial reaction to Fama and French (1992a, 1993) was one of skepticism, with concern that the relationship observed between book-to-market and average returns was an artifact of the sample chosen (Black, 1993; MacKinlay, 1995). Contrary out-of-sample evidence was then presented by Chan, Hamao and Lakonishok (1991), Capaul, Rowley and Sharpe (1993). In a 1998 paper, Fama and French presented data from thirteen major markets (including the U.S.) and showed return premium for value (high book-to-market) stocks in 12 of 13 of those markets. Barber and Lyon (1997) found similar value premium for financial firms. Davis (1994) presented evidence of the value premium for U.S. stocks extending back to 1941. Davis, Fama and French (2000) extend this result back to 1926 and include the whole population of NYSE industrial firms. Taken altogether, this research generally supports Fama and French (1992a, 1993).
Researchers have argued that the relationship between book-to-market and equity returns reflects a reasonable trade-off between risk and return. Assuming that the markets are efficient, they argue, the fact that high book-to-market empirically correlates with higher returns must mean that the
book-to-market ratio reflects risk. Starting with the assumption of efficient markets, in other words, high book-to-market is argued to be a proxy for greater risk. Vassalou and Xing (2004) further support the risk-based interpretation for the book-to- market. Even though behavior finance scholars have objected (e.g., Lakonishok, Shleifer & Vishny, 1994), the proponents of the rational pricing/efficient market hypothesis have continued to defend the risk-reward linkage in the excess returns for high book-to-market stocks (Davis et.al. 2000; Malkiel, 2003; Fama & French 2006). As such, given the empirically-driven assertions in the finance literature we expect that the market-to-book ratio will correlate with alternate measures of risk.
Explaining Market-to-Book
6
Conceptualizing Risk
Even though book-to-market continues to be used as an important indicator of risk in the finance literature, the nature of that risk and how it ought to be measured remains unclear. Strategy scholars usually go beyond market risk to other forms of risk that a firm faces. The concern in strategy has been broadly with the risk-return tradeoff and the influence that risk may have on firm performance which is usually indicated by accounting measures. Amit and Wernerfelt (1990) may be one of the few papers in which the relationship between MB ratio (Tobin’s q) and risk is directly evaluated. Following the argument in Bettis (1983) that managing business risk is at the heart of strategic management, the authors outline the motivations that firms usually have for wanting to do so. They distinguish business or unsystematic risk from systematic or market risk, and found in their empirical analysis that Tobin’s q was negatively associated with business risk. That is, the lower the business risk, the higher was the market premium for the net assets.
Recognizing that firms have multiple stakeholders, scholars have disaggregated and measured risk differently in order to capture its different dimensions. For instance, widely used are variance-based measures such as the standard deviations of return on equity and return on assets (Armour & Teece, 1978; Miller & Bromiley, 1990). Cootner and Holland were among the first to advocate such measures, arguing that “the dispersion of company rates of return around the average rate of return for the industry in which they belong is an indication of the riskiness of an investment in that industry… [and] the standard deviation of such rates of return indicates to an investor the likelihood that he would fare differently from the industry average” (1963: 4).
In their analysis of alternative measures of risk, Miller & Bromiley (1990) factor analyzed nine measures and parceled risk into three broad categories. What they called income stream risk was indicated by measures such as the standard deviation of ROE. Following finance theory, they used beta to indicate market risk, and operationalized strategic risk by measures such as capital intensity. Other authors have also pursued the notion that risk is a multi-dimensional construct, as different stakeholders may be interested in different conceptions and measures of it. In this vein, Ruefli, Collins and Lacugna (1999), who conducted a survey of more than 100 papers over a 16-year period, discussed risk in two broad categories, the variance based measures and beta, both incorporated in Miller & Bromiley (1990) paper (Bloom & Milkovich, 1998).
Except for Amit and Wernerfelt (1990), research in strategy has for the most part not tried to relate risk to the market-to-book ratio. The concern has mostly been with alternative indicators of risk and with the risk-return tradeoff as in the stream spawned by Bowman (1980).
Our concern here is with using appropriate measures of risk as discussed in the literature to evaluate the extent to which the MB ratio may be an indicator of firm performance (efficiency and growth) as opposed to risk. The two distinct conceptions of the market-to-book ratio – efficiency and growth (performance) on the one hand and risk on the other – raise the question as to their relative merits. Where strategy scholars view the MB ratio as indicating managerial efficiency and future growth prospects, finance scholars emphasize the role of the MB ratio in capturing some unknown risk that is already efficiently incorporated in the cross-section of returns. To what extent, then, is the MB ratio reflective of firm performance and to what extent does it reflect risk? We address this question empirically, but guide our analysis by first discussing the relationship in light of the dividend discount model.
A Theoretical Reconciliation & Hypotheses

Explaining Market-to-Book
7
The relationship between the ratio of market and book value and firm level variables can be derived from the steady state constant growth dividend discount model2 as follows:
Where,
M = Market Value of Equity D = Cash Dividends at the beginning of the year g = Growth rate r = Required rate of return or discount rate
As per the Capital Asset Pricing Model, the discount rate is proportional to market risk, β. Yet, as discussed above, risk is a multi-dimensional construct. Accordingly, the appropriate discount rate may reflect a broader set of risks. Later in the paper, we follow Miller and Bromiley (1990) to operationalize three risk categories as: market risk, business risk, and strategic risk.
Given that the dividend paid can be re-written as payout ratio of earnings, equation 1 yields,
Where,
e = Total Net Earnings PO = Payout ratio (= Cash Dividend/Total Net Earnings) Assuming that all earnings are dividends whether disbursed or retained, and dividing both sides by book value (B), we get
Thus theoretically the market-to-book ratio incorporates both performance and risk factors. The equation above shows that the (M/B) ratio is a positive function of performance as indicated by
return on equity3 and growth, and also a positive function of the dividend payout ratio. Similarly, as indicated, the MB ratio is also a negative function of risk, as incorporated in the discount rate.
As such, based on the discount model formulation as above, we hypothesize as follows:
H1a: MB ratio will be positively associated with efficiency as measured by Return on Equity.
2 The standard assumption embedded in the dividend discount model is that market price reflects the value of the firm as
measured by appropriately discounting a growing stream of future dividends into perpetuity. In deriving their formulation, Vairaya et. al. (1987) also begin with the dividend discount model but break the discount stream into 2 components, one through period and the other up into perpetuity. In our formulation, we combine those 2 components into one. 3 Using the standard DuPont formulation, ROE can be further broken down into 3 components as (Total
Earnings/Revenues) * (Revenues/Total Assets) * (Total Assets/Common Equity) Or (Net Profit Margin * Asset Efficiency * Financial Leverage).

Explaining Market-to-Book
8
H1b: MB ratio will be positively associated with the growth rate of the firm. H2: MB ratio will be negatively associated with risk.
While the steady state constant growth discount model implies that the MB ratio should vary as indicated, the relative impacts of efficiency, growth and risk are less clear. As with any ratio, the MB ratio could be raised by increasing the positive numerator (ROE) and the negative denominator (growth) or, conversely, it could be increased by decreasing its (positive) denominator (risk). Aside from this straightforward arithmetic relationship, we are not aware of any readily available theoretical guidance as to the relative impact on the MB ratio of efficiency and growth on the one hand and of risk on the other. Mathematically, at least, a decrease in risk can have the same quantitative effect on the ratio as an increase in efficiency or growth.
How much control managers have over the independent variables is important, therefore, to understanding their significance for strategic management. Managers’ choices on a range of issues such as resource allocation have a direct effect on their firm’s efficiency and growth (cf. Penrose, 1959). Managers are also thought to have a good deal of incentive to control business risk (cf. Amit & Wernerfelt, 1990). How much risk managers can actually control is, however, less clear – depending of course on how risk is defined and measured. Market risk measured as beta is likely to be mostly outside the direct control of the managers as is the risk associated with the fundamental nature of the business (e.g., capital intensity). The risk that the managers are likely to be able to control is the variability in the returns, although that too may be influenced to a large degree by industry and economy-wide forces of supply and demand and, as such, outside the direct control of the managers.
In effect, managerial action may have more impact on efficiency and growth than on risk. As such, to the extent that the market valuations capture value-add by managers rather than risk factors outside their control, we would expect the MB ratio to be more strongly associated with the efficiency and growth variables in the constant growth discount model. Consequently, our third set of testable hypotheses are:
H3a: MB ratio will be more strongly associated with firm profitability than with risk.
H3b: MB ratio will be more strongly associated with firm growth rate than with risk.
The empirical model with which we test the above hypotheses is as follows:4
α + β1*ROE + β2*Growth Rate + β3*Risk + ε
As such, our hypotheses can be expressed as the following statistical inequalities. H1a: β1>0 and H1b:β2>0; H2: β3<0; H3a: |β1|>|β3| and H3b: |β2|>|β3|. We test the hypotheses using the methods described below.
Data & Analysis
4 Our formulation is very similar to that of Varaiya et.al. (1987), who combined ROE and required rate of equity return (risk)
into a single spread (ROE-r). In effect, they restricted the coefficients on both variables. We test these separately.

Explaining Market-to-Book
9
We begin our empirical testing of the three hypotheses by constructing a database (from COMPUSTAT) consisting of the S&P 500 companies, for the period 2000-2009. The mid-sized and large companies contained in the index represent about two-thirds of the market valuation in the United States. Each year after 2000, the membership of our sample was revised to reflect changes in the index's composition. Periodic updates maintain the index’s basic character as reflecting the overall domestic equities market. By following the S&P’s membership over time, we were able to work with a set of companies which S&P selected in order to track the overall economy and, as such, minimize the risk of selection bias in our sample. Accordingly our dataset is a well-structured representative sample of large to midsized U.S. companies.
Operationalization of Variables
Market-to-Book, the dependent variable, was computed as the market value of the firm divided by
the total common equity of the firm as of the end of its fiscal year.
Independent Variables
Return on Equity (ROE)5: Total Net Income divided by Total Common Equity as of the end of the
fiscal year. As discussed above, we also used the DuPont formulation to decompose ROE into its 3 components, Profitability, Asset Efficiency, and Financial Leverage.
Dividend Payout Ratio (PO): Annual Cash Dividends divided by Total Net Income as of the end of the fiscal year.
Growth Rate (GR): Rate of the growth of book value per share for the firm over a 7 year period leading up to the year of analysis.
Risk (Multiple Measures): Given the multiple formulations of risk in the literature, we used different measures for different definitions of risk. We also tested our empirical analysis for robustness by using different computations for the same definition. For instance, we computed systematic or market risk, beta, using both CAPM and the market model. The main results did not change from using alternate measures. Appendix 1 shows the different formulations of risk.
Control Variables
Firm size, overall MB ratios of the market and industry sectors may potentially influence the dependent variable, therefore the following control variables were incorporated in the regression equations.
Size (MVAL): Company size was operationalized as the market valuation of the common equity of
the firm, computed as price per share multiplied by total common shares outstanding as of the end of the fiscal year.
Market Level (Sample MB): The overall level of the market in any given year during the period of
analysis was the average Market-to-Book ratio for that year.
5 We also computed the three components of ROE as in the DuPont model. Profitability (ROS): Total Net income divided
by Revenues as of the end of the fiscal year. Asset Turnover (ATO): Revenues divided by Total Assets as of the end of the fiscal year. Leverage (LEV): Total Assets divided by Common Equity as of the end of the fiscal year. Each was standardized and windsorized for inclusion in a separate regression model, the results of which are reported later in the paper.
Explaining Market-to-Book
10
Industry (Financial Sector): This is a dummy variable coded as 1 if the firm was in the financial
services sector (2-digid SIC or Major Group 60-69)
In order to be able to compare the relative effects on the Market-to-Book ratio, all variables
(except the overall Market Level and the dummy for the Financial Sector) were standardized and windsorized by each year to within 3 standard deviations of the mean.
Analysis & Results
The average Market-to-Book (MB) ratio during the study period varied from a high of 5.54 in 2004 to a low of 2.36 in 2008 (Table 1). The trends in these numbers also reflect the first recession in the study period when the ratio fell from 5.26 in 2001 to 2.76 in 2003; and then the second recession when the ratio fell from 5.54 in 2004 to 2.36 in 2008. The variation in the medians was less pronounced but was similar to the average. To capture the cyclical nature of MB, its average value for each year was included as a control variable in our regressions.6
The last column in Table 1 shows the GDP growth rates for the period of our study. According to the Bureau of Economic Analysis, the U.S. economy grew at the rate of 4.1% in 2000, but dropped to 1.1% in 2001 and then grew at the rates of 1.8%, 2.5% and 3.5% the following three years. The growth rate slowed to 3.1% in 2005 and was 2.7%, 1.0%, -0.3% and -3.5 percent during the following four years. As such, we divided the sample into 2 periods: Up Cycle (2001-2004) and Down Cycle (2005-2009) to reflect the growing and slowing periods in the overall economy. We also created a subsample Recession (2007-2009) for the period when the growth rate fell particularly sharply. The regression analysis for each of the three periods is reported later in this section.
6 These data reflect historical trends as in two other studies that have analyzed the changes in market-to-book ratios over
the years. Branch and Gale (1983) show that the average MB value for the largest 600 industrial companies declined from about 2.3 in 1968 to about 1.0 in 1981. Branch, Sharma, Gale, Chichirau, & Proy (2005) show that the average MB for their S&P 500 sample rose from about 1.0 at the end of 1980 to about 5.0 by 2000.

Explaining Market-to-Book
11
Table 1
Profit or Risk?
Market-to-Book Ratio1 and GDP Growth Rate
Year Med Avg Stdev GDP GR2
2000 3.00 5.26 12.50 4.10%
2001 2.74 4.13 11.28 1.10%
UpC
ycle
2002 2.24 2.80 11.06 1.80%
2003 2.66 2.76 14.59 2.50%
2004 2.74 5.54 37.45 3.50%
2005 2.69 3.76 8.08 3.10%
Dow
nC
ycle
2006 2.77 4.09 12.05 2.70%
2007 2.82 4.45 18.08 1.90%
Recessio
n
2008 1.71 2.36 5.05 -0.30%
2009 2.09 3.80 19.38 -3.10%
1. Market Value of Equity / Book Value of Equity
2. Annual growth rate from the Bureau of Economic Analysis (bea.gov)> Revision December 2012. Subsequent growth rates are : 2.4% (2010) & 1.8% (2011).
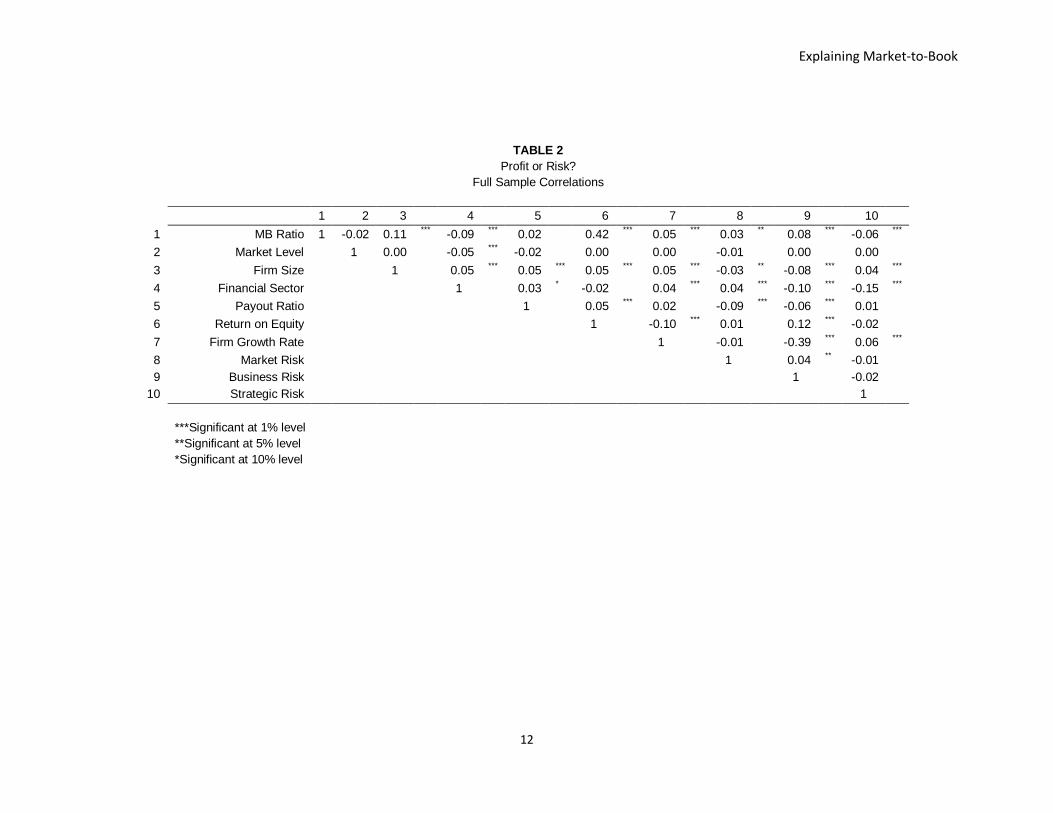
Full sample correlations among the variables are shown in Table 2. All the regressions were checked for autocorrelation using the Durbin-Watson statistic, which are reported in the regression tables. All the regressions were also found to be free of multicollinearity, when checked using the correct option in the SAS regression codes.
Explaining Market-to-Book
12
TABLE 2
Profit or Risk?
Full Sample Correlations
1 2 3
4
5
6
7
8
9
10
1 MB Ratio 1 -0.02 0.11 ***
-0.09 ***
0.02 0.42
*** 0.05
*** 0.03
** 0.08
*** -0.06
***
2 Market Level
1 0.00 -0.05 ***
-0.02 0.00 0.00 -0.01 0.00 0.00
3 Firm Size
1 0.05 ***
0.05 ***
0.05 ***
0.05 ***
-0.03 ** -0.08
*** 0.04
***
4 Financial Sector
1 0.03 * -0.02 0.04
*** 0.04
*** -0.10
*** -0.15
***
5 Payout Ratio
1 0.05 ***
0.02 -0.09 ***
-0.06 ***
0.01
6 Return on Equity
1 -0.10 ***
0.01 0.12 ***
-0.02
7 Firm Growth Rate
1 -0.01 -0.39 ***
0.06 ***
8 Market Risk
1 0.04 ** -0.01
9 Business Risk
1 -0.02
10 Strategic Risk
1
***Significant at 1% level
**Significant at 5% level
*Significant at 10% level

Explaining Market-to-Book
13
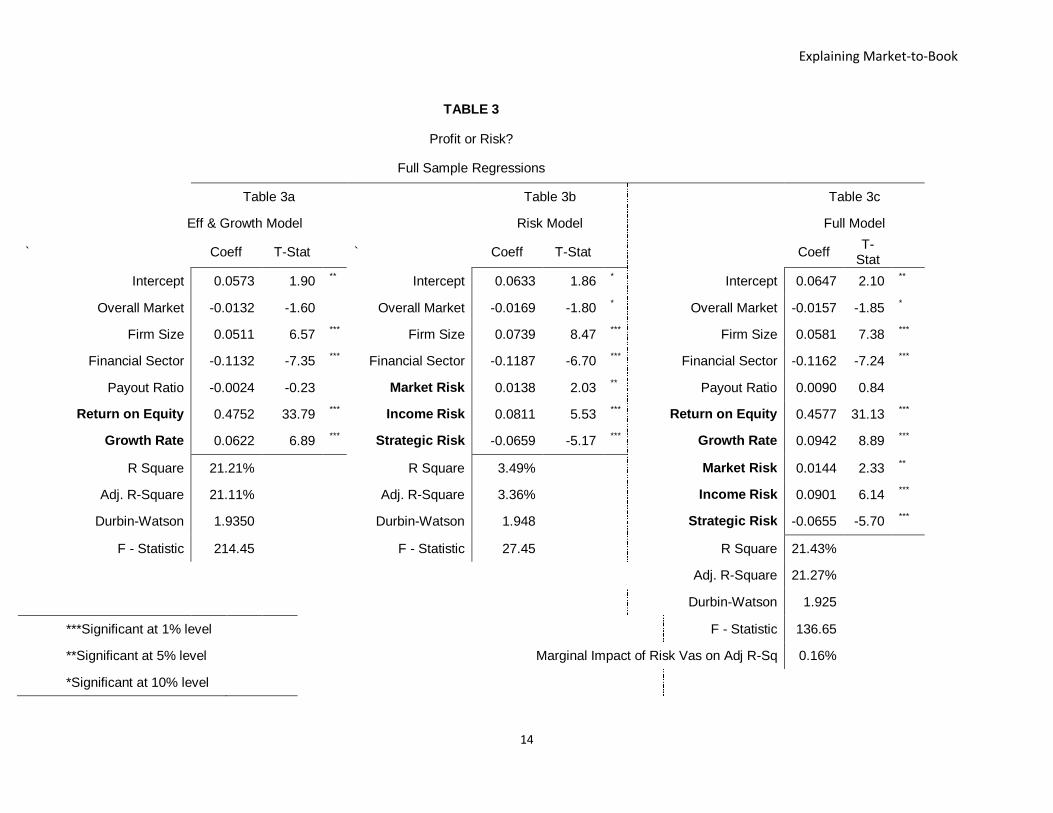
Table 3 contains the results of regression analysis for the full sample in three parts, with different combinations of variables. All regressions used Overall Market MB ratio, Firm Size, and a dummy variable for the financial sector as control variables. Table 3a contains a regression with only the firm performance variables as measured by return on equity and firm growth. As shown, the model has an adjusted R-Square of 21.11% and is highly significant with F-Statistic of over 214. Return on Equity and Firm Growth Rate were both highly and positively significant, as expected, as were the control variables of Firm Size and Financial Sector dummy.
Table 3b shows a regression with the control and risk variables only. As shown, the model has an adjusted R-Square of 3.36% and is statistically significant (F-Statistic of over 27). All three risk measures are significant at the 5% level or better. As expected in accordance with the discount model, Strategic Risk was negatively related to MB ratio; however, Market Risk and Business Risk were both positively associated with the dependent variable. The positive sign of Market Risk is surprising as it suggests that market valuation of net assets is higher for firms with higher variability in returns vis-à-vis benchmark returns. Business Risk, measured by the standard deviation of historical ROE, is also a surprise and suggests that the market valuation of equity is higher for firms with higher variation in their performance as measured by the accounting metric of ROE. Both of these results were obtained repeatedly in our different regression models and suggest that the market assigns a premium to the variance in relative returns and variance in accounting performance – perhaps because of the option value such variance may reflect. We discuss these surprising findings later in the paper.
Table 3c contains regression results for the full model that incorporates both performance and risk variables in the previous 2 tables. As shown, the model has an adjusted R-Square of 21.27% and is statistically significant (F-Statistic of nearly 138). Once again, both Return on Equity and Firm Growth Rate are highly significant, as are all three measures of risk. Market risk is positive and significant with a t-statistic of 2.33 and Business Risk is also positive and highly significant (t-statistic of 6.14); Strategic Risk, on the other hand, has a negative t-statistic of 5.70 and is therefore highly significant in the expected direction. Note also that the adjusted R-Square for the full model (Table 3c) is not much higher than the model that includes only the performance variables (Table 3a); the marginal increase in explanatory power is 0.16 percent. Clearly, the inclusion of risk variables improved the performance model only marginally.7
7 We also ran the full model with ROE decomposed into its 3 components as in the DuPont formulation. The adjusted
R-Square increased to 27 percent, and the results of the previous regressions were unchanged. The three components of ROE were all positive and highly significant and in the same direction as in the previous regressions; Return on Sales (t-statistic 12.95), Asset Efficiency (t-statistic 12.77), and Leverage (t-statistic 34.86). Moreover, firm growth rate was positive and significant (t-statistic 4.09); and the risk variables were all significant and in the same direction as in the previous regressions. Finally, the marginal impact of the three risk variables was 1.48 percent.
Explaining Market-to-Book
14
TABLE 3
Profit or Risk?
Full Sample Regressions
Table 3a Table 3b Table 3c
Eff & Growth Model Risk Model Full Model
` Coeff T-Stat
` Coeff T-Stat
Coeff T-
Stat
Intercept 0.0573 1.90 ** Intercept 0.0633 1.86
* Intercept 0.0647 2.10
**
Overall Market -0.0132 -1.60
Overall Market -0.0169 -1.80 * Overall Market -0.0157 -1.85
*
Firm Size 0.0511 6.57 ***
Firm Size 0.0739 8.47 ***
Firm Size 0.0581 7.38 ***
Financial Sector -0.1132 -7.35 ***
Financial Sector -0.1187 -6.70 ***
Financial Sector -0.1162 -7.24 ***
Payout Ratio -0.0024 -0.23
Market Risk 0.0138 2.03 ** Payout Ratio 0.0090 0.84
Return on Equity 0.4752 33.79 ***
Income Risk 0.0811 5.53 ***
Return on Equity 0.4577 31.13 ***
Growth Rate 0.0622 6.89 ***
Strategic Risk -0.0659 -5.17 ***
Growth Rate 0.0942 8.89 ***
R Square 21.21%
R Square 3.49%
Market Risk 0.0144 2.33 **
Adj. R-Square 21.11%
Adj. R-Square 3.36%
Income Risk 0.0901 6.14 ***
Durbin-Watson 1.9350
Durbin-Watson 1.948
Strategic Risk -0.0655 -5.70 ***
F - Statistic 214.45
F - Statistic 27.45
R Square 21.43%
Adj. R-Square 21.27%
Durbin-Watson 1.925
***Significant at 1% level
F - Statistic 136.65
**Significant at 5% level
Marginal Impact of Risk Vas on Adj R-Sq 0.16%
*Significant at 10% level
Explaining Market-to-Book
15
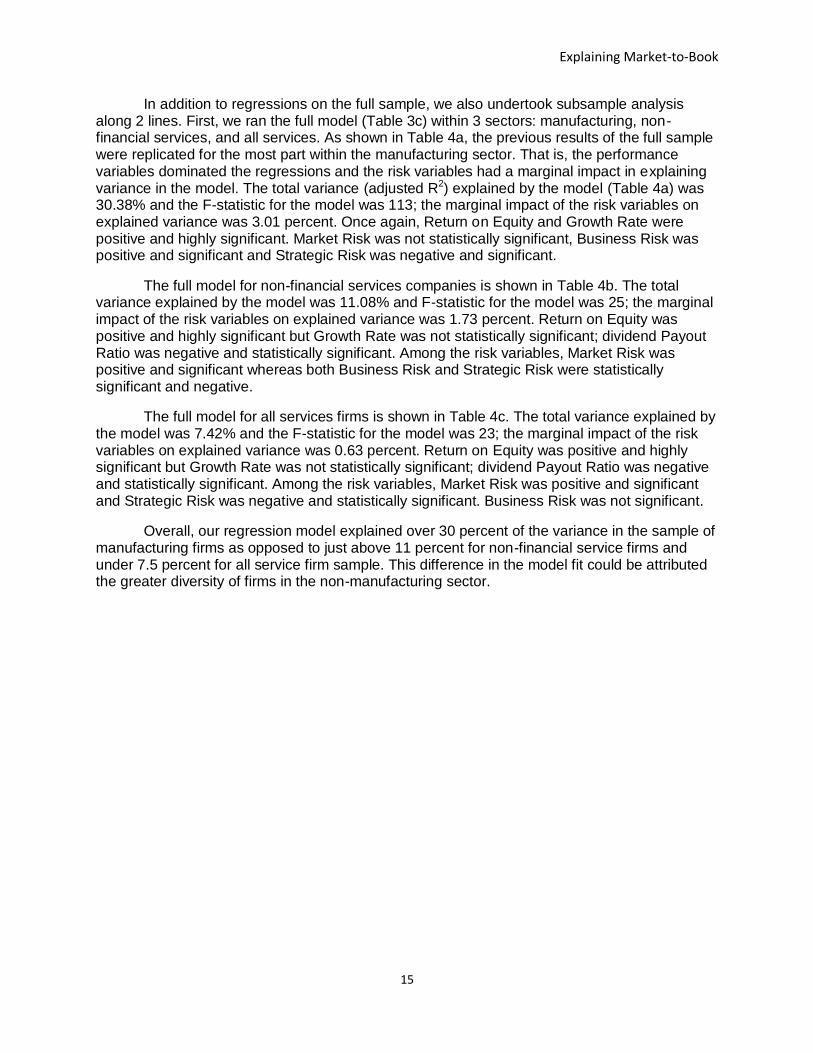
In addition to regressions on the full sample, we also undertook subsample analysis along 2 lines. First, we ran the full model (Table 3c) within 3 sectors: manufacturing, non-financial services, and all services. As shown in Table 4a, the previous results of the full sample were replicated for the most part within the manufacturing sector. That is, the performance variables dominated the regressions and the risk variables had a marginal impact in explaining variance in the model. The total variance (adjusted R2) explained by the model (Table 4a) was 30.38% and the F-statistic for the model was 113; the marginal impact of the risk variables on explained variance was 3.01 percent. Once again, Return on Equity and Growth Rate were positive and highly significant. Market Risk was not statistically significant, Business Risk was positive and significant and Strategic Risk was negative and significant.
The full model for non-financial services companies is shown in Table 4b. The total variance explained by the model was 11.08% and F-statistic for the model was 25; the marginal impact of the risk variables on explained variance was 1.73 percent. Return on Equity was positive and highly significant but Growth Rate was not statistically significant; dividend Payout Ratio was negative and statistically significant. Among the risk variables, Market Risk was positive and significant whereas both Business Risk and Strategic Risk were statistically significant and negative.
The full model for all services firms is shown in Table 4c. The total variance explained by the model was 7.42% and the F-statistic for the model was 23; the marginal impact of the risk variables on explained variance was 0.63 percent. Return on Equity was positive and highly significant but Growth Rate was not statistically significant; dividend Payout Ratio was negative and statistically significant. Among the risk variables, Market Risk was positive and significant and Strategic Risk was negative and statistically significant. Business Risk was not significant.
Overall, our regression model explained over 30 percent of the variance in the sample of manufacturing firms as opposed to just above 11 percent for non-financial service firms and under 7.5 percent for all service firm sample. This difference in the model fit could be attributed the greater diversity of firms in the non-manufacturing sector.

Explaining Market-to-Book
16
TABLE 4
Profit or Risk?
Regressions by Sector
Table 4a Table 4b Table 4c
Manufacturing Non-Fin Services All Services
Coeff T-Stat Coeff T-Stat Coeff T-Stat
Intercept 0.0621 1.18 0.07928 1.59
0.0133 0.36
Overall Market -0.0108 -0.75 -0.02855 -2.07
** -0.0180 -1.76
*
Firm Size 0.0839 6.42 ***
0.04478 3.44 ***
0.0289 3.04 ***
Payout Ratio 0.0246 1.40 -0.04611 -2.47
** -0.0268 -2.03
**
Return on Equity 0.5170 25.63 ***
0.31202 11.65 ***
0.2773 12.00 ***
Growth Rate 0.2082 11.59 ***
0.01665 1.03 0.0066 0.51
Market Risk 0.0058 0.54 0.03571 3.72
*** 0.0220 3.09
***
Income Risk 0.2039 9.14 ***
-0.06248 -2.79 ***
-0.0243 -1.29
Strategic Risk -0.0893 -2.60 ***
-0.0667 -3.31 ***
-0.0421 -2.49 **
R Square 30.65% 11.54%
7.75%
Adjusted R Square 30.38%
11.08%
7.42%
Durbin-Watson 1.939
1.792
1.833
F - Statistic 112.69
25.02
23.47
Marg Impact of Risk Vars on Adj RSq 3.01%
1.73%
0.63%
***Significant at 1% level
**Significant at 5% level
*Significant at 10% level
Explaining Market-to-Book
17
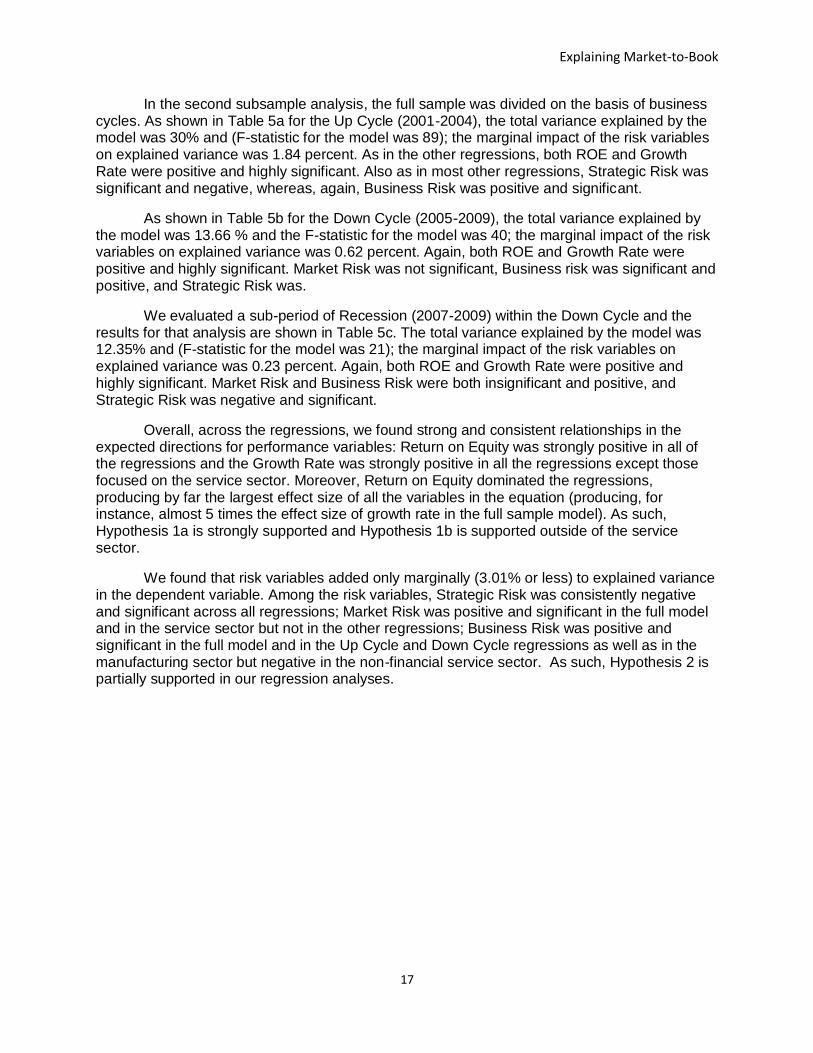
In the second subsample analysis, the full sample was divided on the basis of business cycles. As shown in Table 5a for the Up Cycle (2001-2004), the total variance explained by the model was 30% and (F-statistic for the model was 89); the marginal impact of the risk variables on explained variance was 1.84 percent. As in the other regressions, both ROE and Growth Rate were positive and highly significant. Also as in most other regressions, Strategic Risk was significant and negative, whereas, again, Business Risk was positive and significant.
As shown in Table 5b for the Down Cycle (2005-2009), the total variance explained by the model was 13.66 % and the F-statistic for the model was 40; the marginal impact of the risk variables on explained variance was 0.62 percent. Again, both ROE and Growth Rate were positive and highly significant. Market Risk was not significant, Business risk was significant and positive, and Strategic Risk was.
We evaluated a sub-period of Recession (2007-2009) within the Down Cycle and the results for that analysis are shown in Table 5c. The total variance explained by the model was 12.35% and (F-statistic for the model was 21); the marginal impact of the risk variables on explained variance was 0.23 percent. Again, both ROE and Growth Rate were positive and highly significant. Market Risk and Business Risk were both insignificant and positive, and Strategic Risk was negative and significant.
Overall, across the regressions, we found strong and consistent relationships in the expected directions for performance variables: Return on Equity was strongly positive in all of the regressions and the Growth Rate was strongly positive in all the regressions except those focused on the service sector. Moreover, Return on Equity dominated the regressions, producing by far the largest effect size of all the variables in the equation (producing, for instance, almost 5 times the effect size of growth rate in the full sample model). As such, Hypothesis 1a is strongly supported and Hypothesis 1b is supported outside of the service sector.
We found that risk variables added only marginally (3.01% or less) to explained variance in the dependent variable. Among the risk variables, Strategic Risk was consistently negative and significant across all regressions; Market Risk was positive and significant in the full model and in the service sector but not in the other regressions; Business Risk was positive and significant in the full model and in the Up Cycle and Down Cycle regressions as well as in the manufacturing sector but negative in the non-financial service sector. As such, Hypothesis 2 is partially supported in our regression analyses.

Explaining Market-to-Book
18
TABLE 5
Profit or Risk?
Regressions by Stage of Business Cycle
Table 5a Table 5b Table 5c
UpCycle: 2001-2004 DownCycle: 2005-2009 Recession: 2007-2009
Coeff T-Stat
Coeff T-Stat Coeff T-Stat
Intercept 0.2514 4.29 ***
0.0205 0.40
0.0204 0.37
Overall Market -0.0620 -3.86 ***
-0.0087 -0.57
-0.0119 -0.67
Firm Size 0.0540 5.02 ***
0.0349 2.87 ***
0.0434 2.70 ***
Financial Sector -0.1175 -5.63 ***
-0.1204 -4.62 ***
-0.0907 -2.38 **
Payout Ratio 0.0038 0.27
0.0337 1.86 * 0.0416 1.35
Return on Equity 0.4590 26.09 ***
0.4257 15.68 ***
0.4208 11.82 ***
Growth Rate 0.1022 7.04 ***
0.1052 6.44 ***
0.0908 4.20 ***
Market Risk 0.0137 1.64
0.0131 1.35
0.0064 0.52
Income Risk 0.0839 4.76 ***
0.0638 2.31 ** 0.0320 0.87
Strategic Risk -0.0815 -5.13 ***
-0.0582 -3.37 ***
-0.0500 -2.29 **
R Square 30.33%
14.01%
12.96%
Adjusted R Square 29.99%
13.66%
12.35%
Durbin-Watson 1.923
1.930
1.88
F - Statistic 89.15
40.01
21.26
Marg Impact of Risk Vars on Adj RSq 1.84%
0.62%
0.23%
***Significant at 1% level
**Significant at 5% level
*Significant at 10% level

Explaining Market-to-Book
19
Finally, in order to test Hypothesis 3, we compared the standardized coefficients of key variables in the equation. As shown in Table 6, we found that the coefficient for Return on Equity was statistically larger (at levels p<0.001 or higher) than those of each of the 3 risk variables. Hence, our analysis strongly supports Hypothesis H3a. The coefficient for Growth rate was statistically larger than the risk variables in 11 of 21 instances as shown in Table 6. Hence, our analysis partially supports Hypothesis h3b.

Explaining Market-to-Book
20
Table 6
Profit or Risk?
Comparison of Coefficients by Table*
Table 3c Table 4a Table 4b Table 4c Table 5a Table 5b Table 5c
H3a: |β 1| > |β 3|
Return on Eauity vs. Market Risk 769.78 ***
504.99
***
92.09 ***
109.11
***
516.73 ***
203.49
***
121.10 ***
Return on Eauity vs. Business Risk 289.03 ***
99.68
***
56.92 ***
78.53
***
235.42 ***
70.04
***
51.05 ***
Return on Equity vs.Strategic Risk 435.22 ***
112.77
***
52.05 ***
65.35
***
250.17 ***
129.56
***
76.99 ***
H 3a: |β 2| > |β 3|
Firm Growth Rate vs. Market Risk 42.19 ***
91.38
***
1.04
1.08
27.54 ***
23.88
***
11.89 ***
Firm Growth Rate vs. Business Risk 0.08
0.04
2.05
0.45
1.06
2.50
2.89 *
Firm Growth Rate vs.Strategic Risk 3.60 *
9.69 ***
3.82
*
2.82 *
0.99
4.12 **
1.87
* The table reports the results of comparing the absolute values of the coefficients. Cells contain F-Values
***Significant at 1% level
**Significant at 5% level
*Significant at 10% level

Explaining Market-to-Book
21
Table 7
Profit or Risk?
Summary of Results
Exp.
Sign Table 3a Table 3b Table 3c Table 4a Table 4b Table 4c Table 5a Table 5b Table 5c Results
H1a: β 1 > 0
Return on Equity (ROE) (+) (+) *** na (+) *** (+) *** (+) *** (+) *** (+) *** (+) *** (+) *** Full Support
H1b: β 2 > 0
Growth Rate (+) (+) *** na (+) *** (+) *** x x (+) *** (+) *** (+) *** Full Support
H2: β 3 <0
Market Risk (-) na (+) ** (+) ** x (+) *** (+) *** x x x Reject
Business Risk (-) na (+) *** (+) *** (+) *** (-) *** x (+) *** (+) ** x Reject
Strategic risk (-) na (-) *** (-) *** (-) *** (-) *** (-) ** (-) *** (-) *** (-) ** Full Support
H3a: |β 1| > |β 3|
ROE vs Market Risk (+) na na (+) *** (+) *** (+) *** (+) *** (+) *** (+) *** (+) *** Full Support
ROE vs Business Risk (+) na na (+) *** (+) *** (+) *** (+) *** (+) *** (+) *** (+) *** Full Support
ROE vs Strategic Risk (+) na na (+) *** (+) *** (+) *** (+) *** (+) *** (+) *** (+) *** Full Support
H 3a: |β 2| > |β 3|
Growth Rate vs Market Risk (+) na na (+) *** (+) *** x x (+) *** (+) *** (+) *** Part Support
Growth Rate vs Business Risk (+) na na x x x x x x (+) * Part Support
Growth Rate vs Strategic Risk (+) na na (+) * (+) *** (+) * (+) * x (+) ** x Part Support
***Significant at 1% level
**Significant at 5% level
*Significant at 10% level

Explaining Market-to-Book
22
Discussion & Conclusion
The Market-to-Book ratio, an imperfect proxy for Tobin’s q, has been used as a key variable in various studies for well over two decades. The ratio has, however, been subject to two distinct interpretations, with one emphasizing its use as a measure of efficiency and growth and the other its use as a proxy for a type of risk. We have explored these interpretations in light of the steady state constant growth discount model. We submit that the MB ratio is a theoretically sound construct that derives from the discount model which is theoretically associated with efficiency, growth and risk. We find that the relationship between market value and book equity reflects managerial value-add as indicated by the return on equity and growth rate: the more effective the use of book equity and the faster the growth rate of the firm, the higher was the MB ratio in our sample. Similarly, we found that the MB ratio is negatively associated with strategic risk: the higher this risk, the lower was the MB ratio for the firm.
To our surprise, however, both Market Risk, measured as β, and Business Risk, measured as standard deviation of ROE, tended to be positively associated with the MB ratio. This positive association was strong and consistent across several different regression models, including the full model using the full sample (Table 3c). Contrary to our expectation that the MB ratio would be negatively associated with risk (here measured as β and variability of return on equity), this result suggests that the market rewarded companies with high variance in market and accounting returns: the higher the variability, the higher the MB ratio.
To explore this result further, we regressed ROE against Business Risk, and found strong positive association between the two in all cases. That is, firms with higher variability in their accounting performance were also more profitable. The variance explained in these regressions was very small, however, ranging from just 1.10% when controlling for non-financial services to 1.21% when controlling for the manufacturing sector. Even so, the positive association between variability of returns is the same directionally as the positive association between variability and market valuation.
One potential explanation for this result is that, if cast as an option, equity valuations may be bid up by risk-seeking equity investors. That is, higher variability may be attractive to equity investors because of the potential for higher returns and, therefore, may lead to higher market valuations.
The above explanation is not consistent with Bowman’s paradox, which suggests a negative relationship between standard deviation and mean values of ROE. The difference in results may be because Bowman operationalized performance as the mean of historical ROE figures and computed the variance around that mean, whereas we measure ROE in the year of analysis and the variance is based on historical ROE over 7 years. Note that Bowman’s paradox remains controversial, as some have found support for it (Wiseman & Bromiley, 1991; Andersen, Denrell & Bettis, 2007), while others have objected to it on methodological grounds (Marsh & Swanson, 1984; Ruefli, 1990; Henkel, 2009). Given that the issue is not the focus of our research, we leave it to be fleshed out systematically by other researchers. Our analysis suggests that consistent with the discount model our measure of strategic risk is appropriately negatively associated with the MB ratio. The positive signs on Market and Business Risk is intriguing and needs to be investigated further.
Overall, our results also indicate that efficiency and growth account for the bulk of the explained variance in the MB ratio. The variance explained by our measures of risk is only marginal. This is an intriguing result indicating that the MB ratio mostly reflects the success of
Explaining Market-to-Book
23
managers in delivering strong operating performance and growth in the net assets of the firm. In this sense, strategy scholars are perhaps justified in using the MB ratio as a measure of firm performance.
The result that the risk variables, while significant for the most part (15 of 21 instances), only marginally explain variance in the MB ratio is surprising as are the signs for Market Risk and Business Risk as defined.
Our empirical analysis explains about 20% of the variance in the MB ratio, with the remainder unaccounted for. Clearly, important variables may not be included in our simple model. Moreover, the market based MB ratio is forward looking whereas our variables are all historical given our intent to tease out the relative effects of efficiency and growth on one hand and of risk on the other. Perhaps future research would improve upon our results by incorporating future oriented measures.
The measures we have used may not fully capture the risk relationships. Future research should extend the analysis to samples that include smaller firms and perhaps to samples of firms in other geographic regions. Additional variables implied by the discount model and alternate ways of operationalizing efficiency, growth and risk may also improve research in this area.
Such extension possibilities notwithstanding, our research addresses an important issue that has been in two distinct literatures for well over two decades. Using the parsimonious steady state constant growth discount model from corporate finance, we have explored two distinct conceptions of the relationship between market price and book equity. In addition, we have provided empirical evidence with respect to the relative significance for the MB ratio of efficiency and growth measures on the one hand and risk on the other. We hope future efforts in this area will shed further light on the relative importance of these relationships.

Explaining Market-to-Book
24
REFERENCES
Adam, T., and V. K. Goyal. "The Investment Opportunity Set and Its Proxy Variables." Journal of
Financial Research 31.1 (2008): 41. Print.
Amit, R., and J. Livnat. "Diversification and the Risk-Return Trade-Off." Academy of
Management Journal 31.1 (1988): 154-66. Print.
Amit, R., and B. Wernerfelt. "Why Do Firms Reduce Business Risk?" Academy of Management
Journal.Journal Article (1990): 520-33. Print.
Anand, J., and H. Singh. "Asset Redeployment, Acquisitions and Corporate Strategy in
Declining Industries." Strategic Management Journal 18.Journal Article (1997): 99-118.
Print.
Andersen, T. J., J. Denrell, and R. A. Bettis. "Strategic Responsiveness and Bowman's Risk-
Return Paradox." Strategic Management Journal 28.4 (2007): 407-29. Print.
Armour, H. O., and D. J. Teece. "Organizational Structure and Economic Performance: A Test
of the Multidivisional Hypothesis." The Bell Journal of Economics 9.1 (1978): 106-22.
Print.
Banz, R. W. "The Relationship between Return and Market Value of Common Stocks." Journal
of Financial Economics 9.1 (1981): 3-18. Print.
Barber, B. M., and J. D. Lyon. "Firm Size, Book-to-Market Ratio, and Security Returns: A
Holdout Sample of Financial Firms." Journal of Finance 52.2 (1997): 875-83. Print.
Barton, S. L. "Diversification Strategy and Systematic Risk: Another Look." Academy of
Management Journal 31.1 (1988): 166-75. Print.
Basu, S. "The Relationship between Earnings' Yield, Market Value and Return for Nyse
Common Stocks: Further Evidence." Journal of Financial Economics 12.1 (1983): 129-
56. Print.
Becker, B., and B. Gerhart. "The Impact of Human Resource Management on Organizational
Performance: Progress and Prospects." Academy of Management Journal 39.4 (1996):
779-801. Print.
Bettis, R. A. "Performance Differences in Related and Unrelated Diversified Firms." Strategic
Management Journal 2.4 (1981): 379-93. Print.
Bhandari, L. C. "Debt/Equity Ratio and Expected Common Stock Returns: Empirical Evidence."
Journal of Finance.Journal Article (1988): 507-28. Print.
Bharadwaj, A. S., S. G. Bharadwaj, and B. R. Konsynski. "Information Technology Effects on
Firm Performance as Measured by Tobin's Q." Management Science (1999): 1008-24.
Print.
Explaining Market-to-Book
25
Black, F. "Return and Beta." Journal of Portfolio Management 20.Journal Article (1993): 8-8.
Print.
Bloom, M., and G. T. Milkovich. "Relationships among Risk, Incentive Pay, and Organizational
Performance." Academy of Management Journal 41.3 (1998): 283-97. Print.
Bowman, E. "A Risk/Return Paradox for Strategic Management." Sloan management review
(1980): 17-3. Print.
Branch, B., and B. Gale. "Linking Corporate Stock Price Performance to Strategy Formulation."
Journal of Business Strategy 4.1 (1983): 40-50. Print.
Branch, B., et al. "Explaining Price to Book." Business Quest (2005).
<westga.edu/~bquest/2005/Model.pdf >.
Breeden, D. T. "An Intertemporal Asset Pricing Model with Stochastic Consumption and
Investment Opportunities." Journal of Financial Economics 7.3 (1979): 265-96. Print.
Breeden, D. T., M. R. Gibbons, and R. H. Litzenberger. "Empirical Test of the Consumption-
Oriented Capm." Journal of Finance (1989): 231-62. Print.
Capaul, C., I. Rowley, and W. F. Sharpe. "International Value and Growth Stock Returns."
Financial Analysts Journal 49.1 (1993): 27-36. Print.
Ceccagnoli, M. "Appropriability, Preemption, and Firm Performance." Strategic Management
Journal 30.1 (2009): 81-98. Print.
Chakravarthy, B. S. "Measuring Strategic Performance." Strategic Management Journal 7.5
(1986): 437-58. Print.
Chan, L. K. C., Y. Hamao, and J. Lakonishok. "Fundamentals and Stock Returns in Japan."
Journal of Finance.Journal Article (1991): 1739-64. Print.
Chang, S. J. "Ownership Structure, Expropriation, and Performance of Group-Affiliated
Companies in Korea." The Academy of Management Journal 46.2 (2003): 238-53. Print.
Cheng, D. C., B. E. Gup, and L. D. Wall. "Financial Determinants of Bank Takeovers." Journal
of Money, Credit & Banking 21.4 (1989). Print.
Cho, H. J., and V. Pucik. "Relationship between Innovativeness, Quality, Growth, Profitability,
and Market Value." Strategic Management Journal 26.6 (2005): 555-75. Print.
Combs, J. G., and D. J. Ketchen Jr. "Explaining Interfirm Cooperation and Performance: Toward
a Reconciliation of Predictions from the Resource-Based View and Organizational
Economics." Strategic Management Journal 20.9 (1999): 867-88. Print.
Cootner, P. J., and D. Holland. "Risk and Rate of Return." Massachusetts Institute of
Technology, DSR Project 9565 (1963). Print.

Explaining Market-to-Book
26
Daniel, K., and S. Titman. "Evidence on the Characteristics of Cross Sectional Variation in Stock
Returns." Journal of Finance 52.1 (1997): 1-33. Print.
David, P., J. P. O'Brien, and T. Yoshikawa. "The Implications of Debt Heterogeneity for R&D
Investment and Firm Performance." The Academy of Management Journal 51.1 (2008):
165-81. Print.
Davis, G. F., and S. K. Stout. "Organization Theory and the Market for Corporate Control: A
Dynamic Analysis of the Characteristics of Large Takeover Targets, 1980-1990."
Administrative Science Quarterly 37.4 (1992): 605-33. Print.
Davis, J. L. "The Cross-Section of Realized Stock Returns: The Pre-Compustat Evidence."
Journal of Finance 49.5 (1994): 1579-93. Print.
Davis, J. L., E. F. Fama, and K. R. French. "Characteristics, Covariances, and Average Returns:
1929 to 1997." The Journal of Finance 55.1 (2000): 389-406. Print.
De Bondt, W. F. M., and R. H. Thaler. "Further Evidence on Investor Overreaction and Stock
Market Seasonality." Journal of Finance 42.3 (1987): 557-81. Print.
Dushnitsky, G., and M. J. Lenox. "When Does Corporate Venture Capital Investment Create
Firm Value?" Journal of Business Venturing 21.6 (2006): 753-72. Print.
Dutta, S., O. Narasimhan, and S. Rajiv. "Conceptualizing and Measuring Capabilities:
Methodology and Empirical Application." Strategic Management Journal 26.3 (2005):
277-85. Print.
---. "Success in High-Technology Markets: Is Marketing Capability Critical?" Marketing Science
18.4 (1999): 547-68. Print.
Fama, E. F., and K. R. French. "Common Risk Factors in the Returns on Stocks and Bonds."
Journal of Financial Economics 33.1 (1993): 3-56. Print.
---. "The Cross-Section of Expected Stock Returns." Journal of Finance.Journal Article (1992):
427-65. Print.
---. "Size and Book-to-Market Factors in Earnings and Returns." Journal of Finance 50.1 (1995):
131-55. Print.
---. "Value Versus Growth: The International Evidence." The Journal of Finance 53.6 (1998):
1975-99. Print.
Fiegenbaum, A., and H. Thomas. "Attitudes toward Risk and the Risk-Return Paradox: Prospect
Theory Explanations." Academy of Management Journal (1988): 85-106. Print.
Fisher, F. M., and J. J. McGowan. "On the Misuse of Accounting Rates of Return to Infer
Monopoly Profits." The American Economic Review 73.1 (1983): 82-97. Print.

Explaining Market-to-Book
27
Fisher, I. N., and G. R. Hall. "Risk and Corporate Rates of Return." The Quarterly Journal of
Economics (1969): 79-92. Print.
Fombrun, C., and M. Shanley. "What's in a Name? Reputation Building and Corporate
Strategy." Academy of Management Journal 33.2 (1990): 233-58. Print.
Fruhan, W. E. "Financial Strategy." Irwin (Homewood, IL) (1979). Print.
Gibbs, P. A. "Determinants of Corporate Restructuring: The Relative Importance of Corporate
Governance, Takeover Threat, and Free Cash Flow." Strategic Management Journal
14.S1 (1993): 51-68. Print.
Goranova, M., R. Dharwadkar, and P. Brandes. "Owners on Both Sides of the Deal: Mergers
and Acquisitions and Overlapping Institutional Ownership." Strategic Management
Journal 31.10 (2010): 1114-35. Print.
Griffin, J. M., and M. L. Lemmon. "Book-to-Market Equity, Distress Risk, and Stock Returns."
The Journal of Finance 57.5 (2002): 2317-36. Print.
Gutierreez Jr., R. C. "Book-to-Market Equity, Size, and the Segmentation of the Stock and
Bond Markets." working paper, Texas A&M University, 2001. Print.
Haugen, R. A. The New Finance: The Case against Efficient Markets. Prentice Hall, 1995. Print.
Henkel, J. "The Risk-Return Paradox for Strategic Management: Disentangling True and
Spurious Effects." Strategic Management Journal 30.3 (2009): 287-303. Print.
Huselid, M. A. "The Impact of Human Resource Management Practices on Turnover,
Productivity, and Corporate Financial Performance." Academy of Management
Journal.Journal Article (1995): 635-72. Print.
Huselid, M. A., S. E. Jackson, and R. S. Schuler. "Technical and Strategic Human Resource
Management Effectiveness as Determinants of Firm Performance." Academy of
Management Journal 40.1 (1997): 171-88. Print.
Iyer, D. N., and K. D. Miller. "Performance Feedback, Slack, and the Timing of Acquisitions."
The Academy of Management Journal 51.4 (2008): 808-22. Print.
Jensen, G. R., R. R. Johnson, and J. M. Mercer. "New Evidence on Size and Price-to-Book
Effects in Stock Returns." Financial Analysts Journal 53.6 (1997): 34-42. Print.
Kor, Y. Y., and J. T. Mahoney. "How Dynamics, Management, and Governance of Resource
Deployments Influence Firm-Level Performance." Strategic Management Journal 26.5
(2005): 489-96. Print.
Kumar, M. V. "Are Joint Ventures Positive Sum Games? The Relative Effects of Cooperative
and Noncooperative Behavior." Strategic Management Journal (2010). Print.

Explaining Market-to-Book
28
Lakonishok, J., A. Shleifer, and R. W. Vishny. "Contrarian Investment, Extrapolation, and Risk."
Journal of Finance 49.5 (1994): 1541-78. Print.
Lee, S. H., and M. Makhija. "Flexibility in Internationalization: Is It Valuable During an Economic
Crisis?" Strategic Management Journal 30.5 (2009): 537-55. Print.
Lenox, M. J., S. F. Rockart, and A. Y. Lewin. "Does Interdependency Affect Firm and Industry
Profitability? An Empirical Test." Strategic Management Journal 31.2 (2010): 121-39.
Print.
Liew, J., and M. Vassalou. "Can Book-to-Market, Size and Momentum Be Risk Factors That
Predict Economic Growth?" Journal of Financial Economics 57.2 (2000): 221-45. Print.
Lindenberg, E. B., and S. A. Ross. "Tobin's Q Ratio and Industrial Organization." Journal of
Business 54.1 (1981): 1-32. Print.
Lintner, J. "The Valuation of Risk Assets and the Selection of Risky Investments in Stock
Portfolios and Capital Budgets." The review of economics and statistics 47.1 (1965): 13-
37. Print.
Lu, J. W., and P. W. Beamish. "International Diversification and Firm Performance: The S-Curve
Hypothesis." The Academy of Management Journal 47.4 (2004): 598-609. Print.
MacKinlay, A. C. "Multifactor Models Do Not Explain Deviations from the Capm." Journal of
Financial Economics 38.1 (1995): 3-28. Print.
Malkiel, B. G. "The Efficient Market Hypothesis and Its Critics." The Journal of Economic
Perspectives 17.1 (2003): 59-82. Print.
Marsh, T. A., and D. S. Swanson. "Risk-Return Tradeoffs for Strategic Management." Sloan
management review 25.3 (1984): 35-49. Print.
McDonald, M. L., P. Khanna, and J. D. Westphal. "Getting Them to Think Outside the Circle:
Corporate Governance, Ceos'external Advice Networks, and Firm Performance." The
Academy of Management Journal (AMJ) 51.3 (2008): 453-75. Print.
Merton, R. C. "An Intertemporal Capital Asset Pricing Model." Econometrica: Journal of the
Econometric Society 41.5 (1973): 867-87. Print.
Miller, K. D., and P. Bromiley. "Strategic Risk and Corporate Performance: An Analysis of
Alternative Risk Measures." Academy of Management Journal 33.4 (1990): 756-79.
Print.
Montgomery, C. A., and B. Wernerfelt. "Diversification, Ricardian Rents, and Tobin's Q." The
Rand journal of economics 19.4 (1988): 623-32. Print.
Morck, R., A. Shleifer, and R. W. Vishny. "Alternative Mechanisms for Corporate Control." The
American Economic Review.Journal Article (1989): 842-52. Print.

Explaining Market-to-Book
29
Murray, A. I. "Top Management Group Heterogeneity and Firm Performance." Strategic
Management Journal 10.S1 (1989): 125-41. Print.
Nayyar, P. R. "Performance Effects of Information Asymmetry and Economies of Scope in
Diversified Service Firms." Academy of Management Journal 36.1 (1993): 28-57. Print.
---. "Performance Effects of Three Foci in Service Firms." Academy of Management Journal
35.5 (1992): 985-1009. Print.
O'Brien, J. P. "The Capital Structure Implications of Pursuing a Strategy of Innovation." Strategic
Management Journal 24.5 (2003): 415-31. Print.
Ohlson, J. A. "Financial Ratios and the Probabilistic Prediction of Bankruptcy." Journal of
Accounting Research.Journal Article (1980): 109-31. Print.
Penrose, E. T. The Theory of the Growth of the Firm. Oxford University Press, USA, 1995. Print.
Pitcher, P., and A. D. Smith. "Top Management Team Heterogeneity: Personality, Power, and
Proxies." Organization Science 12.1 (2001): 1-18. Print.
Reinganum, M. R. "A New Empirical Perspective on the Capm." Journal of Financial and
Quantitative Analysis 16.04 (1981): 439-62. Print.
Rogowski, R. J., and D. G. Simonson. "Bank Merger Pricing Premiums and Interstate Bidding."
Bank mergers: current issues and perspectives.Journal Article (1989): 87. Print.
Rosenberg, B., K. Reid, and R. Lanstein. "Persuasive Evidence of Market Inefficiency, Journal
of Portfolio Management."Journal Article (1985). Print.
Ross, S. A. "The Arbitrage Theory of Capital Asset Pricing." Journal of Economic Theory 13.3
(1976): 341-60. Print.
Ruefli, T. W. "Mean-Variance Approaches to Risk-Return Relationships in Strategy: Paradox
Lost." Management Science (1990): 368-80. Print.
Ruefli, T. W., J. M. Collins, and J. R. Lacugna. "Risk Measures in Strategic Management
Research: Auld Lang Syne?" Strategic Management Journal 20.2 (1999): 167-94. Print.
Schendel, D., and C. W. Hofer. Strategic Management: A New View of Business Policy and
Planning. Little, Brown, 1979. Print.
Sharpe, W. F. "Capital Asset Prices: A Theory of Market Equilibrium under Conditions of Risk."
Journal of Finance 19.3 (1964): 425-42. Print.
Short, J. C., et al. "Firm, Strategic Group, and Industry Influences on Performance." Strategic
Management Journal 28.2 (2007): 147-67. Print.
Smirlock, M., T. Gilligan, and W. Marshall. "Tobin's Q and the Structure-Performance
Relationship." The American Economic Review.Journal Article (1984): 1051-60. Print.
Explaining Market-to-Book
30
Surroca, J., J. A. Tribo, and S. Waddock. "Corporate Responsibility and Financial Performance:
The Role of Intangible Resources." Strategic Management Journal 31.5 (2010): 463-90.
Print.
Tanriverdi, H., and N. Venkatraman. "Knowledge Relatedness and the Performance of
Multibusiness Firms." Strategic Management Journal 26.2 (2005): 97-119. Print.
Tobin, J. "A General Equilibrium Approach to Monetary Theory." Journal of Money, Credit and
Banking 1.1 (1969): 15-29. Print.
Tong, T. W., and J. J. Reuer. "Firm and Industry Influences on the Value of Growth Options."
Strategic Organization 4.1 (2006): 71-71. Print.
Varaiya, N., R. A. Kerin, and D. Weeks. "The Relationship between Growth, Profitability, and
Firm Value." Strategic Management Journal 8.5 (1987): 487-97. Print.
Vassalou, M., and Y. Xing. "Default Risk in Equity Returns." The Journal of Finance 59.2 (2004):
831-68. Print.
Wang, H. C., J. He, and J. T. Mahoney. "Firm-Specific Knowledge Resources and Competitive
Advantage: The Roles of Economic-and Relationship-Based Employee Governance
Mechanisms." Strategic Management Journal 30.12 (2009): 1265-85. Print.
Wang, H., J. Choi, and J. Li. "Too Little or Too Much? Untangling the Relationship between
Corporate Philanthropy and Firm Financial Performance." Organization Science 19.1
(2008): 143-59. Print.
Welbourne, T. M., and A. O. Andrews. "Predicting the Performance of Initial Public Offerings:
Should Human Resource Management Be in the Equation?" Academy of Management
Journal 39.4 (1996): 891-919. Print.
Wernerfelt, B., and C. A. Montgomery. "Tobin's Q and the Importance of Focus in Firm
Performance." The American Economic Review 78.1 (1988): 246-50. Print.
Westphal, J. D. "Collaboration in the Boardroom: Behavioral and Performance Consequences of
Ceo-Board Social Ties." Academy of Management Journal 42.1 (1999): 7-24. Print.
Wiggins, R. R., and T. W. Ruefli. "Sustained Competitive Advantage: Temporal Dynamics and
the Incidence and Persistence of Superior Economic Performance." Organization
Science 13.1 (2002): 82-105. Print.
Wiseman, R. M., and P. Bromiley. "Risk Return Associations: Paradox or Artifact? An
Empirically Tested Explanation." Strategic Management Journal 12.3 (1991): 231-41.
Print.
Explaining Market-to-Book
31
APPENDIX 1
Measures of Risk ______________________________
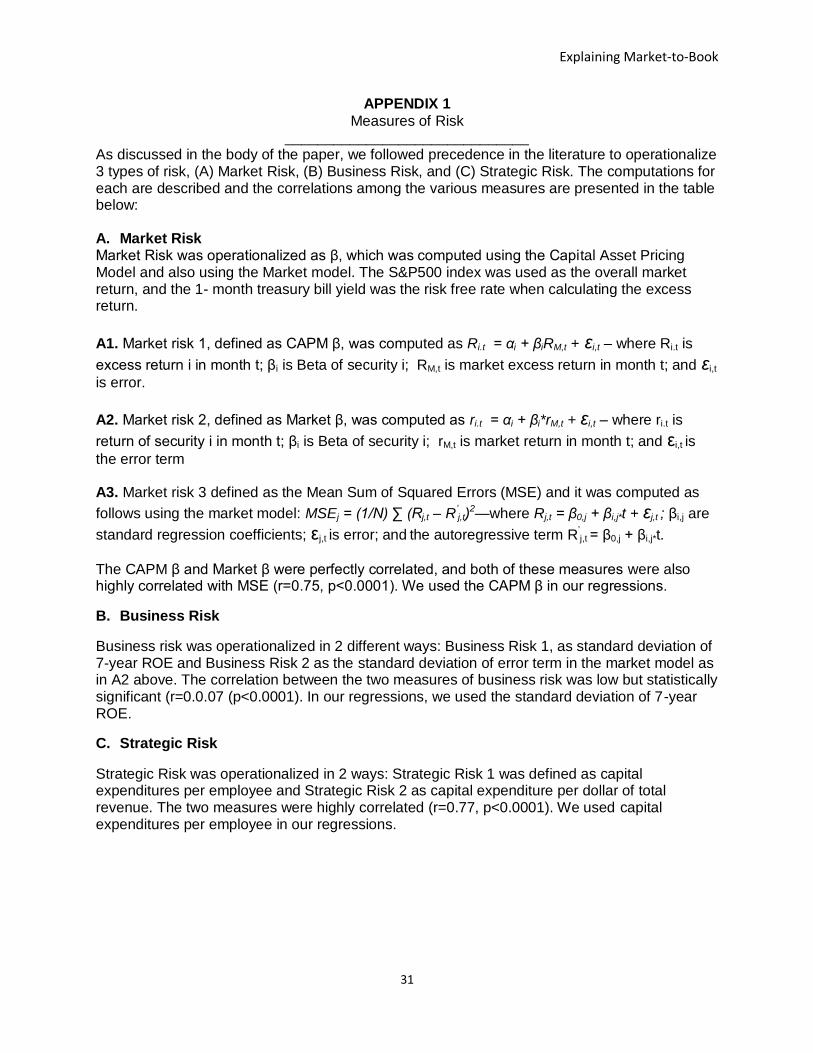
As discussed in the body of the paper, we followed precedence in the literature to operationalize 3 types of risk, (A) Market Risk, (B) Business Risk, and (C) Strategic Risk. The computations for each are described and the correlations among the various measures are presented in the table below: A. Market Risk Market Risk was operationalized as β, which was computed using the Capital Asset Pricing Model and also using the Market model. The S&P500 index was used as the overall market return, and the 1- month treasury bill yield was the risk free rate when calculating the excess return.
A1. Market risk 1, defined as CAPM β, was computed as Ri.t = αi + βiRM,t + εi,t – where Ri.t is
excess return i in month t; βi is Beta of security i; RM,t is market excess return in month t; and εi,t
is error.
A2. Market risk 2, defined as Market β, was computed as ri.t = αi + βi*rM,t + εi,t – where ri.t is
return of security i in month t; βi is Beta of security i; rM,t is market return in month t; and εi,t is
the error term A3. Market risk 3 defined as the Mean Sum of Squared Errors (MSE) and it was computed as
follows using the market model: MSEj = (1/N) ∑ (Rj,t – R’j,t)
2—where Rj,t = β0,j + βi,j*t + εj,t ; βi,j are
standard regression coefficients; εj,t is error; and the autoregressive term R’j,t = β0,j + βi,j*t.
The CAPM β and Market β were perfectly correlated, and both of these measures were also highly correlated with MSE (r=0.75, p<0.0001). We used the CAPM β in our regressions.
B. Business Risk
Business risk was operationalized in 2 different ways: Business Risk 1, as standard deviation of 7-year ROE and Business Risk 2 as the standard deviation of error term in the market model as in A2 above. The correlation between the two measures of business risk was low but statistically significant (r=0.0.07 (p<0.0001). In our regressions, we used the standard deviation of 7-year ROE.
C. Strategic Risk
Strategic Risk was operationalized in 2 ways: Strategic Risk 1 was defined as capital expenditures per employee and Strategic Risk 2 as capital expenditure per dollar of total revenue. The two measures were highly correlated (r=0.77, p<0.0001). We used capital expenditures per employee in our regressions.

Explaining Market-to-Book
32
Appendix 1
TABLE
Profit or Risk?
Correlations Among Risk factors
1 2
3
4
5
6
7
1 Market Risk 1
1 0.9999
*** 0.7523
*** 0.6118
*** 0.0366
** -0.0139
0.0049
2 Market Risk 2 1 0.7512 ***
0.6104 ***
0.0365 ** -0.0140 0.0046
3 Market Risk 3 1 0.9420 ***
0.0659 ***
-0.0286 * -0.0104
4 Business Risk 1 1 0.0668 ***
-0.0159 0.0193
5 Business Risk 2 1 -0.0322 ** -0.0176
6 Strategic Risk 1 1 0.7699 ***
7 Strategic Risk 2
1
***:Significant at 1%
**:Significant at 5%
*: Significant at 10%