
Explaining Clinical Effects of Deep Brain Stimulation ...
9
ORIGINAL RESEARCH Explaining Clinical Effects of Deep Brain Stimulation through Simplified Target-Specific Modeling of the Volume of Activated Tissue B. Ma ¨ dler V.A. Coenen BACKGROUND AND PURPOSE: Although progress has been made in understanding the optimal ana- tomic structures as target areas for DBS, little effort has been put into modeling and predicting electromagnetic field properties of activated DBS electrodes and understanding their interactions with the adjacent tissue. Currently, DBS is performed with the patient awake to assess the effectiveness and the side effect spectrum of stimulation. This study was designed to create a robust and rather simple numeric and visual tool that provides sufficient and practical relevant information to visualize the patient’s individual VAT. MATERIALS AND METHODS: Multivariate polynomial fitting of previously obtained data from a finite- element model, based on a similar DBS system, was used. The model estimates VAT as a first- approximation sphere around the active DBS contact, using stimulation voltages and individual tissue- electrode impedances. Validation uses data from 2 patients with PD by MR imaging, DTI, fiber tractography, and postoperative CT data. RESULTS: Our model can predict VAT for impedances between 500 and 2000 with stimulation voltages up to 10 V. It is based on assumptions for monopolar DBS. Evaluation of 2 DBS cases showed a convincing correspondence between predicted VAT and neurologic (side) effects (internal capsule activation). CONCLUSIONS: Stimulation effects during DBS can be readily explained with this simple VAT model. Its implementation in daily clinical routine might help in understanding the types of tissues activated during DBS. This technique might have the potential to facilitate DBS implantations with the patient under general anesthesia while yielding acceptable clinical effectiveness. ABBREVIATIONS: DBS deep brain stimulation; DRT dentatorubrothalamic tract; IPG internal pulse generator; ML medial lemniscus; MPRAGE magnetization-prepared rapid acquisition of gradient echo; PD Parkinson disease; PT pyramidal tracts; RN red nucleus; rVAT radius of volume of activated tissue; SENSE sensitivity encoding; SNr substantia nigra; STN subthalamic nucleus; VAT volume of activated tissue T he concept of high-frequency electric stimulation in the brain to alleviate a variety of neurologic and psychiatric otherwise therapy-refractory disorders has gained wide accep- tance in the field of functional neurosurgery. 1 DBS is a tech- nique that delivers electrical pulses, variable in amplitude, pulse width, and frequency, through permanently implanted electrodes, which are connected to an IPG. 2 The electrodes are usually placed by using stereotactic pro- cedures based on imaging studies (CT, MR imaging) com- bined with real-time intraoperative x-ray and electrophysiol- ogy. Depending on the diagnosis and patient-specific symptoms, different anatomic targets have been proposed. For PD, the internal globus pallidus, the STN, and the ventral intermediate nucleus are typical target regions. 1,3 Although those targets have been empirically well-defined and proved to be beneficial to alleviate the neurologic and/or psychiatric symptoms, the true mechanism of DBS is still poorly understood. 4 Recent advances in the development of key technologies like optogenetic neuromodulation 5 (an ex- perimental technique used in animals to differentially influ- ence neuronal tissues on the basis of genetic manipulations and light of different wavelengths) and DTI-based fiber track- ing 6,7 have shifted the focus of attention from a lesion-simu- lating high-frequency inhibition of brain nuclei to a mere ac- tivation of the afferent axonal fiber environment of the nuclei. While mentionable progress has been made in improving the optimal anatomic target areas for DBS, only a few groups have devoted their effort to the specific aim of modeling and pre- dicting the electromagnetic field of an activated DBS electrode and understanding its interaction with the electromagnetic properties of the surrounding tissue by building volume-con- ductor electric field models. 8-16 Because the size and shape of the volume of VAT depend not only on electrode design and generator settings but more precisely on individual spatially varying tissue parameters and electromagnetic interaction at the electrode-tissue interface, it is impossible to derive a universal model based only on elec- trode design and stimulation voltage. The aim of this study, therefore, was to create a robust and simple numeric tool that provides sufficient and practically relevant feedback as to the patient’s individual VAT depend- ing on specific generator-stimulation settings and patient-de- Received July 21, 2011; accepted after revision September 8. From the Division of Stereotaxy and MR-Based Operative Techniques/Department of Neurosurgery, Bonn University Hospital, Bonn, Germany. Please address correspondence to Burkhard Ma ¨dler, PhD, Division of Stereotaxy and MR-Based Operative Techniques, Department of Neurosurgery, Bonn University Hospital, Sigmund Freud Str 25, 53105 Bonn, Germany; e-mail: [email protected] Indicates article with supplemental on-line table. http://dx.doi.org/10.3174/ajnr.A2906 1072 Ma ¨ dler AJNR 33 Jun-Jul 2012 www.ajnr.org
Transcript of Explaining Clinical Effects of Deep Brain Stimulation ...

ORIGINALRESEARCH
Explaining Clinical Effects of Deep BrainStimulation through Simplified Target-SpecificModeling of the Volume of Activated Tissue
B. MadlerV.A. Coenen
BACKGROUND AND PURPOSE: Although progress has been made in understanding the optimal ana-tomic structures as target areas for DBS, little effort has been put into modeling and predictingelectromagnetic field properties of activated DBS electrodes and understanding their interactions withthe adjacent tissue. Currently, DBS is performed with the patient awake to assess the effectivenessand the side effect spectrum of stimulation. This study was designed to create a robust and rathersimple numeric and visual tool that provides sufficient and practical relevant information to visualize thepatient’s individual VAT.
MATERIALS AND METHODS: Multivariate polynomial fitting of previously obtained data from a finite-element model, based on a similar DBS system, was used. The model estimates VAT as a first-approximation sphere around the active DBS contact, using stimulation voltages and individual tissue-electrode impedances. Validation uses data from 2 patients with PD by MR imaging, DTI, fibertractography, and postoperative CT data.
RESULTS: Our model can predict VAT for impedances between 500 and 2000 � with stimulationvoltages up to 10 V. It is based on assumptions for monopolar DBS. Evaluation of 2 DBS cases showeda convincing correspondence between predicted VAT and neurologic (side) effects (internal capsuleactivation).
CONCLUSIONS: Stimulation effects during DBS can be readily explained with this simple VAT model.Its implementation in daily clinical routine might help in understanding the types of tissues activatedduring DBS. This technique might have the potential to facilitate DBS implantations with the patientunder general anesthesia while yielding acceptable clinical effectiveness.
ABBREVIATIONS: DBS � deep brain stimulation; DRT � dentatorubrothalamic tract; IPG � internalpulse generator; ML � medial lemniscus; MPRAGE � magnetization-prepared rapid acquisition ofgradient echo; PD � Parkinson disease; PT � pyramidal tracts; RN � red nucleus; rVAT � radiusof volume of activated tissue; SENSE � sensitivity encoding; SNr � substantia nigra; STN �subthalamic nucleus; VAT � volume of activated tissue
The concept of high-frequency electric stimulation in thebrain to alleviate a variety of neurologic and psychiatric
otherwise therapy-refractory disorders has gained wide accep-tance in the field of functional neurosurgery.1 DBS is a tech-nique that delivers electrical pulses, variable in amplitude,pulse width, and frequency, through permanently implantedelectrodes, which are connected to an IPG.2
The electrodes are usually placed by using stereotactic pro-cedures based on imaging studies (CT, MR imaging) com-bined with real-time intraoperative x-ray and electrophysiol-ogy. Depending on the diagnosis and patient-specificsymptoms, different anatomic targets have been proposed.For PD, the internal globus pallidus, the STN, and the ventralintermediate nucleus are typical target regions.1,3
Although those targets have been empirically well-definedand proved to be beneficial to alleviate the neurologic and/orpsychiatric symptoms, the true mechanism of DBS is still
poorly understood.4 Recent advances in the development ofkey technologies like optogenetic neuromodulation5 (an ex-perimental technique used in animals to differentially influ-ence neuronal tissues on the basis of genetic manipulationsand light of different wavelengths) and DTI-based fiber track-ing6,7 have shifted the focus of attention from a lesion-simu-lating high-frequency inhibition of brain nuclei to a mere ac-tivation of the afferent axonal fiber environment of the nuclei.While mentionable progress has been made in improving theoptimal anatomic target areas for DBS, only a few groups havedevoted their effort to the specific aim of modeling and pre-dicting the electromagnetic field of an activated DBS electrodeand understanding its interaction with the electromagneticproperties of the surrounding tissue by building volume-con-ductor electric field models.8-16
Because the size and shape of the volume of VAT dependnot only on electrode design and generator settings but moreprecisely on individual spatially varying tissue parameters andelectromagnetic interaction at the electrode-tissue interface, itis impossible to derive a universal model based only on elec-trode design and stimulation voltage.
The aim of this study, therefore, was to create a robust andsimple numeric tool that provides sufficient and practicallyrelevant feedback as to the patient’s individual VAT depend-ing on specific generator-stimulation settings and patient-de-
Received July 21, 2011; accepted after revision September 8.
From the Division of Stereotaxy and MR-Based Operative Techniques/Department ofNeurosurgery, Bonn University Hospital, Bonn, Germany.
Please address correspondence to Burkhard Madler, PhD, Division of Stereotaxy andMR-Based Operative Techniques, Department of Neurosurgery, Bonn University Hospital,Sigmund Freud Str 25, 53105 Bonn, Germany; e-mail: [email protected]
Indicates article with supplemental on-line table.
http://dx.doi.org/10.3174/ajnr.A2906
1072 Madler � AJNR 33 � Jun-Jul 2012 � www.ajnr.org

pendent electrode-tissue properties. The model primarily re-lies on a patient’s individual impedance measures obtainedduring postoperative IPG programming with monopolar DBSelectrode settings and variable voltages. It generates VAT dis-tance isolines around the DBS contact for specific IPG voltagesby means of a spheric model. The model was consistentlytested for all 12 patients with STN-DBS on the basis of preop-eratively acquired DTI and fiber-tracking of critical fiber tractswith the individual effect/side-effect spectrum, but only 2cases are exemplary, shown in this article for the sake ofsimplicity.
Materials and Methods
Simulation and ModelWithout hypothesizing about the therapeutic mechanism of DBS, we
presume the validity and importance of the VAT to achieve the best
therapeutic effects with minimal impairment or side effects for the
patient under treatment.17 (In contradiction to various references, we
establish “volume of activated tissue” as VAT instead of VTA to dif-
ferentiate the term from the ventral tegmental area, a very important
anatomic region of the brain in neurosurgery and DBS.) From work
of various authors, notably the fundamental progress made by Kun-
cel, Grill, McIntyre, Butson, Yousif, and others,8-16 we adopted a sim-
ple model to estimate the VAT, based on a monopolar stimulation
design of a DBS electrode commonly used for PD, tremor, and
dystonia.
Previous work on axonal modeling18 and experiments on large
neurons as models for white matter19 show behavior of the VAT lat-
eral distance over the stimulus voltage that can be accurately fitted
with a second-order polynomial of the general form:
1) U�r� � k0 � k1r � k2r2,
where r represents the radius of the VAT centered at the electrode
contact at a voltage unit (U. k0), a geometry factor reflecting the radial
design and finite diameter of the electrode, can be held fixed if certain
geometric design parameters of the electrode are accommodated into
the model (eg, electrode radius, 0.75 mm). These prior investigations
led to the adaptation of our simplified model from previously pub-
lished data9 depicted in Fig 1. Digitizing this graph creates 3 sets of
data (voltage U versus radial distances x, y, and axial z) for the 3
investigated impedance regimen (low � 741 �, medium � 1003 �,
high � 1244 �) that are depicted by the corresponding symbols in Fig
2. The term “impedance” as used in this article refers to the electrical
impedance or resistance under conditions of electromagnetic wave
propagation for alternating current. It is an indicator for electrode-
tissue conductivity and also depends on the frequency of the AC or
pulsed wave form. The patient’s individual impedance was directly
measured with the help of the implanted IPG over an N�Vision telem-
etry system (Medtronic, Minneapolis, Minnesota).
Fig 1. VAT as a spatial plot of axis-symmetry stimulationspread for a common DBS and stimulus settings (�1.5,�2.0, �2.5, 3.0 V pulse amplitude, 130-Hz stimulation fre-quency with a 90-�s pulse width) by using 3 differentimpedance models. Reprinted and modified from Butson etal9 with permission from Elsevier.
Fig 2. Radial dimension of VAT dependent on stimulation voltage for 3 different simulatedimpedances (digitized from Butson et al9). The “experimental” points were fit with asecond-degree 2D polynom (independent variables, impedance, distance; dependent vari-able, stimulation voltage).
BRA
INORIGIN
ALRESEARCH
AJNR Am J Neuroradiol 33:1072– 80 � Jun-Jul 2012 � www.ajnr.org 1073

Although in theory, the VAT assembles an almost perfect sphere
for an isotropic impedance, one can see from Fig 1 that the medial
distance along the electrode (z) is slightly smaller than the radial dis-
tances x and y and can, therefore, be used for a refined asymmetric
model (also compare Fig 2, dashed blue line). The digitized results are
depicted in Fig 2 (symbols) together with second-order polynomial
fits from equation 1 (lines). For simplicity, we focus on the spherically
symmetric model with x � y � z and refer to this distance as the VAT
radius r.
Accurate prediction of the VAT at small voltages in close proxim-
ity to the electrode surface (r � 0.1 mm) will be highly inaccurate and
is, therefore, not in our focus of interest.
The obtained 1D model in Fig 2 was extended into a 2D problem
U � f(r,�) for the more general approach to also let the impedance �
be a variable in our fit:
2) U�r, �� � k0 � k1 � r � k2 � r� � k3 � r2
� k4 � � � k5 � �2.
The numeric analysis was performed with IGOR-Pro (Wavemetrics,
Lake Oswego, Oregon) on the basis of multivariate second-order
polynomial fitting by noniterative singular value decomposition. The
quality of fits was evaluated by means of mean-residual, SD, and �2
misfit according to Numerical Recipes.20
3D visualization was achieved with Amira (Visage Imaging, Ber-
lin, Germany).
All simulations were performed for the quadripolar DBS-elec-
trode model 3389 (Medtronic, Minneapolis, Minnesota) under mo-
nopolar stimulation settings. The model is similarly applicable to all
DBS electrodes with monopolar stimulation settings (IPG-positive,
contact-negative).
In Vivo StudyPatient Selection. Twelve patients with refractory PD participated
in this study with written informed consent. The treatment with STN-
DBS followed established guidelines. Retrospective evaluation of the
DTI together with clinical effects and the publication of data was
approved by the institutional review board of Bonn University (No.
199/09).
MR Imaging. Two days before surgery, MR imaging was per-
formed without a stereotactic frame and with the patient under mild
sedation. MR imaging data were acquired on a 3T intera table-body
system (Philips Healthcare, Best, the Netherlands) by using an 8-ele-
ment phased-array head coil (for full details refer to Coenen et al6).
The MR imaging examination comprised an isotropic T2-weighted
FSE, a DTI sequence, and 2 MPRAGE scans. The parameters were the
following: FSE: TR � 12,650 ms, TE � 100 ms, FOV � 254 mm,
matrix � 176 � 176, 120 sections, sections thickness � 1.44 mm, and
acquisition time � 3 minutes and 44 seconds. The resulting data were
reconstructed to isotropic 1.44-mm3 voxels: DTI: (SENSE, factor 2.9)
spin-echo EPI pulse sequence with TR � 13,188 ms, TE � 84 ms,
FOV � 256 mm, matrix � 128 � 128, 70 sections, section thickness �
2 mm, number of gradient directions � 32, b-value � 1000 s/mm2,
acquisition time � 7 minutes 54 seconds) with isotropic recon-
structed 2-mm3 voxels.
A T1-weighted 3D-MPRAGE sequence was acquired before
(structural information) and after (vessel visualization) contrast ad-
ministration (gadolinium-diethylene-triamine pentaacetic acid) with
a SENSE factor � 4, TR � 8.5 ms, TE � 3.8 ms, flip angle � 8°, FOV �
256 mm, matrix � 256 � 256, 160 sections, section thickness � 2
mm, acquisition time � 4 minutes 17 seconds. It resulted in recon-
structed isotropic 1-mm3 voxels.
All images were obtained in the axial orientation.
CT. Preoperative stereotactic CT scans were acquired on a 16-row
multidetector scanner (Brilliance 8000, Philips Healthcare) with a
fixed stereotactic frame. Parameters were as follows: tube voltage �
120 kV, tube current � 350 mA, collimation � 16 � 0.75 mm, tube
rotation time � 1 second, pitch � 0.942, matrix � 512 � 512, section
thickness � 1.5 mm, increment � 1.5 mm.
Postoperative CT used the following parameters: tube voltage �
120 kV, tube current � 350 mA, collimation � 16 � 0.75 mm, tube
Fig 3. The 3 successive stages of simulating the simple VAT. Left: the spheric model—radial diameter is the same in all directions. Middle: the ellipsoid-model radial— diameter is largerthan that along the z-axis (electrode axis). Right: torus model— known real shape from finite-element methods. For most practical applications, the simple spheric model is sufficient.
1074 Madler � AJNR 33 � Jun-Jul 2012 � www.ajnr.org

rotation time � 0.75 seconds, pitch � 0.688, matrix � 512 � 512,
section thickness � 2 mm, increment � 1 mm. The different postop-
erative CT scanning parameters were chosen for better electrode
metal artifacts suppression.
Stereotactic Procedure. Surgery followed stereotactic guidance
with a NexFrame neuronavigated head-mounted frame (Medtronic).
Direct targeting was based on the T2-weighted MR imaging anatomy
of the STN region with the anterior lateral and superior STN3 (mid-
commissural point coordinates: x � 12, y � �2, z � �4, bilaterally).
During surgery with the patient awake, the target region was scruti-
nized with microelectrode recording (Leadpoint, Medtronic) using
3–5 parallel tracts in a multiple-electrode array (so-called “Ben’s
gun”) setup in a microdrive (FHC, Bowdoin, Maine) attached to the
frame. After electrophysiologic location of the STN, test stimulation
was performed with the micro-macro electrode (MME, model 7100,
FHC, Bowdoin, Maine) to identify an electrode position with the best
therapeutic width between beneficial effects (reduction of rigidity,
improved bradykinesia) and unwanted side effects (dysarthria, facial
contraction). DBS electrodes were placed under fluoroscopic guid-
ance. An Activa PC (Medtronic) was used as a DBS pulse generator
and was implanted in the left subclavicular region.
Postoperative Electrophysiologic Testing. One week after DBS
implantation, blinded generator testing was performed. Each elec-
trode contact was tested separately to determine settings that yielded
the best therapeutic effects and kept capsular side effects (gaze palsy,
dysarthria, or facial contraction) to a minimum (compare On-line
Table 1 and Fig 5). The patient’s individual impedances, representing
the internal system impedance combined with tissue impedance, were
measured using the IPG on monopolar settings with 130-Hz and
60-�s continuous pulses and escalating voltages starting at 1 V with
0.5 V increments until persisting side effects were elicited.
Fiber Tracking. Deterministic fiber tracking used the StealthViz
DTI software application (Medtronic). Fiber tracking of the PT and
the DRT was performed as described previously.6,7
The ML was tracked with the same VOI in the midbrain used for
the DRT. The excluding VOI was set in the corresponding postcentral
gyrus.6
Determination of DBS Electrode Position and Respective Dis-
tance to Fiber Tracts. A postoperative helical head CT scan con-
firmed the targeted individual DBS electrode contact locations. The
CT data were automatically fused to all planning data. Fusion quality
was evaluated by visual inspection in 3 orthogonal image planes.
The 4 electrode contacts, each 1.5 mm long and 0.5 mm apart,
were numbered 0, 1, 2, and 3 from deep to superficial and were iden-
tified from the radial center of the CT metal artifacts.
Geometric distances between electrode contact and fiber tracts
were measured within the 3D visualization and measurement toolbox
of Amira.
Results and DiscussionThe simplest VAT approximation from equation 2 assumes aperfectly isotropic electromagnetic field distribution around amonopolar contact and creates a spheric VAT shape (Fig 3,left).
As one can appreciate from Fig 1, the VAT follows a slightlydifferent relationship along the z-axis of the electrode than inthe radial direction. In Fig 2, this is demonstrated exemplarilyby the z-profile (blue dashed line) for a low impedance regi-men (741 �) compared with the solid blue line for the radialprofile. Generally speaking, one needs a higher voltage alongthe electrode axis to achieve the same distance of activation.This general behavior for a monopolar stimulation regimencan be accommodated into the model by modifying the firstapproximation spheric shape of the VAT into an ellipsoid (Fig3, middle) or even further, supported by finite-element simu-lations and Maxwell equations, into the torus shape of theVAT (Fig 3, right). From more advanced and sophisticatedmodeling techniques that consider spatial tissue conductivityinhomogeneities of the DBS surrounding tissue12 (the imped-ance becomes a spatially varying parameter), one can appreci-ate that even those realistic VAT shapes assemble a reasonablesphere in first approximation.
In practice, DBS electrodes are typically implanted in suchfashion that beneficial stimulation effects will be commonlyachieved in the tissue located perpendicular to the axis of theelectrode because the trajectory needs to avoid functional tis-sue on its way to the target. Therefore, the radial distance of theVAT is notably the most interesting parameter for our simu-lation. We, therefore, concentrate on the simplest case of aspheric VAT (compare Fig 3, left) with its radius perpendicu-lar to the electrode axis.
Known simulation-input parameters are the electrical im-pedance �, which can be directly measured with the IPG foreach patient, electrode location and configuration, and thestimulation voltage U.
Due to low number of “experimental” values (from thedigitized graph in Fig 1), the multivariate 2D fit is rather sen-sitive to variance and uncertainty in the data. We, therefore,estimated the influence of all second-order polynomial coef-ficients, particularly those whose values resulted in close-to-
Table 1: Results of fit parameters for the second-degree 2D polynom from equation 2 and the corresponding �2 misfit valuesa
Model K0 K1 K2 K3 K4 K5 �2
1 0.2991 �1.2654 0.000341 0.2784 0.001217 �6.489e-07 0.86542 0.4665 �1.2684 0b 0.2784 0.001220 �4.824e-07 0.86623 0.9250 �1.2705 �0.000961 0.2784 0.001223 0b 0.87764 �0.0447 �1.0257 0b 0.2762 0.000985 0b 1.20195 �4.7284 0.0198 0.006848 0.2589 0b �2.095e-06 7.10946 �2.7584 0.0213 0.002694 0.2585 0b 0b 7.2387 0b �1.2563 0.000933 0.2783 0.0012093 �9.321e-07 0.86808 0b 0b �0.002664 0.2215 0.0002801 2.1989e-06 6.15599 �3.8025 0b 0.0052012 0.2253 0.0002560 �1.6892e-06 5.700610 0b �1.0473 0b 0.2786 0.0009856 0b 1.2141
Note:—max indicates maximum, min, minimum.a Model 10 is the simplest model (only 3 parameters) with close-to-best accuracy (�2 �min
2 ): maximum positive error � 0.356 V, maximum negative error � �0.326 V.b Values were purposely set to zero to simplify the 2D model and to test their relevance.
AJNR Am J Neuroradiol 33:1072– 80 � Jun-Jul 2012 � www.ajnr.org 1075
zero numbers for the completely unconstrained fit and for therobustness and quality of the fit. The aim was to use the sim-plest model (minimal number of coefficients) that still suffi-ciently described the experimental data and showed robust fitbehavior in the estimated range of practical relevant voltagesbetween 1 and 10 V and 1- and 5-mm VAT, respectively.
Table 1 summarizes the various attempts of fitting a 2Dsecond-order polynomial in equation 2 with different con-straints for the 6 fit parameters ki�0-5. 0b denotes a parameterthat was purposefully set to zero to eliminate its degree offreedom. �2 (normalized sum of squares of least-squares fit)represents the goodness of the fit—its accuracy, a larger valuesymbolizing a stronger deviation or misfit of the data to themodel. Because the smallest �2 value for an all-parameter freefit was 0.865, we characterized a good fit up to twice this value(�2 � 1.7).
With the general implementation of 6 fit parameters, wehad to perform 6! � 720 different combinations. In the fol-lowing, we summarize only the most important findings fromthe evaluation of model constraints. Forcing k0 (offset)through the origin, we observed an only marginal increase of�2 from 0.8654 to 0.8680, indicating the role of k0 as a geom-etry parameter (electrode radius) (compare Table 1, rows 1and 7). Additionally constraining k2 (linear term of imped-ance) and k5 (quadratic term of impedance) to zero did notlead to a notable increase in �2 either (compare Table 1, model10), whereas other combinations or alterations of constraintsresulted commonly in vastly enlarged �2 above the thresholdof 1.7. Therefore this model (model 10 in Table 1) is our modelof choice: We can eliminate 3 parameters from equation 3without compromising on the accuracy of the fit, leading to anonly marginal increase in �2 from 0.86 to 1.21 and gainingaccess to a more robust (less df) and easier model (fewerparameters).
The attempt to eliminate the “cross-term” (k4���r) be-tween the impedance and radius of VAT resulted in stronglyincreased �2, implicating the importance of the term for
proper modeling. This explains the difficulty in re-arrangingequation 2 into the more useful form of r � f(�,U), which ismore suitable for the practical implementation becauseknown parameters are usually � and U. Analytic reversal ofthe equation U � f(r,�) into the form r � r(�,U) could notachieve robust reproducible fit behavior.
Therefore, model analysis had to be performed iterativelysearching for the radius of VAT at any given impedance andvoltage. After the coefficients have been finally determined,either for the full set of all 6 or the reduced set of 3 coefficients,equation 2 can be substituted into the general form r � r(�,U)for easier calculation. We only provide the version with k0, k2,k5 � 0 for reasons of simplicity:
3) r��, U� �
�k4� � �k4
2�2 � 2k1k4� � k12 � 4k3U � k1
2k3.
Equation 3 and coefficients from Table 1 can be adopted intoa worksheet and provide a fast approach to estimating the VATradius for any given voltage between 1 and 10 V and imped-ance 500-2000 �.
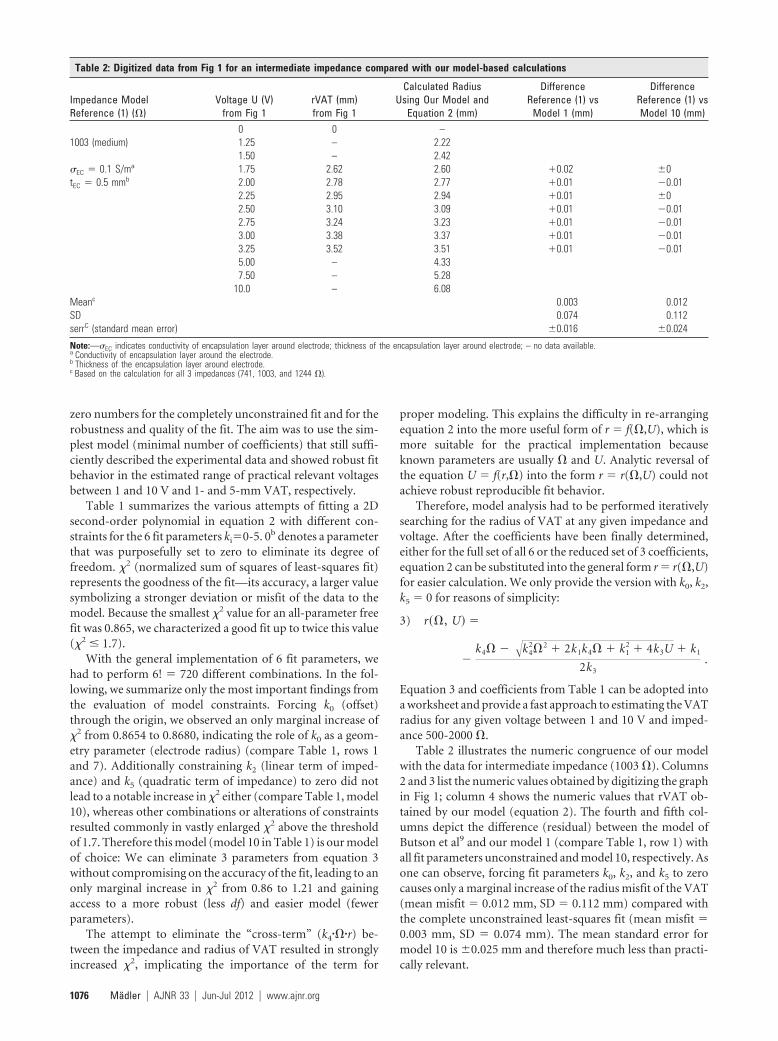
Table 2 illustrates the numeric congruence of our modelwith the data for intermediate impedance (1003 �). Columns2 and 3 list the numeric values obtained by digitizing the graphin Fig 1; column 4 shows the numeric values that rVAT ob-tained by our model (equation 2). The fourth and fifth col-umns depict the difference (residual) between the model ofButson et al9 and our model 1 (compare Table 1, row 1) withall fit parameters unconstrained and model 10, respectively. Asone can observe, forcing fit parameters k0, k2, and k5 to zerocauses only a marginal increase of the radius misfit of the VAT(mean misfit � 0.012 mm, SD � 0.112 mm) compared withthe complete unconstrained least-squares fit (mean misfit �0.003 mm, SD � 0.074 mm). The mean standard error formodel 10 is 0.025 mm and therefore much less than practi-cally relevant.
Table 2: Digitized data from Fig 1 for an intermediate impedance compared with our model-based calculations
Impedance ModelReference (1) (�)
Voltage U (V)from Fig 1
rVAT (mm)from Fig 1
Calculated RadiusUsing Our Model and
Equation 2 (mm)
DifferenceReference (1) vs
Model 1 (mm)
DifferenceReference (1) vsModel 10 (mm)
0 0 –1003 (medium) 1.25 – 2.22
1.50 – 2.42�EC � 0.1 S/ma 1.75 2.62 2.60 �0.02 0tEC � 0.5 mmb 2.00 2.78 2.77 �0.01 �0.01
2.25 2.95 2.94 �0.01 02.50 3.10 3.09 �0.01 �0.012.75 3.24 3.23 �0.01 �0.013.00 3.38 3.37 �0.01 �0.013.25 3.52 3.51 �0.01 �0.015.00 – 4.337.50 – 5.28
10.0 – 6.08Meanc 0.003 0.012SD 0.074 0.112serrC (standard mean error) 0.016 0.024
Note:—�EC indicates conductivity of encapsulation layer around electrode; thickness of the encapsulation layer around electrode; – no data available.a Conductivity of encapsulation layer around the electrode.b Thickness of the encapsulation layer around electrode.c Based on the calculation for all 3 impedances (741, 1003, and 1244 �).
1076 Madler � AJNR 33 � Jun-Jul 2012 � www.ajnr.org

As an example, in Fig 4 we present simulated data of atypical DBS treatment setting for patients with PD in the vi-cinity of the STN. The inset in Fig 4A outlines the generaltarget area (STN) as well as the angle and location of the DBSelectrodes for bilateral stimulation on an MR imaging T1-weighted standard brain template (Montreal Neurologic In-stitute 152). The inset in section A shows the MR imagingT1-weighted template in axial orientation through the mid-brain area with 3D-rendered structures of STN, SNr, and RN,constructed from a corresponding registered T2-weighted MRimaging template. Locations of the 2 monopolar-operatedDBS electrode contacts are the bilateral centers of the STNtogether with the simulated VAT at equal voltages on the leftand right sides. The different radii in both targets result frompostulated unequal impedances: left side � 1300 � resultingin rVAT � 2.61 mm; right side � 600 Ohm with a rVAT �3.93 mm. Fig 4B shows the VAT for stimulation voltage U �2.4 V at 1000 � on both sides (rVAT � 1.5 mm), and Fig 4Cshows the corresponding VAT for U � 3.5 V (rVAT � 3.25mm). Note that already a relatively small increase of 1 V instimulation voltage (B versus C) gives rise to a doubling ofrVAT, therefore an 8-fold increase in the activated volume formoderate impedances (V � r3).
In Vivo ValidationWe report 2 exemplarily chosen cases from a larger study (n �12) that illustrates the accurate correspondence between theestimated VATs from our model and the individual patientfindings from image guidance and DBS. Previous reports havealready implicitly used this technique and may serve as furthervalidation.6,21,22 We estimated the spatial accuracy of regis-tered preoperative MR imaging and pre- and postoperativeCT with the creation of individual fiber tracts to be better than1.5 mm. All herewith presented results have to be judged anddiscussed within this precision.
In all patients, the STN, SNr, and RN were segmented fromthe individual T2-weighted MR images. Generated fiber tractswere the PT, ML, and the DRT, all tracts in the vicinity of thementioned nuclei and structures very likely involved in possi-ble side effects of STN stimulation. Figure 5 and On-line Table1 summarize the findings. Outlines of the left DBS electrodetip, fiber tracts, and midbrain nuclei are depicted in Fig 5Awith an enlarged view in B. Figure 5C presents a summary forpatient 1: the left PT together with the different stimulationvoltages of the VAT at all contacts for best therapeutic settings(top row) and stimulation voltages that caused a number of
Fig 4. Example of simulated VATs (red spheres) with thenumeric model from equation 2 for various stimulation volt-ages and postulated impedances displayed on the MontrealNeurological Institute’s brain template MNI-152 T1-weightedMR imaging in an axial orientation. The electrode targetspecifies a typical location for STN-DBS in PD inside the STNclose to the SNr and RN. A, The inset depicts the generallocation of DBS electrodes in the region of the midbrain. VATwith equal stimulation voltage (2.5 V) for tissues with differ-ent impedances. Left: 1300 � VAT radius � 2.61 mm.Right: 600 � VAT radius � 3.93 mm. B, VAT for stimu-lation a voltage of 2.4 V at 1000 � (r � 1.5 mm). C, VAT fora stimulation voltage of 3.5 V at 1000 � (r � 3.25 mm).
AJNR Am J Neuroradiol 33:1072– 80 � Jun-Jul 2012 � www.ajnr.org 1077

side effects (bottom row). Figure 5D illustrates the same re-sults for patient 2.
Arrows indicate regions of the PT fibers that were pene-trated by the electric field of the DBS, visualized by the simu-lated VAT (blue transparent spheres). By projecting DBS con-tact, VAT, and PT and measuring their spatial distances fromeach other, we could predict the maximum distance betweenthe contact and proximal edge of the PT (maximal radius of
the VAT) that would not lead to neurologic side effects underSTN stimulation, like facial contractions, gaze paresis, anddysarthria.
On-line Table 1 shows how individual contact settings withescalating currents lead to effectiveness (reduced rigidity,tremor, and akinesia); then, as soon as the VAT radius extendsinto the internal capsule, they lead to contratherapeutic sideeffects. We found very accurate concordance between pre-
Fig 5. In vivo model validation with data from 2 patients withPD. A and B, Overview with a DBS electrode located in thesubthalamic nucleus (light blue). The massive fiber bundlejust lateral to the STN and SNr (green) is the PT (red). TheDRT (orange) is posterior to the fiber bundle. The simulatedVAT in B (blue mesh) represents the typical VAT stimulationfor a high-frequency stimulation of the anterior lateral andsuperior STN. C, Patient 1. D, Patient 2, left side of patientsshown only. Focus on clinical side effects (capsular, PTactivation). Upper row: contacts 0 –3 of a model 3389 DBSelectrode from Medtronic activated at different voltages.Contacts 2 and 3 show the best clinical effects as expectedform their location. Lower row: thresholds for capsular sideeffects. With the given voltages, the calculated VAT pene-trates the PT (arrows) at different contact settings (left toright, contacts 0 –3).
1078 Madler � AJNR 33 � Jun-Jul 2012 � www.ajnr.org

dicted voltages of simulated VAT and the onset of actual neu-rologic side effects (compare On-line Table 1, rVAT versusminimum proximal distance). The best therapeutic settingsfor patient 1 were achieved on contacts 2 and 3 with voltagesbetween 2 and 3 V, corresponding to rVATs of 3– 4 mm.Larger voltages caused various internal capsule side effects.This finding accurately reflects the good correspondence of anestimated minimal proximal distance between a DBS contactand PT of 3.6 –3.9 mm.
Optimal DBS settings for patient 2 were achieved on con-tacts 1, 2, and 3 with voltages between 1 and 3 V (compareOn-line Table 1) and corresponding estimated rVATs be-tween 2 and 2.8 mm. Side effects on contact 2 were noticeableat 4 V (rVAT � 3.3 mm) and on contact 3 at 3 V (rVAT � 3.4mm). These results also impressively confirm the estimatedminimal proximal distance of 2.5–2.6 mm between the elec-trode center and PT.
The last column in On-line Table 1 lists the percentageratio between the number of VAT-penetrated PT fibers andthe total number of cross-sectional PT fibers. We found thatalready very small percentages of involved fibers in the VAT(1%–5%) can lead to easily recognizable capsular side effects.This might indicate that the unwanted stimulation of only asmall portion of fiber tracts and their corresponding neuro-logic side effects is already sufficient to hamper the therapeuticbenefits of DBS.
Comparison between the clinical (side) effects of high-fre-quency stimulation and imaging results is subject to inaccura-cies that need to be discussed. During the testing phase afterthe implantation of DBS electrodes, individual contacts aretested for their (side) effect spectrum. With escalating voltages(typically 0.5 V steps), therapeutic width is defined as the volt-age needed to induce side effects (typically capsular effects likefacial contraction, dysarthria in STN-DBS) minus the voltageneeded to induce beneficial effects (typically tremor reduc-tion, reduction of rigidity, and bradykinesia). Rating of thisspectrum of clinical results is obviously highly subjective; nev-ertheless, the results indicate whether a therapeutic setting istolerable. Because this clinical appreciation of the (side) effectspectrum appears to be the hallmark of therapy effectiveness,it is justified to compare these delicate clinical ratings withVAT simulation results. The goal of the study was gearingtherapy toward an acceptable clinical effectiveness by usingVAT simulations to predict this outcome while the patient isunder general anesthesia.
ConclusionsWe introduce a simple empiric model for VAT estimationunder conditions of monopolar DBS stimulation. In conjunc-tion with high-resolution MR imaging and fiber tracking aswell as pre- and postoperative CT, our proposed model forinstant calculation and visualization of VAT opens access tobetter characterization and understanding of physiologic, an-atomic, and neurologic phenomena in the treatment of pa-tients with PD and movement disorders with DBS.
Although the validity of the model has been demonstratedon only 2 clinical cases of movement disorders for matters ofsimplicity in this article, its implementation and consequencesfor planning, targeting, and understanding the implications of
DBS in movement disorders have become a key component inour clinical DBS procedures.
We admit that the model is rather simple and that its accu-racy depends primarily on the accuracy of the data that accom-modate the model, but the combination of modern imagingtechniques and established physiologic impedance measuresallows a very high spatial accuracy between 1.0 and 1.5 mm, anecessary precondition to validate and exploit the model-based estimations in a useful manner. Also emphasis should begiven to the fact that equation 2 does not constitute a “mean-ingful” electrophysiologic or electric field model but providesa mathematic lever to describe empiric findings under specificimplementations of DBS. An exact classification of VAT doesnot exist, and the empiric findings might vary subjectively aswell as manifest themselves in numerous individual patientvariations.
Nevertheless, we believe in the usefulness of the implemen-tation of the model, particularly in the time-restrained settingof an interventional DBS operating room or in its surgicalpreparation and targeting process. The simulation of esti-mated VAT can be achieved instantaneously under clinicalsettings as soon as the patient’s individual impedance or per-mittivity data have been obtained. Hypothetically, one couldprovidently envision a scenario in which these model out-comes might even assist in establishing and steering optimalIPG settings for the best therapeutic benefits synchronouswith minimal neurologic side effects.
With the complexity and effective difficulty of modeling aclose-to-reality electric field based on all possible input pa-rameters (electrode geometry, tissue impedance, electrode-tissue surface effects, and so forth), we are certain that ourcontribution could be practically useful for stereotactic neu-rosurgeons performing DBS. The implementation of thistechnique into daily clinical routine might help to understandthe different types of activated tissues (neurons, nuclei, whitematter pathways) during DBS, leading to a better appreciationof what our target structures really are and how we can influ-ence these. It might also help to achieve more accurate elec-trode positions. However, the major application we clearlyforesee is the future perspective to perform DBS completelyunder general anesthesia if the clinical side effect spectrum canbe readily predicted from electrophysiologic measurementsduring implantation and on the basis of realistic simulationsof clinical effects like those presented here. This would be aninvaluable improvement in patient comfort over the usuallylong DBS procedure.
Disclosures: Burkhard Madler—UNRELATED: Travel/Accommodations/Meeting ExpensesUnrelated to Activities Listed: International Society for Magnetic Resonance in Medicine,Comments: travel/conference fees. Volker A. Coenen—UNRELATED: Consultancy: Medtronic(Europe and USA), Comments: I have been working as a consultant for MedtronicNeuromodulation, occasionally receiving honoraria for activities and travel grants, Paymentfor Lectures (including service on speakers bureaus): Medtronic (Europe and United States).
References1. Sakas DES, Brian A, eds. Operative Neuromodulation: Neural Networks Surgery.
New York: Springer-Verlag; 20072. Perlmutter JS, Mink JW. Deep brain stimulation. Annu Rev Neurosci 2006;29:
229 –573. Coenen VA, Prescher A, Schmidt T, et al. What is dorso-lateral in the subtha-
lamic nucleus (STN)? A topographic and anatomical consideration on theambiguous description of today’s primary target for deep brain stimulation(DBS) surgery. Acta Neurochir (Wien) 2008;150:1163– 65
AJNR Am J Neuroradiol 33:1072– 80 � Jun-Jul 2012 � www.ajnr.org 1079
4. Johnson MD, Miocinovic S, McIntyre CC, et al. Mechanisms and targets of deepbrain stimulation in movement disorders. Neurotherapeutics 2008;5:294–308
5. Gradinaru V, Mogri M, Thompson KR, et al. Optical deconstruction of parkin-sonian neural circuitry. Science 2009;324:354 –59
6. Coenen VA, Madler B, Schiffbauer H, et al. Individual fiber anatomy of thesubthalamic region revealed with DTI: a concept to identify the DBS target fortremor suppression. Neurosurgery 2011;68:1069 –75, discussion 1075–76
7. Burgel U, Madler B, Honey CR, et al. Fiber tracking with distinct software toolsresults in a clear diversity in anatomical fiber tract portrayal. Cen Eur Neuro-surg 2009;70:27–35. Epub 2009 Feb 3
8. Butson CR, Cooper SE, Henderson JM, et al. Probabilistic analysis of activa-tion volumes generated during deep brain stimulation. Neuroimage 2011;54:2096 –104
9. Butson CR, Maks CB, McIntyre CC. Sources and effects of electrode imped-ance during deep brain stimulation. Clin Neurophysiol 2006;117:447–54
10. McIntyre CC, Butson CR, Maks CB, et al. Optimizing deep brain stimulationparameter selection with detailed models of the electrode-tissue interface.Conf Proc IEEE Eng Med Biol Soc 2006;1:893–95
11. McIntyre CC, Frankenmolle AM, Wu J, et al. Customizing deep brain stimu-lation to the patient using computational models. Conf Proc IEEE Eng Med BiolSoc 2009;2009:4228 –29
12. Miocinovic S, Lempka SF, Russo GS, et al. Experimental and theoretical char-acterization of the voltage distribution generated by deep brain stimulation.Exp Neurol 2009;216:166 –76
13. Cooper SE, Kuncel AM, Wolgamuth BR, et al. A model predicting optimalparameters for deep brain stimulation in essential tremor. J Clin Neurophysiol2008;25:265–73
14. Kuncel AM, Cooper SE, Grill WM. A method to estimate the spatial extent ofactivation in thalamic deep brain stimulation. Clin Neurophysiol 2008;119:2148 –58
15. Hemm S, Mennessier G, Vayssiere N, et al. Deep brain stimulation in move-ment disorders: stereotactic coregistration of two-dimensional electricalfield modeling and magnetic resonance imaging. J Neurosurg 2005;103:949 –55
16. Yousif N, Purswani N, Bayford R, et al. Evaluating the impact of the deep brainstimulation induced electric field on subthalamic neurons: a computationalmodelling study. J Neurosci Methods 2010;188:105–12
17. Butson CR, McIntyre CC. Role of electrode design on the volume of tissueactivated during deep brain stimulation. J Neural Eng 2006;3:1– 8
18. McIntyre CC, Mori S, Sherman DL, et al. Electric field and stimulating influ-ence generated by deep brain stimulation of the subthalamic nucleus. ClinNeurophysiol 2004;115:589 –95
19. Ranck JJ. Which elements are excited in electrical stimulation of mammaliancentral nervous system: a review. Brain Res 1975;98:417– 40
20. Press WH, Flannery BP, Teukoslky SA, et al. Numerical Recipes. Cambridge,United Kingdom: Cambridge University Press; 1986
21. Coenen VA, Honey CR, Hurwitz T, et al. Medial forebrain bundle stimulationas a pathophysiological mechanism for hypomania in subthalamic nucleusdeep brain stimulation for Parkinson’s disease. Neurosurgery 2009;64:1106 –14
22. Coenen VA, Schlaepfer TE, Maedler B, et al. Cross-species affective functionsof the medial forebrain bundle: Implications for the treatment of affectivepain and depression in humans. Neurosci Biobehav Rev 2011;35:1971– 81. Epub2010 Dec 22
1080 Madler � AJNR 33 � Jun-Jul 2012 � www.ajnr.org