Explain briefly the principles of a mercury thermometer ...
26
Measurement By Amanda Diaz 1999a(5)/1995b(7): Differentiate between the terms heat and temperature. Explain briefly the principles of a mercury thermometer, indicating its advantages and disadvantages Heat: Form of energy. - Units: joules (J). - Represents the amount of kinetic energy contained within the molecules of a substance - Lowest entropic energy - Final conversion of higher forms of energy (electrical, chemical etc) Temperature: thermal state of a substance which determines whether it will give or receive heat from another substance - Heat is transferred down a temperature gradient - Units: Kelvin (K) is absolute temperature. Commonly used is degrees Celsius (°C) where Δ1K = Δ1°C Relating heat and temperature: - Specific Heat Capacity: Amount of (heat) energy applied to 1kg of a substance in order to increase its temperature by 1°C (or 1K) o Specific heat capacity H 2 O = 14.8 kJ/kg/°C Mercury Thermometer - Fixed amount of mercury within an evacuated glass column - Application of heat → ↑T°C of mercury → expansion of fluid → movement up column o Ceases movement when mercury reaches thermal equilibrium with external environment - Angled constriction at lower part of column → enables mercury to remain at level even after removal from Pt (until shaken down into bulb) Advantages - Economical o Cheap to produce o Cheap to maintain → doesn’t require calibration as it is a close system - Accurate - Able to be sterilised - Fast time constant (within 2 – 3 min) Disadvantages - Safety: difficult to introduce into some orifices 2° rigidity and risk of breaking o Mercury is toxic - Column has to be of a fixed length → not able to shrink size - Will not give accurate reading if has not reached thermal equilibrium (2 – 3 min)
Transcript of Explain briefly the principles of a mercury thermometer ...

Measurement
By Amanda Diaz
1999a(5)/1995b(7): Differentiate between the terms heat and temperature. Explain briefly the principles of a mercury thermometer, indicating its advantages and disadvantages Heat: Form of energy.
- Units: joules (J). - Represents the amount of kinetic energy contained within the molecules
of a substance - Lowest entropic energy - Final conversion of higher forms of energy (electrical, chemical etc)
Temperature: thermal state of a substance which determines whether it will give or receive heat from another substance
- Heat is transferred down a temperature gradient - Units: Kelvin (K) is absolute temperature. Commonly used is degrees
Celsius (°C) where Δ1K = Δ1°C Relating heat and temperature:
- Specific Heat Capacity: Amount of (heat) energy applied to 1kg of a substance in order to increase its temperature by 1°C (or 1K)
o Specific heat capacity H2O = 14.8 kJ/kg/°C Mercury Thermometer
- Fixed amount of mercury within an evacuated glass column - Application of heat → ↑T°C of mercury → expansion of fluid → movement
up column o Ceases movement when mercury reaches thermal equilibrium with
external environment - Angled constriction at lower part of column → enables mercury to remain
at level even after removal from Pt (until shaken down into bulb) Advantages
- Economical o Cheap to produce o Cheap to maintain → doesn’t require calibration as it is a close
system - Accurate - Able to be sterilised - Fast time constant (within 2 – 3 min)
Disadvantages - Safety: difficult to introduce into some orifices 2° rigidity and risk of
breaking o Mercury is toxic
- Column has to be of a fixed length → not able to shrink size - Will not give accurate reading if has not reached thermal equilibrium (2 – 3
min)

Measurement
By Amanda Diaz
1999b(7): Describe how the partial pressure of O2 in a blood sample is measured using a Clark Electrode General: In vitro analysis of O2 tension (partial pressure) is made using a blood gas analyser which incorporates a Clark electrode. Clark electrode: AKA oxygen electrode
- Cathode: Platinum - Anode: Silver chloride - Salt bridge: KCl (allows the transfer of electrons)
A potential difference between the anode and cathode is applied (0.6V)
- Current flow measured by movement of electrons from: o Anode: Electrons produced by Ag+ + Cl- → AgCl + e-, to o Cathode: Electrons accepted by O2 to form hydroxyl
ions from O2 + 4e- + 2H2O → 4OH-
- ↑O2 will ↑reaction at cathode → ↑current flow (linear relationship at 0.6V) Platinum cathode must be separated from blood (build-up of protein on platinum will interfere with reaction)
- plastic membrane separates blood from platinum (which has a small amount of electrolyte on tip)
o Oxygen tension in blood equilibrates with that in the electrolyte around the cathode
- Accuracy +/- 2mmHg Limitations
- Temperature must be kept at 37°C - Cathode / membrane must be kept clean and in good condition - Calibration using standard gases must be regularly performed - Delay in analysis of sample with result in ↓pO2 in sample

Measurement
By Amanda Diaz
2002a(7): Outline the principles of a pneumotachograph. What factors affect the accuracy of this device? General: Used to measure respiratory airflow. Integrating flow wrt time → can derive volumes as well Components:
- Input from Pt breathing circuit → output continues along circuit - Flow-measuring unit is fixed orifice (diameter) gauze screen within tube
o Sufficiently large diameter to ensure laminar flow Mechanism of action
- Resistance to air flow caused by the gauze screen causes a small pressure drop (1 – 2 cmH2O) across the gauze
- Pressure change measured by a transducer (amplified by a Wheatstone Bridge) which converts the pressure change into an electrical signal → displayed.
Advantages - analyses breath to breath - Minimal ↑resistance to breathing
Accuracy affected by: - The same things which affect laminar flow (Hagan-Poiseuille Equation)
Q = ΔP. πr4 8ηl
- Viscosity of gas o Composition (VA will change – inaccurate if not calibrated for) o Temperature of gas → can be maintained with an intrinsic heating
element - Obstruction of gauze
o Water condensation → minimised with heating element o Mucous
- Turbulent flow Reynolds’ number can predict likelihood of turbulent flow Re = 2rvd η o Too large a diameter for flow (adult size for a child) → ↑r, ↓v o Flows too high for system (↑v) o ↑Density of gas
- Insufficient flow o Pressure drop across gauze too small to be detected

Measurement
By Amanda Diaz
2003a(13)/2000b(2)/1996a(2): Briefly describe the principles and sources of error in the measurement of systemic arterial blood pressure using an automated oscillometric non-invasive monitor General: Oscillometric non-invasive blood pressure monitors (NIBP) are the standard non-invasive technique for monitoring arterial blood pressure in anaesthetic practice General Principles of Operation: Components: Cuff w/inflatable bladder connected by tubing to air pump and pressure transducer (pressure and oscillations) → results display Method:
- Gradual deflation (2 – 3mmHg increments) of cuff from above systolic P (occluded artery) via a bleed valve
- Oscillations transmitted along tubing to transducer → processing unit analyses signal from the transducer
o Detects onset of oscillations (Systolic P) o Point of max amplitude oscillations (MAP) o Diastolic pressure is derived either from where oscillation amplitude
plateaus or from both of these values (DBP = 4SBP – 3MAP) - Inflation can be preset to desired intervals
o Subsequent inflations will only occur to 25mmHg above the previous systolic P
Sources of Error NIBP:
- Incorrect cuff size: Width should be 20% of arm length o Too large → artificially low readings o Too small → artificially high readings
- Cuff: o Leaky/damaged cuff → unable to maintain pressure → ↓accuracy /
sluggish readings - Too high a frequency of recordings
o Minimal interval of 2 min desirable o Too short an interval → impedes blood flow → ↓accuracy of
readings (↓compliance of vessels → artificially ↑BP) - Diastolic P is a derived value
o Not directly measured (see above) - Intermittent → cannot accurately monitor rapid changes
o If changes occur between periods of measurement → ↑error Patient
- Dysrhythmias o AF / atrial flutter will have beat to beat variation in blood pressure
→ ↓accuracy of intermittent BP measurements - Hypotension
o Accuracy of measurements ↓at very low BP o Fails to record at systolic P < 50mmHg

Measurement
By Amanda Diaz
2004a(14)/1997b(6): Briefly describe the difference b/n laminar and turbulent flow. List factors that increase the probability of turbulent flow Laminar flow = Movement of gas / liquid in a tube (eg bronchus) with velocity maximal at centre of tube and almost stationary at tube walls
- Flow can be thought of as occurring in concentric tubes - In laminar flow, resistance is inversely proportionate to radius (r) of tube,
and proportionate to viscosity of gas (η) and length of tube (l) o Poiseuille-Hagan Equation:
resistance = 8ηl πr4
- There is a linear relationship between pressure and flow Turbulent flow = Occurs when laminar flow breaks down and there is a formation of small eddies within the tube forming a square wave front
- Pressure required with turbulent flow is dependent on gas density rather than viscosity
o ↑d → ↑P - For a given velocity, work of breathing is ↑ with turbulent flow cf
laminar flow - Pressure is proportionate to flow2 - Resistance α √ΔP
Q α dl πr5
Factors that ↑ probability of turbulent flow: - Reynold’s number can be calculated to describe these factors:
o Re = 2rvd η
- ↑ gas flow rate (v) o Beyond ‘critical’ velocity for a given set of conditions (eg ↑vel 2°
bronchocontriction) → all flow turbulent - ↑radius (r) of tube - High density (d) (eg N2 v He) gas - Low viscosity gas - In smooth tubes, Re > 2000 produces turbulent flow
o Branching of tubes ↓smoothness of tube → ↑turbulent flow around bifurcation points
o Anything that ↓smoothness of tube (↑secretions, compliance)

Measurement
By Amanda Diaz
2004b(11): Briefly explain how oximetry can be used to estimate the partial pressure of O2 in a blood sample General: Oximetry is a spectrophotometric technique using the principle that the amount of radiation absorption by oxyHb and deoxyHb is different. Summarised by the Beer-Lambert Law It = Ii x e-DCα where, It is intensity of incidental light; Ii is
intensity of transmitted light; α is extinction coefficient; D is distance through medium (i.e. conc of solute)
Generally, there is a logarithmic dependence between the transmission of light through a substance, and that substance’s concentration; as well as the transmission of light through a substance, and the distance of material the light travels through
- 2 LEDs: emitting red light (λ 660nm) and infrared light (λ 940nm)
- ↓absorbance of red light by oxyHb cf deoxyHb - ↑absorbance of infrared light by oxyHb cf
deoxyHb In vitro analysis
- Haemolysed sample of blood - 2 light wavelength are alternately passed
through sample o Amount transmitted through is detected by photocells o The ratios of absorbed / transmitted light is analysed to provide a
quantitative analysis of oxyHb and deoxyHb → SaO2 pO2 Estimation
- By use of the OHDC, can derive pO2 - Under normal resting conditions:
o SaO2 97% → pO2 100mmHg o SaO2 90% → pO2 60mmHg o SaO2 75% → pO2 40mmHg
- Estimate affected by: o Curve Shift 2° CO2, pH, 2,3-
DPG, T°C Some can be accounted
for in vitro (not 2,3-DPG) o ‘flat’ upper part:
SaO2 98 – 100% can incorporate a range of pO2 → predictions can no longer be made accurately (could be anything above 100mmHg
o Sample: Delay in sampling → ↓pO2 → ↓SaO2, ↓pH
Measurement
By Amanda Diaz
2005a(16)/1998a(4): Briefly explain the principles of Doppler US used to measure cardiac output General: Doppler principle related to wavelength and frequency of a sinusoidal wave. v = fλ
- As a wave is transmitted → when the transmitter moves towards the detector it will shorten the λ→ ↑f (velocity constant)
- As the transmitter moves away from the detector there is ↑λ→ ↓f o Eg. As an ambulance with siren (transmitter) moves toward the
listener (detector) the pitch of the siren is higher than when the siren is moving away from the listener
Doppler USS for CO measurement - Ultrasound is very high frequency sound waves (beyond the capacity for
human hearing) → 2.5 – 15 MHz o Travels well through body tissues (at a constant velocity 1540m/s)
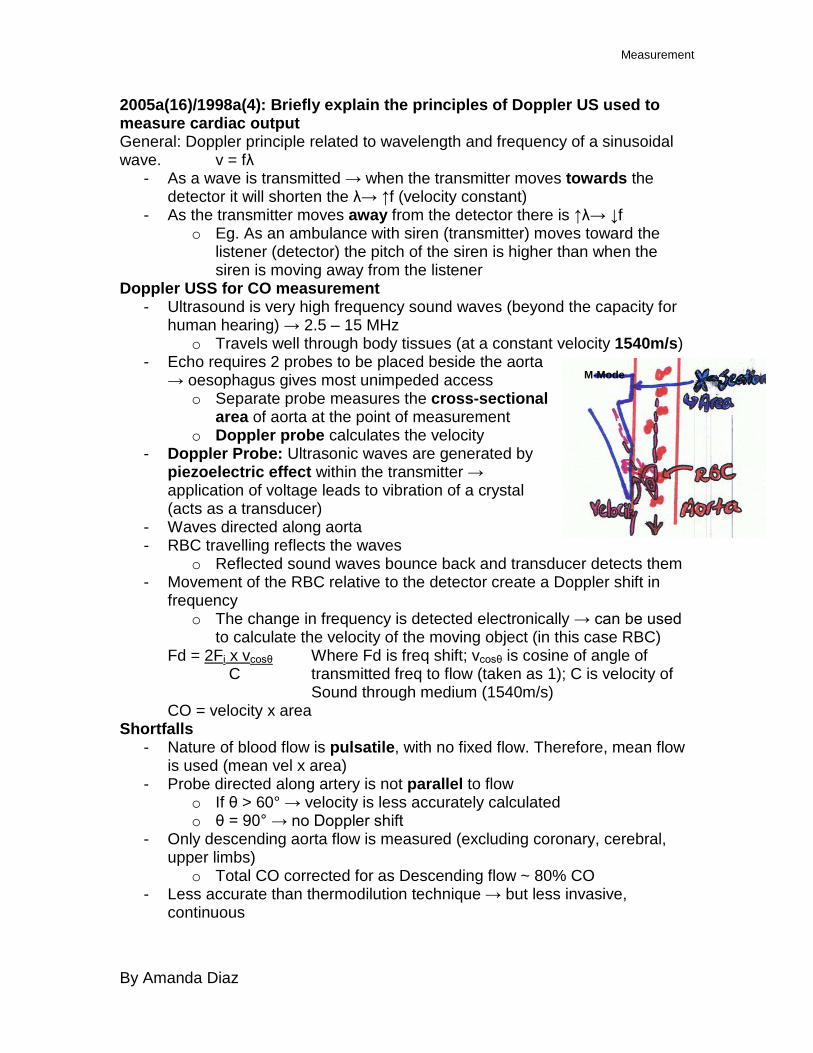
- Echo requires 2 probes to be placed beside the aorta → oesophagus gives most unimpeded access
o Separate probe measures the cross-sectional area of aorta at the point of measurement
o Doppler probe calculates the velocity - Doppler Probe: Ultrasonic waves are generated by
piezoelectric effect within the transmitter → application of voltage leads to vibration of a crystal (acts as a transducer)
- Waves directed along aorta - RBC travelling reflects the waves
o Reflected sound waves bounce back and transducer detects them - Movement of the RBC relative to the detector create a Doppler shift in
frequency o The change in frequency is detected electronically → can be used
to calculate the velocity of the moving object (in this case RBC) Fd = 2Fi x vcosθ Where Fd is freq shift; vcosθ is cosine of angle of C transmitted freq to flow (taken as 1); C is velocity of Sound through medium (1540m/s) CO = velocity x area
Shortfalls - Nature of blood flow is pulsatile, with no fixed flow. Therefore, mean flow
is used (mean vel x area) - Probe directed along artery is not parallel to flow
o If θ > 60° → velocity is less accurately calculated o θ = 90° → no Doppler shift
- Only descending aorta flow is measured (excluding coronary, cerebral, upper limbs)
o Total CO corrected for as Descending flow ~ 80% CO - Less accurate than thermodilution technique → but less invasive,
continuous
M-Mode

Measurement
By Amanda Diaz
2005b(13)/2000a(1): Explain how cardiac output is measured using a thermodilution technique Cardiac Output (CO) = volume of blood pumped around the body per unit time = HR x SV (L/min) In the typical 70kg male = 5 L/min Thermodilution is gold standard → based on the Fick principle
BF to organ (heart) = Rate of uptake (or excretion) of a substance Conc difference (arterial – venous) - Substance in thermodilution technique = cold bolus of fluid - Conc difference is measured by ΔT°C - There is a complicated equation which relates this to other variables
involved in the injection of a substance…Stewart-Hamilton Equation Thermodilution technique
- PA catheter with 2 channels is inserted into the internal jugular vein o 1st channel rests at the SVC / RA o 2nd channel contains a thermistor → inserted into (PA)
- A 10ml bolus of 5% dextrose at a known temp is rapidly administered through the 1st channel
o Mixes with warm blood in right heart → ΔT°C of blood o ΔT°C of blood is detected as it passes by the thermistor in the PA
- Temperature v time → gives a ‘washout curve’ - Similar to clearance, CO α 1
AUC CO calculated by: Vol injected
AUC
- 5 readings are taken → middle 3 readings are averaged = CO
o Continuous technique uses pulses IR → multiple curves obtained in a short period of time → ↑accuracy / semi-continuous reading
Advantage of Thermodilution v Dye dilution - Ease of repeatability
o Dye dilution: typically curve has a 2nd peak (2° recirculation of dye) Limits the ease of repeated measurements
o Thermodilution curve doesn’t have a 2nd peak (recirculation less evident)
- Non-toxic - Doesn’t require sampling of blood
o Dye dilution requires arterial sampling of blood for analysis by spectrophotometer
Disadvantages of Thermodilution technique - Invasive → risks of cannulation of central vein (bleeding, infection, PTX,
arrhythmia) - Cold fluid can induce arrhythmias - Low accuracy (CO measured can be +/- 25% actual)

Measurement
By Amanda Diaz
2001a(3): Briefly describe measurement of pH in a blood sample using a pH electrode General: pH = -log10[H+] x a where [H+] is hydrogen ion concentration, a is activity Measurement using a pH electrode
- uses the principle that the electrical potential generated across a H-sensitive glass membrane is proportional to the pH difference across that membrane
- consists of 2 x half cells: the glass electrode and the reference electrode both connected via blood to make a complete circuit
o Glass electrode: Ag/AgCl core encased in glass. [H+] within glass electrode kept constant by buffer solution. Glass is in contact with blood
o Reference electrode: Ag/AgCl bathed in KCl (salt bridge) → doesn’t participate in H-measureent. Semi-permeable membrane separates it from blood
- Blood passes by both electrodes, H+ ions attracted to glass (negatively charged). Buffer [H] fixed → creates a difference in [H+] across the glass membrane.
- Difference across glass membrane measurable as a potential difference b/n the electrodes (EMF).
o This allows the measurement of pH in blood as the pH of the solution measured by the reference electrode is constant.
- Requirements: o Standardisation of T°C (pH changes inversely with change T°C) o Regular calibration (x2 buffers of known pH (PO4 buffers).

Measurement
By Amanda Diaz
2006b(12): Explain the difference between viscosity and density. Outline the effects of changes in viscosity and density on the flow of gases and liquids Viscosity (η): Used to indicate a fluid’s internal resistance to flow. Also thought of as a measure of the friction of a fluid.
- e.g. honey has a high viscosity than water and as such moves much slower if poured
Density (ρ): relates the mass of a substance to its volume such that ρ = kg/m3 Although some gases may have similar viscosity, their densities may be different (eg. O2 and He) Flow measure of volume of fluid / gas moved per unit of time (e.g. ml/min). Flow through tubes can either be laminar or turbulent Laminar flow
- For flow to be laminar, the tube in which it is travelling must have smooth, parallel sides with no branches in the system
- Gas / fluid moves in small concentric tubes in parallel to the sides such that the movement of substance in the centre is twice the velocity of the movement of substance at the walls (there is no flow at the walls)
- There is a linear relationship between pressure and flow
- Resistance can be calculated by Hagan-Poiseuille Equation: R = 8ηl πr4
- Viscosity of the gas / fluid is directly proportionate to resistance: ↑η → ↑R → ↓flow
o Density has no effect on the flow of gas during laminar flow. - Altering the other variables will change R as seen
Turbulent Flow - Occurs in other situations - Flow is disorganised with small eddies forming → creates a
square wavefront - Pressure is proportionate to flow2 - Resistance proportional to density and not viscosity
R α ρl πr5
- Reynold’s number can predict the likelihood of turbulent flow occurring Re = 2rvρ η >2000 → ↑probability of turbulent flow
- Density is the major determinant of Re: ↑ρ (N2 v He) → ↑turbulent flow o Flow is inversely proportional to ρ
- η has a much smaller contribution to the determination of Re: ↓η → ↑probability of turbulent flow
Measurement
By Amanda Diaz
2007a(15): Describe the effects of resonance and damping on an invasive arterial blood pressure tracing Art Line system needs accurate representation of amplitude and phase shift. Requires:
- high undamped f0 - correct damping coefficient
Resonance frequency: externally applied frequency causes maximal oscillation of a system
- f0 = natural resonance frequency - BP system has f0 1 – 3 Hz (60 – 180 bpm)
o In order to not oscillate, art line system must have a f0 > 3 Hz. In order to have no oscillations in physiological range → must be > 10th harmonic (>30Hz)
o Addition of components to a system (effective ↑damping) → ↓resonance frequency → current art line transducer f0 40 – 60 Hz (2/3rd of this when added to tubing, cannula, saline)
- If f0 within physiological range → superimposes an oscillating (sine) wave on pressure tracing
- f0 of art line system can be ↑by short, stiff cannula Damping: tendency of a system to extinguish oscillations via viscous and frictional forces within the system
- Degree of speed with which an oscillating system returns to baseline Damping coefficient
- 0: pressure waveform oscillates at f0 → no ↓oscillations over time - 1: falls quickly to baseline → no overshoot (critical damping) - 0.64 (64% of critical damping): Ideal damping. Overshoot is minimised,
speed of response only slightly reduced o 7% overshoot of original deflection o Amplitude accurately displayed o Minimal phase shift
Underdamped: exaggerates pressure waveform → close to f0 - ↑damping by ↑tube length - ↑taps
Overdamped: loss of high frequency oscillations → true pressure (systolic) underestimated
- Causes: bubbles in saline; clot in cannula; excessive tubing Effect of inaccurate damping:
- Inaccurate representation systolic pressure o High frequency components (overdamping will underestimate;
underdamp will overestimate)

Measurement
By Amanda Diaz
2002b(14)/1998b(4): Explain the physical principles of ultrasound imaging General: US is a way of imaging internal soft tissue structures within the body through the reflection and detection of sound waves
- Frequency Range: 2 – 15 MHz US Generation: A crystal within the transmitter probe is stimulated to vibrate by an electrical current→ occurs 2° to piezoelectric effect. Electrical energy transduced to sound energy US Detection: Reflected waves are detected by the probe. Sound waves cause the same crystal to vibrate → transduced into an electrical signal (piezoelectric effect) Transmission: Sound waves will be absorbed, transmitted through or reflected off tissue
- Will be partially reflected if there is a change in density b/n 2 substances
o B/N air and skin would cause ↑attenuation of signal → minimise by application of gel
- Forms body structures by waves bouncing off boundaries and interfaces b/n substances of different densities
o Signal presented on a display → amplitude of wave represented by the brightness of a dot on the screen (↑brightness → ↑amp)
Modes: A (amplitude scan): pulses of US, amplitude plotted against time for sound to reflect. No longer used
- Provides information regarding tissue depth B (brightness): pulses in 1 dimension → amplitude = brightness
- Changing direction of US source → tomogram produced M (motion): B-mode plotted against time
- Rapidly repeating vibrations detect movement at tissue interfaces 2D: Sequential B-mode across 90°
- Requires an array of crystals Doppler: using Doppler shift to establish the velocity of the moving object which is reflecting the sound waves. Superimposed on 2D, colours represent direction wrt detector (red = towards, blue = away) Issues Resolution: v = fλ v is fixed
o Better pictures with higher freq (↑freq = ↑resolution) → will shorten λ → ↓depth of tissue penetration
o Better pictures with bigger waves (↑amp = ↑resolution) → will ↑artefact
o Better picture with ↑gain → ↑gain = ↑noise Uses in anaesthesia: Cardiac: Echo, TOE, Nerve blockade, Epidural

Measurement
By Amanda Diaz
BIS - Method for monitoring depth of anaesthesia - 2 monitors available: BIS, entropy
Both display and analyse a processed EEG - Gives an indication of the changes commonly associated with use of
majority of agents o Not ketamine, opioid based anaesthetic
Analyses: combined to calculate a BIS number. The relative contributions of each component vary with the depth of anaesthesia
1. Time domain analysis: (t is on the x axis) - looks at burst suppression v time
o ↑depth of anaesthesia → ↑burst suppression - β wave activity
o ↑depth of anaesthesia → ↑β wave frequency 2. Frequency domain analysis: (frequency is on the x axis) - utilises Fourier analysis: each complex waveform can be broken down
into a series of sine waves that have different frequencies, amplitudes, and phases.
- Epoch (time interval packet) looks at the frequency / amplitude of the waves within that packet
o As ↑depth of anaesthesia → move from low frequency high amp → high freq low amp
o Need to average multiple epochs - Spectral edge frequency
o If a vertical line was drawn where 95% of the curve lay to the LEFT of it…this is the spectral edge frequency
3. Bispectral Analysis - looks at the phase relationships b/n difference frequencies
Entropy Slightly different Does frequency domain analyses Not good at looking at burst suppression analyses

By Amanda Diaz
ECG Electrocardiogram: external measurement of cardiac muscle potential Can be:
- 3 lead → Uses Eindhoven triangle, sum of vectors = 0 o Lead I: Neg ® arm; Pos (L) arm o Lead II: Neg ® arm; Pos (L) leg o Lead III: Neg (L) arm; Pos (L) leg
- 12 lead o Leads I, II, II o avR, avL, avF → vectors pointing outward o V1 – V6 → horizontally projected across anterior chest representing
regions of heart Lead II ECG
- P wave: atrial contraction - QRS: ventricular contraction - T wave: ventricular repolarisation
Intervals: - PR: beginning of P waves to start of QRS complex
o 0.12 – 0.2s o Measure of AV node conduction time o Prolonged: 1st, 2nd 3rd degree heart block; ↓T°C; Drugs (adenosine,
digoxin, Ca channel blocker, B blocker) o Shortened: Aberrant rhythms (re-entrant) WPW
- QRS interval: 0.12s o Measure of ventricular depolarisation o Widened: ventricular ectopic; ventricular Dysrhythmias (VT, VF,
torsades) - QT interval: beginning QRS → end of T wave
o Corrected for QTC = QT √R-R
o Normally ♂ < 0.4s; ♀ < 0.44s o Prolonged QT: inherited; aquired (↓Mg), Drugs: Class 1A anti-
arrhythmics (quinidine), Class III anti-arrhythmics (sotolol, amiodarone), TCA, cisapride, droperidol Risk torsades

Measurement
By Amanda Diaz
Electronic Body Temperature measurement Negative coeff thermistor Pt resistance therm. Thermocouple MOA Wire will ΔR w/ΔT°C Pt wire will ΔR w/ΔT°C 2 dissimilar metals will
generate a potential difference α T°C
Measured by Current change Current change Voltage change Shape of graph
R v T°C: Negative exponential
R v T°C: Linear relationship
Junctional potential v T°C: Linear
Advantages Cheap; easy to use; flexible; accurate to ±0.1°C; continuous remote monitoring
Disadvantage Specialised equipment More expensive; slower response time

Measurement
By Amanda Diaz
MAKEUP: Briefly describe the principles and sources of error in the measurement of systemic arterial BP using an arterial line General: Invasive BP monitoring with use of an intra-arterial line is the most accurate means of obtaining continuous blood pressure monitoring Method: Constituents:
- Intra-arterial cannula connected via a column of saline to a diaphragm contained within the transducer
Method: - Diaphragm converts pressure from saline column to electrical signals via a
strain gauge → Wheatstone bridge (precisely measures small changes in resistance
o Arterial pressure waveform is produced from which systolic, diastolic and MAP can be shown
- Bag of heparinised saline (pressurised to above systolic BP) is continuously infused at 4ml/hr in order to prevent clotting of blood in cannula
Sources of Error Machine (static):
- Zero: Incorrect placement of transducer o Should be at level of right atrium → if above or below, will
incorrectly display reading (above heart → ↓BP reading; below → ↑BP reading)
o Open initially to atmosphere → zero → then open to Pt for transduction
- Calibration: not an issue with modern units - Gain: not an issue in modern units as corrected during production
o Needs adjustment so that output and input signals correlate Machine (dynamic):
- Resonance: Oscillation of the diaphragm / column of saline at its resonant frequency
o If resonant frequency <40Hz it will be within the freq range of BP waveforms (needs to be > 10th harmonic) → distortion of BP waveform
If HR range from 60 – 180 = 1 – 3 Hz Therefore, resonant freq (f0) of the arterial catheter / saline column should be above 30 Hz (10th harmonic)
Most arterial lines (calibrated on prodn) have f0 60 – 100 Hz o ↑Resonance freq by shorter, wider, stiffer cannula
- Damping coefficient: smooths out pressure waveform o Undamped = 0: oscillation around measured point o Optimal = 0.64
Advantages: min amplitude distortion; max freq response which ↓phase distortion (↑phase lag w/↑freq) → up to 10th harmonic

Measurement
By Amanda Diaz
o Overdamped = 1.0: no overshoot, however waveform slow to reflect changes
o Regardless of damping, MAP will be the same for an over- or underdamped system
- Damping also occurs during use of arterial line → o Overdamped: bubbles in catheter, too much tubing / taps
Patient: - Discomfort → movement will lead to ↑artefact - Damping: ↓transmission of BP waveform to reach diaphragm
o Thrombosis o Placement against wall of artery o Bubbles in saline column (act as air lock)

Measurement
By Amanda Diaz
MAKEUP: Describe how pulse oximetry works General: Pulse oximetry allows for continuous measurement of oxygen Hb saturation in a non-invasive way (can then derive an estimate for pO2)
- Loosely based on the Beer-Lambert Law o there is a logarithmic dependence between the amount of light
transmitted through a substance, its concentration as well as the distance the light must travel through that substance
How it works - Probe is placed on the finger
o One side contains 2 LEDs → one emitting red light (λ 660nm), the other infrared light (λ 940nm) OxyHb will absorb less red light and more infrared light than
deoxyHb - Radiation from each LED is alternately passed through the finger
o The amount of light transmitted through is detected on the other side of the finger by a photocell
o The diodes alternate rapidly (few hundred times a second) ON / OFF OFF / ON OFF / OFF
- The detected light is electronically processed o Only pulsatile absorbance is calculated (equivalent to AC) o Displayed as a pulse waveform and SaO2
- R value obtained R = AC660 / DC660 AC940 / DC940
- When R = 1, SaO2 = 85% Advantages
- Continuous recording - Non-invasive - Simple to interpret - Nil calibration required - Also gives indications of peripheral perfusion, HR
Limitations - Inaccurate SaO2 <85%
o No experimental data at saturations below this (ethics) - Can be inaccurate with ↓perfusion (↓BP, shock), change in skin colour
(↓T°C, shut-down), change in nail colour (acrylic nails, nail polish) - Abnormal Hb (carboxyHb, metHb) - Assumes only pulsatile movement is arterial
o Movement artefact a problem o Less accurate with arrythmias (AF)
Measurement
By Amanda Diaz
DYNAMIC COMPLIANCE Compliance = ΔV
ΔP - Is a measure of volume changes per unit pressure during the normal
respiratory cycle - Only points of no air movement are at end inspiration & end expiration
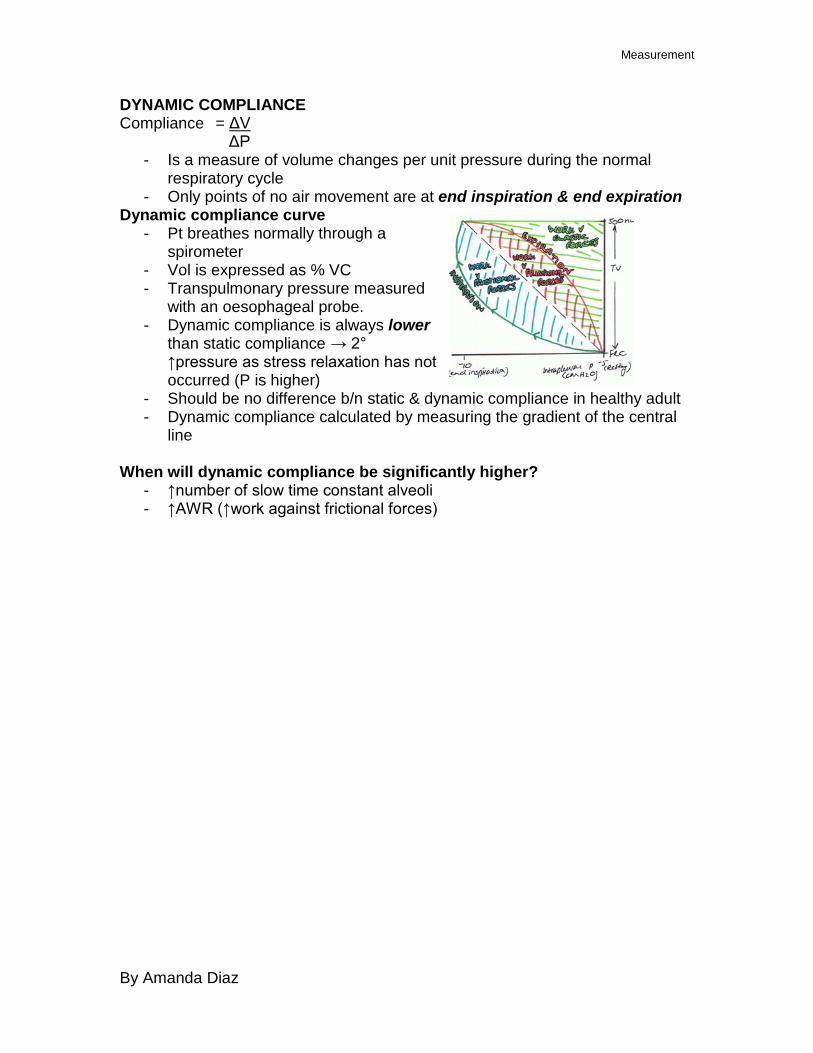
Dynamic compliance curve - Pt breathes normally through a
spirometer - Vol is expressed as % VC - Transpulmonary pressure measured
with an oesophageal probe. - Dynamic compliance is always lower
than static compliance → 2° ↑pressure as stress relaxation has not occurred (P is higher)
- Should be no difference b/n static & dynamic compliance in healthy adult - Dynamic compliance calculated by measuring the gradient of the central
line When will dynamic compliance be significantly higher?
- ↑number of slow time constant alveoli - ↑AWR (↑work against frictional forces)

Measurement
By Amanda Diaz
STATIC COMPLIANCE Compliance = ΔV
ΔP - Measure of distensibility - Measured at static points of volume held in order for equilibrium to be
reached throughout the lung. o Measures compliance 2° viscoelastic properties – takes into
account alveoli with slow time constants and stress relaxation - Static Compliance = 100 ml/cmH2O - Specific compliance = static compliance
FRC = 0.05 cmH2O-1 Compliance curve
- Generated by getting person to inspire fixed volumes and hold it against open glottis
o Muscle activity doesn’t change transpulmonary pressure - Alveolar P = atmospheric P (mouth) - Transpulmonary
pressure measured by an oesophageal probe
- Curve generated:
- Static compliance is the gradient of the inspiratory curve - Other significant features:
o FRC is at IPP -3cmH2O o Exhibits an hysteresis b/n inspiration / expiration
Cardiovascular
By Amanda Diaz
CARDIAC OUTPUT MEASUREMENT Invasive Fick Principle Q = Vo2 CaO2 – CvO2 1)Flow measured by calculating the arterio-venous conc gradient of an indicator of known mass added to arterial circuit 2)Thermodilution technique → known volume/T°C of substance rapidly injected into ® ventricle (for adequate mixing) → thermistor in pulmonary artery detects change in T°C - ΔT°C v time plotted. CO inversely proportional to AUC Sources of error: indicator loss; structural cardiac abnormalities; affected by PPV (esp if hypovol); damage to cardiac valves Aortic velocimetry - Doppler freq shift → velocity - Cross-sectional area Sources of error: Diameter aorta not measured directly; descending aorta value need apply correction to account for ascending aorta Arterial waveform analysis - Standard art line - Uses conservation of mass to calculate changes in pulse power - Change determined by SV (input of mass) & SVR (removal of mass) - Uses complex mathematical techniques to derive value Arterial waveform analysis w/Li indicator - detector in standard art line - Uses pulse power analysis - CO calculated w/modified Stewart-Hamilton equation ADV: can provide continuous measurement; less invasive than thermodiln Error: NDMR interfere w/Li sensitive electrode (cause baseline drift); irregular rhythm → arterial waveform → pulse power analysis difficult; damping of art line
Non-Invasive Oesophageal Doppler - Measurement of blood velocity in desc thoracic aorta -Wide beam US (45° to long axis) - Measure velocity by freq shift Calculate CO by: 1)Aorta cross-section (M mode US) x blood velocity = CO (+ correction factor) 2)Derive CO from nomogram correlating blood velocity / height / weight / age ADV: (2) has good agreement w/thermodiln; min invasive; intra-op use; quick DIS: not tolerated in conscious Pts; contraindicated in oesophageal pathology Suprasternal Doppler - Measured at sternal notch (ascending aorta) → °correction factor required ADV: non-invasive DIS: reliant on operator skill TOE - real time imaging of LV outflow tract - SV calculated w/analysis of velocity profile & aortic valve area ADV: correlates w/thermodiln DIS: operator dependent; intermittent Ax only Non-invasive arterial pressure analysis: -Volume-clamp method w/pressure cuff on finger -Aortic waveform computer-constructed -AUC correlates to SV → CO ADV: quick, non-invasive Error: Doesn’t correlate well w/thermodiln Pulmonary Gas Clearance -CO2 rebreathing technique -Measure ΔETCO2, estimation CaCO2 end cap → calculate pulm BF. Must correct for pulm shunt DIS: I&V Pts only Sources of Error: ↑CO2 prodn; spont vent; high CO states Bioimpedence -Apply small AC current across chest via topical electrodes -Current distributes 1° blood (high conductivity cf muscle, fat, air) -Pulsatile Δthoracic BF → Δimpedence. -Change during systole = CO derived

Cardiovascular
By Amanda Diaz
DIS: provides accurate data describing changes in CO only.

Measurement
O2 Analysis Spectrophotometric Analysis → measures SaO2
- Involve passing radiation through a sample & determining amount absorbed
o Wavelength specific for compound of interest - In accordance with Beer Lambert Law
o Amount of radiation absorbed is proportional to concentration of sample and distance for radiation to travel
- Oximeter o Calculates O2 saturation based on ratio of oxyHb to deoxyHb o Passes through blood sample light of different wavelengths;
detector plate on other side o Absorbance of oxyHb/deoxyHb are same at isobestic points
(600nm, 800nm) → must use light at different wavelength (660nm, 940nm) Lights switched on and off at high freq
o CO is not an issue if multiple wavelengths used
- Pulse Oximeter o Light from 2 (660nm, 940nm) LEDs passes
through finger → photocell on other side LEDs switch on and off @ high freq
o Microprocessor programmed to analyse changes of light during arterial pulsatile flow → ignores non-pulsatile venous flow / tissues
o Dis: CarboxyHb not compensated for (2 LEDs only); metHb reads as 85%; not accurate low SaO2; error with poor perfusion, pigmentation, nail polish
Clark electrode / polarographic electrode / oxygen Electrode → O2 tension
- Anode: Ag/AgCl - Cathode: Pt - Salt bridge: KCl - Voltage 0.6V applied across cell - Electrons from anode → cathode → taken up proportionate to
O2 present o Generates current → measured
- Can be used to transcutaneously measure in vivo O2 tension o Skin must be warmed to 43°C (issues with burns) o Electrode position must be changed every 3-6hrs o Less accurate than samples (skin O2 uptake); lag (skin flow behind
arterial change) o Continuous measurement
Fuel Cell → O2 tension - Anode: Pb - Cathode: Au - Salt bridge: KOH

Measurement
- Generates voltage proportional to O2 present o Temperature dependent → need to monitor with thermistor
Paramagnetic Analyser → O2 tension (Datex machines) - O2 is paramagnetic → attracted to magnetic field
o N2 and most other gases are diamagnetic → repelled from magnetic field
- 2° 2 unpaired electrons - Historically → dumbbell formation (2 dumbbells in non-uniform magnetic
field) o Filled with N2 o O2 around the spheres in a magnetic field will be attracted to it →
displace dumbbells - Nowadays → pulsed field paramagnetic analyser used
o No moving parts o Looks at pressure difference b/n 2 streams of gas (sample and
reference (air)) o Both pass at right angles through pulsed magnetic field (right hand
rule) When on O2 attracted into field → ↓pressure in vol of gas
(moves faster) o Detected by diaphragm deflection b/n 2 streams
-

Rotameter - Means of measuring anaesthetic gas flow - Bobbin within a conical shape tube - Suspended (& rotates) by flow of gas through tube
o Pressure across bobbin remains constant despite ΔFlow (↓resistance @ ↑flow) - How?
o Mixture of turbulent & laminar flow o Gas must be calibrated (density & viscosity are important)
Low flows → laminar flow (dependent on viscosity) High flow → turbulent (dependent on density)

Measurement
Strain Gauge (as in art line) - Transducer → changes energy from one form into another
o Pressure transducer → converts pressure change into electrical signal. Adv: easier to manipulate, record
Strain gauge - Wire (or semiconductor) attached to diaphragm
o Movement of diaphragm in response to pressure → change in stretch → change in resistance of wire. Measured / recorded as change in current flow
Wheatstone Bridge - Allows for precise measurements of change in resistance - Attached to pressure gauges as:
o Provides infinite gain (rather than 100 → 101; from 0 → 1 is infinitely larger)
o Amplifies the signal How? In its simplest form…
- Current supplied - Circuit has 2 parallel branches, connected by galvanometer (detects ΔV)
o Branch 1: R1, R2 are known o Branch 2: Rv (variable), Ru (unknown)
- The resistance of Rv is balanced (adjusted) until galvanometer = 0 o At this point: R1 = Rv
R2 Ru - And Ru can be derived.
More commonly… - 4 strain gauges make up the 4 resistances in the circuit - All 4 are exposed to deforming forces
o 2 are stretched o 2 are compressed
- Therefore, the degree of potential change is larger, amplifying the signal even more, and increasing the precision of the system
Uses - Arterial line - Thermistor