EXPERT REBUTTAL REPORT IN THE MATTER OF Moussouris v....
107
CONTAINS CONFIDENTIAL MATERIALS EXPERT REBUTTAL REPORT IN THE MATTER OF Moussouris v. Microsoft SUBMITTED BY: Henry S. Farber, Ph.D. February 9, 2018 214 Case 2:15-cv-01483-JLR Document 359-10 Filed 02/21/18 Page 2 of 108
Transcript of EXPERT REBUTTAL REPORT IN THE MATTER OF Moussouris v....

CONTAINS CONFIDENTIAL MATERIALS
EXPERT REBUTTAL REPORT IN THE MATTER OF Moussouris v. Microsoft
SUBMITTED BY:
Henry S. Farber, Ph.D.
February 9, 2018
214
Case 2:15-cv-01483-JLR Document 359-10 Filed 02/21/18 Page 2 of 108
TableofContents
I. SUMMARYOFCONCLUSIONS..........................................................................................2II. DATA......................................................................................................................................4III. DR.SAAD’SPREDICTEDPAYANALYSESAREFLAWED......................................6A. OmittedFixedEffects................................................................................................................6B. OtherTechnicalErrors.............................................................................................................8C. Analysisofpayvariationbysupervisor.............................................................................9D. AnalysisofpayvariationforNamedPlaintiff................................................................11
IV. DR.SAAD’SPREDICTEDPROMOTIONSANALYSESAREFLAWED...............12A. Dr.Saad’sanalysesof“businessjustification”aremeaningless.............................21B. Dr.Saad’sz-score“selectionpool”analysis....................................................................26C. Dr.Saad’sinclusionofStandardTitleinStockLevelanalyses................................30
V. DR.SAAD’SANALYSESOFPAYISFLAWED.............................................................32A. ItisinappropriatetoincludeStockLevelasacontrolvariableinapayregression............................................................................................................................................32B. DiscussionofModels1-3.......................................................................................................37C. DisaggregationbetweenITandEngineering.................................................................37D. GenderdifferencesbyDiscipline.......................................................................................38E. CareerStage..............................................................................................................................39F. Dr.Saad’sothercriticismsofpayanalysis......................................................................401. Parttimeworkandleavesofabsence..........................................................................................402. Patents........................................................................................................................................................413. Collegehiresversuslateralhires....................................................................................................414. BusinessProducts.................................................................................................................................43
VI. DR.SAAD’SANALYSISOFCENSUSDATA.............................................................45VII. CONCLUSION.................................................................................................................45
215
Case 2:15-cv-01483-JLR Document 359-10 Filed 02/21/18 Page 3 of 108
-2 -
CONTAINS CONFIDENTIAL MATERIALS
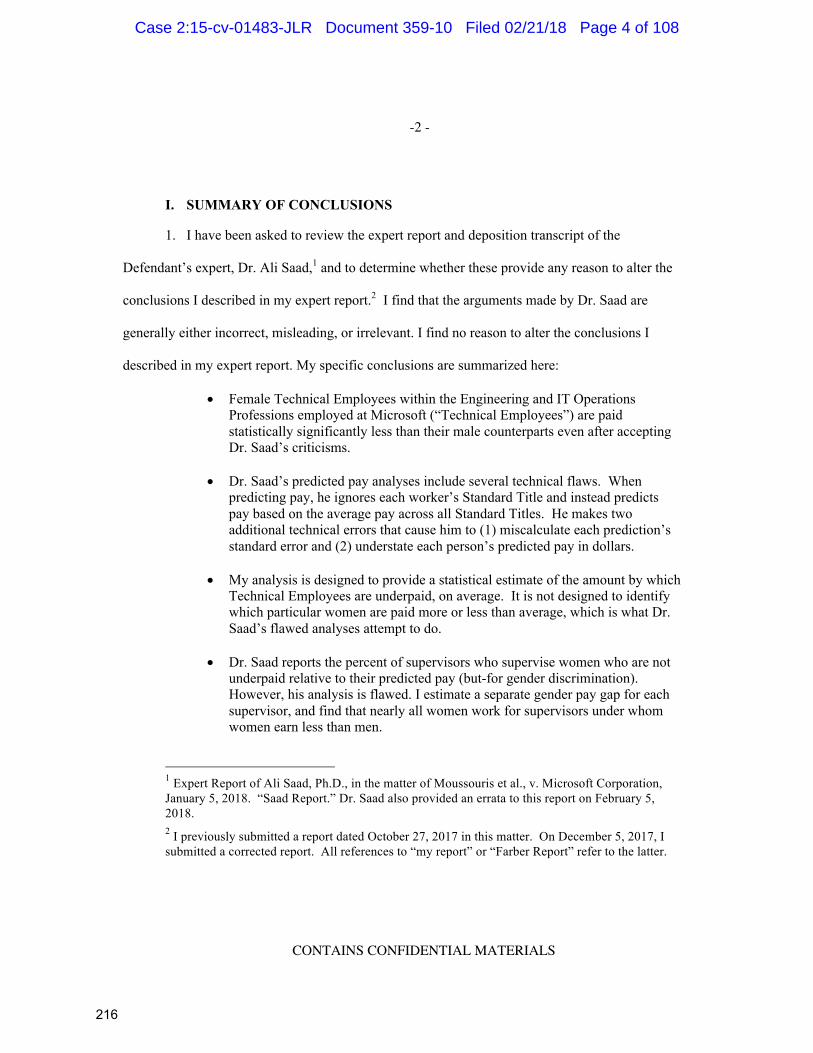
I. SUMMARY OF CONCLUSIONS
1. I have been asked to review the expert report and deposition transcript of the
Defendant’s expert, Dr. Ali Saad,1 and to determine whether these provide any reason to alter the
conclusions I described in my expert report.2 I find that the arguments made by Dr. Saad are
generally either incorrect, misleading, or irrelevant. I find no reason to alter the conclusions I
described in my expert report. My specific conclusions are summarized here:
• Female Technical Employees within the Engineering and IT Operations Professions employed at Microsoft (“Technical Employees”) are paid statistically significantly less than their male counterparts even after accepting Dr. Saad’s criticisms.
• Dr. Saad’s predicted pay analyses include several technical flaws. When predicting pay, he ignores each worker’s Standard Title and instead predicts pay based on the average pay across all Standard Titles. He makes two additional technical errors that cause him to (1) miscalculate each prediction’s standard error and (2) understate each person’s predicted pay in dollars.
• My analysis is designed to provide a statistical estimate of the amount by which
Technical Employees are underpaid, on average. It is not designed to identify which particular women are paid more or less than average, which is what Dr. Saad’s flawed analyses attempt to do.
• Dr. Saad reports the percent of supervisors who supervise women who are not
underpaid relative to their predicted pay (but-for gender discrimination). However, his analysis is flawed. I estimate a separate gender pay gap for each supervisor, and find that nearly all women work for supervisors under whom women earn less than men.
1 Expert Report of Ali Saad, Ph.D., in the matter of Moussouris et al., v. Microsoft Corporation, January 5, 2018. “Saad Report.” Dr. Saad also provided an errata to this report on February 5, 2018. 2 I previously submitted a report dated October 27, 2017 in this matter. On December 5, 2017, I submitted a corrected report. All references to “my report” or “Farber Report” refer to the latter.
216
Case 2:15-cv-01483-JLR Document 359-10 Filed 02/21/18 Page 4 of 108

-3 -
CONTAINS CONFIDENTIAL MATERIALS
• Dr. Saad’s asserts that Plaintiff Moussouris was not paid less than the amount he predicts. This ignores Plaintiffs’ claim that Ms. Moussouris (and others) was denied a promotion or promotions on the basis of her gender. I find that Ms. Moussouris was likely underpaid relative to the amount that she would have earned if she had been promoted.
• Dr. Saad also presents an analysis of actual versus predicted advancement rates
for each supervisor, but this analysis is not informative as to the behavior of any supervisor. I present an analysis that identifies a separate advancement rate for each supervisor, and show that 90% of class-member years are worked for supervisors under whom women are less likely than men to advance.
• Dr. Saad reports that the Named Plaintiffs and Declarants did not receive fewer
advancements than they “should have” received. This is based on an assertion that if an advancement was predicted with greater than 50% probability, then it “should have” happened, and if not, then it “should not have.” This is simply an incorrect inference and an incorrect use of statistical techniques.
• Dr. Saad divides Class Members in a number of ways that are not appropriate.
Likewise, Dr. Saad arbitrarily divides promotions into small date ranges (including one analysis where he looks at 14 time periods per year). It is inappropriate to divide the data into small groups essentially in order to find groups where there are not gender pay differences.
• Dr. Saad presents a “selection pool” model of promotions. In order to perform
this analysis, Dr. Saad has broken the data into tens of thousands of “pools.” The majority of these pools are comprised of only men (or only women), which render them useless for determining anything about the difference in promotion rates by gender.
• Dr. Saad presents an analysis of so-called promotion “velocity.” This analysis is based on a small sample of the data, and fails to control for important factors that are likely to influence the probability of a promotion.
• Dr. Saad wrongly claims that Stock Level is not pay band. Stock Level is an
inappropriate control variable in a pay regression.
• Dr. Saad’s analysis of Census data is not informative.
217
Case 2:15-cv-01483-JLR Document 359-10 Filed 02/21/18 Page 5 of 108

-4 -
CONTAINS CONFIDENTIAL MATERIALS
II. DATA
2. In my original report, I analyzed data provided by Microsoft that ran from January 1,
2010 through May 31, 2016. Microsoft had provided additional FY 2016 data on October 24,
2017, but these data were provided too late to be analyzed for my original report.3 Since filing my
original report, I have had an opportunity to review and analyze these data, and I will incorporate
them into this report.
3. Based on the instruction of counsel, I have also excluded observations in which the
employee was a “managers of managers” from the analyses throughout this report.4
observations ( among men and among women) refer to employee-years where the
worker was a manager of managers, and have been excluded.5
4. My original report indicated that there were 8,630 members of the compensation class,
who worked person-years, and 8,037 members of the advancement class, who worked a
total of person-years. After incorporating the new data for FY 2016 from Microsoft, and
excluding employee years where an individual was a manager of managers, these data identify
8,435 members of the compensation class, who worked total person-years, and 7,976
members of the advancement class, who worked total person-years. 90% of class-member
years are worked in Washington state, and 72% of class-members years are worked at Microsoft’s
Redmond, Washington headquarters.
3 See Farber Report at fn 4. 4 An observation is an employee-year. 5 I also exclude all employee-years where a worker is in Stock Levels 68 or higher. This exclusion was also in effect for my original report.
218
Case 2:15-cv-01483-JLR Document 359-10 Filed 02/21/18 Page 6 of 108

-5 -
CONTAINS CONFIDENTIAL MATERIALS
5. Dr. Saad describes my inclusion of data prior to the beginning of the class period as
“inexplicable,” and performs his analyses using data restricted to the class period.6 I have
included data prior to the class period because I understand that the class period is based on a
statute of limitations, not based on a claim that gender discrimination at Microsoft only began in
2012. Thus, data prior to 2012 has economically relevant information regarding the claim of
gender discrimination at Microsoft. I further understand based on instruction from counsel that
data prior to 2012 are legally relevant.
6. I have repeated the analyses from my original report using three alternative data sets,
one that includes data from January 1, 2010 through May 31, 2016, a second that includes data
from January 1, 2010 through August 31, 2016 and a third that is limited to the period from
September 1, 2012 though August 31, 2016, which roughly corresponds to the class period.7
These analyses are contained in Appendix 1.8 Tables 1A-8A and Figures 1A-3A in this report are
parallel to Tables 1-8 and Figures 1-3 from my original report, and cover the same time period
(January 1, 2010 through May 31, 2016).9 Tables 1B–8B and Figures 1B–3B in this report are
6 Saad Report at fn 11. 7 The class period begins on September 16, 2012. Many of Dr. Saad’s analyses begin on September 1, 2012. 8 In reconciling my advancement indicator with Microsoft’s promotions indicator, I have made a small change in the way that I defined “advancements” based on changes in Stock Level. I have based my advancement indicator on the last observed stock level in a given compensation year. Previously, I had based my advancement indicator on the first observed stock level in a given compensation year. The Stock Level advancement analyses in the Appendix tables and throughout the report reflect the updated advancement indicator. 9 These tables differ from those contained in my original report based on the manager of managers exclusion. In this and all following analyses, I have also excluded six employee-years where Microsoft’s payroll data indicate that (though the worker worked in the United States), he or she was paid in a currency other than U.S. Dollars.
219
Case 2:15-cv-01483-JLR Document 359-10 Filed 02/21/18 Page 7 of 108

-6 -
CONTAINS CONFIDENTIAL MATERIALS
parallel to Tables 1-8 and Figures 1-3 from my original report, but include data from January 1,
2010 through August 31, 2016, the last date for which Microsoft has provided payroll data.
Tables 1C – 8C and Figures 1C – 3C in this report are likewise parallel to Tables 1-8 and Figures
1-3 from my original report, but are restricted to September 1, 2012 through August 31 2016.
Each of these analyses excludes managers of managers.
7. There are only very minor differences between each of these sets of tables, which
indicates that my results are not sensitive to differences in which years of data I use. Throughout
the remainder of this report, unless otherwise specified, I will use the broadest time period of data
available to me: January 1, 2010 to August 31, 2016.
III. DR. SAAD’S PREDICTED PAY ANALYSES ARE FLAWED
8. Dr. Saad claims that my analysis (Model 5 of Table 3) shows that 33.7% of women
earned more than my model predicted that they would have earned if there were no gender pay
gap in 2015. Further, he asserts that for 5.9% of female technical employees at Microsoft in 2015,
this difference is statistically significant.10 However, not only does Dr. Saad misunderstand my
assignment and the purpose of my analysis, but his calculations are also performed incorrectly.
A. Omitted Fixed Effects
9. Dr. Saad describes his exercise in predicting pay for individuals as being based on
Model 5 of Table 3 of my report, with the exception of a control for gender.11 He describes this
10 Saad Report at ¶ 28. 11 He did not include gender as a control variable so that “predicted pay does not systematically separate men and women but instead models the impact their other non-gender characteristics have on pay.” (Saad Report at ¶ 25)
220
Case 2:15-cv-01483-JLR Document 359-10 Filed 02/21/18 Page 8 of 108

-7 -
CONTAINS CONFIDENTIAL MATERIALS
analysis as controlling for year, age (and its square), tenure at Microsoft (and tenure squared), the
state and city in which the employee works, their pay scale type, performance rating, discipline,
and Standard Title.12 However, when Dr. Saad calculates but-for compensation for the purposes
of this comparison with actual pay, he mistakenly omits the standard title fixed effects.13 In effect,
Dr. Saad’s calculation essentially assumes that, in the but-for world, workers in each standard title
receive the same average compensation, assuming all other variables are fixed. This introduces a
great deal of noise into Dr. Saad’s calculations. Consider the case of Plaintiff’s declarant Ms.
Sowinska, who earned in compensation year 2015. Dr. Saad calculates her predicted
compensation but-for gender discrimination (purportedly based on my Model 5) as ,14
whereas he would have calculated if he had used my whole model including the standard
title fixed effects (as well as correcting for the “smearing factor,” discussed below). In other
words, if Dr. Saad had actually implemented my model, including Standard Title fixed effects, he
would have found that Ms. Sowinska’s actual pay was below her predicted pay but-for gender
discrimination. This is because by ignoring Standard Title fixed effects, Dr. Saad has predicted
Ms. Sowinska’s pay (and indeed, all women’s pay) assuming that she earns the average of what all
Technical Employees in all positions earn (after controlling for age and other human capital
factors).
12 Saad report at ¶ 23 13 In Stata, the computer program that Dr. Saad used to perform this analysis, the built-in command that he used to calculate his but-for compensation excludes fixed effects by default. See Stata 15 documentation for –areg postestimation-. 14 If Dr. Saad were to calculate Ms. Sowinska’s predicted but-for compensation using my updated sample, which excludes employee-years where workers are managers of managers, Dr. Saad’s prediction method would yield a lower predicted but-for compensation of .
221
Case 2:15-cv-01483-JLR Document 359-10 Filed 02/21/18 Page 9 of 108

-8 -
CONTAINS CONFIDENTIAL MATERIALS
B. Other Technical Errors
10. In addition to excluding fixed effects, Dr. Saad made two additional technical errors in
his calculation. Dr. Saad’s first error is that he incorrectly calculates the standardized residual that
he uses to test for statistical significance. Just as he improperly ignores standard-title fixed effects
in his prediction of but-for compensation, he improperly includes standard-title fixed effects in his
computation of the standardized residuals. That is, he treats standard-title fixed effects as if they
were a part of the error term, which is simply wrong; these fixed effects are part of the explained
variation, not part of the unexplained residual.15
11. Additionally, in predicting pay, Dr. Saad has made a mathematical error that causes
him to systematically underestimate the but-for pay implied by my model. This error is that he
failed to account for the “smearing factor,” which is necessary when using estimates of a natural
log model of pay to predict the dollar amount of pay.16
12. These technical errors notwithstanding, Dr. Saad also misinterprets my assignment. As
described in my original report, my assignment was to study whether there is “statistical evidence
of (1) discrimination in compensation between male and female Technical Employees in Stock
Levels 59-67, and (2) discrimination in Stock Level or Career Stage advancement rates between 15 The built-in command that Dr. Saad uses to predict standardized residuals is proper when used after a regression performed by the command –reg- but is not proper when used after the command –areg- command that Dr. Saad employed. 16 My regression model directly predicts the natural logarithm (“log”) of total compensation rather than compensation in dollar terms, as is the standard practice in labor economics. Transforming the natural log into dollar terms will systematically underestimate predicted total compensation in dollars unless multiplied by what is referred to as a “smearing factor.” Dr. Saad does not apply any smearing factor. I have used the basic Duan smearing estimate in my investigation of Dr. Saad’s analysis. See Duan, Naihua, “Smearing Estimate: A Nonparametric Retransformation Model.” Journal of the American Statistical Association., Volume 78, No. 383 (September 1983), pp. 605-610.
222
Case 2:15-cv-01483-JLR Document 359-10 Filed 02/21/18 Page 10 of 108
-9 -
CONTAINS CONFIDENTIAL MATERIALS
male and female Technical Employees in Stock Levels 59-64.”17 My analysis is designed to
provide a statistical estimate of the amount by which female Technical Employees at Microsoft are
underpaid, on average. It is not designed to identify which particular women are paid more or less
than average (after controlling for various factors), which is what Dr. Saad’s analyses attempt to
do. Any statistical estimate is going to contain some amount of unexplained variation (captured in
the error term of the regression). This term may be negative (indicating that the person is paid less
than the model would predict given her characteristics) or positive (indicating the opposite). In
performing this predicted pay analysis, Dr. Saad has ignored this feature of all regression models
and has assumed each individual’s unexplained variation in pay does not apply in the but-for
world. This is incorrect.
C. Analysis of pay variation by supervisor
13. Dr. Saad argues that I did not take into account variation among supervisors.18 As an
attempt to measure this variation, Dr. Saad presents a series of pie charts that purport to show the
proportion of supervisors (at various levels in the supervisory hierarchy) who supervise (1) women
who all have a non-significant difference in actual and but-for predicted pay; (2) an equal number
of women who earn statistically significantly more than predicted and statistically significantly
less than predicted; (3) more women who earn statistically significantly more than the but-for
prediction; (4) or more women who earn statistically significantly less than the but-for prediction.
17 Farber Report at ¶ 4. 18 Saad Report at ¶ 30.
223
Case 2:15-cv-01483-JLR Document 359-10 Filed 02/21/18 Page 11 of 108

-10 -
CONTAINS CONFIDENTIAL MATERIALS
This is done for Level 2, 3, and 4 supervisors for 2015.19 Dr. Saad does not present these figures
for Level 1 supervisors, which is the top of the supervisory hierarchy provided by Microsoft.
14. These charts are created using Dr. Saad’s flawed predictions of but-for pay. Namely,
he did not control for standard title fixed effects, he did not correctly compute the standardized
residual, and he ignored the “smearing factor” when transforming log pay into levels of pay.
These flaws render this analysis unreliable.
15. Furthermore, Dr. Saad’s analyses focus on the count of supervisors, not the women
who they supervise. That is, the size of each “slice” of these pie charts is not scaled by the number
of class members (or even by the number of all employees), but rather is scaled by a count of
supervisors. Dr. Saad notes that “Level 2 supervisors can supervise anywhere from 1 to almost
3,000 technical employees in the data that I have….Level 3 supervisors can supervise anywhere
from 1 to 1,065 employees in the data…[and] Level 4 supervisors…supervise from 1 to over 600
employees in the data.”20 Because he has not adjusted for the number of female employees who
work under each supervisor, the pie charts on pages 26 and 27 of Dr. Saad’s report give equal
weight to supervisors who supervise 10 employees as it does to supervisors who supervise
thousands. As a result, these pie charts are misleading about the number of affected women.
16. Technical errors notwithstanding, Dr. Saad’s analysis is not informative to answer the
question of whether certain supervisors tend to underpay women. In order to answer this question,
it is possible to identify a separate gender pay gap for each supervisor. I have performed the
analyses described as Model 4 and Model 5 in my original report, with one change: instead of 19 Saad Report at ¶ 35 and Figures on pages 27-28 20 Saad Report at ¶ 33.
224
Case 2:15-cv-01483-JLR Document 359-10 Filed 02/21/18 Page 12 of 108
-11 -
CONTAINS CONFIDENTIAL MATERIALS
calculating a single gender effect, I calculate a separate gender effect for each Level 1 supervisor.
I present the results of this analysis in Table 1. In any year during the class period,21 more than
98% of class members report to one of 4 Level 1 supervisors.22 The analyses reported in Table 1
demonstrate that virtually all woman years (more than 99%) are worked under Level 1 supervisors
under whom women earn less than men, on average, after controlling for the factors in the model.
This average pay difference is statistically significant for Level 1 supervisors representing
approximately 98% (Model 4) or 99% (Model 5) of woman years.
D. Analysis of pay variation for Named Plaintiff
17. Dr. Saad also discusses Plaintiff Moussouris at length and concludes that she is paid
more than her predicted compensation and is therefore uninjured.23 In addition to the technical
issues discussed above, Dr. Saad’s analysis ignores Plaintiffs’ claim that Ms. Moussouris was
denied a promotion or promotions based on her gender In 2012 and 2013, Ms. Moussouris had the
title of “Senior Program Manager.” In 2014, Ms. Moussouris had the title of “Senior PM
Manager.” In both of these positions, she was in Stock Level 64. The most common promotion
from a Level 64 “Senior Program Manager” is to a Level 65 “Principal Program Manager,” and
the most common promotion from a Level 64 “Senior PM Manager” is to a Level 65 “Principal
21 During the class period, the supervisor hierarchy is available for compensation years 2014-2016, but not for 2013. 22 All women in my analysis work for one of ten Level 1 supervisors. 23 Saad Report at ¶¶ 40-42. I have limited my attention to Ms. Moussouris in this paragraph based on Dr. Saad’s report.
225
Case 2:15-cv-01483-JLR Document 359-10 Filed 02/21/18 Page 13 of 108
-12 -
CONTAINS CONFIDENTIAL MATERIALS
PM Manager.”24 Table 2 presents Ms. Moussouris’ actual pay and her predicted but-for pay
(based on the corrections to Saad’s prediction method of my model, as described in paragraphs 9-
12 above), had she had the most-common promotion from her actual job title. In each year, Ms.
Moussouris received lower compensation than my model predicts that she would have, had she
received the most-common promotion from her position. Insofar as all class members are subject
to discrimination in promotion, similar considerations apply to their pay predictions as well. 25
IV. DR. SAAD’S PREDICTED PROMOTIONS ANALYSES ARE FLAWED
18. Dr. Saad presents a comparison of actual versus predicted promotion rates by
supervisor.26 Dr. Saad treats the predicted promotion rate for a supervisor as a rate that is not
subject to any variation, which is not true. Predictions (by their nature) include a degree of
uncertainty in their estimation, which Dr. Saad ignores. Furthermore, as with Dr. Saad’s analysis
of gender pay discrepancy by supervisor, Dr. Saad has misunderstood the purpose of my analysis,
which is to measure the difference in promotion rates between men and women and see if there is
statistical evidence of gender disparity in advancement rates.
19. As with his analysis of pay by supervisor, Dr. Saad’s analysis of advancement by
supervisor is not informative to answer the question of whether certain supervisors tend to
24 For the purposes of finding the most common promotion, I searched for the most common standard title associated with an increase in Stock Level from Ms. Moussouris’ actual standard title and Stock Level. 25 I have performed this analysis for only Ms. Moussouris (and not any other class members), based on Saad’s specific criticisms regarding Ms. Moussouris. More broadly, Plaintiffs claim that female Technical Employees at Microsoft are discriminated against with respect to promotions, and I do find that women are less likely to advance (whether measured as an increase in Stock Level or Career Stage) than men. 26 Saad Report at pp. 33-36.
226
Case 2:15-cv-01483-JLR Document 359-10 Filed 02/21/18 Page 14 of 108
-13 -
CONTAINS CONFIDENTIAL MATERIALS
disadvantage women with respect to advancements. I can identify a separate gender advancement
gap for each supervisor. I have performed the advancement analyses described in my original
report adding a separate gender effect for each supervisor. I do this separately for each Level 1
supervisor. I present the results of this analysis in Table 3. Among female Technical Employees,
approximately 90% of woman-years are worked for Level 1 supervisors who under-advance
women, and the difference in advancement rate is negative and statistically significant for
supervisors who supervise 89% of woman-years.
20. Dr. Saad compares “predicted” and actual advancements among Named Plaintiffs and
declarants but his analysis is deeply flawed. As with the pay analysis above, Dr. Saad has
assumed that the point estimates generated for each Named Plaintiff or Declarant are exactly true,
and he ignores the variation in these predictions.
21. Troublingly, Dr. Saad’s analysis assumes that if the predicted probability of
advancement for a particular worker in a particular year is greater than 50%, then that
advancement “should have occurred,” and implicitly assumes that any person-year where the
predicted probability of advancement is less than 50%, then that is an advancement that should not
have occurred.27 This method of identifying advancements that “should have occurred” is based
on a fundamental misunderstanding of probabilities.
22. Consider the following hypothetical example. Imagine that there are 4 workers, all of
whom are identical and equally qualified for an advancement, or promotion. Exactly one of the
four will be promoted (and the other three will not) so that each of these workers has a 25%
27 Saad Report at ¶ 49.
227
Case 2:15-cv-01483-JLR Document 359-10 Filed 02/21/18 Page 15 of 108

-14 -
CONTAINS CONFIDENTIAL MATERIALS
probability of promotion. Among these four workers, I would predict that one promotion should
occur. Dr. Saad’s method of identifying promotions that “should have occurred” will identify zero
promotions that should have occurred, even though one out of the four workers will be promoted
(as I predicted). As another example, consider a case where three individuals (perhaps out of a
larger pool) each have a 2/3 chance of promotion, and out of this group of three workers, two are
in fact promoted. Note that the predicted number of promotions for this group is two (because
3*2/3 = 2). Dr. Saad’s method, however, would predict that each of these workers should have
been promoted, and would calculate a promotion shortfall of one, even though the predicted
number of promotions and actual number of promotions are exactly the same.
23. In Row 1 of Table 4, I present the number of advancements that actually occurred
(separately by gender, and overall). In Row 2 of Table 4, I present the number of advancements
that Dr. Saad believes “should have occurred” based on his assertion that any advancement that
was predicted to occur with greater than 50% probability “should have occurred” (and by
extension, any advancement that was predicted to occur with less than 50% probability should not
have happened). Dr. Saad’s count of advancements that “should have occurred” is 23,379,
whereas 40,812 advancements actually did occur. Dr. Saad’s “should have occurred”
advancement prediction rule predicts less than 60% of the actual number of advancements.
24. The appropriate approach to calculate the advancement shortfall, as I present in my
original report, is to sum up the predicted probability of advancement across the entire class, and
to compare that to the number of female advancements that actually occurred.28
28 Farber Report at ¶¶ 72-77.
228
Case 2:15-cv-01483-JLR Document 359-10 Filed 02/21/18 Page 16 of 108

-15 -
CONTAINS CONFIDENTIAL MATERIALS
25. Dr. Saad criticizes the use of the advancement indicator that I constructed based on
changes in Stock Levels. This advancement indicator compared an employee’s Stock Level in a
compensation year t+1 to the stock level in the compensation year t. I repeat my analysis using
the Microsoft-provided promotions indicator.29 The results of my analysis are presented in Table
5. In footnote 76 of his report Dr. Saad admits that the “proportion of promotions that go to
women is virtually identical under the two definitions.” It is not surprising therefore that I find
largely similar results using either measure of Stock Level advancement—women are about 2.1
percentage points less likely than men to advance using the Stock Level advancement indicator I
previously defined, and they are about 2.4 percentage points less likely than men to advance using
the Microsoft-provided promotions indicator. In addition, in my original report I also considered
an alternative definition of advancement: an increase in Career Stage. Whether I use advancement
indicators (based on either advancement in stock level or advancement in career stage) or the
Microsoft-provided promotion variable, my conclusion remains unchanged – women advance at
lower rates than men based on each of these measures of advancement.
26. Dr. Saad argues that I should have examined IT Operations and Engineering
promotions separately. However, doing so ignores the fact that it is possible for workers to move
back and forth between these two Professions (as Plaintiff Muenchow did in 2016, when she
moved from IT Program Manager in the IT Operations Profession to Senior Program Manager in
the Engineering Profession). In all, I observe approximately 800 advancements that also include
workers moving between Professions, mostly from IT Operations to Engineering, and
29 This variable is provided by Microsoft and indicates an increase in Stock Level, which Microsoft terms a “promotion.”
229
Case 2:15-cv-01483-JLR Document 359-10 Filed 02/21/18 Page 17 of 108
-16 -
CONTAINS CONFIDENTIAL MATERIALS
approximately 25% of all advancements among workers in the IT Operations Profession include a
move to the Engineering Profession. Further, approximately 61% of individuals who ever worked
in the IT Operations Profession (during the period January 1, 2010 to August 31, 2016) also
worked in the Engineering Profession at some point during the same period.30
27. Lastly, note that my advancement analysis controls for Discipline, which is a finer
categorization than Profession, so that controlling for Discipline also serves to control for
Profession. Because examining IT Operations and Engineering separately ignores the possibility
(and reality) of advancements and other movement between these two Professions, and because I
do control for each of these Professions, I reject Dr. Saad’s assertion that it is inappropriate to
consider them jointly.
28. Dr. Saad additionally argues that I should have included time in stock level and
standard title, not time at Microsoft as the tenure variable in this analysis. However, time in Stock
Level is a variable that is based on prior advancement decisions. Based on the plaintiffs’ claim
(and my findings) that women are less likely to advance than men, and are under-leveled relative
to men, women will tend to have longer time in Stock Level than men, all else equal. This is a
natural consequence of women having lower Stock Level advancement rates than men.
Therefore, inclusion of time in Stock Level (or time in Standard Title) will introduce bias into my
30 Saad claims that only 4.3% of employees transfer between professions. His analysis misses some transfers because he ignores pre-class period data, and misses some transfers because he only looks at the annualized data, which obscures some transfers, whereas I make my calculation based on the underlying data. I find that 8.5% of employees (4,883 individuals) work in both IT Operations and Engineering at some point in the discovery period. Put another way, 61% of people who ever worked in IT Operations also worked in Engineering at some point during the discovery period.
230
Case 2:15-cv-01483-JLR Document 359-10 Filed 02/21/18 Page 18 of 108

-17 -
CONTAINS CONFIDENTIAL MATERIALS
analysis.31 Despite these considerations, I re-estimated my advancement models, presented in
Table 5, including time at relevant level and its square (in addition to other tenure variables
previously included in my analysis). These results are presented in Table 6. Comparing the
results in Row A of Tables 5 and 6 show that the marginal effect (i.e.. the gender difference in the
probability of advancement in stock level) falls from about 2.1 percentage points to about 1.7
percentage points when controlling for time in Stock Level and remains statistically significant.
Comparing the results of Row B of Tables 5 and 6 show that after controlling for time in Stock
Level, the marginal effect increases slightly, from 2.4 percentage points to 2.7 percentage points. I
make a parallel change to my analysis of the promotions based on change in Career Stage. I
include time in Career Stage and time in Career Stage squared in addition to other tenure variables
previously included in my analysis. These results are presented in Rows C and D in Table 6. After
controlling for time in Career Stage, I continue to find that women are less likely to be promoted
than men, and this difference is statistically significant.
29. Dr. Saad also argues that I should have examined in- and out-of-cycle advancements
separately. His argument is twofold: first, advancements at different times of year may be subject
to different annual budgets; and second that I have ignored performance review timing.
30. There is no principled reason to divide advancements based on whether they are given
in September or during a different time of year. As a labor economist, the standard method of
analyzing advancements is to examine advancements that occur over a fixed period of time,
31 I have not performed an analysis that includes time in Standard Title as a control, as I believe that it is inappropriate to control for Standard Title when doing analyses gender differences in Stock Level. In particular, because each Standard Title typically spans only a small number of Stock Levels, including Standard Title will over-explain the variance in the model.
231
Case 2:15-cv-01483-JLR Document 359-10 Filed 02/21/18 Page 19 of 108
-18 -
CONTAINS CONFIDENTIAL MATERIALS
commonly over a particular year. Dr. Saad is merely subdividing the available data into smaller
portions, and it is unsurprising that by subdividing the available data in this manner, he is able to
construct groups with no advancements gap.
31. Notably, even after artificially dividing advancements based on time of year, Dr. Saad
still finds a shortfall for women among out-of-cycle advancements (i.e. those that happen at any
time of year other than September 1). Dr. Saad asserts that these non-September advancements
are not connected with the annual performance review process, and suggests that perhaps there are
other, unspecified data and factors that I should have controlled for (beyond the performance
review information, tenure at Microsoft, age, Stock Level prior to advancement, Discipline,
location, and compensation year).32 Note also that in paragraph 102 of his report, Dr. Saad argues
that I have paired off-cycle (non-September 1) advancements with the wrong annual review, but in
paragraph 106, he claims that off-cycle advancements have no connection to the annual review
process.
32. Dr. Saad argues that by combining advancements that occur at different times of the
year, I have mismatched performance ratings and advancement decisions for mid-year and other
advancements.33 He goes on to argue that “at the time mid-year promotions decisions are made
(mid-fiscal year), the end-of-fiscal-year performance review cycle has not yet been completed.
Therefore, the only official information that would be available to decision-makers regarding
performance ratings would be from the prior year.”34 While it may be the case, as Dr. Saad
32 Saad Report at ¶ 106. 33 Saad Report at ¶ 102. 34 Saad Report at ¶ 102, bolded emphasis added, italic emphasis in original.
232
Case 2:15-cv-01483-JLR Document 359-10 Filed 02/21/18 Page 20 of 108

-19 -
CONTAINS CONFIDENTIAL MATERIALS
writes, that this is the only official information available to decision-makers regarding off-cycle
advancements (depending on the timing of said advancement), the employee’s managers may have
additional information about that employee’s performance that will eventually appear in the
performance review, even if it has not yet as of the day of the advancement. For example, if an
individual is being considered for advancement in May of 2015, the performance review for that
year is incomplete, but has likely begun.35 More importantly, however, the employee’s manager
has an idea of his or her performance and skills, both as an absolute matter and relative to other
comparable individuals. Furthermore, Dr. Saad’s analysis likely mis-matches some performance
reviews: for advancements that happen between the end of the performance review cycle (which
closes to managers at the end of July) and September 1, managers would have “official”
performance review data, but Dr. Saad ignores these data and uses only the previous year’s
performance reviews.36 Nevertheless, based on Dr. Saad’s suggestion that the prior year’s
performance reviews may be relevant for some employees who are advanced outside of September
of a particular year, I have added controls for each employee’s performance review outcomes for
the prior year. This allows me to control for performance reviews in the recent past as well as the
current year, both of which may influence the probability of advancement. The results of this
analysis, which include both current and one-year lagged performance reviews, are presented in
35 Johnson Declaration at ¶ 6. Ritchie Ex. 21 also explains that in the performance system in use beginning in 2014, “Connects,” which are periodic review meetings between an employee and his or her manager, are not pegged to a rigid time schedule like mid-year check-ins and annual reviews. 36 Johnson Declaration at ¶ 6. Ritchie Tr. 458:9-10 (“Our annual rewards process takes place on September 1”); Johnson Decl. ¶ 5 (“The annual rewards cycle begins on May 1st of each year.”).
233
Case 2:15-cv-01483-JLR Document 359-10 Filed 02/21/18 Page 21 of 108

-20 -
CONTAINS CONFIDENTIAL MATERIALS
Table 7. After adding additional controls for prior performance reviews, I continue to find the
gender difference in the probability of advancement of about 2.1 percentage points, a difference
which is statistically significant.
33. I also performed a version of my shortfall analysis based on the model that includes
current and lagged performance reviews. I present the results of this analysis in Table 8. I find that
the advancement shortfall for women in stock level 59 through 64 between January 1, 2010
through August 31, 2016 is equal to 534. These results are similar to those reported in Table 7B in
Appendix 1 (which did not control for lagged performance reviews but is otherwise identical to
this analysis).
34. In short, Dr. Saad’s attempts to disaggregate advancements based on the time of year in
which they occur distract from the fact that women at Microsoft advance at lower rates than men.
35. Dr. Saad concludes that off-cycle (non-September 1) promotion justifications are
“equally thorough” relative to in-cycle promotion justifications based on an exercise where he
compared the number of words in in- and out-of-cycle promotion justification comments.37 There
is no foundation in economics of which I am aware regarding any relationship between word
counts and the thoroughness of promotion review processes. In addition to counting the number
of words in promotion comments, Dr. Saad has also attempted to identify promotions as either
based on “business need justifications” or not. I discuss this below.
37 Saad Report at ¶ 92.
234
Case 2:15-cv-01483-JLR Document 359-10 Filed 02/21/18 Page 22 of 108

-21 -
CONTAINS CONFIDENTIAL MATERIALS
A. Dr. Saad’s analyses of “business justification” are meaningless
36. Dr. Saad concluded that out-of-cycle promotions (where he finds gender bias) were
more likely to be based on “idiosyncratic ‘business need’ justifications” than during on-cycle
reviews. I do not see how this observation is relevant to an analysis of gender discrimination in
advancement. In any case, this analysis upon which this conclusion is based is so flawed as to be
completely useless. On a conceptual level, this analysis is flawed because he has identified a
small number of concepts as being “initiated for business reasons (e.g. expected product growth or
retention concerns),” he identifies others as being based on the “individual characteristics of the
promotee (e.g. personal skills and accomplishments).”38 This is an arbitrary division. The non-
“business reason” justifications that Saad identified are business justifications—promotions based
on an employee’s personal skills and accomplishments are promotions based on an employee’s
ability to fit into a particular role, or based on a need to avoid retention problems from not
promoting high-achieving workers.
37. In addition to this arbitrary and meaningless division of promotions into “business
need” versus “non-business need,” Dr. Saad does an extremely poor job of identifying “business
needs” justifications based on the criteria he attempted to establish.
38. Dr. Saad created a list of 229 particular words or phrases (known as “strings”), and
then used a computer program to search through tens of thousands of promotion comments for
exact matches for these strings, including spelling and punctuation. Some of these strings are
relatively simple (e.g. “business need”), and may appear in that exact form in many records.
38 Saad Report at ¶ 108.
235
Case 2:15-cv-01483-JLR Document 359-10 Filed 02/21/18 Page 23 of 108

-22 -
CONTAINS CONFIDENTIAL MATERIALS
Others are somewhat more complicated: Dr. Saad searches for the term “need:” which, though it
consists of a single word, will only identify a record as a business need if it includes the colon
after the word “need”. Dr. Saad does not explain why he thinks that the word “need” standing
alone does not indicate a business need justification, but the same word followed by a colon does.
Many strings are extremely complicated: Dr. Saad searches for the term “dsp team has the need
for senior software engineers”. In order for this term to identify a promotion comment as being
based on “business needs,” the promotion comment would need to include this exact string. This
issue is discussed at greater length in paragraph 40, below.
39. Below find a list of examples of problems with his analysis, though this is by no means
exhaustive.
• Dr. Saad identified the phrases “there is need” and “there is a need” as indicative
of business justification. However, the very similar phrase “there’s a need” is not
identified by Dr. Saad as being indicative of a business justification. The phrase
“there’s a need” appears multiple times in promotion justification comments that
Dr. Saad has identified as being not based on business needs.39 Dr. Saad does not
39 Dr. Saad identifies the promotion of Personnel Number 152199 as based on a business need based on a comment that includes
In contrast, Dr. Saad identified the promotion of Personnel Number 367072 as not based on a business need, based on a promotion justification comment that includes
236
Case 2:15-cv-01483-JLR Document 359-10 Filed 02/21/18 Page 24 of 108
-23 -
CONTAINS CONFIDENTIAL MATERIALS
explain why the phrase “there is a need” indicates a business need justification, but
the phrase “there’s a need” does not.
• Though one of the enumerated “business needs justifications” Dr. Saad cites is
retention of employees who receive outside job offers, Dr. Saad only searched for
two strings that contained the names of two likely competitor firms:
Dr. Saad suggested that searching for the phrases
“competitive offer” or “received offer” would be likely to identify competing
offers from rival firms.40 However, Dr. Saad did not search for either of these
terms.41
• Dr. Saad testified that it would be “quite a surprise if the phrase “competitive
offer” and the word “retain” were not always together.”42 The word “retain”
appears without the phrase “competitive offer” in 198 promotion comments. Of
these, almost exactly half (101) are identified as promotions that are not based on
business needs, while the rest (97) are identified as promotions that are based on
business needs.
40. Dr. Saad testified that he based his list of 229 strings on a randomly-selected sample of
1000 promotion justification comments. He testified that he then selected particular phrases that
40 Deposition of Ali Saad, Ph.D., January 30, 2018 (“Saad Tr.”) at 39:16-19 41 At his deposition, after being asked whether he searched for either “competitive offer” and “received offer” Dr. Saad argued that because he had searched for the term “offer” these phrases would be captured anyway. Dr. Saad did not search for the term “offer.” See Saad Tr. at 47:17-22. 42 Saad Tr. at 46:25-47:2. He based this statement on “an inference based on having looked at hundreds of these things. Saad Tr. at 47:4-7.
237
Case 2:15-cv-01483-JLR Document 359-10 Filed 02/21/18 Page 25 of 108
-24 -
CONTAINS CONFIDENTIAL MATERIALS
appeared in these comments, and used those phrases to have a computer program identify other
“business needs” elsewhere. Dr. Saad apparently did very little analysis or checking to ensure that
these strings were well-suited to identifying “business needs” outside of the small sample on
which he trained his list. Many of the strings for which Dr. Saad searches are extremely specific.
For example, Dr. Saad searches for the strings “the need to have a strong senior ic band grows
with it”; “key to keeping Bing Ads Private Lab infastructure running ";43 and "the level of
complexity in that space requires a senior level pm”. Complex strings such as these are so
narrowly tailored to the “training” random sample that they are capable of identifying no more
than one promotion as being based on “business needs.” However, Dr. Saad attempts to extract
information from the larger promotions data set based on these very narrowly tailored strings, and
fails to do so. In fact, of the 229 strings selected by Dr. Saad, 111—nearly half—identify exactly
one promotion comment as a business justification. Presumably in these cases, the identified
comment is a record from Dr. Saad’s small random sample.
41. Furthermore, Dr. Saad did not produce the random sample on which he purported to
base his string search list until partway through his deposition on January 30, 2018. 44 Based on a
review of this sample, I do not see how Dr. Saad could have derived the list of strings that appear
in his BN_Dictionary.R file (the file that contains the strings he ultimately searches for in the
promotion justifications) from this random sample. There are many strings in the
BN_Dictionary.R file that are not found in the random sample Dr. Saad provided on January 30, 43 The misspelling of “infrastructure” appears in Dr. Saad’s code, but apparently does not appear in any promotion justification comment, as this string identifies zero promotions as based on “business needs.” 44 This file is called “MRT Sample 1000.csv”
238
Case 2:15-cv-01483-JLR Document 359-10 Filed 02/21/18 Page 26 of 108
-25 -
CONTAINS CONFIDENTIAL MATERIALS
2018. 45 In addition to the broader concerns about this analysis outlined above, I have no
understanding of the source of many of the strings from BN_Dictionary.R, and I cannot evaluate
the accuracy of the analysis Dr. Saad performed.
42. At his deposition, Dr. Saad claimed that the purpose of this analysis was to identify a
“sufficiently large” number of business reasons and compare them between September and non-
September promotions. He testified that it is “not an issue for me and did not concern me” whether
he had identified too many or too few promotions as being based on business justifications.46 In
spite of the fact that Dr. Saad made no attempt to measure or understand the error rates in this
categorization, he “could say probably with certainty that the relationship between the annual
review and other times of the year with respect to the incidents of business justification would not
be changed by any other sort of search you would do.”47 It is not standard statistical or
econometric practice to ignore serious errors in an analysis and assert “probably with certainty”
that your findings would be unchanged if these errors were corrected.
43. Dr. Saad also attempts to draw conclusions about the relative prevalence of promotions
based on “business justifications” at various Career Stage levels. However, as with the in- and out-
of-cycle promotions analysis, in addition to being completely arbitrary, his attempted
identification of “business justifications” is so poorly constructed as to be meaningless.
45 Examples of strings that appear in his BN_Dictionary file but not in the random sample upon which he purported based this list upon include, but are not limited to: “the business is demanding ever more of this skill”; “dsp team has the need for senior software engineers”; “important we make these partner teams successful”; and “this promotion justification will allow team to continue”. See Appendix 2 for a complete list. 46 Saad Tr. at 51:23-25. 47 Saad Tr. at 52:4-9.
239
Case 2:15-cv-01483-JLR Document 359-10 Filed 02/21/18 Page 27 of 108

-26 -
CONTAINS CONFIDENTIAL MATERIALS
B. Dr. Saad’s z-score “selection pool” analysis
44. Rather than the probit analysis I used in my report, Dr. Saad analyzes promotions using
a “selection pool model” he describes as a “Z-model.” He describes selection pool models as
“probably more commonly used in statistical analysis of selection practices in employment
litigation than any other statistical technique.”48 Regardless of the truth of this statement,49 the
selection pool model that Dr. Saad has described is inappropriate for use in this context.
45. In support of his claim that Z-models are commonly used, he cites to a handbook
chapter that he co-authored.50 The general idea of the Z-score selection model, as described by
Dr. Saad, is to construct “presumed homogenous pools” (where the pools are homogenous except
with respect to gender) and to compare the proportion of female promotions within the pool to the
overall proportion of females in the pool.51 In order to construct groups that are homogenous to
the level of detail he asserts is necessary, Dr. Saad divides the data into tens of thousands of
pools.52 In particular, in order to be considered in the same pool, Dr. Saad requires that workers
have identical: Profession and Discipline, High/Low Performance (a variable he constructs based
on performance review scores), review cycle, review month (a variable he constructs based on
48 Saad Report at ¶ 116. 49 I do not have an opinion on whether or not selection pool models are more commonly used in employment litigation than any other statistical technique. 50 Saad Report at ¶ 116, fn.87 (citing Haan, C., E. Reardon, and A. Saad, “Employment Discrimination Litigation,” chapter in Litigation Services Handbook, ed., by Roman Weil, et al., 2012 (“Litigation Services Handbook”)). 51 In his handbook chapter, Dr. Saad used the term “pool.” In his report he uses the terms “strata” and “pool” interchangeably. In his deposition, he uses the term “strata.” 52 This is the number of strata (within the Engineering Profession) that contain a positive number of promotions.
240
Case 2:15-cv-01483-JLR Document 359-10 Filed 02/21/18 Page 28 of 108

-27 -
CONTAINS CONFIDENTIAL MATERIALS
promotion dates, and supervisors. The “review cycle” is delineated into “On-Cycle,” which is all
promotions that occur on September 1; “Off-Cycle March,” which is all promotions that occur on
March 1; and “Off-Cycle Other,” which is all promotions other than those recorded on September
1 or March 1. The “review month” is constructed based on the month of the promotion. For
example, a promotion that occurred on September 2, 2014 would have a review month of
September 2014. Not only does Dr. Saad consider promotions that occur in September separately
from promotions that occur in October, but he considers promotions that happen on September 1
separately from promotions that occur on September 2, and promotions that occur on March 1
separately from promotions that occur on March 2. All told, each year Dr. Saad employs fourteen
separate criteria based on the “month” that promotions occur: September 1; all other dates in
September; March 1; all other dates in March; and each other calendar month (separately). Dr.
Saad has provided dubious support for the assertion that promotions that occur in September
should be considered separately from promotions that occur at other times of the year (i.e., his
poorly-formed business justification analysis, described at length above), and he has provided no
support at all for the assertion that promotions that occur in October of a given year should be
considered separately from promotions that occur in November of the same year.
46. Dr. Saad’s requirement that members of each pool have the same supervisor has a
peculiar effect. Because each worker may have several direct and indirect supervisors (each
worker has an average of 4.3 supervisors, though some workers have as many as 7),53 each worker
enters into several “pools.” As a result, there are many more “pools” than there are promotions,
53 This is based on a review of backup materials provided by Dr. Saad.
241
Case 2:15-cv-01483-JLR Document 359-10 Filed 02/21/18 Page 29 of 108

-28 -
CONTAINS CONFIDENTIAL MATERIALS
because the same employee’s promotion is analyzed in multiple pools. Furthermore, Dr. Saad
assigns weights to each pool, with greater weight given to the promotion decision of direct line
managers and lower weight to higher-level managers. This weighting scheme is arbitrary and is
unjustified by Dr. Saad’s presumed notion that direct managers’ decisions are more important than
the decisions made by the higher-level managers in Microsoft’s organizational hierarchy.54
47. All told, Dr. Saad divides the data into 58,851 selection pools for engineering, and
4,983 selection pools within IT Operations.55 The average size of these pools is 6.6 people in
Engineering, and 4.6 people in IT Operations.56 The majority of these pools (nearly 60% within
each Profession) have zero female employees, and an additional 8% (Engineering) to 12% (IT
Operations have only female employees. Within the Engineering Profession, 39,482 (or 67%) of
Dr. Saad’s selection pools are comprised of a single gender. Within IT Operations, 3,509 (or
70%) of selection pools are comprised of a single gender. Further, 39% (Engineering) to 43% (IT
Operations) of Dr. Saad’s selection pools contain a single individual. As Dr. Saad acknowledged
in his deposition, pools with no gender variation will provide no useful information.57 As a result,
Dr. Saad’s analysis of advancements arbitrarily omits a substantial fraction of relevant individuals
(and advancements/non-advancements).
54 See Johnson Declaration at ¶ 6 for an explanation of the approval hierarchy for rewards. See Ritchie Tr. 495:10-497:16 for an explanation of the approval hierarchy for promotions. 55 As described in ¶ 26 above, given the high degree of advancement and movement between IT Operations and Engineering, I do not think it is appropriate to segregate these two Professions for the purposes of an advancement analysis. 56 These numbers represent individual people and do not account for the supervisor weights described above. 57 Saad Tr. at 204:16-205:3.
242
Case 2:15-cv-01483-JLR Document 359-10 Filed 02/21/18 Page 30 of 108

-29 -
CONTAINS CONFIDENTIAL MATERIALS
48. Dr. Saad has constructed selection pools such that two thirds of these pools provide no
useful information. Though Dr. Saad created tens of thousands of selection pools, he testified that
he combined performance ratings into groups “to reduce the number of strata; otherwise, you
would get far more strata than we already had.”58 Given the tens of thousands of strata he
created—the majority of which exhibit zero gender diversity and thus contain no useful
information—Dr. Saad does not seem to be concerned with this issue elsewhere.
49. In his handbook chapter, Dr. Saad acknowledges that for the selection pool model to
produce reliable results, there must be a certain sample size and number of expected selections.59
The data provided by Microsoft provided more than employee-year observations, which
contained information on fewer than 27,000 promotions (using MS promotions indicator) during
the class period. However, since each promotion is present in multiple pools, Dr. Saad has
constructed nearly 64,000 selection pools (between IT Operations and Engineering), each of which
is defined by having a nonzero number of promotions. Based on the method by which he
weighted many layers of supervisors, Dr. Saad has created thousands more “selection pools” than
there are actual promotions in the data.
50. Lastly, Dr. Saad’s own handbook chapter asserts that situations where many factors
(such as experience, seniority, and education) influence the probability of promotion often require
58 Saad Tr. at 219:9-17. 59 Litigation Services Handbook at 32.5(f).
243
Case 2:15-cv-01483-JLR Document 359-10 Filed 02/21/18 Page 31 of 108

-30 -
CONTAINS CONFIDENTIAL MATERIALS
multiple regression analysis (of which the probit analysis I performed in my original report is an
appropriate analog for discrete choice models).60
51. In short, Dr. Saad’s z-score “selection pool” model is designed to break the sample into
pools that are so small—and which usually have no gender variation—that no meaningful
information can be gleaned from this analysis. It should be ignored in its entirety.
C. Dr. Saad’s inclusion of Standard Title in Stock Level analyses
52. Dr. Saad argues that it was inappropriate for me to not include Standard Title in my
advancement and Stock Level analyses. I disagree. Most Standard Titles (85%) span only two or
three Stock Levels.61 For this reason, controlling for Standard Title will leave only a small
amount of variation between Stock Levels. Therefore, controlling for Standard Title will
“overcontrol” an analysis of Stock Level variation. I believe that including Standard Title in an
analysis of Stock Level placement (as does Dr. Saad) will understate the discrepancy in Stock
Level placement between men and women.
53. At page 83 of his report, Dr. Saad re-estimates the stock level distribution graph I
presented as Figure 3 in my original report, but adds controls for Standard Title. Even after
controlling for each worker’s Standard Title, Dr. Saad finds women are over-represented in low
60 “Suppose, however, that many factors influence the probability of a promotion. Such a situation often requires multiple regression analysis. This method controls for differences in multiple individual characteristics. A regression analysis identifies the relationship between each of the explanatory variables (in this case, promotion), while controlling for all other variables. Thus, an analyst using regression techniques can assess the relation between sex and promotion, while adjusting for the influence of other variales, such as experience, seniority, and education.” Litigation Services Handbook at 13 (32.5(j)).. 61 78% of workers work in Standard Titles that span three or fewer Career Stages according to the Job Title Taxonomy.
244
Case 2:15-cv-01483-JLR Document 359-10 Filed 02/21/18 Page 32 of 108

-31 -
CONTAINS CONFIDENTIAL MATERIALS
Stock Levels (60-62) and under-represented in higher Stock Levels (63 and higher), and the
female coefficient is negative and statistically significant. These results are similar to the results
that I described in my original report. It is notable women are significantly and systematically
under-placed with respect to Stock Level even after controlling for Standard Title.
54. However, Dr. Saad is wrong in his interpretation of this graph. He asserts that only
3.8% of women are “misplaced” in the wrong stock level. He arrives at this figure by summing up
the value of the difference between the “true female” and “predicted, no discrimination” bars for
each stock level for which women are over-represented. However, Dr. Saad’s use of this technique
demonstrates that he does not understand how to interpret ordered probit analyses. Consider the
following example. Imagine that there are four men and four women, each of whom could be
sorted into one of five levels (1-5). Further imagine that there are pairs of workers (one of each
gender) who are identical in every way except for gender. Absent discrimination, there should be
one man and one woman in each of levels 2-5 (with no workers in level 1). However, women face
gender discrimination and each woman is placed one level below where she would be placed
absent discrimination, and each man is correctly placed.62 In this case, there is one woman and no
men in level 1, one man and one woman in each level 2-4, and no women and one man in level 5.
According to Dr. Saad’s accounting procedure, only one woman (the woman in level 1) is
misplaced, even though in actuality, each and every woman is one stock level below where she
would be absent discrimination.
62 That is, the woman who should be placed in Level 2 is instead placed in Level 1, the woman who should be placed in Level 3 is in Level 2, and so on.
245
Case 2:15-cv-01483-JLR Document 359-10 Filed 02/21/18 Page 33 of 108
-32 -
CONTAINS CONFIDENTIAL MATERIALS
55. Dr. Saad also presents an analysis of new hires’ promotion “velocity,” which is the
difference between each employee’s initial and current Stock Level divided by the number of
years at Microsoft.63 Dr. Saad presents an analysis of raw “velocity” by gender, only for workers
who were first hired between September 1, 2012 and August 31, 2015. This analysis therefore
excludes 87.7% of Technical Employees. Additionally, this analysis does not control for any of
the various factors that Dr. Saad insists elsewhere are important in analyzing promotions, such as
performance review, supervisor, or the type of work each person is performing.
V. DR. SAAD’S ANALYSES OF PAY IS FLAWED
A. It is inappropriate to include Stock Level as a control variable in a pay regression
56. On July 12, 2016, counsel for Microsoft wrote a letter to the U.S. Department of
Labor’s Office of Federal Contract Compliance Programs (OFCCP) in connection with OFCCP’s
investigation into This letter
contains information about
”64 Despite Microsoft’s testimony and
documents to the contrary, Dr. Saad insists that Stock Level is not a pay band, and is therefore
appropriate to use as a control variable. He is incorrect.
57. In addition to these documents and testimony that Microsoft uses “Stock Level” as a
pay band, I have also analyzed the relationship between (a) annual salary and Stock Level and (b)
total compensation and Stock Level. Each of these regressions include only indicators for stock
63 Saad Report at ¶ 131 64 MSFT_MOUSSOURIS_00859173. See also ¶ 20 and footnotes 26 and 27 of my original report.
246
Case 2:15-cv-01483-JLR Document 359-10 Filed 02/21/18 Page 34 of 108

-33 -
CONTAINS CONFIDENTIAL MATERIALS
level and year as control variables. The R-squared for the annual salary regression is .90,
indicating that stock level and year explain 90% percent of the variation in annual salary. The R-
squared for the total compensation regression is 0.81, indicating that stock level and year explain
81% of the variation in total compensation. These high R-squared values indicate that, contrary to
Dr. Saad’s assertions (and in accordance with Microsoft’s documents and testimony), Stock
Levels are functionally pay bands.
58. On pages 103 and 104, Dr. Saad presents graphs plotting the annual base salary (page
103) and total compensation (page 104) by stock level.65 He has plotted this range as a solid bar,
which suggests that pay at any point within the bar is equally common. This is not true. I have re-
created these graphs as Figures 1 and 2, but using a “box and whisker” plot. These box and
whisker plots allow for a visual representation of the range of a value, and the amount of variance.
The “box” represents the middle 50% of the range of data (the 25th to 75th percentile) also known
as the “interquartile range”. Within each box is a vertical line that represents the median value.
The “whiskers,” centered on the median, represent 1.5 times the interquartile range and are a
visual representation of the additional spread beyond the box. Figure 1 presents this plot for
annual salary, and inspection of this figure makes it clear that these stock levels (depicted on the
vertical axis) are pay bands. Each level’s “box” is non-overlapping with the next level’s “box,”
indicating that the middle 50% of individuals in each stock level earn less than the middle 50% of
individuals in the next stock level. Figure 2 is similar, but presents these plots for total
compensation. In this case, there are overlapping boxes between 59 and levels as high as 62, and
65 He describes these graphs as “Average” base salary or total compensation, but they are not.
247
Case 2:15-cv-01483-JLR Document 359-10 Filed 02/21/18 Page 35 of 108
-34 -
CONTAINS CONFIDENTIAL MATERIALS
60 overlaps slightly with 61. However, in all cases, the median total compensation (represented
by the vertical line within each “box”) are strictly increasing in stock level, indicating that median
total compensation is higher at each successively higher stock level.
59. Dr. Saad performs several analyses where he includes stock level as a control, but this
is simply wrong, as stock level is a pay band. By controlling for a pay band (which is a close
proxy for pay) in a pay regression, Dr. Saad is very nearly regressing pay on itself. It is therefore
unsurprising that he finds a very small gender pay gap.66 He has essentially asked the question,
“after controlling for how much each worker earns, do women earn less than men?” This question
is meaningless, as are all of the analyses that follow.
60. Dr. Saad asserts that it is an “extreme position” to exclude Stock Level in my pay
analyses because there is a shortfall in advancement among women.67 This is nonsense. It is
simply inappropriate as a matter of econometrics to include a proxy for pay as a control variable in
a pay regression. This is not an “extreme position.”
61. It may be instructive to consider an example outside of the context of this case to
explain why it is inappropriate to regress a variable on a proxy for itself. Rather than examining
the question of gender differences in pay, imagine that you are interested in studying the height of
66 It is equally unsurprising that he finds very high R-squared values in pay regressions that include pay bands. After adding Stock Level to my Model 5, Dr. Saad finds an R-squared of 0.91. R-squared measures the percent of variation in the dependent variable (here, log total compensation) that is explained by the independent control variables. Stock Level and year alone (with no other controls) explain 81% of the variance in log total compensation. See ¶ 57, above. 67 Saad Report at ¶ 133.
248
Case 2:15-cv-01483-JLR Document 359-10 Filed 02/21/18 Page 36 of 108
-35 -
CONTAINS CONFIDENTIAL MATERIALS
men and women.68 You could answer the question “what is the average difference in height
between men and women” by regressing height in inches on a gender indicator variable. The first
row of Table 9 presents the results of this analysis, and shows that women are, on average 5.1
inches shorter than men. If you were to follow Dr. Saad’s suggested method for determining the
difference in height between men and women, you would instead regress height in inches on a
gender dummy and a series of height bands.69 The second row of Table 9 presents the results of
this analysis and shows that, after controlling for what height band each individual is in, women
are 0.8 inches shorter than men on average.
62. All of Dr. Saad’s regression analysis of pay that include Stock Levels are deeply
flawed. This includes the analyses where he has randomly re-assigned some men and women to
different stock levels, based on analyses showing that women are under-advanced. Simply
changing some observations’ Stock Level does not make it appropriate to include Stock Level,
which is a pay band, as a control for a pay regression. In addition to repeating his incorrect
assertion that it is somehow appropriate to include a proxy for pay as a control in a pay regression,
Dr. Saad has also made numerous errors. Namely, in order to construct the p-values and t-
statistics, Dr. Saad simply averages the estimated p-values (and t-statistics), which is simply
incorrect.70
68 The data for this analysis are based on height data reported by Francis Galton, available at https://dataverse.harvard.edu/dataset.xhtml?persistentId=doi:10.7910/DVN/T0HSJ1. 69 I have used the following height bins: shorter than 62 inches; taller than or equal to 62 inches, but shorter than 66 inches; taller than or equal to 66 inches, but shorter than 70 inches; taller than or equal to 70 inches, but shorter than 74 inches; taller than 74 inches. 70 Saad Tr. at 184:4-185:6.
249
Case 2:15-cv-01483-JLR Document 359-10 Filed 02/21/18 Page 37 of 108

-36 -
CONTAINS CONFIDENTIAL MATERIALS
63. Dr. Saad also presents a table and a series of graphs that he purports to be based on my
Model 5, but “with additional controls.” These include the table on page 109, the pie charts on
page 110, the scatterplots on pages 125 and 126, and the bar chart on page 127 of Dr. Saad’s
report. Each of these tables or figures includes Stock Level (which is a pay band) as a control in a
pay regression, and should be disregarded as meaningless.
64. Additionally, Dr. Saad asserts that the results of his analyses that include Stock Level
as a pay band that show that women earn statistically significantly less than men, but that this
difference is not “practically significant.”71 In support of this claim, Dr. Saad cited a hypothetical
example written by Daniel Rubinfeld, which focused on a $0.10 per hour pay difference between
men and women’s pay, which Dr. Rubinfeld argued would be “likely to be deemed practically
insignificant.”72 As noted in a paper cited by Dr. Saad, practical significance “is not a statistical
concept, but rather an imprecise term whose meaning is determined on a case-by-case basis.”73
The American Bar Association’s Econometrics handbook uses a coefficient size of 0.0001 percent
as an example of an effect that may not be practically significant.74 Applying even Dr. Saad’s
estimate of a 0.4% gender pay gap, which is much larger this threshold, implies a class-wide
damages effect of
71 Saad Report at ¶ 167. 72 Saad Report at ¶ 167, citing Rubinfeld, Daniel, “Reference Guide on Multiple Regression,” Reference Manual on Scientific Evidence: Third Edition, page 318. 73 Piette, Michael and White, Paul, “Approaches for Dealing with Small Sample Sizes in Employment Discrimination Litigation,” Journal of Forensic Economists, 12(1), 1999, pp. 43-56 at 53, cited by Saad at ¶ 116, n.87. 74 ABA Section of Antitrust Law, Econometrics (2005) at p. 15.
250
Case 2:15-cv-01483-JLR Document 359-10 Filed 02/21/18 Page 38 of 108

-37 -
CONTAINS CONFIDENTIAL MATERIALS
B. Discussion of Models 1-3
65. Dr. Saad spends many pages discussing how Models 1-3 are not sufficient to show that
there is a meaningful gender pay gap after controlling for reasonable differences.75 I agree that
these models are likely to mis-state the portion of the gender pay gap that is due to gender
discrimination and not other factors (such as differences in tenure, job performance, or type of
work performed). It is for this reason that I presented additional models, which control for each
worker’s Discipline (Model 4) and Standard Title (Model 5).
C. Disaggregation between IT and Engineering
66. Dr. Saad has suggested that when examining the difference in pay between men and
women, I should disaggregate between IT and Engineering.76 This argument is based on (1)
differences in the distribution of Stock Levels (and hence pay bands) by Profession;77 (2)
differences in average pay by Profession;78 (3) differences in education level by Profession
(though his chart on page 92 shows that these data are missing for nearly half of both groups).79
He also asserts that there is little crossover between these professions, though Microsoft’s data
show that 61% of individuals who ever work in the IT Operations Profession during the period
75 Saad Report at ¶¶ 136-147. 76 Note that much of Dr. Saad’s criticism of my combining IT Operations and Engineering Professions centers around Models 1-3, which do not control for Profession. Models 4 and 5 (which control for Discipline and Standard Title, respectively, also serve to control for Profession). See Saad Report at ¶¶ 142-147. 77 Saad Report at ¶ 145. 78 Saad Report at ¶ 143. 79 Saad Report at ¶ 144.
251
Case 2:15-cv-01483-JLR Document 359-10 Filed 02/21/18 Page 39 of 108

-38 -
CONTAINS CONFIDENTIAL MATERIALS
January 1, 2010 – August 31, 2016 also work in the Engineering Profession at some point during
the same time period.
67. Dr. Saad is obfuscating the fact that for Models 4 and 5, I do control for Discipline and
Standard Title (respectively) each of which already control for Profession, and I believe that these
controls are sufficient to account for the differences described by Dr. Saad.80 Nevertheless, in
Table 10, I present the results of an analysis where I interact the gender effect with a profession
indicator. This will estimate separate gender pay gaps within the IT Operations and Engineering
Professions. Other than this modification, there are no other changes to the model specifications
relative to those reported in Table 3 of my original report.
68. Column [1] presents the estimated gender pay gap for the Engineering Profession, and
Column [2] presents the t-statistic for this estimate. For each model specification, women earn
less than men and this difference is statistically significant.81 Columns [3] and [4] present the
estimated gender pay gap and its t-statistic for the IT Operations Profession. Models 4x and 5x
(which control for Discipline and Standard Title, respectively, in addition to human capital
factors) show that women earn statistically significantly less than men.82
D. Gender differences by Discipline
69. Dr. Saad notes that “women and men differ in their distributions across disciplines, and
this accounted for almost 15% of Dr. Farber’s estimated pay difference reported in his Model
80 Each Profession is associated with a mutually-exclusive list of Disciplines and Standard Titles. 81 This difference ranges from 2.6 log points in Model 5x to 7.5 log points in Models 2x and 3x. 82 Models 1x-3x do not show any statistically significant difference in pay between men and women in IT Operations, however these models do not include any controls for the type of work that each person does.
252
Case 2:15-cv-01483-JLR Document 359-10 Filed 02/21/18 Page 40 of 108

-39 -
CONTAINS CONFIDENTIAL MATERIALS
3….It is notable that inserting discipline does not increase R-squared in Dr. Farber’s analysis.”83
Including “Discipline” as a control variable does, in fact, increase R-squared, from 0.51 to 0.55, so
I am unsure why Dr. Saad claims otherwise. Nevertheless, Models 4 and 5 both control for each
worker’s Discipline, which will account for the difference in pay across Disciplines. By
controlling for these factors, I have accounted for differences in the distribution of men and
women across Disciplines.
E. Career Stage
70. Dr. Saad argues that I should have included controls for each worker’s Career Stage.84
Career Stage and Discipline are largely, but not entirely, determinative of each worker’s Standard
Title. Though most Standard Titles are associated with two or three Career Stages, there are some
Standard Titles (such as Software Engineering in 2016) that span a wider range of Career Stages.
In Table 11, I present the previous analyses and include Model 6, which adds a series of Career
Stage indicator variables to Model 5.85 This analysis shows a gender pay gap of 0.019 log points
or 1.9% after controlling for human capital factors, Standard Title and Career Stage.
71. However, I reiterate my finding from the original report that Career Stage (whether
entering the regression analysis separately or as information contained within Standard Title) is a
tainted variable and therefore the inclusion of Career Stage or Standard Title as a control variable
in a pay regression will likely understate the gender pay gap. This conclusion is based on the
83 Saad Report at ¶ 147 84 Saad Report at ¶¶ 150-156. 85 In all, Model 6 controls for gender, compensation year, age and its square, tenure at Microsoft ant its square, state in which the employee works, city in which the employee works, PayScaleType, performance rating, Standard Title, and Career Stage.
253
Case 2:15-cv-01483-JLR Document 359-10 Filed 02/21/18 Page 41 of 108

-40 -
CONTAINS CONFIDENTIAL MATERIALS
analysis of gender disparity in Career Stages discussed in paragraphs 58-62 and Figures 1-2 of my
original report. This analysis shows that women are systematically in lower Career Stages than
would be predicted in the absence of discrimination.
72. Dr. Saad asserts that Figures 1 and 2 of my original report show that “only” 7.3% of
women are in a Career Stage lower than my model predicts.86 However, this analysis is based on
the same flawed logic and misunderstanding of ordered probit analyses as infected his calculation
of underplaced women at pages 82-83 of his report. Namely, simply comparing the difference
between the heights of the “true” and “predicted” bars does not answer the question of how many
women are underleveled. See the discussion at paragraph 54, above.
F. Dr. Saad’s other criticisms of pay analysis
1. Part time work and leaves of absence
73. Dr. Saad argues that my analysis should have accounted for the fact that some workers
at Microsoft work part time. As noted in Dr. Saad’s report, part time work is rare among
Technical Employees at Microsoft, with approximately 0.26% of employee-years reflecting part
time work. Likewise, Dr. Saad argues that I should have accounted for the fact that some workers
take leaves of absence (LOA). I agree with Dr. Saad that it is appropriate to control for both of
these factors. Table 12 presents the results of my analysis when I alternately control for part time
work, control for leave of absences, and control for both of these.87 I make these modifications to
86 Saad Report at ¶ 151. 87 In particular, I control for part time work by adding to the regression an indicator for whether the employee is designated as a part time worker at any point in the compensation year. I control for leaves of absence by adding two indicators to the regression: one indicates whether the employee took leave during the current compensation year, while one indicates whether the employee took leave during the previous compensation year.
254
Case 2:15-cv-01483-JLR Document 359-10 Filed 02/21/18 Page 42 of 108
-41 -
CONTAINS CONFIDENTIAL MATERIALS
both Model 4 and Model 5. In either case, these modifications have a small impact on my
estimate of the gender difference in pay. The alternative estimates for Model 4 range from 5.1%
to 5.3%, compared to the baseline of 5.5% without controlling for part-time work or leaves of
absence. Likewise, the alternative estimates for Model 5 range from 2.3% to 2.5%, compared to
the baseline of 2.6% without modifications.
2. Patents
74. Dr. Saad also criticizes my analysis for not including a number of factors that are not
possible to control for. For instance, Dr. Saad argues that Microsoft may pay individuals who
hold patents more than individuals who do not.88 Microsoft did not provide any data on patents
held by Microsoft employees, without which it is impossible to control for patents in any analysis.
3. College hires versus lateral hires
75. Dr. Saad argues that I should have controlled for differences in college and lateral
hires. He proposes a method for doing so, based on the “hire source” and “candidate source” in
the data provided by Microsoft.89 Note that, though hire source information is available for 90%
of observations, Dr. Saad limited his analysis to only those workers who were hired after
September 1, 2012. He does not explain why he excluded class members who were hired prior to
September 1, 2012 from this analysis.90 Note also that he performed this analysis only for those
workers in the Engineering Profession and does not analyze IT Operations workers.
88 Saad Report at ¶ 183. 89 Saad Report at ¶ 186. Note that “hire source” is based on the requisition form, and is not based on the characteristics of the individual who was actually hired for the position. 90 Note that of the approximately employee-year observations available in the data, of whoich include hire source data, Dr. Saad bases this analysis on approximately
255
Case 2:15-cv-01483-JLR Document 359-10 Filed 02/21/18 Page 43 of 108

-42 -
CONTAINS CONFIDENTIAL MATERIALS
76. Before turning to my own version of this analysis, it is worth discussing the final row
of the table on page 119 of Dr. Saad’s report. In this analysis, Dr. Saad is regressing total
compensation on the Stock Level (i.e. pay band) at hire. Regressing pay on Stock Level (i.e. pay
band) remains inappropriate for all of the reasons discussed in paragraphs 56-61 above, even if is
past (rather than current) Stock Level. Because any worker’s current pay is heavily influenced by
their past pay—especially pay in the recent past—this is again simply regressing pay on a proxy
for pay. Furthermore, because Dr. Saad is examining only new hires, the problem of controlling
for on-hire Stock Level in a pay regression will be more pronounced than controlling for on-hire
Stock Level for people who have been with Microsoft for a longer period of time.91
77. I have replicated Dr. Saad’s analysis reported on page 119 of Dr. Saad’s report, but
rather than limiting my analysis to new hires, I have included all Engineering workers for whom I
have sufficient data namely those with known hire source92 and known initial stock level93,
observations. At his deposition, Dr. Saad was asked why he limited his analysis to only individuals who were hired after September 1, 2012. In his response, he explained that he wanted to compare individuals who came directly from college (and presumably had no prior experience) with those who came to Microsoft laterally (and who presumably do have prior experience). This answer is not responsive to the question of why he only examined individuals who were hired after September 1, 2012. See Saad Tr. at 186:8-187:5. 91 In order to be included in Dr. Saad’s analysis on page 119, each individual must have been hired after September 1, 2012. This means that by definition, workers in this analysis can only have been employed by Microsoft for at most 4 years. The average tenure of the lateral hires Dr. Saad includes in this table is 10.5 months. 92 A , representing roughly of employee years, have a hire source of , while all other non-missing hire source values are “College” or “Industry.” I follow Dr. Saad in reclassifying the hire source as “Industry” for purposes of this analysis. I likewise follow Dr. Saad in reclassifying hire source as “College” if the field Candidate Source Category includes the words “College” or “University”.
256
Case 2:15-cv-01483-JLR Document 359-10 Filed 02/21/18 Page 44 of 108

-43 -
CONTAINS CONFIDENTIAL MATERIALS
regardless of hire date. The results of this analysis are presented in Table 13. I find, among
college hires, women earn 2.5% less than men under Model 4, or 1.4% less under Model 5.
Among industry hires, women earn 5.9% less than men under Model 4, or 2.7% less under Model
5. If I follow Dr. Saad in controlling for initial stock level when analyzing industry hires, I still
find that women are underpaid by 1.2% (in both Models 4 and 5). All these differences are
statistically significant. This analysis shows that when the analysis is not limited to the small
fraction of workers who were hired during the class period, for both “college hires” and “lateral
hires,” women earn statistically significantly less than men. This remains true for lateral hires
even after controlling for on-hire Stock Level (though I believe that it is inappropriate to do so, as
Stock Level is a pay band).
4. Business Products
78. Dr. Saad argues that I should have controlled for different areas of the company in
which Technical Employees may work (in addition to controlling for Discipline or Standard Title,
which are controlled for in my Models 4 and 5).94 Dr. Saad also asserts that “we have little
information on what types of business products and specific areas within those products
employees work on while at Microsoft.”95 However, we do have information from Microsoft on
14 organizational taxonomies, which constitute the various levels of 3 distinct organizational
hierarchies, though I understand that Microsoft has not provided any evidence that these
93 Initial stock level is known for all employees hired during the discovery period, as well as for employees who were hired before the discovery period but whose “on-hire” stock level has been provided by Microsoft. 94 Saad Report at ¶ 141. 95 Saad Report at ¶ 187.
257
Case 2:15-cv-01483-JLR Document 359-10 Filed 02/21/18 Page 45 of 108

-44 -
CONTAINS CONFIDENTIAL MATERIALS
organizational divisions are meaningful distinctions in the type of work each employee performs.
Nevertheless, I have added controls for these organizational hierarchies.
79. In Tables 14 and 15, I present the results of analyses that add control variables for
various levels of each organization hierarchy to Model 4 (Table 14) and Model 5 (Table 15),
respective. In each Table, Row 1 is baseline for that model, while subsequent rows add additional
information for a particular level of one of Microsoft’s organization hierarchies. For instance, the
second row of Table 16 controls for “Org Summary”, which is the highest level of the Channel
hierarchy and divides employees into 11 categories. Meanwhile, the seventh row controls for
“Function Detail”, which is second-finest96 level of the Channel Hierarchy and divides employees
into 1,600 categories. With these additional controls, the estimated pay gap under Model 4 ranges
from 4.8% to 5.4% (compared to a baseline of 5.4%), and the estimated pay gap under Model 5
ranges from 2.5% to 3.1% (compared to baseline of 2.6%).
80. While I maintain that Microsoft’s Job Title Taxonomy (Profession, Discipline, and
Standard Title) is the preferred control for what an employee does at Microsoft, these tables
demonstrate that I can additionally control for different measures of organizational structure at
Microsoft and still find a nearly identical pay differential.97 In fact, once I’ve controlled for
Standard Title in Model 5, controlling for additional organization information often increases the
estimated pay gap.
96 The base, or finest level, of both the Channel Hierarchy and the Executive Hierarchy is “Cost Center” (see the 14th row of the table) which divides employees into 3158 categories. 97 At pages 122-123 of his report, Dr. Saad compares employees with different “functions” but the same Standard Title. “Function” is one of the controls in this analysis.
258
Case 2:15-cv-01483-JLR Document 359-10 Filed 02/21/18 Page 46 of 108

-45 -
CONTAINS CONFIDENTIAL MATERIALS
VI. DR. SAAD’S ANALYSIS OF CENSUS DATA
81. Dr. Saad performs an analysis where he compares the “female representation” rate at
Microsoft as compared to a benchmark that he constructed based on data provided by the
American Community Survey. This analysis provides no information as to whether or not
Microsoft disfavors female technical employees with respect to pay or advancement.
82. This analysis should be ignored in its entirety.
VII. CONCLUSION
83. I have reviewed the Expert Report and deposition of Ali Saad. I find that his analyses
are generally incorrect, misleading, or irrelevant. Several of his analyses are so deeply flawed or
irrelevant that they should be ignored in their entirety.
84. I maintain the conclusions from my original report, that members of the Compensation
Class at Microsoft (that is, female Technical Employees in Stock Levels 59-67) receive lower
compensation, on average, than otherwise-similar men, and this difference is statistically
significant I also find that female Technical Employees in Stock Levels 60-64 at Microsoft have
a lower probability of advancement through Stock Levels and Career Stages than otherwise-
similar men, and this difference is statistically significant.
__________________
Henry Farber
February 9, 2018
259
Case 2:15-cv-01483-JLR Document 359-10 Filed 02/21/18 Page 47 of 108

CONTAINSCONFIDENTIALMATERIALS
ModelPercentofWoman-YearsWorkedUnderSupervisorsThatUnderpay
Women
PercentofWoman-YearsWorkedUnderSupervisorsThatUnderpay
Women,andthePayGapisStatisticallySignificant
[1] [2]4s 99.72% 98.33%5s 99.72% 98.79%
Notes:ThistablesummarizestheresultsofregressionswhereaninteractionofanindicatorforeachLevel1Supervisorand"Female"replacesthesingle"Female"dummyinModel4(firstrowofthetable)andModel5(secondrowofthetable).AnindicatorforeachLevel1Supervisorisalsoaddedtoeachmodel.Bymakingtheseadjustmentstothemodels,Icandetermineunderwhichsupervisorsagenderpaygapexists.Thetablereports[1]thepercentofwomen-yearsworkedundersupervisorsforwhomIfindapaygap,aswellas[2]thepercentageofwomenworkingundersupervisorsforwhomIfindastatisticallysignificantpaygap.
Womeninmyanalysisworkfor1of10Level1Supervisors.
PercentagesaremeasuredoutofwomenforwhomIhavedataonLevel1Supervisor.Ihavethisdataforover99%ofwomenyears.
Model4s:ControlsforGenderinteractedwithSupervisor,Supervisor,aswellas"compensationyear",employeeage(anditssquare),employeetenureatMicrosoft(anditssquare),stateinwhichtheemployeeworks,cityinwhichtheemployeeworks,PayScaleType,employees'performanceratings,andDisciplineModel5s:Model4s+addcontrolsforStandardTitle
Table1SupervisorInteractedwithGender
Howmanywomenworkundersupervisorswhoexhibitagenderpaygap?
46
260
Case 2:15-cv-01483-JLR Document 359-10 Filed 02/21/18 Page 48 of 108

CONTAINSCONFIDENTIALMATERIALS
CompensationYear
TrueStandardTitle AdjustedStandardTitleTrueTotal
CompensationPredicted
CompensationDifference
2012 SeniorProgramManager PrincipalProgramManager2013 SeniorProgramManager PrincipalProgramManager2014 SeniorPMManager PrincipalPMManager
Notes:ThistableassignsKatherineMoussouistotheStandardTitleshemostlikelywouldhavebeeninhadshebeenpromoted(AjdustedStandardTitle),andpredictshertotalcompensationbasedonModel5.
Table2CompensationPredictionsforMoussourisifshewasnotUnder-AdvancedinStockLevel
47
261
Case 2:15-cv-01483-JLR Document 359-10 Filed 02/21/18 Page 49 of 108

CONTAINSCONFIDENTIALMATERIALS
Model
[1]
PercentofWomen
WorkingUnderSupervisors
whoUnderadvance
Women
[2]
PercentofWomenWorking
UnderSuperisorswho
UnderadvanceWomenandthe
GenderGapisStatistically
Significant
4s 90.01% 89.19%
Howmanywomenworkundersupervisorswhounderadvancewomen?
SupervisorInteractedwithGender
Table3
Notes:Thistablesummarizestheresultsofregressionswhereaninteractionofan
indicatorforeachLevel1Supervisorand"Female"replacesthesingle
"Female"dummyinModel4(firstrowofthetable)andModel5(secondrow
ofthetable).AnindicatorforeachLevel1Supervisorisalsoaddedtoeach
model.Bymakingtheseadjustmentstothemodels,Icandetermineunder
whichsupervisorsagenderadvancementgapexists.Thetablereports[1]the
percentofwomen-yearsworkedundersupervisorsforwhomIfindan
advancementgap,aswellas[2]thepercentageofwomenworkingunder
supervisorsforwhomIfindastatisticallysignificantadvancementgap.
Womeninmyanalysisworkfor1of10Level1Supervisors.
PercentagesaremeasuredoutofwomenforwhomIhavedataonLevel1
Supervisor.Ihavethisdataforover99%ofwomenyears.
Model4s:Controlsfor:GenderinteractedwithSupervisor,Supervisor,aswellas"compensationyear",employeeage(anditssquare),employeetenureat
Microsoft(anditssquare),stateinwhichtheemployeeworks,cityinwhich
theemployeeworks,PayScaleType,StockLevelasofSeptember1ofthe
previousyear,employees'performanceratings,andDiscipline
48
262
Case 2:15-cv-01483-JLR Document 359-10 Filed 02/21/18 Page 50 of 108

CONTAINSCONFIDENTIALMATERIALS
Men Women Total
Promotions 33,772 7,040 40,812
PredictedPromotionsusingDr.Saad'sMethod* 19,111 4,268 23,379
PredictedPromotionsasaPercentofActual
Promotions56.59% 60.63% 57.28%
Table4
Dr.Saad'sPredictedPromotionsvs.ActualPromotions
*TotalnumberofpromotionsbasedonDr.Saad'smethodofanalysingpromotionsthat
"shouldhaveoccured."Apredictedprobabilityofpromotiongreaterorequalto0.5countsas
apromotion,whileaprobabiltylessthan0.5doesnotcountasapromotion.
Basedonaprobitanalysisofanadvancementmeasureontenure,tenuresquared,age,age
squared,year,performancemetrics,location,Discipline,andpriorStockLevel.
49
263
Case 2:15-cv-01483-JLR Document 359-10 Filed 02/21/18 Page 51 of 108

CONTAINSCONFIDENTIALMATERIALS
AverageAdvancement
Rate
GenderDifference
(MarginalEffect)Z-statistic Employee
Years
[1] [2] [3] [4][A]StockLevelAdvancement 0.317 -0.021 -8.897[B]MicrosoftPromotionIndicator 0.275 -0.024 -9.105[C]CareerStageAdvancementpriorto2014 0.143 -0.025 -7.586[D]CareerStageAdvancementpost2014 0.231 -0.033 -3.519
Table5StockLevelandCareerStageAdvancementDifferencesforMenandWomen
Basedonaprobitanalysisofanadvancementmeasureontenure,tenuresquared,age,agesquared,year,performancemetrics,location,Discipline,andpriorStockLevelinRow[A],theMicrosoftPromotionsIndicatorvariablein[B],orCareerStageinRows[C]and[D].
50
264
Case 2:15-cv-01483-JLR Document 359-10 Filed 02/21/18 Page 52 of 108
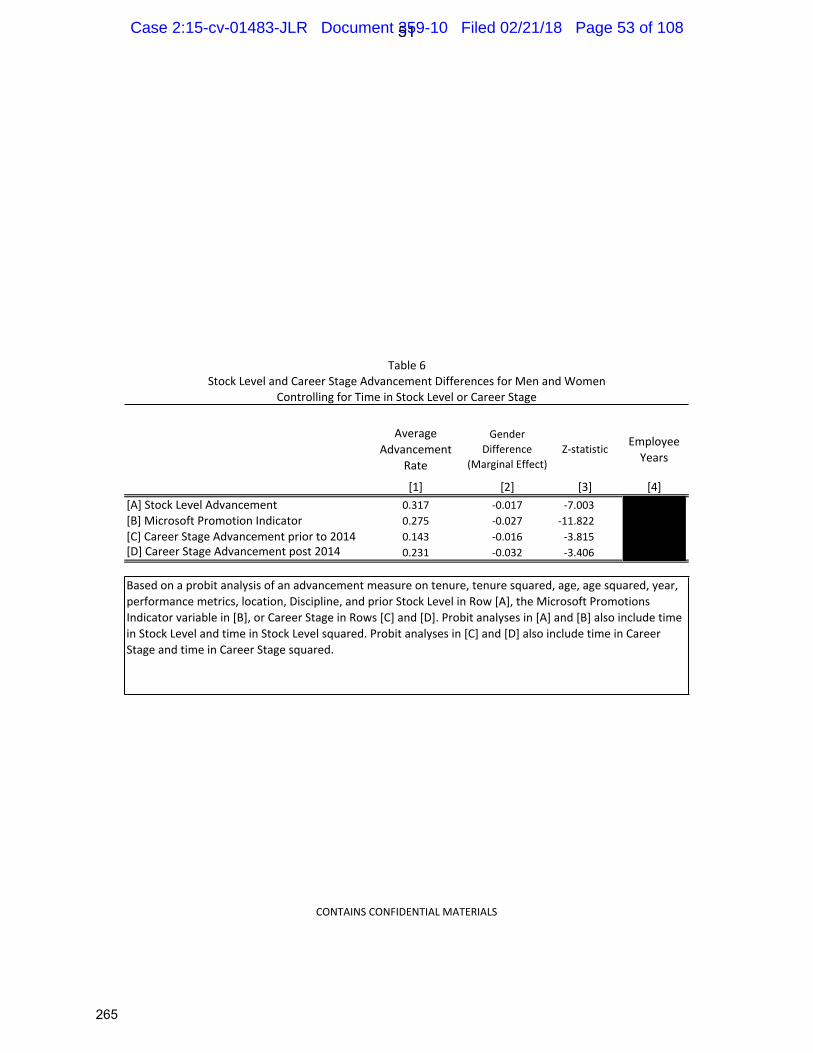
CONTAINSCONFIDENTIALMATERIALS
AverageAdvancement
Rate
GenderDifference
(MarginalEffect)Z-statistic Employee
Years
[1] [2] [3] [4][A]StockLevelAdvancement 0.317 -0.017 -7.003[B]MicrosoftPromotionIndicator 0.275 -0.027 -11.822[C]CareerStageAdvancementpriorto2014 0.143 -0.016 -3.815[D]CareerStageAdvancementpost2014 0.231 -0.032 -3.406
Table6StockLevelandCareerStageAdvancementDifferencesforMenandWomen
ControllingforTimeinStockLevelorCareerStage
Basedonaprobitanalysisofanadvancementmeasureontenure,tenuresquared,age,agesquared,year,performancemetrics,location,Discipline,andpriorStockLevelinRow[A],theMicrosoftPromotionsIndicatorvariablein[B],orCareerStageinRows[C]and[D].Probitanalysesin[A]and[B]alsoincludetimeinStockLevelandtimeinStockLevelsquared.Probitanalysesin[C]and[D]alsoincludetimeinCareerStageandtimeinCareerStagesquared.
51
265
Case 2:15-cv-01483-JLR Document 359-10 Filed 02/21/18 Page 53 of 108

CONTAINSCONFIDENTIALMATERIALS
AverageAdvancement
Rate
GenderDifference
(MarginalEffect)Z-statistic
EmployeeYears
[1] [2] [3] [4][A]StockLevelAdvancement 0.317 -0.021 -8.978[B]MicrosoftPromotionIndicator 0.275 -0.021 -9.382[C]CareerStageAdvancementpriorto2014 0.143 -0.026 -7.846[D]CareerStageAdvancementpost2014 0.231 -0.031 -3.429
Table7
Controllingfortwomostrecentperformancereviews.StockLevelandCareerStageAdvancementDifferencesforMenandWomen
Basedonaprobitanalysisofanadvancementmeasureontenure,tenuresquared,age,agesquared,year,performancemetrics,location,Discipline,twomostrecentperformancemeasures,andpriorStockLevelinRow[A],theMicrosoftPromotionsIndicatorvariablein[B],orCareerStageinRows[C]and[D].
52
266
Case 2:15-cv-01483-JLR Document 359-10 Filed 02/21/18 Page 54 of 108

CONTAINSCONFIDENTIALMATERIALS
StockLevel NumberofObservations
NumberofWoman-Years
NumberofAdvancements,
Women
AdvancementRate,Women
ExpectedAdvancementRate,Women
NumberofExpected
Advancements,Women
ShortfallofAdvancements,
WomenT-Statistic
[1] [2] [3] [4] [5] [6] [7] [8]59 9,516 965 0.53 0.55 1,012 -47 -3.2360 16,847 1,503 0.44 0.45 1,526 -23 -0.9361 24,814 1,756 0.34 0.37 1,905 -149 -5.1162 30,434 1,411 0.24 0.28 1,617 -206 -10.8963 25,359 878 0.22 0.25 994 -116 -7.6164 18,381 362 0.16 0.16 378 -16 -2.69
-534
Note:
ReportedCalculationsandResults:
[5]:ResultfromProbitModel ExpectedAdvancementRate,Women[6]=[5]x[2] NumberofExpectedAdvancements,Women[7]=[3]-[6] ShortfallofAdvancements,Women
BasedonaprobitanalysisoftheStockLeveladvancementindicatorvariableontenure,tenuresquared,age,agesquared,year,twomostrecentperformancemetrics,location,Discipline,andpriorStockLevel.ThismodelisestimatedformenonlyandtheprobabilityofStockLeveladvancementispredictedforbothmenandwomen.
Column: Reports:[4]=[3]/[2] AdvancementRate,Women
Table8StockLevelAdvancementShortfall
TotalShortfall,StockLevels59-64:
AStockLeveladvancementisdefinedasachangefromalowerStockLevelintoahigherStockLevel,comparingStockLevelonSeptember1ofyeartwithStockLevelonSeptember1ofyeart-1.
Controllingfortwomostrecentperformancereviews.
53
267
Case 2:15-cv-01483-JLR Document 359-10 Filed 02/21/18 Page 55 of 108
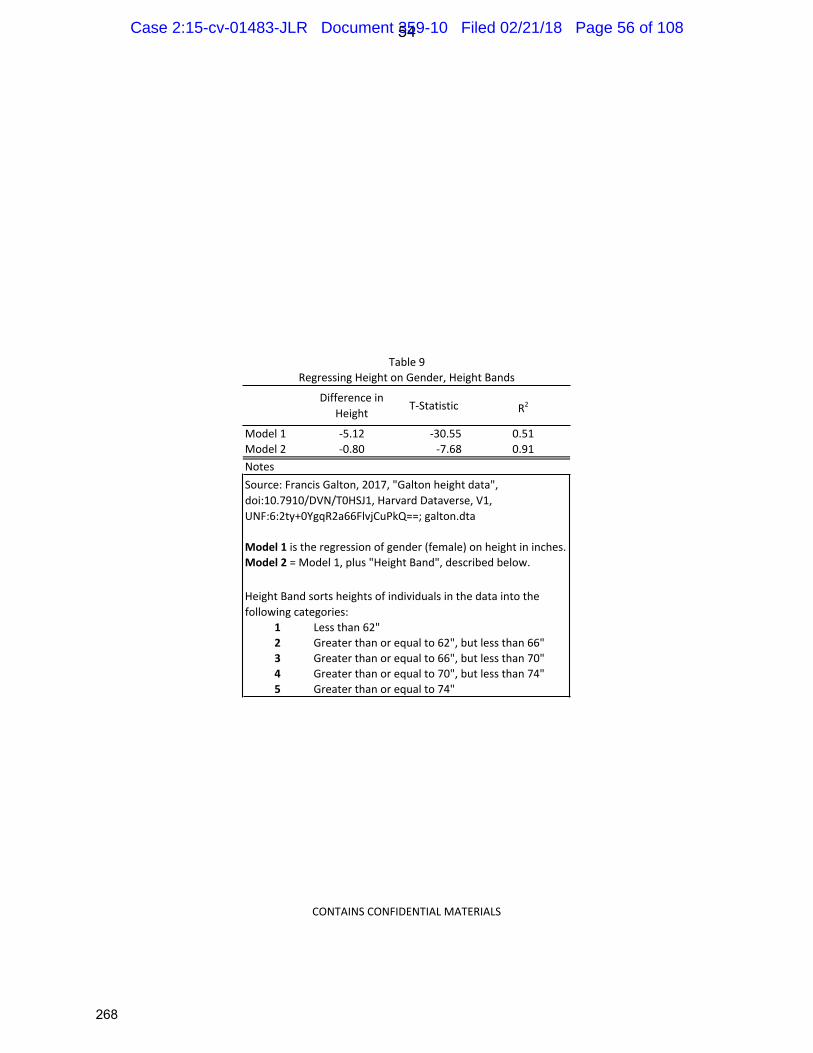
CONTAINSCONFIDENTIALMATERIALS
DifferenceinHeight
T-Statistic R2
Model1 -5.12 -30.55 0.51Model2 -0.80 -7.68 0.91
Notes
Model1istheregressionofgender(female)onheightininches.Model2=Model1,plus"HeightBand",describedbelow.
1 Lessthan62"2 Greaterthanorequalto62",butlessthan66"3 Greaterthanorequalto66",butlessthan70"4 Greaterthanorequalto70",butlessthan74"5 Greaterthanorequalto74"
Table9RegressingHeightonGender,HeightBands
Source:FrancisGalton,2017,"Galtonheightdata",doi:10.7910/DVN/T0HSJ1,HarvardDataverse,V1,UNF:6:2ty+0YgqR2a66FlvjCuPkQ==;galton.dta
HeightBandsortsheightsofindividualsinthedataintothefollowingcategories:
54
268
Case 2:15-cv-01483-JLR Document 359-10 Filed 02/21/18 Page 56 of 108
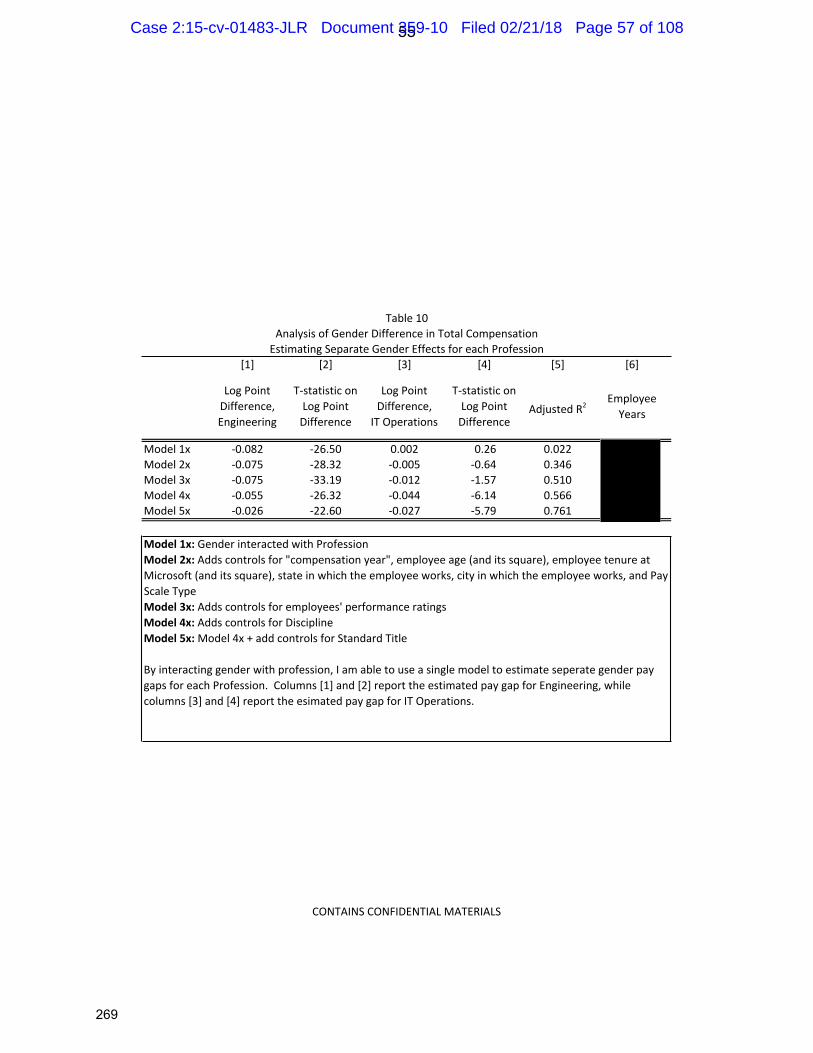
CONTAINSCONFIDENTIALMATERIALS
[1] [2] [3] [4] [5] [6]
LogPointDifference,Engineering
T-statisticonLogPointDifference
LogPointDifference,
ITOperations
T-statisticonLogPointDifference
AdjustedR2EmployeeYears
Model1x -0.082 -26.50 0.002 0.26 0.022Model2x -0.075 -28.32 -0.005 -0.64 0.346Model3x -0.075 -33.19 -0.012 -1.57 0.510Model4x -0.055 -26.32 -0.044 -6.14 0.566Model5x -0.026 -22.60 -0.027 -5.79 0.761
Table10AnalysisofGenderDifferenceinTotalCompensationEstimatingSeparateGenderEffectsforeachProfession
Model1x:GenderinteractedwithProfessionModel2x:Addscontrolsfor"compensationyear",employeeage(anditssquare),employeetenureatMicrosoft(anditssquare),stateinwhichtheemployeeworks,cityinwhichtheemployeeworks,andPayScaleTypeModel3x:Addscontrolsforemployees'performanceratingsModel4x:AddscontrolsforDisciplineModel5x:Model4x+addcontrolsforStandardTitle
Byinteractinggenderwithprofession,IamabletouseasinglemodeltoestimateseperategenderpaygapsforeachProfession.Columns[1]and[2]reporttheestimatedpaygapforEngineering,whilecolumns[3]and[4]reporttheesimatedpaygapforITOperations.
55
269
Case 2:15-cv-01483-JLR Document 359-10 Filed 02/21/18 Page 57 of 108

CONTAINSCONFIDENTIALMATERIALS
LogPointDifference
T-statisticonLogPointDifference
P-ValuePercent
Difference AdjustedR2EmployeeYears
Model1 -0.075 -25.49 0.00 -7.2% 0.009Model2 -0.068 -26.39 0.00 -6.5% 0.344Model3 -0.069 -30.99 0.00 -6.6% 0.507Model4 -0.056 -26.93 0.00 -5.5% 0.557Model5 -0.026 -22.66 0.00 -2.6% 0.761Model6 -0.019 -18.80 0.00 -1.9% 0.806
Model1:GenderistheonlyexplanatoryvariableModel2:Addscontrolsfor"compensationyear",employeeage(anditssquare),employeetenureatMicrosoft(anditssquare),stateinwhichtheemployeeworks,cityinwhichtheemployeeworks,andPayScaleTypeModel3:Addscontrolsforemployees'performanceratingsModel4:AddscontrolsforDiscipline.Model5:AddscontrolsforStandardTitleModel6:AddscontrolsforCareerStage
Table11AnalysisofGenderDifferenceinTotalCompensation
IntroducingCareerStageControls
56
270
Case 2:15-cv-01483-JLR Document 359-10 Filed 02/21/18 Page 58 of 108

CONTAINSCONFIDENTIALMATERIALS
LogPointDifference
T-statisticonLogPointDifference
P-valuePercent
Difference AdjustedR2EmployeeYears
UnmodifiedModel4(Baseline) -0.056 -26.93 0.000 -5.46% 0.557Model4+PartTimeDummy -0.054 -25.92 0.000 -5.22% 0.559Model4+LOADummies -0.054 -24.86 0.000 -5.29% 0.587Model4+PartTimeDummy&LOADummies -0.052 -23.99 0.000 -5.07% 0.589UnmodifiedModel5(Baseline) -0.026 -22.66 0.000 -2.61% 0.761Model5+PartTimeDummy -0.024 -21.13 0.000 -2.38% 0.763Model5+LOADummies -0.025 -20.63 0.000 -2.51% 0.793Model5+PartTimeDummy&LOADummies -0.023 -19.31 0.000 -2.28% 0.795
Note:Foreachofthemodels4and5,IpresentmybaselinefiguresaswellasthreevariationsThefirstvariationaddsadummyvariableforemployee-yearsthatincludeparttimework.Thesecondvariationaddsdummiesindicatingwhethertheemployeetookaleaveofabsencein(1)thecurrentyearand(2)thepreviousyear.Thethirdvariationcombinesbothmodificaitons.
Table12AnalysisofGenderDifferenceinTotalCompensationControlforPartTimeWorkandLOAinModels4and5
57
271
Case 2:15-cv-01483-JLR Document 359-10 Filed 02/21/18 Page 59 of 108

CONTAINSCONFIDENTIALMATERIALS
Table13
Hire Source LogPointDifference
T-statisticonLogPointDifference
P-value PercentDifference AdjustedR2
EmployeeYears
College -0.025 -9.49 0.00 -2.49% 0.692Industry -0.061 -20.47 0.00 -5.88% 0.545
Industry,withControlforInitialStockLevel -0.013 -8.96 0.00 -1.25% 0.859
Hire Source LogPointDifference
T-statisticonLogPointDifference
P-valuePercent
Difference AdjustedR2EmployeeYears
College -0.014 -8.04 0.00 -1.42% 0.773Industry -0.028 -18.08 0.00 -2.74% 0.786
Industry,withControlforInitialStockLevel -0.012 -9.95 0.00 -1.21% 0.876
Table13VariationsonSaad'sHire-SourceRegressions
Model4
Model5
Notes:ThistablepresentstwoversionsofDr.Saad'stableonpg119ofhisreport.WhereDr.SaadlimitstheanalysistoengineeringemployeeshiredafterSept1,2012,IincludeallengineeringemployeesforwhominitialStockLevelisknown(thiswillincludeallengineeringemployeeshiredduringthediscoveryperiod,aswellasolderhiresforwhom"onhirelevel"isnotmissinginthedata.)
ThetoppanelshowstheresultsforModel4,whilethebottomrowshowstheresultsforModel5(themodelDr.Saadpresentedinhistable).
Ineachpanel,thefirstrowpresentsresultsforModel5foremployeeswhose"hiresource"is"College",themiddlerowpresentsresultsforemployeeswhose"hiresource"is"Industry"(whatDr.Saadreferstoas"lateral"hires),andthelastrowisalsoforemployeeswhose"hiresource"is"Industry",withthechangethatdummiesfor"onhirelevel"havebeenaddedtothemodel.
58
272
Case 2:15-cv-01483-JLR Document 359-10 Filed 02/21/18 Page 60 of 108

CONTAINSCONFIDENTIALMATERIALS
CategoriesinHierarchy
LogPointDifference
T-statistic PercentDifference AdjustedR2
EmployeeYears
Baseline N/A -0.056 -26.932 -5.46% 0.557OrgSummary 11 -0.056 -26.917 -5.45% 0.557Org 24 -0.056 -26.920 -5.45% 0.557OrgDetail 164 -0.054 -26.487 -5.30% 0.567FunctionSummary 381 -0.056 -22.028 -5.42% 0.552Function 1019 -0.052 -26.123 -5.06% 0.586FunctionDetail 1624 -0.051 -26.023 -5.00% 0.592OrgExecSummary 11 -0.056 -26.840 -5.43% 0.560OrgExc 45 -0.056 -23.911 -5.45% 0.543OrgExecDetail 243 -0.055 -23.887 -5.36% 0.549FunctionExecSummary 750 -0.054 -23.583 -5.23% 0.563FunctionExec 1360 -0.052 -22.999 -5.04% 0.573FunctionExecDetail 1943 -0.051 -22.643 -4.93% 0.579
BothHierarchies
CostCenter 3201 -0.049 -25.491 -4.81% 0.603
Standalone Organization 8 -0.056 -26.983 -5.46% 0.557
ChannelHierarchy
ExecutiveHierarchy
Notes:EachrowofthistablereportsesimatesbasedonamodifiedversionofModel4,wheredummiesforthespecifiedhierarchyvariablehavebeenaddedtoourstandardModel4.
ThereareseveraloverlappinghierarchiesatMicrosoft:Ihavefulldataformostlevelsofthe"Channel"hierarchy(exceptforthe"functionsummary"level,whichisonlyavailableinlimitedyears).Ihavefulldataforonelevelofthe"Executive"hierarchy,whileavailabilityofdataforotherlevelsarelimitedtoparticularyears.
"CostCenter"formsthebaseofbothhierarchies,while"Organization"ispartofneitherhierarchy.
ChannelHierarchydata(excludingFunctionSummary)andOrgExecSummy,CostCenter,andOrganizationcomefromMSPeople.TheremainingfieldscomefromDr.Saad'sbackupmaterials(archived_people_review_RE2.dta).
Table14Model4withOrganizationalControls
59
273
Case 2:15-cv-01483-JLR Document 359-10 Filed 02/21/18 Page 61 of 108

CONTAINSCONFIDENTIALMATERIALS
CategoriesinHierarchy
LogPointDifference
T-statistic PercentDifference AdjustedR2
EmployeeYears
BaselineModel5 N/A -0.026 -22.656 -2.61% 0.761OrgSummary 11 -0.026 -22.691 -2.61% 0.761Org 24 -0.026 -22.682 -2.61% 0.762OrgDetail 164 -0.026 -22.556 -2.58% 0.765FunctionSummary 381 -0.032 -18.184 -3.11% 0.724Function 1019 -0.026 -22.757 -2.56% 0.771FunctionDetail 1624 -0.026 -22.548 -2.53% 0.773OrgExecSummary 11 -0.026 -22.527 -2.59% 0.763OrgExc 45 -0.030 -19.190 -2.92% 0.732OrgExecDetail 243 -0.029 -19.362 -2.90% 0.733FunctionExecSummary 750 -0.029 -19.165 -2.85% 0.741FunctionExec 1360 -0.028 -18.909 -2.79% 0.745FunctionExecDetail 1943 -0.028 -18.770 -2.76% 0.747
BothHierarchies
CostCenter 3201 -0.025 -22.231 -2.47% 0.777
Standalone Organization 8 -0.026 -22.685 -2.61% 0.762
ChannelHierarchy
ExecutiveHierarchy
Notes:EachrowofthistablereportsesimatesbasedonamodifiedversionofModel5,wheredummiesforthespecifiedhierarchyvariablehavebeenaddedtoourstandardModel5.
ThereareseveraloverlappinghierarchiesatMicrosoft:Ihavefulldataformostlevelsofthe"Channel"hierarchy(exceptforthe"functionsummary"level,whichisonlyavailableinlimitedyears).Ihavefulldataforonelevelofthe"Executive"hierarchy,whileavailabilityofdataforotherlevelsarelimitedtoparticularyears.
"CostCenter"formsthebaseofbothhierarchies,while"Organization"ispartofneitherhierarchy.
ChannelHierarchydata(excludingFunctionSummary)andOrgExecSummy,CostCenter,andOrganizationcomefromMSPeople.TheremainingfieldscomefromDr.Saad'sbackupmaterials(archived_people_review_RE2.dta).
Table15Model5withOrganizationalControls
60
274
Case 2:15-cv-01483-JLR Document 359-10 Filed 02/21/18 Page 62 of 108

CONTA
INSCO
NFIDE
NTIALM
ATER
IALS
Annu
al S
alar
y
596061626364656667
Figu
re 1
Annu
al S
alar
y by
Sto
ck L
evel
, 201
4
61
275
Case 2:15-cv-01483-JLR Document 359-10 Filed 02/21/18 Page 63 of 108
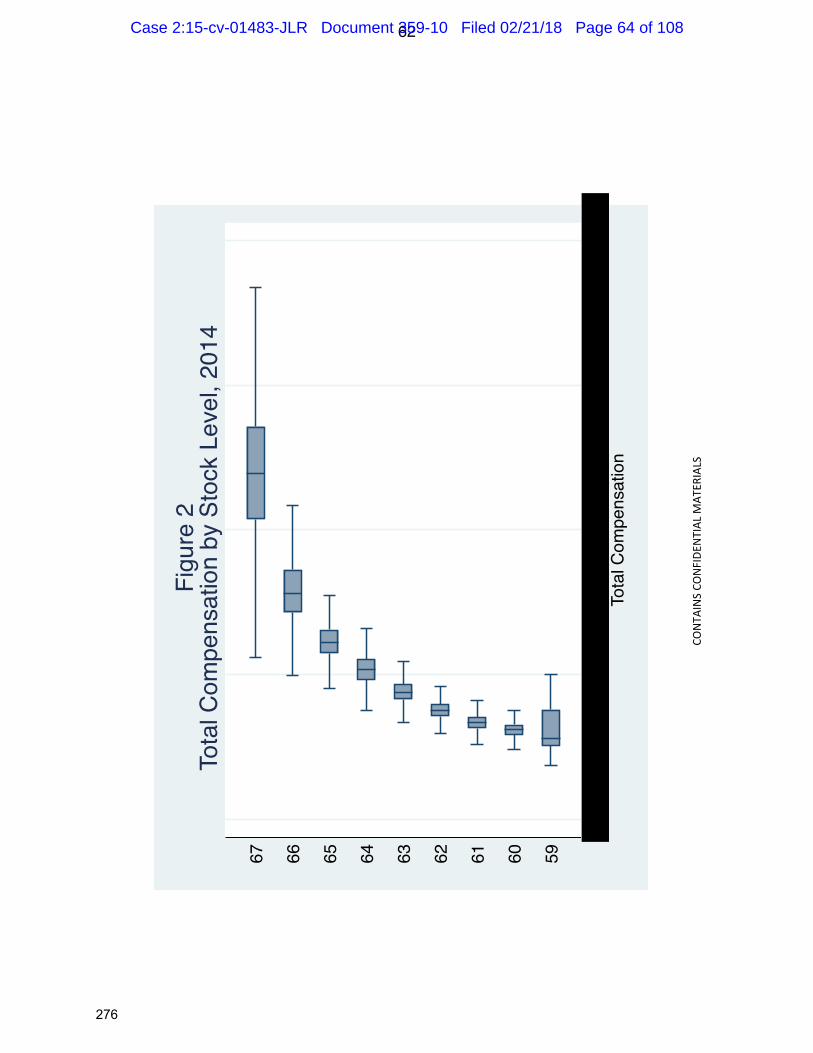
CONTA
INSCO
NFIDE
NTIALM
ATER
IALS
Tota
l Com
pens
atio
n
596061626364656667
Figu
re 2
Tota
l Com
pens
atio
n by
Sto
ck L
evel
, 201
4
62
276
Case 2:15-cv-01483-JLR Document 359-10 Filed 02/21/18 Page 64 of 108

APPENDIX1
63
277
Case 2:15-cv-01483-JLR Document 359-10 Filed 02/21/18 Page 65 of 108

APPENDIX1ATimePeriod:January1,2010–May31,2016
64
278
Case 2:15-cv-01483-JLR Document 359-10 Filed 02/21/18 Page 66 of 108

CONTAINSCONFIDENTIALMATERIALS
Level EmployeeYears CountofWomen PercentWomen CountofMen PercentMen
59 3,317 19.6% 13,626 80.4%60 5,156 21.0% 19,351 79.0%61 7,452 20.9% 28,232 79.1%62 8,040 19.8% 32,615 80.2%63 6,094 16.3% 31,300 83.7%64 3,813 13.7% 23,990 86.3%65 1,795 11.4% 13,946 88.6%66 920 10.0% 8,297 90.0%67 363 6.7% 5,043 93.3%68 151 7.2% 1,938 92.8%69 65 6.3% 970 93.7%70 41 7.2% 532 92.8%80 11 6.7% 152 93.3%81 0 0.0% 23 100.0%82 0 0.0% 8 100.0%83 0 0.0% 4 100.0%0 326 25.3% 964 74.7%
Overall 37,544 17.2% 180,991 82.8%
Note:StockLevel0isnotdirectlycomparabletootherStockLevels.MicrosoftassignsemployeestoStockLevel0whiletheyareawaitingassignmenttoaStandardLevel.
ThisisallworkersemployedinEngineeringorITProfessionsinthelistedStockLevelswhoseannualsalaryisgreaterthan$1.AnnualSalaryiscodedas"1"duringperiodsinwhichanemployeeisengagedinaJointVenturewithanothercompany,andtheothercompany,ratherthanMicrosoft,processesthatemployee'spayroll.
TABLE1AGenderCountsbyStockLevel
DroppingAllEmployeeYearsinwhichanEmployeewasaManagerofManagers
In-ClassStockLevel
Out-of-ClassStockLevel
65
279
Case 2:15-cv-01483-JLR Document 359-10 Filed 02/21/18 Page 67 of 108

CONTAINSCONFIDENTIALMATERIALS
Year DifferenceT-StatisticonDifference PctDifference
T-StatisticonPctDiff EmployeeYears
[2] [3] [4] [5]2011 -18.53 -7.7% -20.532012 -20.08 -6.9% -20.592013 -20.83 -6.9% -20.142014 -19.70 -6.8% -19.712015 -19.90 -7.1% -19.902016 -19.75 -7.3% -19.27Overall -26.80 -7.2% -47.08
TABLE2ADifferencebetweenWomen'sandMen'sTotalCompensationbyYear
ThissampleincludesworkersinEngineeringorITOperationsProfessionsinStockLevels59-67whoarenotemployedinanyprofessionsotherthanEngineeringorITOperationsatanypointinthesalaryyear,andwhobegintheyearinStockLevels59-67.Additionally,thissampleislimitedtoemployee-yearswithnon-missingvaluesfortenureandage.Ihavealsodroppedemployee-yearsinwhichannualsalaryis1,orinwhichCareerStageisoneofthefollowing:ATR-C;ATR-D;ATR-E;IC-0;orMA.
AnnualSalaryiscodedas"1"duringperiodsinwhichanemployeeinengagedinaJointVenturewithanothercompany,andtheothercompany,ratherthanMicrosoft,processesthatemployee'spayroll.
NegativevaluesinColumns[1]or[3]representloweraveragecompensationforFemaleTechnicalEmployees.
DroppingAllEmployeeYearsinwhichanEmployeewasaManagerofManagers
66
280
Case 2:15-cv-01483-JLR Document 359-10 Filed 02/21/18 Page 68 of 108
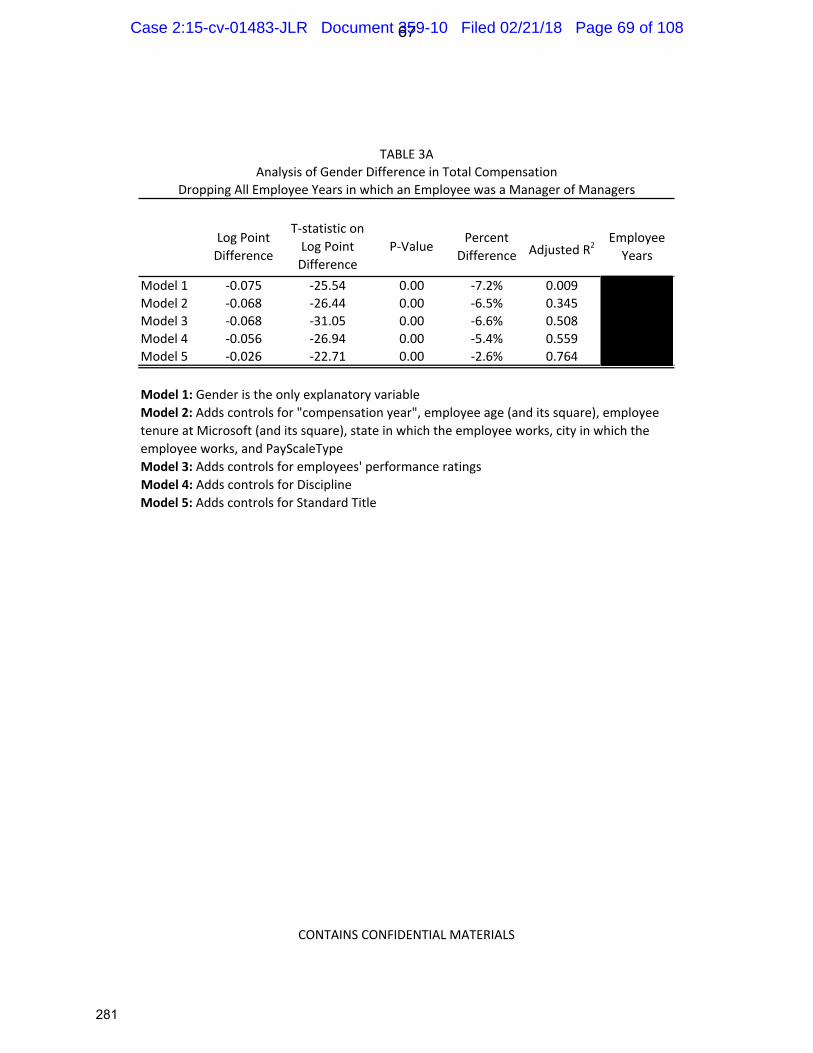
CONTAINSCONFIDENTIALMATERIALS
LogPoint
Difference
T-statisticon
LogPoint
Difference
P-ValuePercent
DifferenceAdjustedR
2Employee
Years
Model1 -0.075 -25.54 0.00 -7.2% 0.009
Model2 -0.068 -26.44 0.00 -6.5% 0.345
Model3 -0.068 -31.05 0.00 -6.6% 0.508
Model4 -0.056 -26.94 0.00 -5.4% 0.559
Model5 -0.026 -22.71 0.00 -2.6% 0.764
Model1:GenderistheonlyexplanatoryvariableModel2:Addscontrolsfor"compensationyear",employeeage(anditssquare),employee
tenureatMicrosoft(anditssquare),stateinwhichtheemployeeworks,cityinwhichthe
employeeworks,andPayScaleType
Model3:Addscontrolsforemployees'performanceratings
Model4:AddscontrolsforDisciplineModel5:AddscontrolsforStandardTitle
TABLE3A
AnalysisofGenderDifferenceinTotalCompensation
DroppingAllEmployeeYearsinwhichanEmployeewasaManagerofManagers
67
281
Case 2:15-cv-01483-JLR Document 359-10 Filed 02/21/18 Page 69 of 108

CONTAINSCONFIDENTIALMATERIALS
CoefficientonFemale
T-statistic EmployeeYears
ContributionRanking -0.018 -0.98CommitmentRating -0.035 -1.84PerformanceRating 0.006 0.46RewardOutcome 0.005 0.35
RelevantTimePeriodforEachMetric:ContributionRanking: 2011CommitmentRating: 2011PerformanceRating: 2012-2014RewardOutcome: 2015-2016
Thistablereportstheresultsoforder-probitanalysesofemployeeperformanceratings.EachrowofthistableconcernsadistinctperformancemetricusedbyMicrosoft.Theonlyexplanatoryvariableineachanalysisisgender.
TABLE4AAnalysisofGenderDifferenceinPeformanceMetrics
DroppingAllEmployeeYearsinwhichanEmployeewasaManagerofManagers
68
282
Case 2:15-cv-01483-JLR Document 359-10 Filed 02/21/18 Page 70 of 108
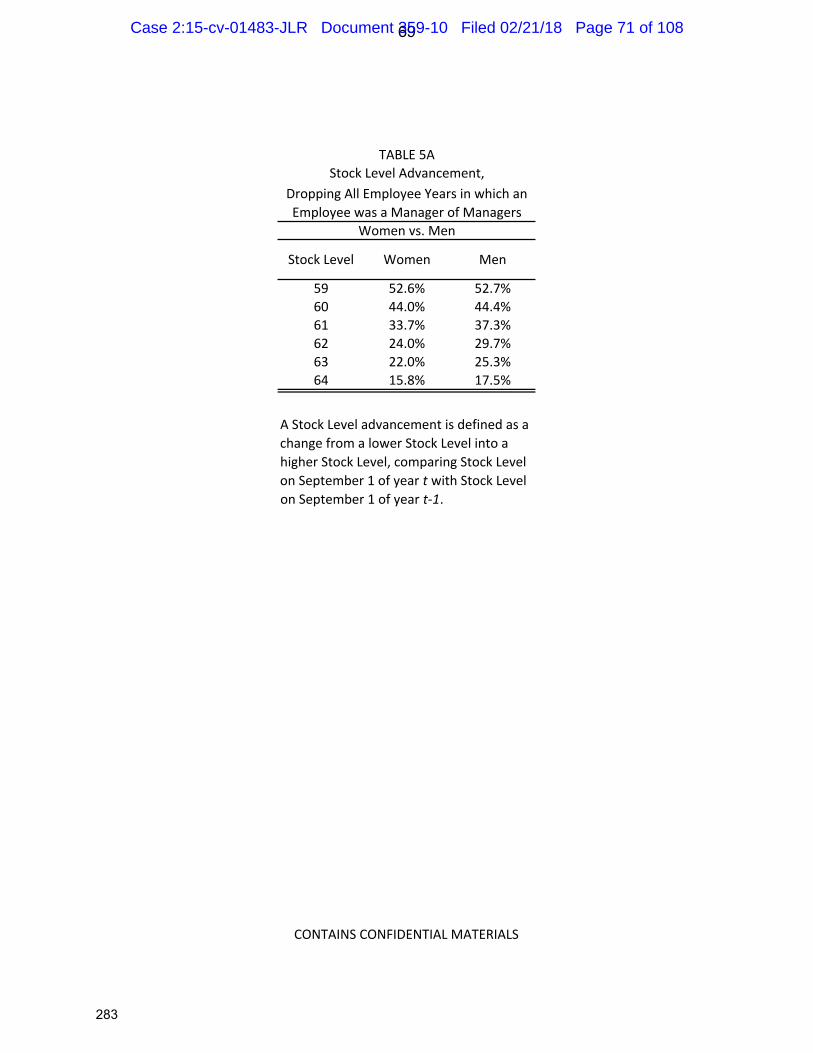
CONTAINSCONFIDENTIALMATERIALS
StockLevel Women Men
59 52.6% 52.7%60 44.0% 44.4%61 33.7% 37.3%62 24.0% 29.7%63 22.0% 25.3%64 15.8% 17.5%
AStockLeveladvancementisdefinedasachangefromalowerStockLevelintoahigherStockLevel,comparingStockLevelonSeptember1ofyeartwithStockLevelonSeptember1ofyeart-1.
StockLevelAdvancement,
Womenvs.Men
TABLE5A
DroppingAllEmployeeYearsinwhichanEmployeewasaManagerofManagers
69
283
Case 2:15-cv-01483-JLR Document 359-10 Filed 02/21/18 Page 71 of 108

CONTAINSCONFIDENTIALMATERIALS
AverageAdvancement
Rate
Difference(MarginalEffect)
Z-statistic EmployeeYears
[1] [2] [3] [4][A]StockLevelAdvancement 0.317 -0.021 -8.937[B]CareerStageAdvancementpriorto2014 0.143 -0.025 -7.586[C]CareerStageAdvancementpost2014 0.231 -0.033 -3.534
TABLE6AStockLevelandCareerStageAdvancementDifferencesforMenandWomen
Basedonaprobitanalysisofanadvancementmeasureontenure,tenuresquared,age,agesquared,year,performancemetrics,location,Discipline,andpriorStockLevelinRow[A]orCareerStageinRows[B]and[C].
DroppingAllEmployeeYearsinwhichanEmployeewasaManagerofManagers
70
284
Case 2:15-cv-01483-JLR Document 359-10 Filed 02/21/18 Page 72 of 108

CONTAINSCONFIDENTIALMATERIALS
StockLevel NumberofObservations
NumberofWoman-Years
NumberofAdvancements,
Women
AdvancementRate,Women
ExpectedAdvancementRate,Women
NumberofExpected
Advancements,Women
ShortfallofAdvancements,
WomenT-Statistic
[1] [2] [3] [4] [5] [6] [7] [8]59 9,513 964 0.526 0.548 1,006 -42 -4.7160 16,844 1,503 0.440 0.444 1,516 -13 -1.1161 24,806 1,754 0.337 0.362 1,886 -132 -8.8962 30,422 1,410 0.240 0.273 1,606 -196 -15.0763 25,346 876 0.220 0.248 990 -114 -12.0464 18,378 362 0.158 0.164 376 -14 -2.62
TotalShortfall,StockLevels59-64: -497
Note:
ReportedCalculationsandResults:
[7]=[3]-[6] ShortfallofAdvancements,Women
[4]=[3]/[2] AdvancementRate,Women[5]:ResultfromProbitModel ExpectedAdvancementRate,Women[6]=[5]x[2] NumberofExpectedAdvancements,Women
Column: Reports:
TABLE7AStockLevelAdvancementShortfall
AStockLeveladvancementisdefinedasachancefromalowerStockLevelintoahigherStockLevel,comparingStockLevelonSeptember1ofyeartwithStockLevelonSemptember1ofyeart-1.
BasedonaprobitanalysisoftheStockLeveladvancementindicatorvariableontenure,tenuresquared,age,agesquared,year,performancemetrics,location,Discipline,andpriorStockLevel.ThismodelisestimatedformenonlyandtheprobabilityofStockLevelAdvancementispredictedforbothmenandwomen.
DroppingAllEmployeeYearsinwhichanEmployeewasaManagerofManagers
71
285
Case 2:15-cv-01483-JLR Document 359-10 Filed 02/21/18 Page 73 of 108

CONTAINSCONFIDENTIALMATERIALS
PercentDifferenceinTotal
CompensationT-statistic AdjustedR2
EmployeeYears
Damages
Model1 -7.2% -26.53 0.009Model2 -6.5% -27.36 0.345Model3 -6.6% -32.14 0.508Model4 -5.4% -27.71 0.559Model5 -2.6% -23.02 0.764
Thetotalin-classcompensationis:
Model1:GenderistheonlyexplanatoryvariableModel2:Addscontrolsfor"compensationyear",employeeage(anditssquare),employeetenureatMicrosoft(anditssquare),stateinwhichtheemployeeworks,cityinwhichtheemployeeworks,andPayScaleTypeModel3:Addscontrolsforemployees'performanceratingsModel4:AddscontrolsforDisciplineModel5:AddscontrolsforStandardTitle
TABLE8ADamagesAnalysis
DroppingAllEmployeeYearsinwhichanEmployeewasaManagerofManagers
72
286
Case 2:15-cv-01483-JLR Document 359-10 Filed 02/21/18 Page 74 of 108

CONTAINSCONFIDENTIALMATERIALS
IexcludeMCareerStages1-3fromthisanalysis.
FIGURE1A
Note:Theheightofeachbarrepresentstheproportionofindividualsineachcareerstage.IexcludeMCareerStages1-3fromthisanalysis.
Note:ThePredicted,NoDiscriminationdistributioniscalculatedbasedonanorderedprobitanalysisthatincludeseachemployee’sage,tenure,location,performanceratings,andDiscipline,aswellasthecompensationyearandanindicatorforfemale.Thecoefficientsofthisanalysisareusedtopredictthefemaledistributionassumingeachfemalewasmale(thefemaleindicatorsettozero)butotherwisehadherobservedcharacteristics.
0.1
.2.3
.4
1 2 3 4 5 6
Combined IC/L/M4-M9 (2011-2016)Career Stage by Gender - True Distribution (Percent)
Female Male
Female Coefficient: -.28 T-Stat: -21.86
0.1
.2.3
.4
1 2 3 4 5 6
Combined IC/L/M4-M9 (2011-2016)Career Stage: True Female Distrbution vs Model 4 (Counterfactual)
True Female Predicted, No Discrimination
73
287
Case 2:15-cv-01483-JLR Document 359-10 Filed 02/21/18 Page 75 of 108

CONTAINSCONFIDENTIALMATERIALS
FIGURE2A
Note:TheheightofeachbarrepresentstheproportionofindividualsineachCareerStage.
Note:ThePredicted,NoDiscriminationdistributioniscalculatedbasedonanorderedprobitanalysisthatincludeseachemployee’sage,tenure,location,performanceratings,andDiscipline,aswellasthecompensationyearandanindicatorforfemale.Thecoefficientsofthisanalysisareusedtopredictthefemaledistributionassumingeachfemalewasmale(thefemaleindicatorsettozero)butotherwisehadherobservedcharacteristics.
0.1
.2.3
.4
1 2 3 4 5 6
Combined IC/L/M, 2014-2016Career Stage by Gender - True Distribution (Percent)
Female Male
Female Coefficient: -.3 T-Stat: -20.29
0.1
.2.3
.4
1 2 3 4 5 6
Combined IC/L/M, 2014-2016Career Stage: True Female Distrbution vs Model 4 (Counterfactual)
True Female Predicted, No Discrimination
74
288
Case 2:15-cv-01483-JLR Document 359-10 Filed 02/21/18 Page 76 of 108
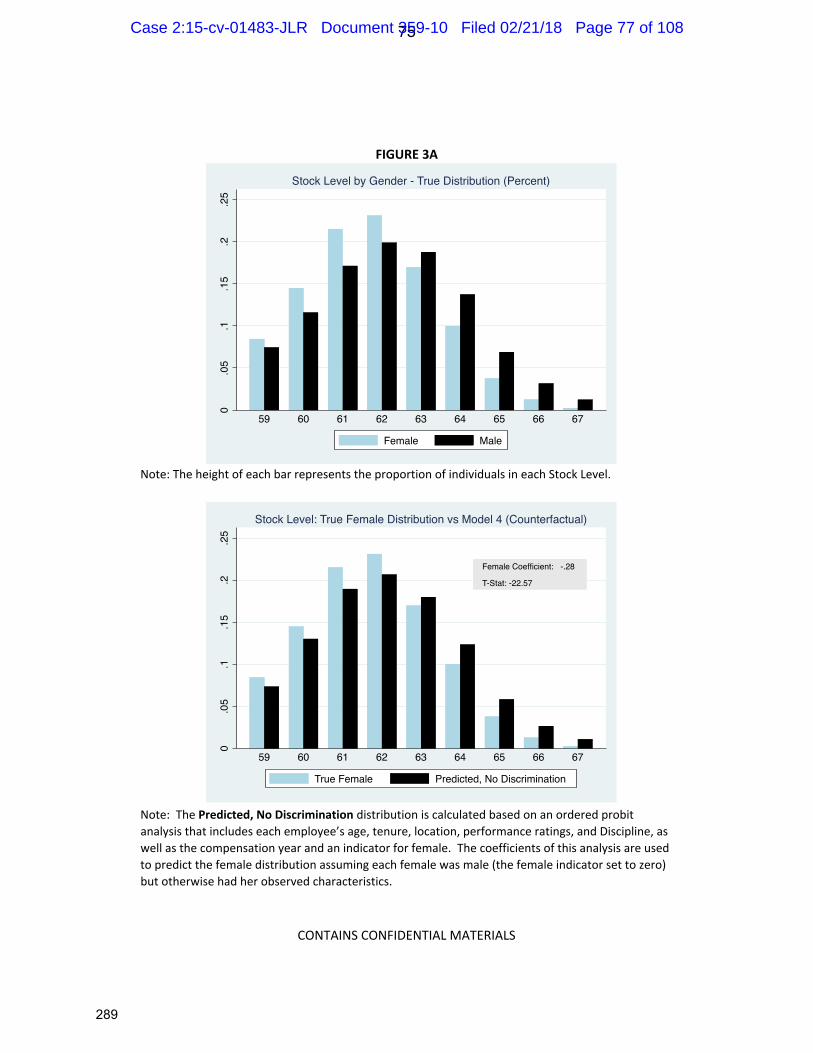
CONTAINSCONFIDENTIALMATERIALS
FIGURE3A
Note:TheheightofeachbarrepresentstheproportionofindividualsineachStockLevel.
Note:ThePredicted,NoDiscriminationdistributioniscalculatedbasedonanorderedprobitanalysisthatincludeseachemployee’sage,tenure,location,performanceratings,andDiscipline,aswellasthecompensationyearandanindicatorforfemale.Thecoefficientsofthisanalysisareusedtopredictthefemaledistributionassumingeachfemalewasmale(thefemaleindicatorsettozero)butotherwisehadherobservedcharacteristics.
0.0
5.1
.15
.2.2
5
59 60 61 62 63 64 65 66 67
Stock Level by Gender - True Distribution (Percent)
Female Male
Female Coefficient: -.28 T-Stat: -22.57
0.0
5.1
.15
.2.2
5
59 60 61 62 63 64 65 66 67
Stock Level: True Female Distribution vs Model 4 (Counterfactual)
True Female Predicted, No Discrimination
75
289
Case 2:15-cv-01483-JLR Document 359-10 Filed 02/21/18 Page 77 of 108
APPENDIX1BTimePeriod:January1,2010–August31,2016
76
290
Case 2:15-cv-01483-JLR Document 359-10 Filed 02/21/18 Page 78 of 108

CONTAINSCONFIDENTIALMATERIALS
Level EmployeeYears CountofWomen PercentWomen CountofMen PercentMen
59 3,310 19.5% 13,635 80.5%60 5,158 21.1% 19,339 78.9%61 7,455 20.9% 28,225 79.1%62 8,048 19.8% 32,634 80.2%63 6,100 16.3% 31,312 83.7%64 3,821 13.7% 24,020 86.3%65 1,799 11.4% 13,953 88.6%66 921 10.0% 8,300 90.0%67 363 6.7% 5,046 93.3%68 151 7.2% 1,938 92.8%69 65 6.3% 970 93.7%70 41 7.2% 532 92.8%80 11 6.7% 152 93.3%81 0 0.0% 23 100.0%82 0 0.0% 8 100.0%83 0 0.0% 4 100.0%0 325 25.3% 962 74.7%
overall 37,568 17.2% 181,053 82.8%
ThisisallworkersemployedinEngineeringorITProfessionsinthelistedStockLevelswhoseannualsalaryisgreaterthan$1.AnnualSalaryiscodedas"1"duringperiodsinwhichanemployeeisengagedinaJointVenturewithanothercompany,andtheothercompany,ratherthanMicrosoft,processesthatemployee'spayroll.
TABLE1BGenderCountsbyStockLevel
DroppingAllEmployeeYearsinwhichanEmployeewasaManagerofManagers
In-ClassStockLevel
Out-of-ClassStockLevel
Note:StockLevel0isnotdirectlycomparabletootherStockLevels.MicrosoftassignsemployeestoStockLevel0whiletheyareawaitingassignmenttoaStandardLevel.
77
291
Case 2:15-cv-01483-JLR Document 359-10 Filed 02/21/18 Page 79 of 108

CONTAINSCONFIDENTIALMATERIALS
Year Difference T-StatisticonDifference
PercentDifference T-StatisticonPercentDifference
EmployeeYears
[1] [2] [3] [4] [5]2011 -18.53 -7.7% -20.532012 -20.08 -6.9% -20.592013 -20.83 -6.9% -20.142014 -19.70 -6.8% -19.712015 -19.90 -7.1% -19.902016 -19.14 -7.3% -18.89Overall -26.75 -7.2% -46.88
NegativevaluesinColumns[1]or[3]representloweraveragecompensationforFemaleTechnicalEmployees.
TABLE2BDifferencebetweenWomen'sandMen'sTotalCompensationbyYear
DroppingAllEmployeeYearsinwhichanEmployeewasaManagerofManagers
ThissampleincludesworkersinEngineeringorITOperationsProfessionsinStockLevels59-67whoarenotemployedinanyprofessionsotherthanEngineeringorITOperationsatanypointinthesalaryyear,andwhobegintheyearinStockLevels59-67.Additionally,thissampleislimitedtoemployee-yearswithnon-missingvaluesfortenureandage.Ihavealsodroppedemployee-yearsinwhichannualsalaryis1,orinwhichCareerStageisoneofthefollowing:ATR-C;ATR-D;ATR-E;IC-0;orMA.
AnnualSalaryiscodedas"1"duringperiodsinwhichanemployeeinengagedinaJointVenturewithanothercompany,andtheothercompany,ratherthanMicrosoft,processesthatemployee'spayroll.
78
292
Case 2:15-cv-01483-JLR Document 359-10 Filed 02/21/18 Page 80 of 108

CONTAINSCONFIDENTIALMATERIALS
LogPoint
Difference
T-statisticonLog
PointDifferenceP-Value
Percent
DifferenceAdjustedR
2Employee
Years
Model1 -0.075 -25.49 0.00 -7.2% 0.009
Model2 -0.068 -26.39 0.00 -6.5% 0.344
Model3 -0.069 -30.99 0.00 -6.6% 0.507
Model4 -0.056 -26.93 0.00 -5.5% 0.557
Model5 -0.026 -22.66 0.00 -2.6% 0.761
Model1:GenderistheonlyexplanatoryvariableModel2:Addscontrolsfor"compensationyear",employeeage(anditssquare),employeetenure
atMicrosoft(anditssquare),stateinwhichtheemployeeworks,cityinwhichtheemployee
works,andPayScaleType
Model3:Addscontrolsforemployees'performanceratings
Model4:AddscontrolsforDisciplineModel5:AddscontrolsforStandardTitle
TABLE3B
AnalysisofGenderDifferenceinTotalCompensation
DroppingAllEmployeeYearsinwhichanEmployeewasaManagerofManagers
79
293
Case 2:15-cv-01483-JLR Document 359-10 Filed 02/21/18 Page 81 of 108
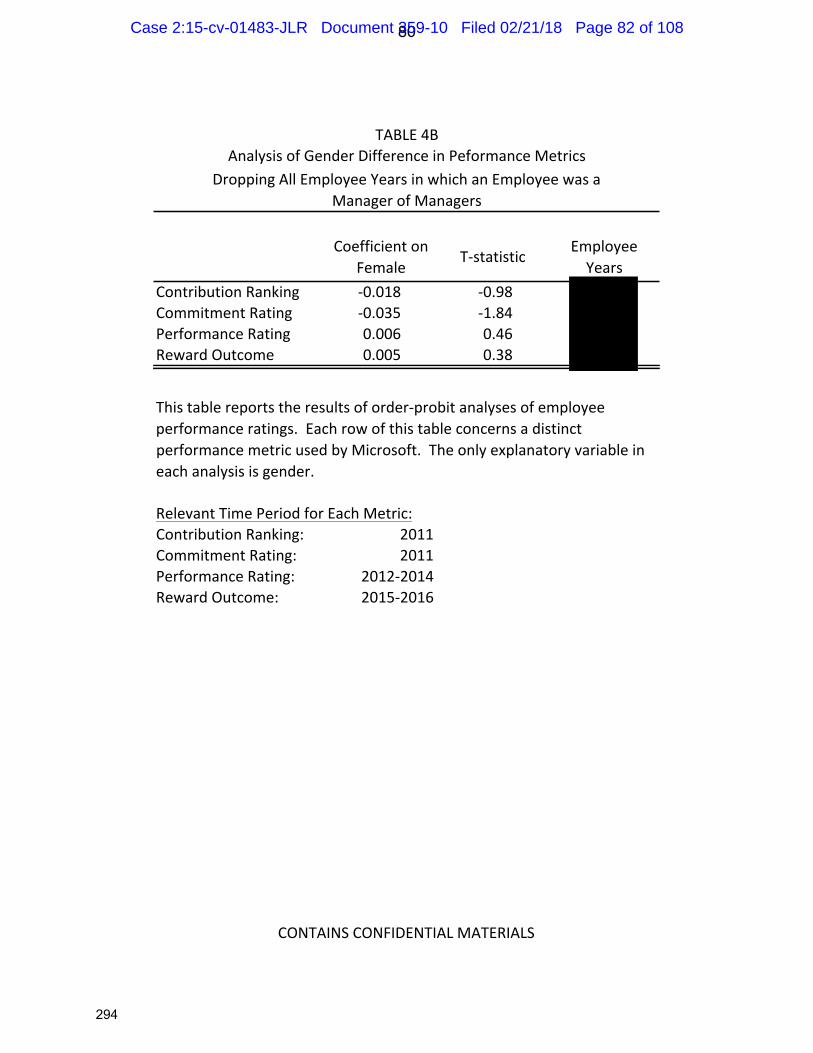
CONTAINSCONFIDENTIALMATERIALS
CoefficientonFemale
T-statistic EmployeeYears
ContributionRanking -0.018 -0.98CommitmentRating -0.035 -1.84PerformanceRating 0.006 0.46RewardOutcome 0.005 0.38
RelevantTimePeriodforEachMetric:ContributionRanking: 2011CommitmentRating: 2011PerformanceRating: 2012-2014RewardOutcome: 2015-2016
Thistablereportstheresultsoforder-probitanalysesofemployeeperformanceratings.EachrowofthistableconcernsadistinctperformancemetricusedbyMicrosoft.Theonlyexplanatoryvariableineachanalysisisgender.
TABLE4BAnalysisofGenderDifferenceinPeformanceMetrics
DroppingAllEmployeeYearsinwhichanEmployeewasaManagerofManagers
80
294
Case 2:15-cv-01483-JLR Document 359-10 Filed 02/21/18 Page 82 of 108

CONTAINSCONFIDENTIALMATERIALS
StockLevel Women Men
59 52.6% 52.7%
60 44.0% 44.4%
61 33.7% 37.3%
62 24.0% 29.7%
63 22.0% 25.3%
64 15.8% 17.5%
TABLE5B
StockLevelAdvancement
Astockleveladvancementisdefinedasa
changefromalowerstocklevelintoa
higherstocklevel,comparingstocklevel
onSeptember1ofyeartwithstocklevelonSeptember1ofyeart-1.
DroppingAllEmployeeYearsinwhichan
EmployeewasaManagerofManagers
Womenvs.Men
81
295
Case 2:15-cv-01483-JLR Document 359-10 Filed 02/21/18 Page 83 of 108

CONTAINSCONFIDENTIALMATERIALS
AverageAdvancement
Rate
Difference(MarginalEffect)
Z-statistic EmployeeYears
[1] [2] [3] [4][A]StockLevelAdvancement 0.317 -0.021 -8.897[B]CareerStageAdvancementpriorto2014 0.143 -0.025 -7.586[C]CareerStageAdvancementpost2014 0.231 -0.033 -3.519
TABLE6BStockLevelandCareerStageAdvancementDifferencesforMenandWomen
DroppingallEmployeeYearsinwhichanEmployeewasaManagerofManagers
Basedonaprobitanalysisofanadvancementmeasureontenure,tenuresquared,age,agesquared,year,performancemetrics,location,Discipline,andpriorStockLevelinRow[A]orCareerStageinRows[B]and[C].
82
296
Case 2:15-cv-01483-JLR Document 359-10 Filed 02/21/18 Page 84 of 108

CONTAINSCONFIDENTIALMATERIALS
StockLevel NumberofObservations
NumberofWoman-Years
NumberofAdvancements,
Women
AdvancementRate,Women
ExpectedAdvancementRate,Women
NumberofExpected
Advancements,Women
ShortfallofAdvancements,
WomenT-Statistic
[1] [2] [3] [4] [5] [6] [7] [8]59 9,516 965 0.526 0.551 1,012 -47 -3.0860 16,847 1,503 0.440 0.448 1,531 -28 -1.1061 24,814 1,756 0.337 0.366 1,905 -149 -5.2362 30,434 1,411 0.240 0.275 1,617 -206 -10.4163 25,359 878 0.220 0.250 999 -121 -7.7364 18,381 362 0.158 0.165 378 -16 -2.80
-539
Note:
ReportedCalculationsandResults:
[5]:ResultfromProbitModel ExpectedAdvancementRate,Women[6]=[5]x[2] NumberofExpectedAdvancements,Women[7]=[3]-[6] ShortfallofAdvancements,Women
BasedonaprobitanalysisoftheStockLeveladvancementindicatorvariableontenure,tenuresquared,age,agesquared,year,performancemetrics,location,Discipline,andpriorStockLevel.ThismodelisestimatedformenonlyandtheprobabilityofStockLeveladvancementispredictedforbothmenandwomen.
Column: Reports:[4]=[3]/[2] AdvancementRate,Women
AStockLeveladvancementisdefinedasachangefromalowerStockLevelintoahigherStockLevel,comparingStockLevelonSeptember1ofyeartwithStockLevelonSeptember1ofyeart-1.
TABLE7BStockLevelAdvancementShortfall
DroppingallEmployeeYearsinwhichanEmployeewasaManagerofManagers
TotalShortfall,StockLevels59-64:
83
297
Case 2:15-cv-01483-JLR Document 359-10 Filed 02/21/18 Page 85 of 108

CONTAINSCONFIDENTIALMATERIALS
PercentDifferenceinTotal
CompensationT-statistic AdjustedR2
EmployeeYears
Damages
Model1 -7.2% -26.47 0.009Model2 -6.5% -27.30 0.344Model3 -6.6% -32.08 0.507Model4 -5.5% -27.70 0.557Model5 -2.6% -22.96 0.761
Thetotalin-classcompensationis:
Model1:GenderistheonlyexplanatoryvariableModel2:Addscontrolsfor"compensationyear",employeeage(anditssquare),employeetenureatMicrosoft(anditssquare),stateinwhichtheemployeeworks,cityinwhichtheemployeeworks,andPayScaleTypeModel3:Addscontrolsforemployees'performanceratingsModel4:AddscontrolsforDisciplineModel5:AddscontrolsforStandardTitle
TABLE8BDamagesAnalysis
DroppingAllEmployeeYearsinwhichanEmployeewasaManagerofManagers
84
298
Case 2:15-cv-01483-JLR Document 359-10 Filed 02/21/18 Page 86 of 108

CONTAINSCONFIDENTIALMATERIALS
IexcludeMCareerStages1-3fromthisanalysis.
FIGURE1B
Note:Theheightofeachbarrepresentstheproportionofindividualsineachcareerstage.IexcludeMCareerStages1-3fromthisanalysis.
Note:ThePredicted,NoDiscriminationdistributioniscalculatedbasedonanorderedprobitanalysisthatincludeseachemployee’sage,tenure,location,performanceratings,andDiscipline,aswellasthecompensationyearandanindicatorforfemale.Thecoefficientsofthisanalysisareusedtopredictthefemaledistributionassumingeachfemalewasmale(thefemaleindicatorsettozero)butotherwisehadherobservedcharacteristics.
0.1
.2.3
.4
1 2 3 4 5 6
Combined IC/L/M4-M9 (2011-2016)Career Stage by Gender - True Distribution (Percent)
Female Male
Female Coefficient: -.28 T-Stat: -21.85
0.1
.2.3
.4
1 2 3 4 5 6
Combined IC/L/M4-M9 (2011-2016)Career Stage: True Female Distrbution vs Model 4 (Counterfactual)
True Female Predicted, No Discrimination
85
299
Case 2:15-cv-01483-JLR Document 359-10 Filed 02/21/18 Page 87 of 108

CONTAINSCONFIDENTIALMATERIALS
FIGURE2B
Note:TheheightofeachbarrepresentstheproportionofindividualsineachCareerStage.
Note:ThePredicted,NoDiscriminationdistributioniscalculatedbasedonanorderedprobitanalysisthatincludeseachemployee’sage,tenure,location,performanceratings,andDiscipline,aswellasthecompensationyearandanindicatorforfemale.Thecoefficientsofthisanalysisareusedtopredictthefemaledistributionassumingeachfemalewasmale(thefemaleindicatorsettozero)butotherwisehadherobservedcharacteristics.
0.1
.2.3
.4
1 2 3 4 5 6
Combined IC/L/M, 2014-2016Career Stage by Gender - True Distribution (Percent)
Female Male
Female Coefficient: -.3 T-Stat: -20.29
0.1
.2.3
.4
1 2 3 4 5 6
Combined IC/L/M, 2014-2016Career Stage: True Female Distrbution vs Model 4 (Counterfactual)
True Female Predicted, No Discrimination
86
300
Case 2:15-cv-01483-JLR Document 359-10 Filed 02/21/18 Page 88 of 108
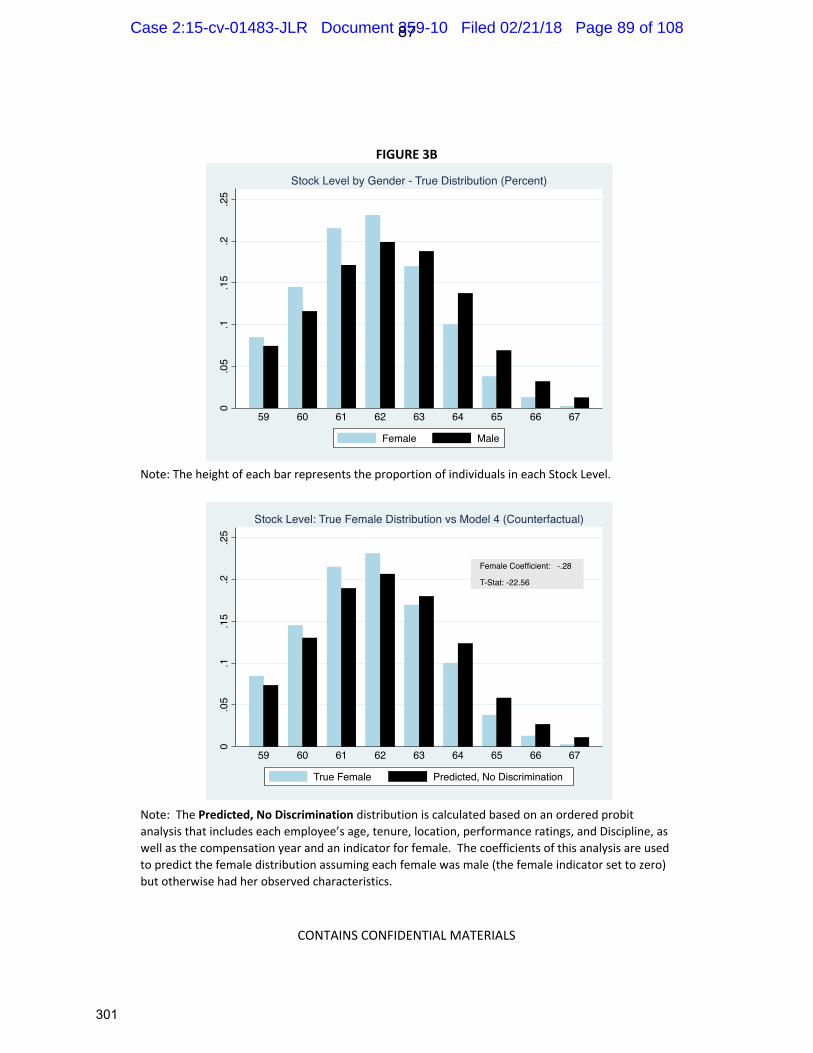
CONTAINSCONFIDENTIALMATERIALS
FIGURE3B
Note:TheheightofeachbarrepresentstheproportionofindividualsineachStockLevel.
Note:ThePredicted,NoDiscriminationdistributioniscalculatedbasedonanorderedprobitanalysisthatincludeseachemployee’sage,tenure,location,performanceratings,andDiscipline,aswellasthecompensationyearandanindicatorforfemale.Thecoefficientsofthisanalysisareusedtopredictthefemaledistributionassumingeachfemalewasmale(thefemaleindicatorsettozero)butotherwisehadherobservedcharacteristics.
0.0
5.1
.15
.2.2
5
59 60 61 62 63 64 65 66 67
Stock Level by Gender - True Distribution (Percent)
Female Male
Female Coefficient: -.28 T-Stat: -22.56
0.0
5.1
.15
.2.2
5
59 60 61 62 63 64 65 66 67
Stock Level: True Female Distribution vs Model 4 (Counterfactual)
True Female Predicted, No Discrimination
87
301
Case 2:15-cv-01483-JLR Document 359-10 Filed 02/21/18 Page 89 of 108

APPENDIX1CTimePeriod:September1,2012–August31,2016
88
302
Case 2:15-cv-01483-JLR Document 359-10 Filed 02/21/18 Page 90 of 108
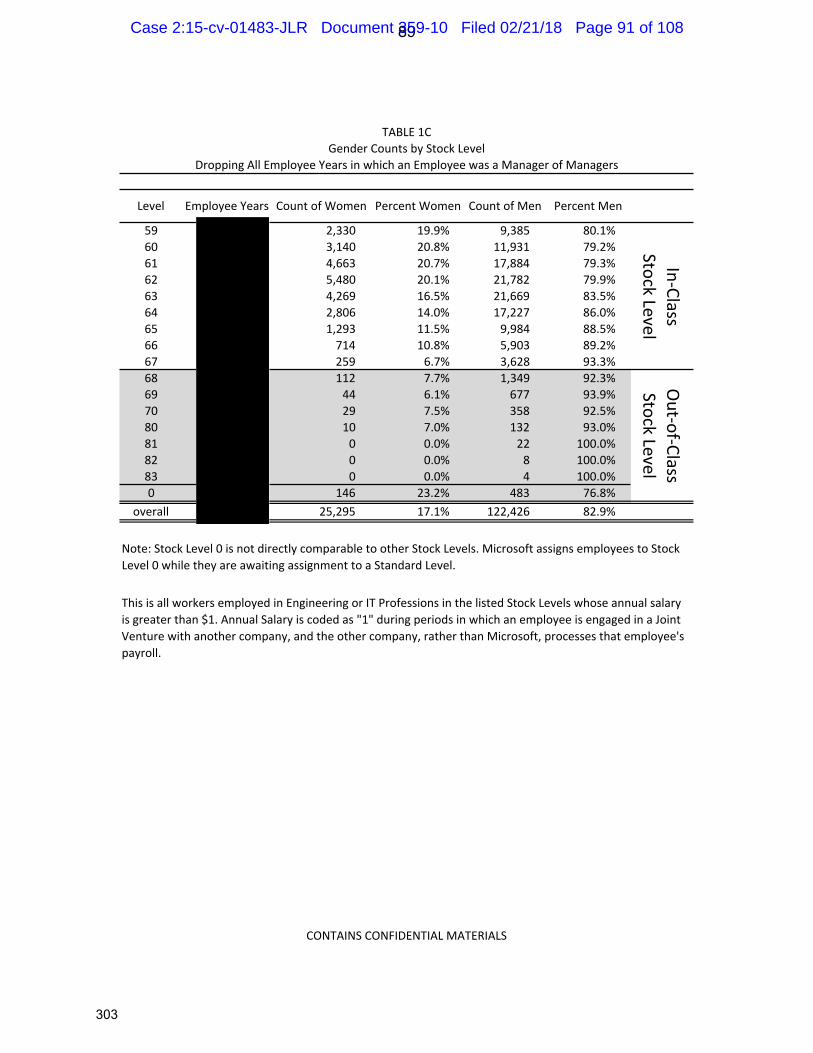
CONTAINSCONFIDENTIALMATERIALS
Level EmployeeYears CountofWomen PercentWomen CountofMen PercentMen
59 2,330 19.9% 9,385 80.1%60 3,140 20.8% 11,931 79.2%61 4,663 20.7% 17,884 79.3%62 5,480 20.1% 21,782 79.9%63 4,269 16.5% 21,669 83.5%64 2,806 14.0% 17,227 86.0%65 1,293 11.5% 9,984 88.5%66 714 10.8% 5,903 89.2%67 259 6.7% 3,628 93.3%68 112 7.7% 1,349 92.3%69 44 6.1% 677 93.9%70 29 7.5% 358 92.5%80 10 7.0% 132 93.0%81 0 0.0% 22 100.0%82 0 0.0% 8 100.0%83 0 0.0% 4 100.0%0 146 23.2% 483 76.8%
overall 25,295 17.1% 122,426 82.9%
ThisisallworkersemployedinEngineeringorITProfessionsinthelistedStockLevelswhoseannualsalaryisgreaterthan$1.AnnualSalaryiscodedas"1"duringperiodsinwhichanemployeeisengagedinaJointVenturewithanothercompany,andtheothercompany,ratherthanMicrosoft,processesthatemployee'spayroll.
In-ClassStockLevel
Out-of-ClassStockLevel
TABLE1CGenderCountsbyStockLevel
DroppingAllEmployeeYearsinwhichanEmployeewasaManagerofManagers
Note:StockLevel0isnotdirectlycomparabletootherStockLevels.MicrosoftassignsemployeestoStockLevel0whiletheyareawaitingassignmenttoaStandardLevel.
89
303
Case 2:15-cv-01483-JLR Document 359-10 Filed 02/21/18 Page 91 of 108
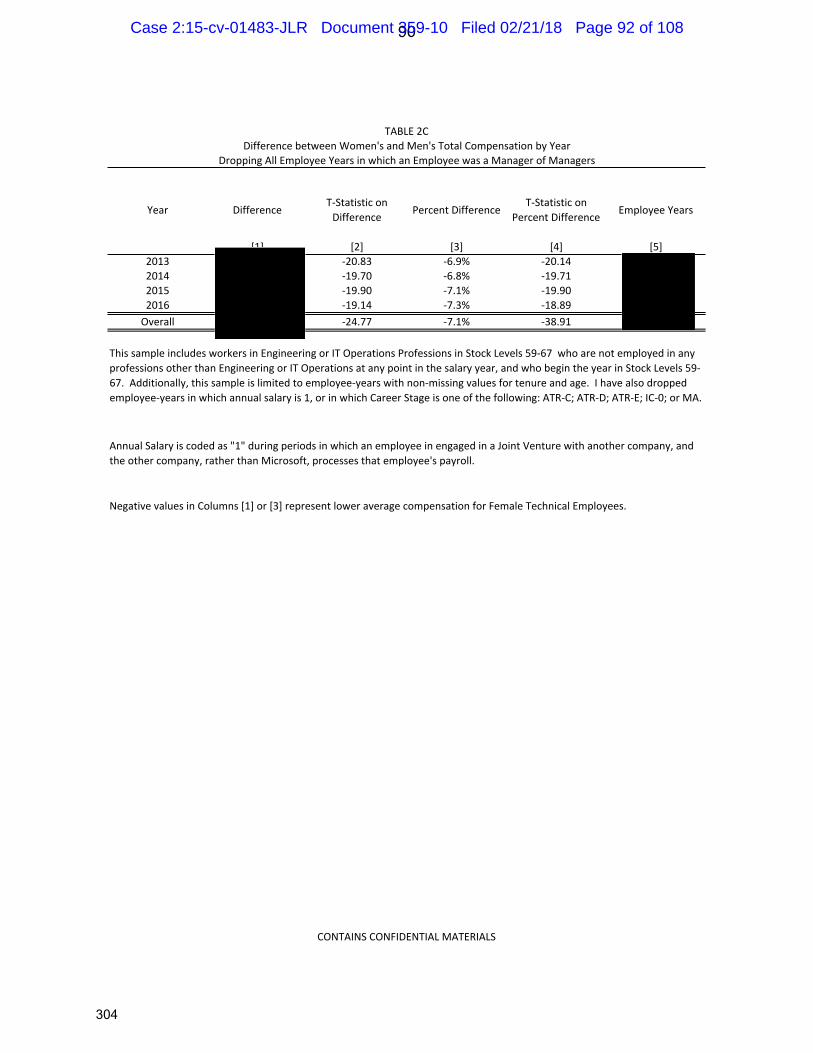
CONTAINSCONFIDENTIALMATERIALS
Year DifferenceT-StatisticonDifference PercentDifference
T-StatisticonPercentDifference EmployeeYears
[1] [2] [3] [4] [5]2013 -20.83 -6.9% -20.142014 -19.70 -6.8% -19.712015 -19.90 -7.1% -19.902016 -19.14 -7.3% -18.89Overall -24.77 -7.1% -38.91
NegativevaluesinColumns[1]or[3]representloweraveragecompensationforFemaleTechnicalEmployees.
TABLE2CDifferencebetweenWomen'sandMen'sTotalCompensationbyYear
DroppingAllEmployeeYearsinwhichanEmployeewasaManagerofManagers
ThissampleincludesworkersinEngineeringorITOperationsProfessionsinStockLevels59-67whoarenotemployedinanyprofessionsotherthanEngineeringorITOperationsatanypointinthesalaryyear,andwhobegintheyearinStockLevels59-67.Additionally,thissampleislimitedtoemployee-yearswithnon-missingvaluesfortenureandage.Ihavealsodroppedemployee-yearsinwhichannualsalaryis1,orinwhichCareerStageisoneofthefollowing:ATR-C;ATR-D;ATR-E;IC-0;orMA.
AnnualSalaryiscodedas"1"duringperiodsinwhichanemployeeinengagedinaJointVenturewithanothercompany,andtheothercompany,ratherthanMicrosoft,processesthatemployee'spayroll.
90
304
Case 2:15-cv-01483-JLR Document 359-10 Filed 02/21/18 Page 92 of 108

CONTAINSCONFIDENTIALMATERIALS
LogPoint
Difference
T-statisticon
LogPoint
Difference
P-Value
Percent
DifferenceAdjustedR
2
Employee
Years
Model1 -0.074 -23.26 0.00 -7.1% 0.009
Model2 -0.064 -23.81 0.00 -6.2% 0.333
Model3 -0.065 -27.82 0.00 -6.3% 0.495
Model4 -0.056 -25.11 0.00 -5.4% 0.537
Model5 -0.027 -20.19 0.00 -2.7% 0.739
Model1:GenderistheonlyexplanatoryvariableModel2:Addscontrolsfor"compensationyear",employeeage(anditssquare),employee
tenureatMicrosoft(anditssquare),stateinwhichtheemployeeworks,cityinwhichthe
employeeworks,andPayScaleType
Model3:Addscontrolsforemployees'performanceratings
Model4:AddscontrolsforDisciplineModel5:AddscontrolsforStandardTitle
TABLE3C
AnalysisofGenderDifferenceinTotalCompensation
DroppingAllEmployeeYearsinwhichanEmployeewasaManagerofManagers
91
305
Case 2:15-cv-01483-JLR Document 359-10 Filed 02/21/18 Page 93 of 108

CONTAINSCONFIDENTIALMATERIALS
CoefficientonFemale
T-statistic EmployeeYears
PerformanceRating -0.006 -0.46RewardOutcome 0.005 0.38
RelevantTimePeriodforEachMetric:ContributionRanking: 2011CommitmentRating: 2011PerformanceRating: 2012-2014RewardOutcome: 2015-2016
Thistablereportstheresultsoforder-probitanalysesofemployeeperformanceratings.EachrowofthistableconcernsadistinctperformancemetricusedbyMicrosoft.Theonlyexplanatoryvariableineachanalysisisgender.
TABLE4CAnalysisofGenderDifferenceinPeformanceMetrics
DroppingAllEmployeeYearsinwhichanEmployeewasaManagerofManagers
92
306
Case 2:15-cv-01483-JLR Document 359-10 Filed 02/21/18 Page 94 of 108

CONTAINSCONFIDENTIALMATERIALS
StockLevel Women Men
59 59.0% 56.4%
60 48.6% 49.2%
61 36.8% 40.0%
62 25.8% 32.4%
63 23.4% 26.7%
64 18.0% 20.1%
TABLE5C
StockLevelAdvancement,
Astockleveladvancementisdefinedasa
changefromalowerstocklevelintoa
higherstocklevel,comparingstocklevel
onSeptember1ofyeartwithstocklevelonSeptember1ofyeart-1.
DroppingAllEmployeeYearsinwhichan
EmployeewasaManagerofManagers
Womenvs.Men
93
307
Case 2:15-cv-01483-JLR Document 359-10 Filed 02/21/18 Page 95 of 108

CONTAINSCONFIDENTIALMATERIALS
AverageAdvancement
Rate
Difference(MarginalEffect)
Z-statistic EmployeeYears
[1] [2] [3] [4][A]StockLevelAdvancement 0.339 -0.022 -6.829[B]CareerStageAdvancementpost2014 0.231 -0.033 -3.519
TABLE6CStockLevelandCareerStageAdvancementDifferencesforMenandWomen
DroppingallEmployeeYearsinwhichanEmployeewasaManagerofManagers
Basedonaprobitanalysisofanadvancementmeasureontenure,tenuresquared,age,agesquared,year,performancemetrics,location,Discipline,andpriorStockLevelinRow[A]orCareerStageinRow[B].
94
308
Case 2:15-cv-01483-JLR Document 359-10 Filed 02/21/18 Page 96 of 108

CONTAINSCONFIDENTIALMATERIALS
StockLevel NumberofObservations
NumberofWoman-Years
NumberofAdvancements,
Women
AdvancementRate,Women
ExpectedAdvancementRate,Women
NumberofExpected
Advancements,Women
ShortfallofAdvancements,
WomenT-Statistic
[1] [2] [3] [4] [5] [6] [7] [8]59 5,578 643 0.590 0.607 662 -19 -3.1860 9,188 878 0.486 0.499 902 -24 -2.7361 13,766 1,066 0.368 0.393 1,138 -72 -6.8862 18,133 913 0.258 0.300 1,059 -146 -12.9463 15,938 591 0.234 0.263 665 -74 -9.3464 12,084 283 0.180 0.187 295 -12 -2.53
-347
Note:
ReportedCalculationsandResults:
[5]:ResultfromProbitModel ExpectedAdvancementRate,Women[6]=[5]x[2] NumberofExpectedAdvancements,Women[7]=[3]-[6] ShortfallofAdvancements,Women
BasedonaprobitanalysisoftheStockLeveladvancementindicatorvariableontenure,tenuresquared,age,agesquared,year,performancemetrics,location,Discipline,andpriorStockLevel.ThismodelisestimatedformenonlyandtheprobabilityofStockLeveladvancementispredictedforbothmenandwomen.
Column: Reports:[4]=[3]/[2] AdvancementRate,Women
AStockLeveladvancementisdefinedasachangefromalowerStockLevelintoahigherStockLevel,comparingStockLevelonSeptember1ofyeartwithStockLevelonSeptember1ofyeart-1.
TABLE7CStockLevelAdvancementShortfall
DroppingallEmployeeYearsinwhichanEmployeewasaManagerofManagers
TotalShortfall,StockLevels59-64:
95
309
Case 2:15-cv-01483-JLR Document 359-10 Filed 02/21/18 Page 97 of 108

CONTAINSCONFIDENTIALMATERIALS
PercentDifferenceinTotal
CompensationT-statistic AdjustedR2
EmployeeYears Damages
Model1 -7.1% -24.14 0.009Model2 -6.2% -24.59 0.333Model3 -6.3% -28.74 0.495Model4 -5.4% -25.82 0.537Model5 -2.7% -20.47 0.739
Thetotalin-classcompensationis:
Thetotalin-classcompensationreportedherediffersfromthefigurereportedinTable8B,becausethiscalculationdropscertainin-classcompensationearnedbetweenMay14,2012andAugust31,2012.
Model1:GenderistheonlyexplanatoryvariableModel2:Addscontrolsfor"compensationyear",employeeage(anditssquare),employeetenureatMicrosoft(anditssquare),stateinwhichtheemployeeworks,cityinwhichtheemployeeworks,andPayScaleTypeModel3:Addscontrolsforemployees'performanceratingsModel4:AddscontrolsforDisciplineModel5:AddscontrolsforStandardTitle
TABLE8CDamagesAnalysis
DroppingAllEmployeeYearsinwhichanEmployeewasaManagerofManagers
96
310
Case 2:15-cv-01483-JLR Document 359-10 Filed 02/21/18 Page 98 of 108

CONTAINSCONFIDENTIALMATERIALS
IexcludeMCareerStages1-3fromthisanalysis.
FIGURE1C
Note:Theheightofeachbarrepresentstheproportionofindividualsineachcareerstage.IexcludeMCareerStages1-3fromthisanalysis.
Note:ThePredicted,NoDiscriminationdistributioniscalculatedbasedonanorderedprobitanalysisthatincludeseachemployee’sage,tenure,location,performanceratings,andDiscipline,aswellasthecompensationyearandanindicatorforfemale.Thecoefficientsofthisanalysisareusedtopredictthefemaledistributionassumingeachfemalewasmale(thefemaleindicatorsettozero)butotherwisehadherobservedcharacteristics.
0.1
.2.3
.4
1 2 3 4 5 6
Combined IC/L/M4-M9 (2013-2016)Career Stage by Gender - True Distribution (Percent)
Female Male
Female Coefficient: -.3 T-Stat: -21
0.1
.2.3
.4
1 2 3 4 5 6
Combined IC/L/M4-M9 (2013-2016)Career Stage: True Female Distrbution vs Model 4 (Counterfactual)
True Female Predicted, No Discrimination
97
311
Case 2:15-cv-01483-JLR Document 359-10 Filed 02/21/18 Page 99 of 108
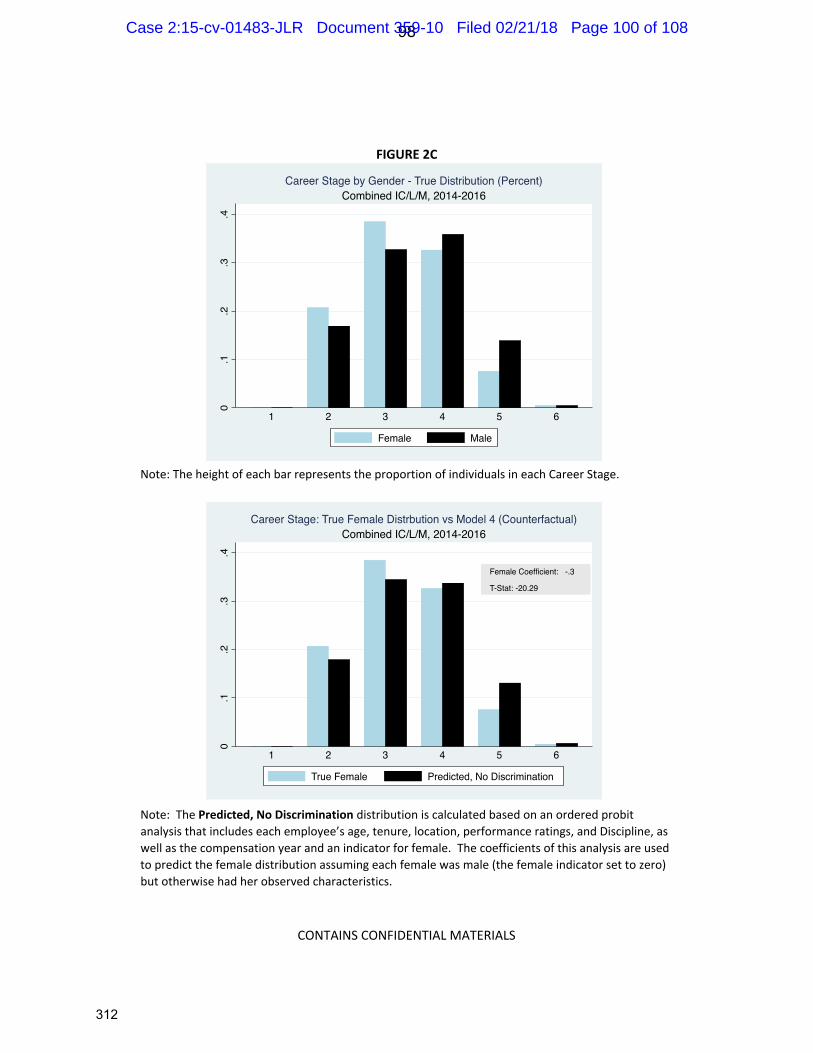
CONTAINSCONFIDENTIALMATERIALS
FIGURE2C
Note:TheheightofeachbarrepresentstheproportionofindividualsineachCareerStage.
Note:ThePredicted,NoDiscriminationdistributioniscalculatedbasedonanorderedprobitanalysisthatincludeseachemployee’sage,tenure,location,performanceratings,andDiscipline,aswellasthecompensationyearandanindicatorforfemale.Thecoefficientsofthisanalysisareusedtopredictthefemaledistributionassumingeachfemalewasmale(thefemaleindicatorsettozero)butotherwisehadherobservedcharacteristics.
0.1
.2.3
.4
1 2 3 4 5 6
Combined IC/L/M, 2014-2016Career Stage by Gender - True Distribution (Percent)
Female Male
Female Coefficient: -.3 T-Stat: -20.29
0.1
.2.3
.4
1 2 3 4 5 6
Combined IC/L/M, 2014-2016Career Stage: True Female Distrbution vs Model 4 (Counterfactual)
True Female Predicted, No Discrimination
98
312
Case 2:15-cv-01483-JLR Document 359-10 Filed 02/21/18 Page 100 of 108

CONTAINSCONFIDENTIALMATERIALS
FIGURE3C
Note:TheheightofeachbarrepresentstheproportionofindividualsineachStockLevel.
Note:ThePredicted,NoDiscriminationdistributioniscalculatedbasedonanorderedprobitanalysisthatincludeseachemployee’sage,tenure,location,performanceratings,andDiscipline,aswellasthecompensationyearandanindicatorforfemale.Thecoefficientsofthisanalysisareusedtopredictthefemaledistributionassumingeachfemalewasmale(thefemaleindicatorsettozero)butotherwisehadherobservedcharacteristics.
0.0
5.1
.15
.2.2
5
59 60 61 62 63 64 65 66 67
Stock Level by Gender - True Distribution (Percent)
Female Male
Female Coefficient: -.28 T-Stat: -21.37
0.0
5.1
.15
.2.2
5
59 60 61 62 63 64 65 66 67
Stock Level: True Female Distribution vs Model 4 (Counterfactual)
True Female Predicted, No Discrimination
99
313
Case 2:15-cv-01483-JLR Document 359-10 Filed 02/21/18 Page 101 of 108

APPENDIX2
100
314
Case 2:15-cv-01483-JLR Document 359-10 Filed 02/21/18 Page 102 of 108

CONTAINSCONFIDENTIALMATERIALS
1. aimstoretainhertalent2. aimstoretainhistalent3. amazonoffer4. aswellasretaininpmc5. attritionrisk6. azurenotificationhubisexpanding7. azuresupportneeds8. azuresupportrequiresengineers9. businessconttinuestoneed
10. businessneedspeopleoperating11. businessneedspeopleoperatingatthisskill12. businessrequirementtohave13. businesswillcontinuetorely14. clearreplacement15. clusterserviceneedsseniordevelopers16. commercespacehasastrongneed17. cost/psthasaneed18. counteroffer19. criticalneedresource20. dmxandiceneed21. donotcurrentlyhaveanyseniorsdets22. doesnotcurrentlyhaveanyseniorsdets23. dspteamhastheneed24. dspteamhastheneedforseniorsoftwareengineers25. ensureretention26. escalationcenter27. facilitateexpansioninnewavenues28. fillvacancies29. fillvacancy30. growthhasincreasedtheneed31. hasaclearneed32. hasaneed33. hastheneedforseniorsoftwareengineers34. hasn'tbeentakencareofinhertimeatmicrosoft35. hasn'tbeentakencareofinhistimeatmicrosoft36. icoulduse37. ineedasenior38. importantwemakethesepartnerteamssuccessful39. increasedtheneedfor40. irreplaceble41. iscriticalthatweretain42. isdefinitelyinneedof43. itisimperativethatthereisaleader44. itisimperativethatthereisaleaderthat45. it'sveryimportanttokeepherintheteam46. jobopening47. keytokeepingbingadsprivatelabinfastructurerunning48. lotofupcomingwork49. mostwantedskill
StringsfromBN_Dictionary.RthatdonotmatchanyPromotionJustificationCommentsin"MRTSample1000.csv"(produced1/31/2018)
101
315
Case 2:15-cv-01483-JLR Document 359-10 Filed 02/21/18 Page 103 of 108

CONTAINSCONFIDENTIALMATERIALS
50. necessaryforthebusinesstohave51. needal6152. needal6253. needal6354. needal6155. needal6256. needal6357. needamoreseniorperson58. needamoreseniorpersontotakeonabiggerrole59. needapm60. needaseniorleveldatascientist61. needforbothbroadanddeepunderstanding62. needtohaveastrongsenioric63. needtoretaingoodtalent64. neededforlong-termsuccess65. needsal6266. needsal6367. needsal6268. needsal6369. needsamoreseniorperson70. needsaseniorleveldatascientist71. needsmoreseniorpms72. needsprincipalengineers73. needsswesatlevel6274. newbranch75. ongoingeffort76. ongoingneedforsuccess77. ongoingneedforthesuccess78. ourdemandforengineers79. ourservicestocontinuetogrow80. outsideopportunities81. promotionaimstoretain82. promotionhelpsusretain83. promotionwillhelpretain84. reactiveretention85. requireaseniorlevelpm86. requiredforcontinuedprogress87. requiresahighlevel88. requiresaseniorlevelpm89. requiresdesigners90. requirespeopleattheseniorlevel91. requiringhighlevelof92. retainastellar93. retainingcorequalitytalent94. retentionofgreatemployees95. retentionrisk96. roleneedperspective97. skippedforpromo98. teamissmallandrequiresahighlevel99. teamsizeissmall100. telemetryteamneeds
102
316
Case 2:15-cv-01483-JLR Document 359-10 Filed 02/21/18 Page 104 of 108
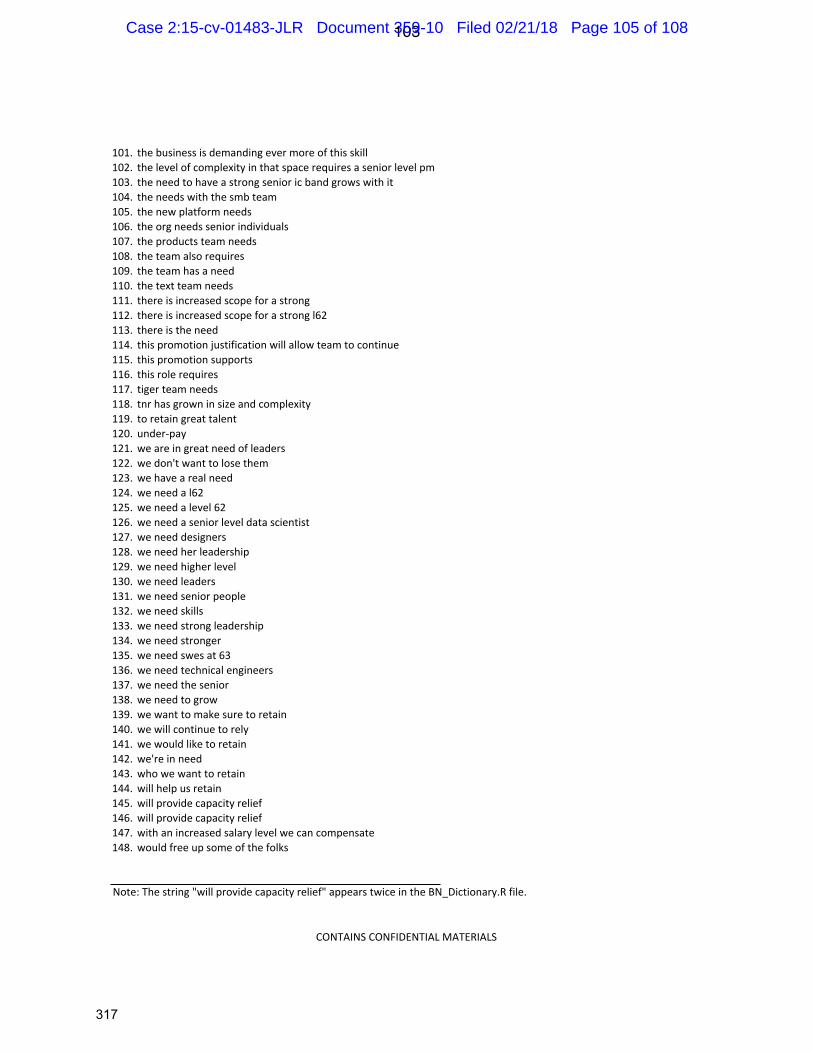
CONTAINSCONFIDENTIALMATERIALS
101. thebusinessisdemandingevermoreofthisskill102. thelevelofcomplexityinthatspacerequiresaseniorlevelpm103. theneedtohaveastrongsenioricbandgrowswithit104. theneedswiththesmbteam105. thenewplatformneeds106. theorgneedsseniorindividuals107. theproductsteamneeds108. theteamalsorequires109. theteamhasaneed110. thetextteamneeds111. thereisincreasedscopeforastrong112. thereisincreasedscopeforastrongl62113. thereistheneed114. thispromotionjustificationwillallowteamtocontinue115. thispromotionsupports116. thisrolerequires117. tigerteamneeds118. tnrhasgrowninsizeandcomplexity119. toretaingreattalent120. under-pay121. weareingreatneedofleaders122. wedon'twanttolosethem123. wehavearealneed124. weneedal62125. weneedalevel62126. weneedaseniorleveldatascientist127. weneeddesigners128. weneedherleadership129. weneedhigherlevel130. weneedleaders131. weneedseniorpeople132. weneedskills133. weneedstrongleadership134. weneedstronger135. weneedswesat63136. weneedtechnicalengineers137. weneedthesenior138. weneedtogrow139. wewanttomakesuretoretain140. wewillcontinuetorely141. wewouldliketoretain142. we'reinneed143. whowewanttoretain144. willhelpusretain145. willprovidecapacityrelief146. willprovidecapacityrelief147. withanincreasedsalarylevelwecancompensate148. wouldfreeupsomeofthefolks
Note:Thestring"willprovidecapacityrelief"appearstwiceintheBN_Dictionary.Rfile.
103
317
Case 2:15-cv-01483-JLR Document 359-10 Filed 02/21/18 Page 105 of 108

APPENDIX3
104
318
Case 2:15-cv-01483-JLR Document 359-10 Filed 02/21/18 Page 106 of 108

Documents Relied Upon
The following are documents relied upon in addition to the documents listed in my October 27, 2017 report. Expert Reports Expert Report of Ali Saad, Ph.D., in the matter of Moussouris et al., v. Microsoft Corporation, January 5, 2018. Errata to the Expert Report of Ali Saad, Ph.D., in the matter of Moussouris et al., v. Microsoft Corporation, February 5, 2018. Report of Henry S. Farber, in the Matter of Katherina Moussouris, Holly Muenchow, Dana Piermarini et al., v. Microsoft Corporation, October 27, 2017. Corrected Expert Report of Henry Farber, Ph.D., in the Matter of Moussouris et al., v. Microsoft Corporation, December 5, 2017. Documents Produced by Experts “MRT Sample 1000.csv” BN_Dictionary Case Documents Deposition of Ali Saad, Ph.D., January 30, 2018. MSFT_MOUSSOURIS_00010979.xlsx MSFT_MOUSSOURIS_00308243 Academic Literature ABA Section of Antitrust Law, Econometrics (2005) at p. 15. Duan, Naihua, “Smearing Estimate: A Nonparametric Retransformation Model.” Journal of the American Statistical Association., Volume 78, No. 383 (September 1983), pp. 605-610. Haan, C., E. Reardon, and A. Saad, “Employment Discrimination Litigation,” chapter in Litigation Services Handbook, ed., by Roman Weil, et al., 2012. Piette, Michael and White, Paul, “Approaches for Dealing with Small Sample Sizes in Employment Discrimination Litigation,” Journal of Forensic Economists, 12(1), 1999, pp. 43-56 Publicly Available Data Francis Galton Height Data https://dataverse.harvard.edu/dataset.xhtml?persistentId=doi:10.7910/DVN/T0HSJ1
105
319
Case 2:15-cv-01483-JLR Document 359-10 Filed 02/21/18 Page 107 of 108
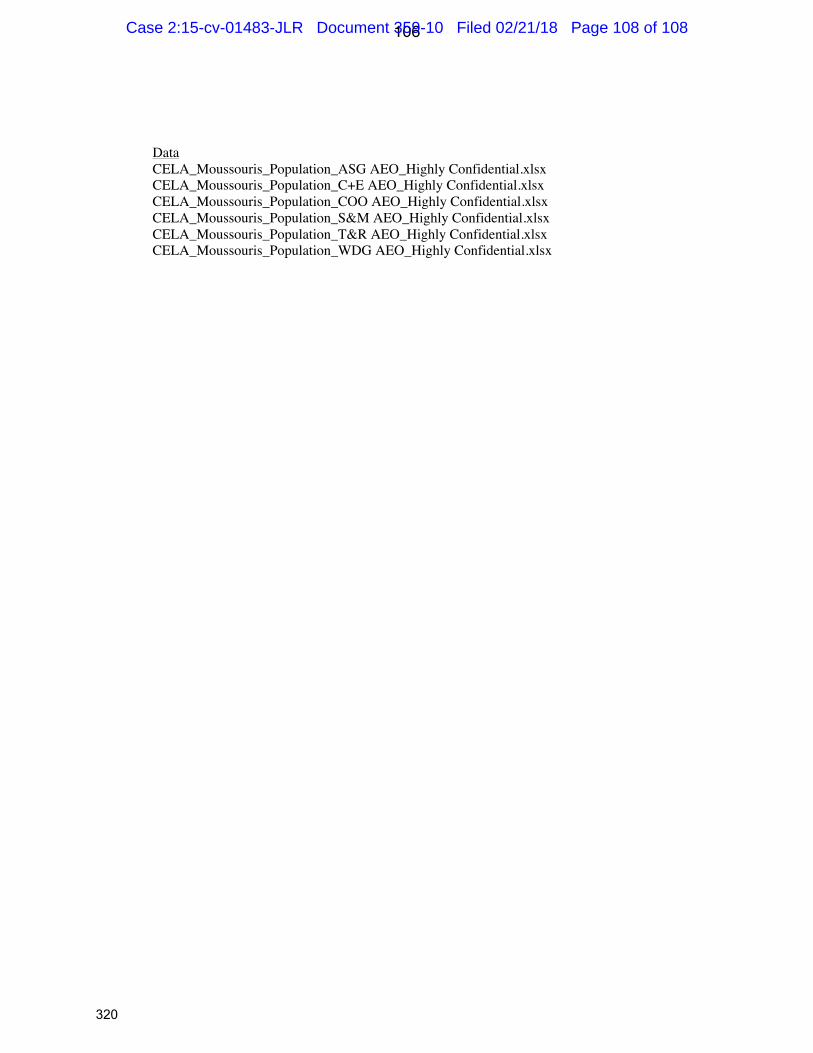
Data CELA_Moussouris_Population_ASG AEO_Highly Confidential.xlsx CELA_Moussouris_Population_C+E AEO_Highly Confidential.xlsx CELA_Moussouris_Population_COO AEO_Highly Confidential.xlsx CELA_Moussouris_Population_S&M AEO_Highly Confidential.xlsx CELA_Moussouris_Population_T&R AEO_Highly Confidential.xlsx CELA_Moussouris_Population_WDG AEO_Highly Confidential.xlsx
106
320
Case 2:15-cv-01483-JLR Document 359-10 Filed 02/21/18 Page 108 of 108