Expert Meeting on the Impact of FDI on...
15
Expert Meeting on the Impact of FDI on Development Robert Hejzak Director of Marketing CzechInvest R&D investment promotion
Transcript of Expert Meeting on the Impact of FDI on...
Expert Meeting on the Impact of FDI on Development
Robert HejzakDirector of MarketingCzechInvest
R&D investment promotion

Policy development
-- global trends vs. CEE experience
-- supply vs. demand factors
-- how to benefit how to attract how to sustain
-- macro policies vs. micro policies

Road to Success in R&D
-- Physical infrastucture (ICT)
-- Regulatory framework
-- Fiscal and financial measures
-- CzechInvest strategy and tools

Expenditure on R&D
Czech
Rep
ublic
Hungar
y
Eston
ia
Polan
d
Slova
kia
Source: IMD World Competitiveness Yearbook, 2003
The Czech Republic spends more resources on Research and Development than many of its competitor countries
USD per capita
% of GPD
0.675
0.7910.904
1.303
0.65472.4
4631.6 30.7 24.8
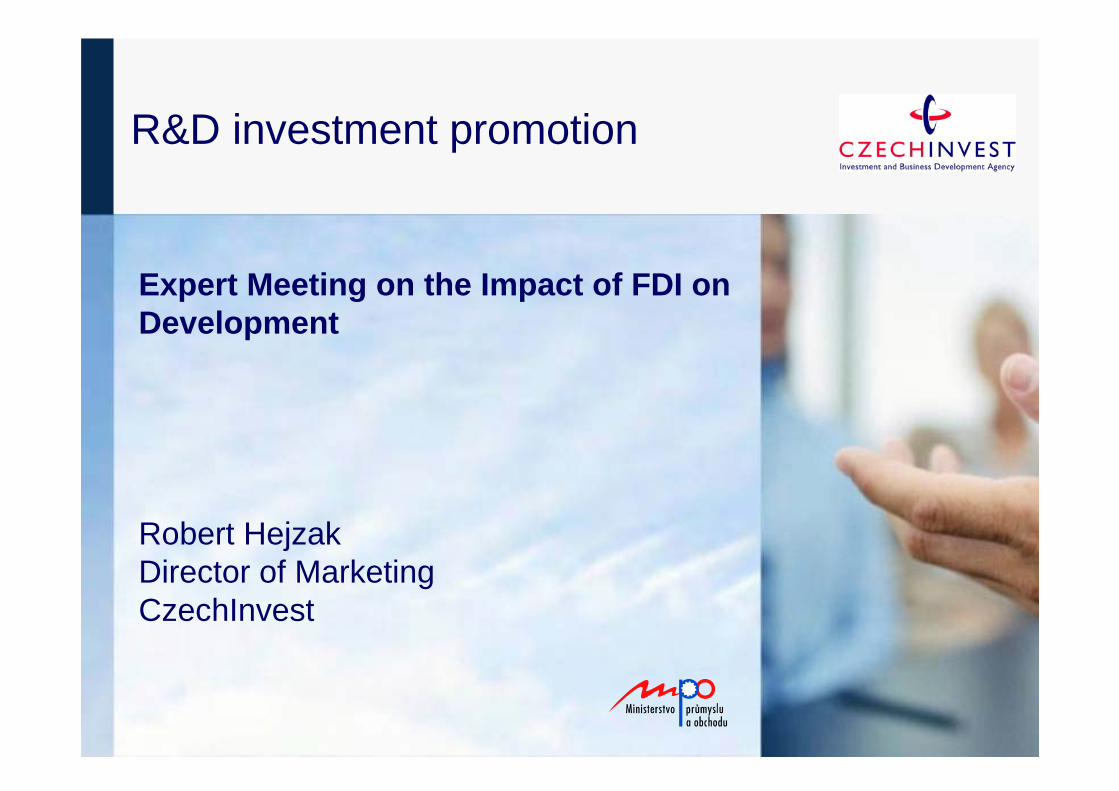
Investment incentives
╌ Subsidy for business activity
╌ provided for max. 10 years / up to 50% of investment costs
╌ Subsidy for training and retraining
╌ provided for max. 3 (5) years / up to 35% (60%) training costs

Types of supported projects╌ Development and innovation activities with
the close linkage to production of high-tech
products and technologies, including
development of specific software, in the
following fields:
╌ Aerospace
╌ Computers and machinery
╌ Electronics and microelectronics
╌ Telecommunications
╌ Pharmaceutics
╌ Motor vehicles
╌ Etc.

Eligibility Criteria
╌ Min. amount of investment
╌ CZK 15 mil. (app. 0,5 mil. EUR / 0,6 mil. USD) within 3 years
╌ Min. number of new jobs created
╌ Min. 15 new jobs within 3 years
╌ Min. equity share
╌ CZK 7,5 mil. (app. 0,25 mil. EUR / 0,3 mil. USD) of the investment will be financed with own sources
╌ Linkage with production

CzechInvest strategy
-- foreign AND indigenous investment
-- projects AND instructure development
-- 2 marketing models for FDI attraction –„evolution“ vs. „leap“
-- local sourcing nad university linkages

Advanced R&D environment
Source: Eurostat, European Innovation Scoreboard, 2002
Corporate Investment into R&D and New Technologies (% of GDP)
Poland
Hungary
Slovakia
Spain
Italy
Czech Republic
Ireland
E.U. Average 1.28
0.88
0.45
0.36
0.25
0.81
0.53
0.52
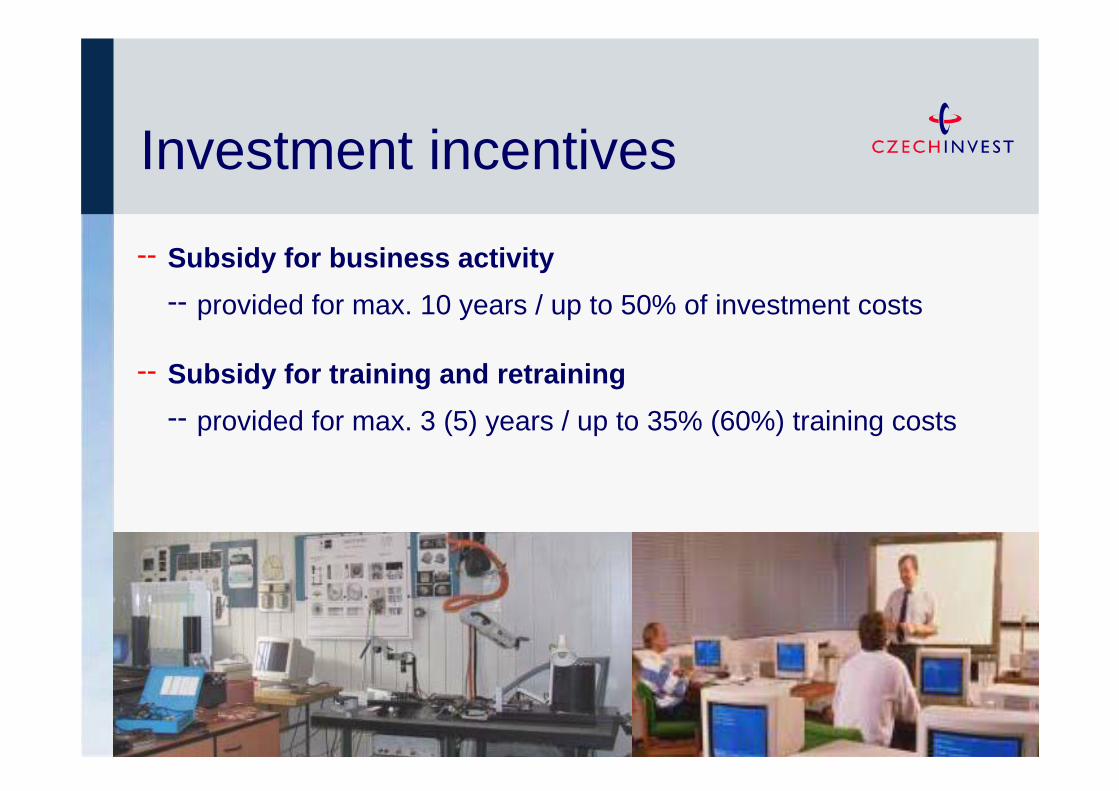
University links (ČVUT)
Source: Institute for Information in Education 2004, www.cvut.cz
1541, 356Architecture
22, 903
1, 808
1, 434
6,206
4,979
6,551
2,107TOTAL (included other departments)
159Transportation Sciences
135Nuclear Sciences and Physical
584Electrical Engineering
371Mechanical Engineering
624Civil Engineering
-- Prague’s CVUT: second largest Technical University in Europe (23,000 students)-- exchange programs with foreign universities in over twenty countries -- projects with Samsung, Texas Instruments, Bosch, AVX, Boeing, Ericsson, Honeywell
Students Graduated

Results
Source: CzechInvest, 2004
Wood-processing industry8% Automotive
industry29%
Chemical industry 14%
Electricalindustry 29%
1994
Construction industry 14%
R&D18%
Business Support Services11%
Manufacturing71%
2004

StatisticsTechnology Centres
-- 22 investors have received investment incentives
-- Investment: 55,5 mil. EUR
-- Training and re-training : 10,8 mil. EUR
-- Newly created jobs: 1 570 (75 % university graduates)
-- Applications from 18 firms are being processed
Source: CzechInvest, 15th January 2005
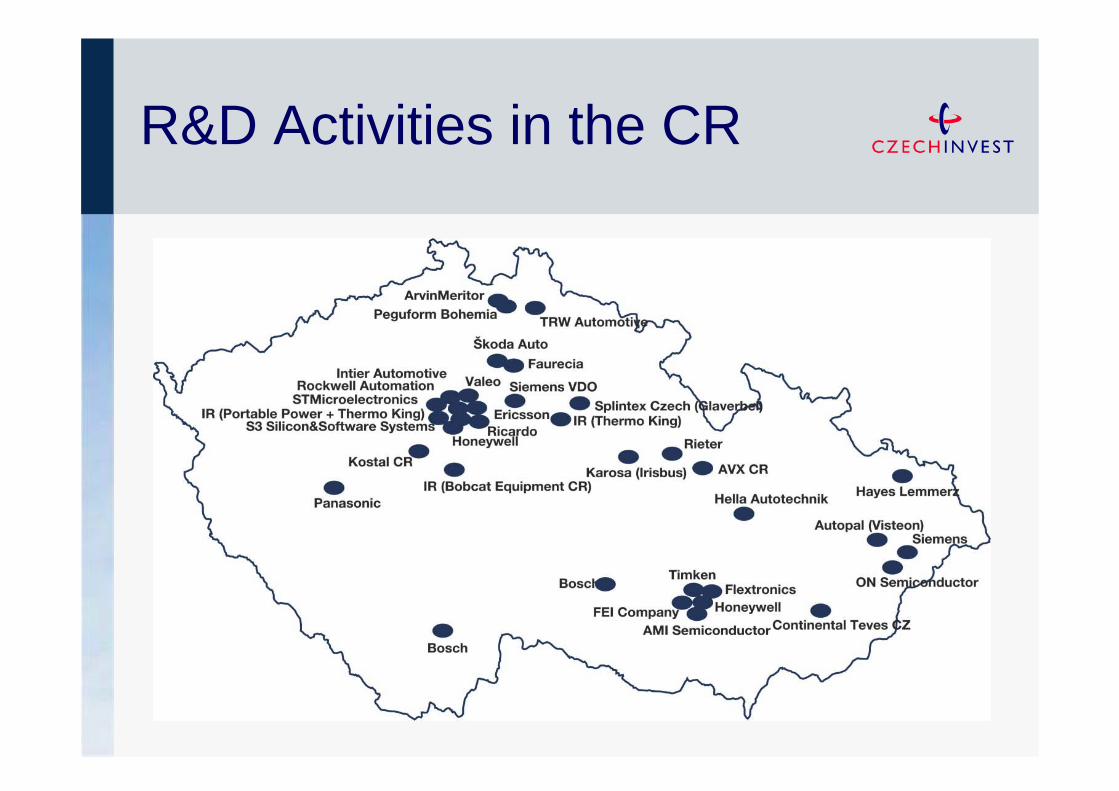
R&D Activities in the CR

CR in the Top 10 most attractive countries for R&D
05
1015202530354045
1. Chi
na2.
USA
3. In
dia
4. U
nite
d Kin
gdom
5. G
erm
any
6. B
razil
7. J
apan
8. F
ranc
e9.
Italy
10. C
zech
Rep
ublic
23. P
oland
24. S
lova
kia
35. H
ungary
Source: The Economist Intelligence Unit 2004
% respondents
In which of the following countries does your company plan to spend the most on R&D in the next three years? Please choose the top three countries.

CzechInvest, the Investment and Business Development Agency, is an agencyof the Ministry of Industry & Trade of the Czech Republic
Thank you
Contact us at:
www.czechinvest.org