EXPERT GROUP ON ASSET PRICE MONITORING SYSTEM
62
EXPERT GROUP ON ASSET PRICE MONITORING SYSTEM RESERVE BANK OF INDIA
Transcript of EXPERT GROUP ON ASSET PRICE MONITORING SYSTEM

EXPERT GROUP
ON
ASSET PRICE MONITORING SYSTEM
RESERVE BANK OF INDIA

2
3
Executive Summary
Real estate activity represents a key engine of economic growth. Residential as well
as commercial house property forms an important part of asset formation; it
provides an assured stream of return and utility value to the owner of the property
by way of rental earning, durable consumption in the form of shelter and other
residential/ commercial services, as also its use as collaterals for availing loans. Lack
of transparency in the residential property market transaction, absence of a single
centralised regulator in a vast country like India and limited availability of price
information pose important challenges for keeping track of real estate price
dynamics and their relationship with financial stability and monetary policy.
Therefore, it is crucial to have a realistic measure of aggregate house price in order to
understand the behaviour of house price and their influence on the economy.
Reserve Bank of India had set up an ‘Expert Group on Asset Price Monitoring
System’ with the objective of developing an information system on asset prices.
Accordingly, a group of experts from ISI, CSO, NHB, IGIDR, SBI, ICICI and HDFC
has been engaged in working out a framework for quickly deliverable dimensions of
Real Estate Prices in quantitative terms, preferably in a frequent manner that could
be useful for monetary policy and financial stability purposes.
Recommendations: After several deliberations Group finalized its Report with
following observations/recommendations:
• Real estate property price data can be collected in the form of sale/resale price
directly from scheduled banks (including both commercial and urban
cooperative banks) and selected housing finance companies. Presumably,
transaction level data are available in electronic form with these organisations
(Para 5.4.3, Page 43).
• House price data can be collected at transaction level from top 13 centres: Greater
Mumbai, Chennai, NCR Delhi, Bangalore, Hyderabad, Kolkata, Pune, Jaipur,
Greater Chandigarh, Ahmedabad, Lucknow, Bhopal and Bhubaneswar (Para 5.5,
Page 43).

4
• For monitoring purpose, RBI needs to track both sale/resale price index as well
as the rent index of real estate prices on a regular basis (Para 5.7, Page 44).
• Considering the practical difficulty of collection of house rent data, the Group
recommends using official data on house rent index of CPI (Urban) which is to be
released by CSO. (Para 5.7, Page 44)
• The Group recommends compiling real estate price index on quarterly intervals
(Para 5.8, Page 45).
• As the data are being sourced from the banks and select housing finance
companies, survey schedule is basically a return prescribed for the said purpose.
The proposed return includes variables like type of property (including both real
estate and commercial), address, type of transaction, valuation price of the
property, purchase price of property and loan amount taken from the bank other
than the information on certain characteristics of the borrower viz., gender,
employment, monthly income, etc. (Para 5.9.1.3, Page 46).
• Price index may be compiled based on Laspeyre’s index method with financial
year 2009-10 as the base (Para 5.9.1.3, Page 46).
• The Group felt necessary to supplement the bank data through a survey
conducted annually so as to ensure robustness of the data available with the
banking system (Para 5.10, Page 46).
• The proposed statistical system may be structured organisationally as a separate
unit in the Statistics Department of RBI (Para 5.11, Page 47).

5
1. Introduction
1.1 Real estate activity represents a key engine of economic growth. Residential as
well as commercial house property forms an important part of asset formation. It is a
source of assured stream of return and utility value to the owner of the property by
way of rental earning, durable consumption in the form of shelter and other
residential/ commercial services; it can also be used as collaterals for availing loans.
Consumption expenditure is also impacted by income and wealth effects derived
from real estate and stock ownership. Movement in house prices has now become
critical because of the great recession triggered by the sub-prime led financial
turmoil. This has led to concerns raised by the academicians, central bankers and
governments about adverse macroeconomic implications of a downturn in house
and equity prices. Macroeconomic policy is becoming increasingly complex
specially, when forward looking monetary stance is envisaged. It has now become
contingent to monitor the price movements of the financial assets like equity and
houses, lest unintended price rise leads to wasteful speculative investment,
particularly by the households that would turn out to be deleterious for growth and
consumption in an economy.
1.2 As the cities are built in a country, any comprehensive housing policy requires a
developed and resilient housing finance system. Opportunities arise with the
evolution of the financial sector when housing demand remains strong within an
overall urbanizing world. New risk management, funding tools, and policy
instruments are developed to expand sound and more accessible market for housing
finance. Housing is being increasingly recognized as a potential growth area in the
emerging market economies. Priorities are gaining ground for a strengthened but
easily accessible financial sector, an expanding housing market, and an effective
urban shelter strategy for the poor. Housing and mortgage finance activities are now
the most happening segment in the asset price market in the emerging market
economies, particularly so for India where growing population is going to have a
6
significant say in the form of inclusive growth in the matters comprising both the
housing and employment needs.
1.3 Stock market related wealth effects in the Asian countries tend to be larger
wherever developed financial markets exist. Housing wealth effect is reported to be
statistically significant for some of the Asian majors. However, consumption growth
in some of the Asian majors exhibits a substantial persistence. Despite small short-
run elasticity of consumption to asset price changes, long-run elasticity could be
quite large. This is a potent cause of concern, particularly in case of negative
downturn considering the fact that that these economies could witness episodes of
economic, financial and currency crises. As a result, the effects of a slowdown of the
economic activity may be amplified by this intrinsic characteristic of consumption
behaviour in the emerging market economies.
1.4 Increased openness to global shocks, accelerated real estate activity backed up by
strong wealth effects reflected in the upcoming stratum of the economy coupled
with high and resilient growth expectations, call for having a consistent statistical
measure of house prices in India. Housing, being marked as a leveraged endeavour,
has an inherent inertia to attract flow of money out of saving and borrowed means,
which could get accentuated due to lack of a cohesive regulatory structure for
property developments and construction activities as well as limited absorptive
capacity in the economy. Lack of transparency in the residential property market
and absence of a focussed regulatory ambience for real estate activities make it
difficult to collect the transaction data on property prices. As a result, keeping track
of real estate price dynamics is difficult which in turn inhibits the process of
understanding its critical bearing on financial stability as also appropriate monetary
policy response.
1.5 It is, therefore, felt to set up an Expert Group in the RBI with the objective of
developing an effective information system on asset prices. Accordingly, a group of
experts from Indian Statistical Institute (ISI), Central Statistical Organisation (CSO),
National Housing Bank (NHB) and Indira Gandhi Institute of Development

7
Research (IGIDR) and the officials from State Bank of India (SBI), ICICI and HDFC
has been engaged in working out a framework of Asset Price Monitoring System for
obtaining a workable basis for quickly deliverable dimensions of Real Estate Prices
in quantitative terms, preferably in a frequent manner that could be useful for
monetary policy and financial stability purposes. Accordingly, an Expert Group was
constituted with the following members:
Principal Adviser Department of Statistics and Information Management Reserve Bank of India
Member
Shri Raj Pal Principal Adviser National Housing Bank
Member
Prof. Bimal Roy Professor Indian Statistical Institute
Member
Prof. Manoj Panda Director Centre for Economic and Social Studies (formerly from IGIDR)
Member
Dr. G M Boopathy Deputy Director General Central Statistical Organisation
Member
Shri Gautam Bhagat Chief Executive Officer HDFC Realty
Member
Smt. Anuradha Rao Deputy General Manger, Home Loans State Bank of India
Member
Shri Abhay Sakare Deputy General Manager ICICI Home Finance
Member
Shri Sanjoy Bose Director
Convener

8
Terms of Reference of the Expert Group 1.6 The Expert Group had the following terms of reference:
i. to suggest method for establishing a system of real estate price data collection;
ii. to recommend an appropriate survey format for collection of real estate price,
including rent, in select metro cities in India;
iii. to suggest appropriate methodology for compilation of house price index;
iv. to consider any other issue relating to construction of house price index.
Acknowledgements
1.7 The Statistical Analysis Division (SAD) of the Department of Statistics and
Information Management (DSIM), Reserve Bank of India, provided the secretarial
support to the Expert Group. The members of the Group place on record its
appreciation and express their gratitude to the officers and staff of SAD for their
support in the preparation of this Report. In particular, the efforts put in by Mr.
Sanjoy Bose, Director, Dr. Abhiman Das, Assistant Adviser and Ms. Manjusha
Senapati, Mr. Joice John, Ms. Nivedita Banerjee and Mr. Sanjay Singh, Research
Officers, deserve special appreciation. In many technical issues, Smt. S. Augustine,
Director, as a special invitee shared her practical experience of house price data
collection. She too deserves special mention.
1.8 The Group deliberated on various issues related to the importance of setting up a
system of real estate price data collection system within the Bank and the potential
role of such information for monetary policy formulation. At the government level,
National Housing Bank (NHB) is already engaged in compiling house price index
called NHB RESIDEX. As monitoring of real estate price is important for the overall
economic activity, several market participants like CRISIL, and research institutions
like National Institute of Bank Management (NIBM), National Council for Applied
Economic Research (NCAER), etc., are also engaged in understanding the dynamics
Department of Statistics and Information Management Reserve Bank of India

9
of house price movements. In different occasions, they made presentations on their
approach and potential advantage of monitoring house prices. Such presentations
were immensely useful to the Group in fine tuning the methodology of data
collection. The Group is benefited from valuable inputs provided by the officials
from the State Bank of India and the ICICI Bank. These discussions were useful to
ascertain the availability of data from banking systems and the problems thereof.
Special thanks to all of them.
1.9 The report is organised in six chapters. Chapter 2 gives an overview of the need
for house price monitoring in RBI, suggesting thereby a framework for establishing a
reliable system of real estate price data collection. Chapter 3 examines the
methodology of house price index development. Chapter 4 presents proposed
approach for an appropriate methodology for compilation of house price index in
the present context. Chapter 6 presents the summary of the findings and sets out the
recommendations of the Group.
10
2. House Price, Monetary Policy and Financial Stability
2.1 Real estate price is conceptually different from the prices of current goods and
services. Property prices are evidenced to have a very critical position among all the
asset classes. It is, in general, forward looking and it reflects market’s expectations of
the value of the future stream of services derived from the property. Real estate asset
prices contain important information about the current and future state of the
economy and could play an important role in monetary policy setting for its overall
objectives of price stability and sustainable growth.
2.2 Residential and commercial property accounts for a sizable share in the wealth of
a nation. The demand for real estate properties, particularly for the private homes,
depend primarily on earning capacity of the prospective owner as also his borrowing
capacity, interest rate structure for property loans and taxation policy. The number of new
homes, particularly affordable ones, forming only a few per cent of the total stock of
housing, varies greatly with the economic conditions. It is evidenced almost
routinely that house price fluctuations may amplify the macroeconomic shocks, like
supply, demand, or monetary policy shocks. Housing sector may be buoyed up by
non-fundamental price movements, giving rise to imbalances in the financial system
and the economy.
2.3 The catastrophic financial crisis led by sub-prime mortgage debacle against a
backdrop of the biggest home-price boom in the US is a testimony to the fact that
how surging money flowing to housing sector can create a severe debt crisis in the
history of banking. It extended unabatedly after beginning in the late 1990s via
‘doubling the stake’ investment behaviour when the prices soared by hundred per
cent till it started busting in the seams 2006 onwards. Such spectacular exuberance
propelled the entire world economy and stock markets, via several engineered
innovative tools, spilling across entire segments of financial markets across the
globe. Post the great depression of the 1930s, the so-called sub-prime crisis has led to

11
unprecedented crisis in the credit market, failures of big banks and a total lack in
business and consumer confidence.
2.4 Only comparable kin of the ongoing stressed financial market and protracted
slackening macroeconomic situations are the adverse and persistent deflationary
situations witnessed in the US during the Great Depression (1929-39) and Japan after
the biggest financial crash when the real estate bubble burst (1991-2002). The added
dimension of the financial crisis of 2008-09 is that it has led to a near global economic
catastrophe due to increased linkages and coupled leveraged condition across the
globe.
2.5 Recent occurrence of the Dubai’s Debt repayment crisis is again due to highly
leveraged investment undertaken by Dubai’s largest state-owned conglomerate to
build up a non-oil economy based on property development activities, trade and
tourism. This debacle started because of solvency issue created by steep fall in
earning led by sizable correction in property prices as also general slack in trade and
tourism ongoing recession in the developed economies. It may be mentioned that
house prices almost quadrupled in Dubai within a very short span of five years
during 2002-07 which since then have been halved.
2.6 The sub-prime meltdown is a huge one creating a total loss in faith and trust
within the banking system, leading to the collapsing condition of the banking
operation in the world for few days after Lehman Brothers’ collapsed. House price
fluctuations may jeopardise economic activity and the financial stability, particularly
when bubbles get fuelled by bank loans. Any misreading and regulatory lapses
would hit bankers and realtors hard, so that close monitoring of asset price
movements are being increasingly pushed into the core macroeconomic policy
framework.
Importance of house prices for monetary policy

12
2.7 Property market is of central concern to monetary policy makers. To achieve the
dual goals of price stability and a sustainable level of growth and employment,
monetary policy makers must persevere to factor in the monetary transmission
mechanism the dynamics of the housing market behaviour. “Central bankers
naturally play close attention to interest rates and asset prices,…[they] are
potentially valuable sources of timely information about economic and financial
conditions…[and] should embody a great deal of investors’ collective information
and beliefs about the future course of the economy.”1 In the past, dominant central
bankers used to feel either the asset prices have only an indirect effect on interest
rates or could be largely ignored. As history now speaks, implications of house
prices could be as tricky as that even Greenspan could misread the signs; he saw
early, probably the first to have a very clear understanding of housing prices that the
Americans treated their homes as a source to refinance or taking home-equity loans
to turn home’s value into spending money.
2.8 Despite several poignant signals getting highlighted in the form of unsustainable
rise in house prices compared to realisable rents, the strong belief was that house
prices can at best form localised bubbles and would never give rise to a nationwide
crisis. Steeply descending house prices at a national level was deemed to be highly
improbable. Another riddance for not to consider a continuously rising asset prices
within any direct actionable monetary stance is that it is well nigh impossible to
distinguish a transitory bubble from a self-fulfilling rise in asset prices. Any hawkish
actionable stage was assumed to be solely dependent upon if the rising asset prices
were pushing up prices of goods and services, as revealed in conventional measures
of inflation. All these are now set to change. Before making regulatory ambience
more stringent, monetary policy perspective now may get redressed so as to
consider probable proactive response to mitigate self-fulfilling impetus behind
runaway asset price movement, at least for the segment when it is led by bank loans. 1 House Price Indices (HPIs) have been produced in the UK since around 1973, initially by mortgage-providers, and subsequently by government bodies. More recently, the work of monitoring house prices of UK has been transferred to the Bank of England.

13
2.9 Real estate prices are critical for the financial sector and in terms of measuring
the wealth of the country. It has been evident that monitoring real estate prices has
become critical for financial stability analysis. But, it is an area where information is
lacking in India. There is no agency that collects real estate market prices on a
regular basis. Housing in India is, however, very different from housing in the US,
Canada, UK Japan or say, even in Dubai, where it is also seen as a prospective
investment for future needs. India’s property market is largely end-user based.
Besides, financing pattern for ownership of individual homes differs between the
developed economies, emerging market economies and the developing or
underdeveloped countries. For example, ownership of individual homes is very high
in the United States or Canada, whereas in Hong Kong, more than fifty percent units
are supplied by the government. In India, the depth of housing market is very low; it
is a huge need-based requirement and yet to attain a broad-based utilitarian means
of wealth formation and effective investment vehicle carrying assured stream of
future flow of money.
2.10 It is true that housing market in India is yet to achieve a status of ascendancy
that has been achieved by the likes of stock or bond market. However, governments
and the central banks across Asia have been taking steps to rein in property prices
on concern that speculative money would flow into nascent house market sector to
jack up prices which may react, though mostly as a demonstrative effect seeing the
asset bubble bursting in the neighbouring regions like Dubai or elsewhere in the
emerging market economies. This could be very much relevant for some of the
upcoming segments in the major metropolitan centres like Mumbai, Delhi, etc.
Moreover, India’s monetary and financial market authorities are committed to keep
stable and orderly market behaviour as well as solvency and liquidity of the
financial system. The latest episode of Dubai’s best-performing property market
going down to the worst within a year, now underscores the challenge central
bankers face in ensuring rapid credit growth not leading to bubbles.

14
2.11 With easy money stance from the central bank, mortgage rates become easy so
that monthly cost of homeownership would drop and the demand for housing rises.
Initial reaction would however be in the prices of the houses already built, which in
turns motivates builders to start new projects and the flow of new housing
investment picks up. Here comes the absorptive capacity of the system and gestation
lags and procedural hurdles which delay new housing projects. Over time, enough
homes are built to satisfy the new higher level of demand; housing prices and new
housing investment then drop back toward their original level. This kind of cyclical
movements is inevitably revealed in the house price movements across all the
countries.
2.12 House prices enter the monetary policy transmission mechanism primarily
through the wealth channel (the value of the net equity of households and firms
being of key importance) and via the balance sheet of the banking sector.
Specifically, this effect operate via: (i) household consumption through the wealth
channel, as a rise in house price is perceived as a rise in wealth and a source of
consumption financing, and/or (ii) the balance sheet of the banking sector, as house
prices often act in the role of collateral in lending transactions. Although these two
channels are not the only, or probably even the dominant, channels of monetary
policy transmission (exchange rate, interest rate and credit channels also operate), it
is the interconnections between all these channels from which the power of
monetary policy stems. It is obvious, meanwhile, that these channels vary in strength
from one economy to another in terms of their effects on the real economy; it
determines whether or not asset prices are incorporated into the forecasting system
(for example, the BoE takes into account both asset prices and house prices)2. The
table below shows the position of housing in the monetary policies of selected
central banks. It may be mentioned that all these central banks monitor house prices,
but none of them includes house prices in its decision rule.
Table 2.1: Housing and monetary policy
2The main model (BEQM) directly includes an asset price channel, which models the wealth effect and includes housing in addition to financial assets.

15
Fed3 ECB4 MNB5 NBP6 BoE7 Riksbank8 RBNZ9 Inflation target or monitored aggregate
PCE HICP CPI CPI CPI (conceptually
HICP)
CPI CPI
Housing explicitly in analytical and forecasting system
YES NO YES YES YES NO NO
House prices directly in targeted inflation
NO NO NO NO NO YES YES
2.13 How can central banks take house prices into account? The first way is merely
to track the housing market and house prices, and not to react to or interfere with
them, even when imbalances arise. The second way is exactly the opposite: to
include house prices directly in the central bank’s decision (interest rate) rule or
“reaction function” as another component over and above the deviation of inflation
from the inflation target, etc. However, this approach is also inappropriate, as dual
targets introduce further volatility into the economy. This is probably why none of
the central banks monitor targets or reacts directly to house prices. The other options
lie somewhere between these two extremes. The third approach consists in taking
house prices, or their aforementioned transmission channel, explicitly into account in
the central bank’s analytical and forecasting system and in the related source
materials for monetary policy decision-making. The fourth option is to include
expenditure related to the use of housing in consumer price indices, for example
using the concept of imputed rent. In this case, consumer prices do not reflect house
prices directly, but reflect the prices of services consumed or the utility
hypothetically realised by property owners, in line with the fundamental CPI
3 Federal Reserve, US. 4 European Central Bank. 5 Magyar Nemzeti Bank (The Central Bank of Hungary). 6 National Bank of Poland. The Polish central bank on 30 June 2008 unveiled its new macroeconomic model NECMOD, which incorporates the housing market and models both the supply and demand sides of that market. 7 Bank of England. 8 Sweden’s central bank. 9 Reserve Bank of New Zealand.
16
methodology. The fifth approach is a methodological extension of the CPI concept
directly to include asset prices (including house prices) so that the indices measure
the cost of living via the prices of present and future goods. The last two techniques
assume that CPIs have the relevant content, i.e., there is some degree of coordination
between the central bank and the government statistics agencies responsible for the
methodology, collection and publication of consumer price data.
2.14 All this means, among other things, that the conceptual differentiation of
whether housing is being purchased/used for investment or consumption is
important in terms of the inclusion of housing related prices in the CPI. Housing can
be viewed on the one hand as a durable good that provides a service to households.
On the other hand, a property purchase can be regarded as an investment. It is solely
up to the owner to decide whether to realise his potential profit by selling in the
future and how to handle the investment while it is in his possession (whether to
collect returns in the form of rents, etc.). However, if we take into account the
expenditure associated with the use of housing (maintenance, wear and tear, etc.),
such expenditure can be counted as consumption. This is how government statistics
agencies usually treat it when designing consumer price indices.
2.15 To sum up, most of the central banks monitor and pay adequate attention to
developments in the housing area. House prices rarely enter consumer price indices
directly; they are usually substituted by the imputed rent concept. Likewise, direct
inclusion of house prices in analytical and forecasting systems is in the minority.
Nonetheless, house purchase expenditure in relation to the consumption of
economic entities and the investment decisions of agents is often contained in central
banks’ macroeconomic models. House prices do not play a very important role
explicitly in central bank decision-making but in many cases, related consumer
spending is captured in the monetary policy through relevant consumer price
indices.
Determinants of Commercial and Residential Prices

17
2.16 The determinants of property prices are in many ways similar to those of other
assets, namely the expected service stream (consumption service) or expected future
cash flow (rents) and the required rate of return (the long-term interest rate plus the
risk premium) as a discount factor. In the long run, property prices therefore depend
on demand factors, such as national income and average discount rates, and on
supply factors, such as cost of construction, land availability and the quality of the
existing stock.
2.17 Property markets also have a number of distinctive features compared with
other types of asset. The supply of property is intensively local; delivery of the new
stock can take quite a long time owing to the length of the planning and construction
phases; rents can be very sticky because of the use of long-term rental contracts;
market prices lack transparency and most transactions occur through bilateral
negotiations; the liquidity of the market is constrained because of the existence of
high transaction costs; borrowers rely heavily on external finance; real estate is
widely used as collateral; and short sales are usually not possible. These features
cause property prices to behave differently. In particular, in the short run, property
prices are more likely to deviate from their long-term fundamentals. The fluctuations
in property prices can arise not only owing to cyclical movements in economic
fundamentals, interest rates and the risk premium, but also as a result of the intrinsic
characteristics of the property market itself.
2.18 Business cycle causes property price fluctuations for obvious reasons.
Improvements in overall economic conditions tend to increase the average income of
households and therefore boost the demand for new homes, putting upward
pressure on house prices. Similarly, businesses see profitable opportunities and seek
to expand the scale of their investments. Such an expansion implies a higher demand
for office space and storage, driving up commercial property prices. In addition, the
market perception of risk changes with the phases of the cycle. During a booming
phase, the risk involved in a given project is considered to be lower than in a
downward phase. The changing risk premiums, in combination with time-varying
18
interest rates (decided by policymakers), determine the discount rates and by
extension have a sizeable impact on real estate prices.
2.19 Property price oscillations are also driven by endogenous factors, most notably
supply lags and the historical dependence of investment decisions. On the one hand,
the supply response in the property market is much slower compared with that of
other goods, mainly as a result of limited land supply and the length of the approval
process and the construction phase. On the other hand, the flow of information in
the property market is usually inefficient. Beyond these common characteristics, the
dynamics of property prices can vary substantially across sectors (residential vs.
commercial, office vs. retail, etc) and across countries as a result of differences in a
number of specific demand and supply factors. Such national and sectoral
differences can be attributed to asynchronous business cycles, as well as to
distinctive local factors (elasticity of supply, funding methods, subsidy/tax polices,
legal framework, etc.).
2.20 A house is a long-lived asset that delivers consumption services over many
periods. In many respects it is more like a durable good than an investment asset.
Given that residential property can provide accommodation to its owner, it has an
intrinsic reservation value determined by the discounted value of the expected
service stream. As a result, nominal housing prices are usually less likely to fall as
sharply as equity prices and commercial real estate prices. Indeed, in many
situations the downward pressure on the housing market is typically reflected in
shrinking transaction volumes rather than in a collapse in nominal prices, as owners
refrain from selling at a loss. As noted, housing price fluctuations can be driven by
macro factors and intrinsic characteristics of the housing market itself. Empirical
evidence suggests that the market has its own distinct dynamics. On average, almost
three fifths of the overall variation in housing prices can be explained by innovations
in the housing market itself. The combined effect of other explanatory factors, such
as GDP, interest rates, bank credit and equity prices, accounts for the rest.

19
2.21 Commercial property markets have some unique characteristics, such as longer
construction lags, long-term leases and volatile income streams, which cause the
commercial and residential property cycles to show distinct patterns. Moreover,
commercial property cycles may be asynchronous across regions and sectors.
Depending on the elasticity of supply, development lags, durability of assets and
funding methods, different types of commercial property may themselves have
varying dynamics. Unlike residential real estate, commercial property is more of a
pure investment asset and its value is determined by the discounted value of future
rents. When macroeconomic conditions weaken, shrinking business activity cuts
down the demand for commercial property and results in higher vacancy rates.
Rising vacancy rates and lower rental rates lead to a deterioration of real estate
market fundamentals and cause prices to fall. Compared with a residential property,
the reservation value for a commercial property is much lower, because its
consumption value is low while its maintenance cost is very high. As a result,
commercial property prices tend to be more responsive to macroeconomic
conditions, and it is common to observe a sharp decline in nominal commercial
property prices during an economic downturn.
2.22 Movements in property prices could affect aggregate demand and economic
activity in various ways. First, rising property prices lead to more optimistic
expectations of the returns on property investment. As a result, builders start new
construction and market demand in property-related sectors increases. Second,
rising house prices induce households to increase private expenditure and therefore
provide a big support for private consumption. Third, changes in commercial
property prices may significantly change the investment decisions of those firms that
are financially constrained. Similarly, movements in house prices influence the
financial behaviour of homeowners and would-be home purchasers.
Real Estate Prices and Financial Stability
2.23 The role of real estate prices in the conduct of monetary policy has attracted
much attention among researchers and policymakers in recent years. There has been

20
extensive evidence that property price movements have a large impact on private
consumption and the real economy. The results show that increases in property
prices tend to have a positive impact on real GDP in many countries. Importantly,
the magnitude of this impact is different across countries and sectors. The
commercial property sector seems to have a larger impact on the real economy,
reflecting the fact that it is more important in affecting the investment decisions and
financial conditions of corporate firms. Besides, the national difference suggests that
the role of property prices in monetary policy transmission might be influenced by
local factors.
2.24 The link between property prices and aggregate demand suggests that the
monetary authorities can benefit from monitoring developments in property
markets. The view that policymakers should respond to excessive increase in
property values which are manifestations of excess demand in the economy as a
whole has received much attention within central bank circles. In particular,
monetary policymakers need to identify the sources and nature of property price
fluctuations in order to understand their implications for price stability and the
general economy, and then to formulate the appropriate policy response. However,
in practice, it is not an easy task. It is often not straightforward to identify
“excessive” property price inflation at an early stage. Lack of reliable data, diversity
in valuation methods and unpredictability of market movements make it difficult for
policymakers to design an early warning signal of asset price imbalances in the
property market with a comfortable degree of confidence.
2.25 Bank lending is the primary source of real estate funding. Not surprisingly,
there are close connections between real estate prices and bank credit. On the one
hand, sharp falls in property prices can lead to a large-scale deterioration in asset
quality and in the profitability of the banking industry, particularly for those banks
that are deeply involved in property or property-related lending businesses. They
also undermine the value of bank capital, reducing the banks’ lending capacity. On
the other hand, banks’ lending attitude has important implications for property
prices. Bank credit to property buyers and constructors may change the balance

21
between the demand and the supply side and cause property prices to fluctuate.
Studies done in the past suggest that bank credit and property prices are positively
related in the long run. The impact of property prices on bank credit is found to be
significantly positive, yet the impact in the reverse direction in less clear.

22
III. House Price Indices: An Overview
3.1 Traditionally, house price data in India only in the form of rent is captured by
both CPI (UNME) and CPI (IW) at half-yearly intervals.10 For CPI(IW), the change in
rent and related charges, which constitute a single item under housing group, is
captured through Repeat House Rent Surveys, which are conducted in the form of
six-monthly rounds. This survey is conducted on a sub-sample of dwellings covered
during the main income & expenditure survey in 1999-2000. The index is calculated
once in every six months and is kept constant for the entire six months on account of
the tendency of house rent to remain more or less stable over short periods. Under
the house rent survey, three types of dwellings viz. rented, rent free and self-owned
are covered uniformly across all the centres. As the names suggest, both these
indices capture house rent price movements for specific target population.
Therefore, rent price movements based on these indices do not necessarily reflect
true rent price movement of a city as a whole.
3.2 At present, CPI(IW) partially capture different segments of the urban population
as the reference population for CPI(IW) covers parts of both rural and urban
industrial workers mostly residing in urban areas and employed in 7 industrial
sectors. A major section of urban people is not adequately captured. Therefore,
house rent index captured in CPI (IW) in India has limited utility. However, it may
be mentioned that CPI (Urban) being proposed recently by CSO would cover the
entire gamut of urban population.
3.3 Changes in asset prices influence household wealth and therefore impact
consumer spending and aggregate demand. Asset prices also contain important
information about the current and future state of the economy and play an
important role in monetary policy setting. International organizations like the Bank
for International Settlements (BIS) and the European Central Bank (ECB),
government agencies in several developing and industrial countries, and private
10 Compilation of CPI (UNME) has since been discontinued since April 2008.
23
sector companies in some countries have been compiling indices at the regional and
national levels to measure developments in real estate or other segments of asset
markets. In absence of any comprehensive information system for India, the
National Housing Bank (NHB), at the behest of Ministry of Finance, launched NHB
RESIDEX for tracking prices of residential properties in July 2007 with 2001 taken as
the base year. Based on the data from housing finance companies along with the
data collected by NCAER, the updated NHB RESIDEX is now available up to June
2009. NHB’s data base, however, does not cover commercial properties. Another
limitation is that though NHB RESIDEX is very broad based, it is available with half-
yearly frequency with a time-lag. However, by tapping the vast data lying within the
banking system as also with Department of Registration and Stamps (DRS) across
the States one can obtain a rapid estimate about the current trend and direction of
house prices on a quarterly basis.
3.4 With the objective of obtaining an index representing the aggregate house price
movements in India, National Housing Bank (NHB) developed and released NHB
RESIDEX for five selected cities in the country during July 2007 under the guidance
of a Technical Advisory Group of which, the RBI was one of the members and
department provided technical inputs for firming up of the methodology and
construction of the index. NHB launched the first official residential property index
(NHB RESIDEX) for 5 cities namely Mumbai, Delhi, Bangalore, Kolkata and Bhopal.
NHB RESIDEX was the annual housing price index for a year 2001 to 2005, by
undertaking a field survey as a pilot study of selected groups of respondents (20
transactions per annum in each zone) in 25 colonies across different
administrative/property zones in different cities and prices are as reported by the
real estate agents through questionnaires. Stratification of the colonies was based on
the house stock distribution as available in census 2001.
3.5 NHB RESIDEX has been updated up to June, 2009 with half yearly update (Jan -
June, 2009) with 2007 as the Base Year. This updating has been done by using data
on housing arranged by NCAER. As in the case of updating of NHB RESIDEX after

24
2005, the NCAER had used Magic Bricks (Times Business Solutions Ltd.) a company
of the Times of India Group for primary data collection which was then duly
analysed and vetted by them. Further, data from other sources, i.e. housing
transaction prices covered under the housing loans provided by housing finance
companies and banks during the above mentioned period, have also been utilized to
supplement and cross verify the information received from NCAER for updating
NHB RESIDEX. NHB RESIDEX will be up dated on half yearly basis, for the
present. In the first phase NHB RESIDEX will be expanded to cover 35 cities having
million plus population. The proposal is to expand NHB RESIDEX to 63 cities which
are covered under the Jawahar Lal Nehru National Urban Renewal Mission to make
it a truly national index. It is envisaged to develop a residential property price index
for select cities and subsequently an all India composite index by suitably combining
these city level indices to capture the relative temporal change in the prices of houses
at different levels.
3.6 A similar study, at the instance of the Bank, was taken up in its Department of
Statistics and Information Management to study the house price movement in
Mumbai, where the price data on transacted houses were collected from the
Department of Registration and Stamps (DRS), Government of Maharashtra. The
department’s study was based on the officially declared prices by buyers, covering
about 3 lakh official transactions collected from DRS, Government of Maharashtra.
Based on the official data a quarterly index was constructed till Q2: 2007-08 with
2002-03 as the base year. House Price Index was constructed based on stratified
weighted average measures, where transactions were stratified in three categories
viz. small, medium and large houses and 16 administrative wards. House price
indices were calculated using two methods, viz. weighted average method and time
dummy hedonic method. Two different weighting diagrams based on number of
houses transacted and value of houses transacted were used to construct the
weighted average based indices.
Methodology of compiling house price index: an international comparison
25
3.7 Besides official agencies, several central banks are involved in compiling house
price index. For example, Bank of Canada, Deutsche Bundesbank and Bank of
England do collect house price information on a regular basis through direct surveys
(Table 3.1). Furthermore, almost all central banks around the world monitor and
analyze house price movements for monetary policy formulation. Methodology of
compilation of housing price index for major developed countries is summarized in
Table 3.1. There are mainly 4 different methods which are discussed below.
3.8 Based on median/mean transactions price: Here, for a particular area, the median
or the mean of all transactions during a reference period is used as the representative
price. The main problems with median and mean prices are that they are subject to
distortion by ‘compositional’ factors. Compositional factors include the volume of
property sales within specific price bands. For example, if mainly low value
properties in an area are sold in a month (and few of the superior properties in that
area) then this can indicate a drop in the median or average. However, in the next
month most sales in that area may be superior properties (i.e., higher values) and
this would then show that the median and average house price had increased when
in fact values overall may have fallen.
3.9 The fact that median prices are affected by compositional change and seasonality,
there is evidence that samples of observed transactions cannot be considered to be
random. Since there exists no ex ante way of ensuring a random sample of housing
transactions, techniques are required ex post to deal with the non-randomness. While
median prices are widely used, alternative methodologies are employed in a number
of countries to deal with the problem of compositional change and to obtain
improved measures of housing prices.
3.10 Mix-adjusted: One means of controlling for changes in the mix of properties
sold is to use the technique of stratification to construct a mix-adjusted measure of
house prices. This is the methodology used by the Australian Bureau of Statistics
(ABS) in its indices for established house prices. Mix-adjusted measures have also

26
been used in a number of other countries including Canada, Germany and the
United Kingdom, although there are differences between the approaches used in
each country reflecting the diverse nature of housing markets across regions.
Typically, small geographic regions (e.g., suburbs) are clustered into larger
geographic regions and then a weighted average of price changes in those larger
regions is taken.
Table 3.1: Housing Price Series in Selected Countries
Country Index Organisation Data source Methodology Canada New Housing
Price Index (NHPI)
Statistics Canada
Builders/Developers are under obligation to respond to survey for NHPI. Face to face interview as well as telephonic interviews. System on disclosure control exists.
Data collected on house price, estimated cost of land and on detailed attributes of model house. Samples are given equal weight; Amongst metropolitan areas weights are based on housing completion data; Chain-Laspeyre’s formula; 1997=100. updated monthly
UK Land Registry HPI
Land Registry Land Registry’s own data
Simple average (median) of 100 % of sales registered.
ODPM-HPI Office of Deputy Prime Minister
Survey of Mortgage Lenders and Council of Mortgage Lenders
Mix adjustment; measure the value of average set of transacted dwellings
Halifax Halifax Loan approvals by Halifax
Hedonic regression; weights based on 1983 Halifax loan approvals; measure the price of Halifax representative dwelling; updated quarterly.
Nation wide Nation wide Loan approvals by Nation wide
Hedonic regression; weights based rolling average of SML, land Registry and Nationwide transactions ; measure the price of Nation wide representative dwelling; updated quarterly.
Home track Home track Survey of aprox. 4000 estates agents’ average price
Mix adjustment, weights based on housing stock, measure value of housing stock.
Right move Right move Sellers’ asking prices posted on internet platform
Mix adjustment, weights based on housing stock, measure value of housing
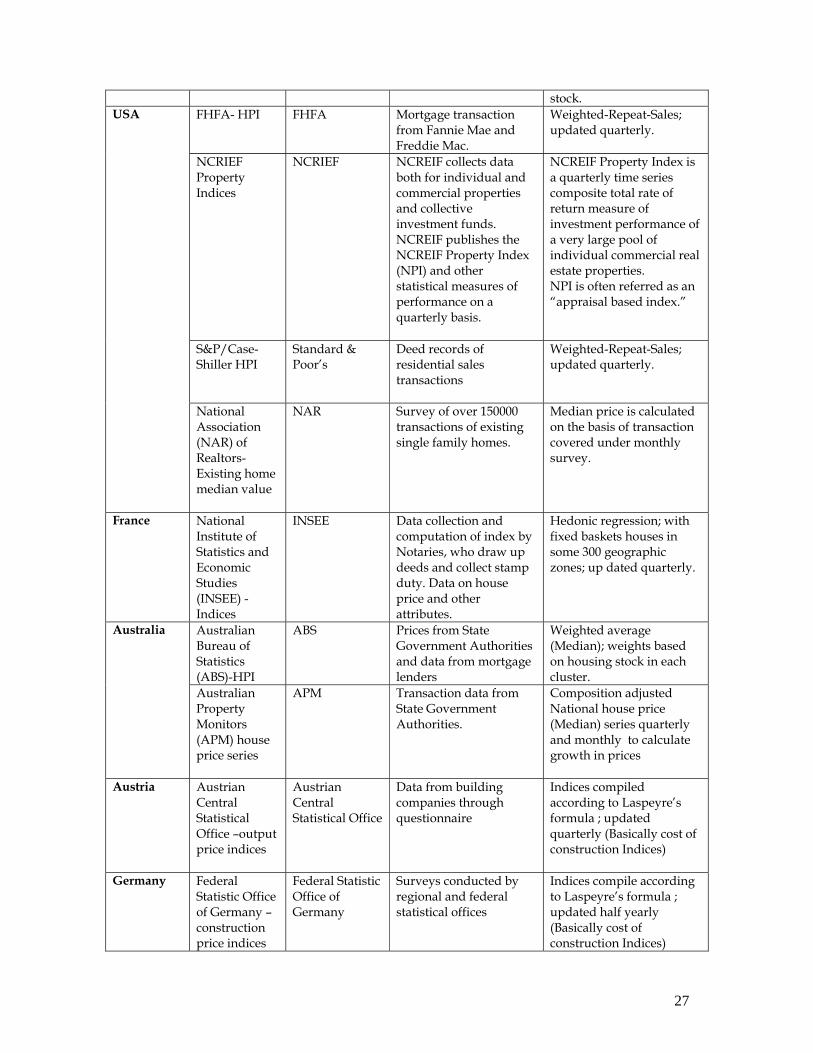
27
stock. USA FHFA- HPI FHFA Mortgage transaction
from Fannie Mae and Freddie Mac.
Weighted-Repeat-Sales; updated quarterly.
NCRIEF Property Indices
NCRIEF NCREIF collects data both for individual and commercial properties and collective investment funds. NCREIF publishes the NCREIF Property Index (NPI) and other statistical measures of performance on a quarterly basis.
NCREIF Property Index is a quarterly time series composite total rate of return measure of investment performance of a very large pool of individual commercial real estate properties. NPI is often referred as an “appraisal based index.”
S&P/Case-Shiller HPI
Standard & Poor’s
Deed records of residential sales transactions
Weighted-Repeat-Sales; updated quarterly.
National Association (NAR) of Realtors- Existing home median value
NAR Survey of over 150000 transactions of existing single family homes.
Median price is calculated on the basis of transaction covered under monthly survey.
France National Institute of Statistics and Economic Studies (INSEE) - Indices
INSEE Data collection and computation of index by Notaries, who draw up deeds and collect stamp duty. Data on house price and other attributes.
Hedonic regression; with fixed baskets houses in some 300 geographic zones; up dated quarterly.
Australia Australian Bureau of Statistics (ABS)-HPI
ABS Prices from State Government Authorities and data from mortgage lenders
Weighted average (Median); weights based on housing stock in each cluster.
Australian Property Monitors (APM) house price series
APM Transaction data from State Government Authorities.
Composition adjusted National house price (Median) series quarterly and monthly to calculate growth in prices
Austria Austrian Central Statistical Office –output price indices
Austrian Central Statistical Office
Data from building companies through questionnaire
Indices compiled according to Laspeyre’s formula ; updated quarterly (Basically cost of construction Indices)
Germany Federal Statistic Office of Germany –construction price indices
Federal Statistic Office of Germany
Surveys conducted by regional and federal statistical offices
Indices compile according to Laspeyre’s formula ; updated half yearly (Basically cost of construction Indices)

28
Hypoport AG – German house price index
Hypoport AG Home sales data from EUROPACE internet-based platform
Mix adjustment; updated monthly.
Sweden Swedish Statistical Office (SCB) –building price indices
Swedish Statistical Office (SCB)
Data obtained from investors and from application forms submitted to Government Authorities to obtained housing aid for new construction
Hedonic price methodology according to Paasche chained formula.
Hong Kong Property Market Statistics - Price Indices
Rating and Valuation Department (R&VD), Government of Hong Kong.
Actual transaction prices are reviewed by the R&VD for stamp duty purposes.
Price indices are compiled in the basis of ratable values of various properties. A composite index for a certain class of properties is calculated as a weighted average of the component indices. Weights being the number of transactions during current and previous 11 months in case of residential properties; whereas the weights in case of non-residential properties are based on floor area of the components.
Source: National Housing Bank, Occasional Paper – III (A Study of Cross Country Experiences in preparing and publishing Housing Price Indices)
3.11 Another approach along these lines uses price-based stratification, based on the
evidence of marked compositional change between lower- and higher-priced
suburbs. This appears to be highly effective in reducing the influence of
compositional change. In particular, houses and societies sold in any period can be
divided into groups (or strata) according to the long-run median price of their
respective suburbs. The mix-adjusted measure of the city-wide average price change
is then calculated as the average of the change in the medians for each group.
3.12 Hedonic method: Regression-based approaches have also been used by
researchers and are used in the official measures produced in some countries,

29
including the UK and US. One method is the hedonic approach, which involves
attempting to explain the price in each transaction by a range of property attributes,
such as the location, type and size of a property, as well as the period in which it was
sold. The index of house prices that results can be thought of as the average price
level of the transactions that occurred in each period, after controlling for the
observable attributes of the properties that were sold. Hence, a hedonic approach
can take account of shifts in the composition of transactions in each period. In
principle it can also control for quality improvements, although the ability to do so
in practice will depend on the comprehensiveness of data on housing characteristics.
Various hedonic methods for house price measures are presented in Annex 1.
3.13 Repeat-sales: An alternative regression-based approach is the repeat-sales
methodology. Rather than focusing on the price level in each transaction, this
approach relies on the observed changes in price for those properties that have been
sold more than once. Using a regression framework, it seeks to identify the common
component in price changes over time. One limitation of a pure repeat-sales
approach is that it uses only the data from those transactions involving properties
for which there is a record of an earlier sale. An additional factor is that estimates of
price changes in any quarter will generally continue to be revised based on sales that
occur in subsequent quarters.
3.14 In principle, both regression approaches can provide a broader control for
compositional change than a mix-adjusted measure, as they can control for more
characteristics of sales than a mix-adjusted measure. However, the possible
advantages come at a cost of requiring the use of statistical techniques that are more
complex, more data-intensive, and often require assumptions on the part of the
individual.
30
IV. Data Availability and Compilation of House Price Index in India
4.1 It is well acknowledged that property prices are an essential input into the proper
construction of measures of GDP and inflation. But, as the current global crisis
makes it clear, we may not undermine the importance of tracking property price
data in laying out the macroeconomic dimensions of our economy. It is, however,
necessary to consider alternative methodologies keeping in view of certain
constraints on the availability of data before proposing any specific choice. This is
more so in the context of India, where a proper statistical system of house price data
collection is yet to be established. Hence, we discuss below some of the existing
house price index methodologies in India purely from the view point of availability
of price data.
4.2 Based on the registration price data
4.2.1 Registration of property price is a legal and official necessity for any property
transaction in India. Therefore, in principle, the official authority of property
registration has the details of all transactions during a reference period. When
explored in Mumbai, we observed that the house price index for Greater Mumbai
could potentially be compiled based on the officially declared data on house
transactions obtained from the Department of Registration and Stamps (DRS),
Government of Maharashtra. The DRS provides the computerized data on the
registration of transactions (about 4.5 lakhs) of properties including shops, land and
residential flats located in Greater Mumbai, which were registered since March 2002
to the recent period. The data are available in a month lag, reported on a daily basis.
Basic information for Mumbai is available in Marathi. The data structure includes
the following fields: Date, registration number, village, survey no, area, giving party
name, taking party name, consideration amount and market value. From this, data
related to residential flats could be easily extracted and analysed for the compilation
of house price index in Mumbai on monthly or quarterly interval.
4.2.2 For example, taking year 2002-03 as the base year, house price indices could be
estimated from Q1: 2003-04 onwards. However, the data on prices of residential

31
flats require careful scrutiny to remove unacceptable data points. Certain ‘outliers’
could be taken care of using z-scores calculated separately for each stratum in each
month/quarter11. All the observations where z-score values lie within -3 and +3
could be accepted. Since the data do not include the information on type of house,
i.e., under-construction or new or resale house, the date of registration is considered
as date of sale of the house. Since registration is done at government rates, the DRS
data include both prices, viz., government price and transaction price. The analysis
of data as well as compilation of the index is done on the transaction price. While
interpreting the results, the fact may be taken into account that this price is the price
officially declared by the buyer. As the aim is to obtain the movement in the house
price, the data of officially declared price can be used to extract the house price
index.
4.2.3 For administrative purposes, Brihanmumbai Mahanagarpalika Corporation
(BMC) has divided Greater Mumbai into six zones, each consisting of three to five
wards, denoted by alphabets A to T. The data of the DRS has location as one of the
attributes. Based on the location of the house, its ward and zone can be identified.
Based on each flat's floor space area (FSA) data, for example, could be classified into
three categories namely <45 sq mt.(small house) , 45-90 sq.mt. (medium size house)
and >90 sq.mt.(large house). These classifications could be used for stratification in
weighted average methodology.
4.2.4 Finally, the house price indices could be calculated using weighted average
method. In the case of weighted average method, generally median is used as an
average. Also two different weighting diagrams could be used for obtaining two
different house price indices in weighted average method. One set of index could be
calculated with proportionate number of houses transacted as the weight, which
reflects the price appreciation. The other could be constructed with proportionate
11 The z- score is z=(x-μ)/σ where: x is the variable to be standardized, μ is the mean and σ is the standard deviation. The quantity z represents the distance between the individual observations and the population mean in units of the standard deviation. However, if median is used, z-score need not be used to eliminate extreme values.

32
amount transacted as the weight, which provides the measure of capital appreciation
and investment return. In the case of weighted average method, data could be
segregated in different dimensions namely size-wise, ward/zone-wise and four
types of indices could be constructed, viz., ward/zone HPI, FSA-HPI and City HPI.
The methodology for computing the respective indices is described in detail below.
4.2.5 Weighted Average Method (i) Ward/Zone HPI
To begin with a simple average (Median) of price (per square meter) of houses (Pij)
in each category classified by FSA in each quarter and for each ward/zone could be
calculated. Suppose, the proportions of number of houses transacted during in three
categories of FSA within a ward/zone during the period April 2002 – March 2003 are
taken as the weights (wi,j). Based on an average per square meter price for three FSA
category houses in each ward/zone, price-relative could be calculated for each
quarter. This price relative is nothing but a ratio of current period price to the base
period price. The quarterly ward/zone index could be calculated by taking weighted
average of those price-relatives in each ward.
Price relative per sq.mt for the ith FSA, jth Ward/Zone, tth Quarter
, ,, ,
, ,0
i j ti j t
i j
PRP
P= where
{ 45,45 90, 90}i∈ < − >
{ , & , , , , , , , , , , , , }j A BC E D F G H K L M N P R S T∈
{ 1, 2, 3, 4, 5, 6}j Zone Zone Zone Zone Zone Zone∈
{ 1: 2003 04, 2 : 2003 04,..., 1: 2009 10}t Q Q Q∈ − − −
, ,0i jP is the prices in the base period 2002-03.
The following formulae could be used for constructing the ward/zone HPI for the jth
ward/zone for tth quarter
Ward/Zone ,j tHPI = , , ,( ) 100i j t i ji
RP w× ×∑ for all j and t.
(ii) Size (Floor Space Area)-wise HPI

33
For deriving the FSA wise HPI, price relative indices for each category of houses
could be derived and then HPI could be constructed using proportion of number of
houses transacted in each ward to the total number of houses transacted in the city
(Wj) during the period April 2002 – March 2003 as the weight. Thus, the FSA (Floor
Space Area) wise HPI for the ith category, for tth quarter could be calculated using
following formulae.
FSA wise ,i tHPI = , ,( ) 100i j t jj
RP W× ×∑ for all i and t
(iii) City-wise HPI
Finally, the city HPI could be constructed by first finding the weighted relative
prices for each wards with weights being the proportions of number of houses
(value of houses) of different categories of FSA in each ward (wi,j) during the period
April 2002 – March 2003. These weighted relative prices could then be averaged
using proportion of number of houses (value of house) in each ward to the total
number (value) of houses in Mumbai during the period April 2002 – March 2003 as
the weight (Wj). The City HPI could thus be constructed using the following
formulae: City tHPI = , , ,( ( ) ) 100i j t i j jj i
RP w W× × ×∑ ∑ for all t.
4.2.6 Limitations: It is well known that the registered prices of houses are grossly
underestimated due to very high registration fees and stamp duty. The subsequent
obligations for the payment of property tax acts as a disincentive to individual
purchasers (except corporate bodies) for revealing the exact purchase price of a
house. There are certain other limitations in getting the registered property prices
data at regular intervals as property is a state subject. Moreover, registrations of the
properties are done taking into account different criterion in different states, some of
which are (a) partial consideration of un-divided share of land (b) partial
consideration of sale of terrace rights, (c) consideration of agreement to sale at the
time booking for total price, (d) sale deed only post completion of property. On the
other hand, the registration procedure and records maintenance are not
computerized in most of the states and the records are maintained in the regional
languages which necessitates further work with respect to bringing them into

34
common format. Getting segregated transactions on land, agreement, whether a land
is an agricultural land, sale deed, power of attorney, etc., is another challenge.
4.3 The Methodology and Framework of NHB RESIDEX
4.3.1 Pilot study for development of NHB RESIDEX covered 5 cities viz., Delhi,
Mumbai, Kolkata, Bangalore and Bhopal representing various regions of the
country. Actual transactions prices (including land, but excluding registration fee,
stamp duty, brokerage fee, etc.) were considered for the study in order to arrive at an
index which will reflect the market trends. The year 2001 was taken as the base year
for the study to be comparable with the WPI and CPI. Year to year price movement
during the period 2001-2005 were captured in the study, and subsequently updated
for two more years, i.e., up to 2007. NHB RESIDEX was expanded to cover ten more
cities, viz, Ahmedabad, Faridabad, Chennai, Kochi, Hyderabad, Jaipur, Patna,
Lucknow, Pune and Surat.
4.3.2 Further, NHB RESIDEX has been updated up to June 2009, with two half yearly
releases (Jan - June and July - Dec) during June 2009. At the time of last updation and
expansion of coverage of NHB RESIDEX to 10 more cities, the base year was shifted
from 2001 to 2007. NHB RESIDEX will be updated on half yearly basis, for the
present. In the first phase NHB RESIDEX will be expanded to cover 35 cities having
million plus population. The proposal is to expand NHB RESIDEX to 63 cities which
are covered under the Jawahar Lal Nehru National Urban Renewal Mission to make
it a truly national index. Prices have been studied for various administrative
zones/property tax zones constituting each city. The index has been constructed
using the weighted average methodology with Price Relative Method (Modified
Laspeyre’s approach).
4.3.3 In order to ensure representative coverage in the choice of the houses, market
segmentation was done in the following manner: (i) selected city level market was
segmented on the basis of the municipal administrative zones or property tax zones,
based the applicable zonal segmentation done by city authorities. (ii) Thereafter,

35
selection of locations was done on the basis of their spatial distribution across the
city. (iii) In each of the selected colony, both new and resale housing units have been
incorporated, including flatted and plotted developments, developed by various
housing agencies, including public housing agencies, private developers,
cooperative and informal land assembly mechanisms. (iv) Finally, to arrive at the
representative basket, the following category of housing products were covered: (a)
Economically Weaker Section (EWS) and Low Income Group (LIG) housing, upto 2
rooms and covered area less than 45 sq. m. (<500 sq. ft.), (b) Middle Income Group
(MIG) housing with 2 bed rooms and covered area between 45 and 90 sq. m. (500-
1000 sq. ft.) and (c) High Income Group (HIG) housing units with 3 bedrooms or
more and covered area more than 90 sq. m. (>1000 sq. ft.). The prices taken were the
transaction prices from the real estate agents/property dealers, private builders,
resident welfare associations. Transaction based volume weights were used at the
zone level and both transactions based and stock based weightings have been used.
4.3.4 Primary data on housing prices is being collected from real estate agents by
commissioning the services of private consultancy/research organisations of
national repute. In addition data on housing prices is also being collected from the
housing finance companies and bank, which is based on housing loans contracted by
these institutions. It is envisaged to develop a residential property price index for
select cities and subsequently an all India composite index by suitably combining
these city level indices to capture the relative temporal change in the prices of houses
at different levels.
4.3.5 Limitations: NHB RESIDEX is a pioneering attempt by National Housing Bank
to measure residential prices in India. NHB’s data base, however, does not cover
commercial properties. Another limitation is that though NHB RESIDEX is very
broad based, it is available with half-yearly frequency with a time-lag. What RBI
needs is a quick understanding about emerging trend on real estate prices and rent
as it would provide valuable inputs for monetary policy formulation on a
monthly/quarterly basis. In this context, NHB RESIDEX has limited utility.
36
4.4 Commercial Banks Property Price Index
4.4.1 Housing and related issues are an important subject for any economy. From
the point of view of the financial sector, there are risk exposures for both lenders and
borrowers. Banks as well as corporate having large exposure to real estate/housing
may get affected by volatility in house prices. Further, real estate property prices are
an important consideration for commercial banks as being useful inputs in their
lending decisions. To mortgage lenders, the tracking of real estate prices is also
important from the point of view of their portfolio management.
4.4.2 Some of the commercial banks in India are tracking real estate prices regularly
by constructing property price indices. For the construction of the same, the
approach followed is as follows: Cities are divided into different areas based on
geographical and similar socio economic considerations. PIN codes are used in large
cities for the division. Such areas are then clubbed into zones, most of the cities are
having 5-6 zones based on the geographical proximity. Separate indices are prepared
for areas, zones and then for city as a whole. Data are culled out from mortgage
business data system of the bank and segregated on quarterly basis for various areas.
Sample of 5 per cent entries are checked for the accuracy of the data.
4.4.3 From the commercial banks side, every loan disbursed is valued by in-house
valuers. The prices of the flats/houses which have been appraised by the valuers
during the particular quarter form the basket for that particular quarter are used as
the price. Area-wise base period weights are derived from the total number of
transactions done in the base period quarter. Such indices help to capture asset price
trends in different areas. Property price indices are calculated for area, zone and city
separately.

37
5. Proposed Approach and Recommendations
5.1 Property prices - residential and commercial - have a variety of important uses.
For national income accountants, they are used for calculating both investment and
consumption. The former is about building costs, while the latter is about service
flows. For consumer price index construction, residential property prices are an
input into the computation of the price of housing services for owner occupiers. For
bankers, as well as their regulators and supervisors, these property prices are
important in helping them to estimate the value of collateral backing loans; similarly
for people trying to estimate the value of securities backed by pools of loans
collateralized by property.
5.2 In particular, the real estate price index could potentially be the first available
index to measure the performance of income producing real estate and would be the
primary index that institutional investors may rely on for benchmarking the
performance of real estate. It could be created to understand how the performance of
real estate compares with other asset classes such as stocks and bonds and also to
provide a better understanding of the risk and return for commercial real estate. The
index may be used as a basis for developing diversification strategies such as the
percentage allocation to real estate to minimise risk for a target portfolio return.
Also, sub-indices such as for office, retail, industrial and apartment properties may
be used to determine how to diversify by property type. Similarly, sub-indices by
regions of the country may be used for geographic diversification.
5.3 Real estate property prices can be obtained from many sources. These include
government registration authority, builders, real estate agents, individual buyers
and sellers, housing societies, banks, housing finance companies and various other
market participants. As real estate property is associated with a status value and has
tendency of overpricing/underpricing, a survey based approach from individual
buyers and sellers may depict an erroneous picture of the property movements.
Similarly, data collected through a survey schedule from the real estate agents and

38
societies are fraught with practical difficulties. Builders on the other hand may not
disclose property price information due to the intense competition across the sector.
As mentioned earlier, registered prices of houses are grossly underestimated due to
very high registration fees and stamp duty.
5.4 Why banks data to be used
5.4.1 It can be argued that at a basic level there is plenty of information on real estate
prices and that the issue is the failure to capture it and to convert into a usable form
for analytical purposes. This is so both at the national and sub national level. Users
in individual states can be confronted either with a lack of relevant statistics or with
different statistics for different time periods and with varying time-lags and based
on different data sources or compilation methods. Thus there is an increasing user
demand for relevant statistics on real estate prices.
5.4.2 There are two categories of data that might be used to construct house price
indices; household surveys and administrative data on actual transactions. Although
the former offers the potential advantage of considering the prices of an identical or
at least comparable group of houses, the disadvantage of relying on estimated as
opposed to actual prices has been felt to be so important that almost all house price
indices rely on transactions data. Actual transactions have their own problems. Like
all administrative data they have to be adjusted to fit statistical purposes.
5.4.3 Due to changes in banking laws and policies, banks are increasingly active in
home financing. In acquiring mortgages on real estate, these institutions follow two
main practices, viz., first, some of the banks maintain active and well-organized
departments whose primary function is to compete actively for real estate loans. In
areas lacking specialized real estate financial institutions, these banks become the
source for residential and farm mortgage loans. Second, these banks themselves
construct, maintain and track real estate property prices indices. Appraisal values
could be effectively used to calculate the real estate price index based on appraisals.
This is because the prices of real estate properties are not stated correctly by the
39
buyers. The appraisal values rather than transaction prices could be used to calculate
the index. Thus, the Group recommends sourcing the real estate property price
data in the form of sale/resale directly from the scheduled banks (covering both
commercial and urban cooperative banks), and housing finance companies like
HDFC Realty and LIC Housing Finance, etc., from selected centres. Presumably,
transaction level data are available in electronic form with these organisations.
5.5. Centre Selection: As per the latest information available with RBI, commercial
banks’ disbursement towards housing loans to top 30 centres in India constituted
nearly 70 per cent of the total housing loans of all commercial banks. A list of these
centres is presented in Annex 2. Final selection of the centres is based on the joint
considerations of disbursement of housing loans by banks and also taking into
account regional representation. Therefore, as indicated in the terms of reference
and considering the relative importance and geographical representations, the
Group recommends collecting house price data at transaction level from top 13
centres: Greater Mumbai, Chennai, NCR Delhi, Bangalore, Hyderabad, Kolkata,
Pune, Jaipur, Greater Chandigarh, Ahmedabad, Lucknow, Bhopal and
Bhubaneswar. For monitoring overall asset price movement, selection of these
centres fairly captures the regional dimension also.
5.6. Survey Schedule: As the data are being sourced from the banks, a survey schedule
is basically a return prescribed for the said purpose. The proposed return includes
variables like type of property (including both real estate and commercial), address,
type of transaction, valuation price of the property, purchase price of property and
loan amount taken from the bank other than the information on certain
characteristics of the borrower (viz. gender, employment, monthly income, etc.).
With a view to capture some related indicators of financial stability, selected
characteristics of the borrower are also included. A copy of the proposed return is
presented in Annex 3.
5.7 House rent data: In order to compile a CPI which takes into account the
consumption patterns of all segments of the population, CSO has taken steps to
40
collect price and rent data from all the States and UTs. All cities/Towns having
population (2001 Population Census) more than 9 lakh and all State/UT capitals not
covered therein were selected purposively. In all 310 towns from all categories of
towns have been selected either on purposively or random basis from which 1114
price schedules (quotations) are canvassed every month. For each quotation six
rented dwellings have also been selected for house rent data collection. For each
town, total number of dwellings identified were distributed over different number of
living rooms as per the state level percentage distribution of dwellings by number of
living rooms, obtained from the NSS 58th Round Survey on Housing Conditions
(July – December, 2002). Dwellings were also distributed to different segments of
the population (poor, middle and affluent) keeping in view the local conditions in
the town. Allocation of dwellings among three segments of the population was
done judiciously i.e. lesser number of dwellings units were distributed to poor
segment and other dwelling to middle and affluent classes. A total of 6684 dwellings
have been selected from the 310 towns for house rent data collection at six monthly
intervals. As regards to the base year of CPI(Urban), the TAC on SPCL in its 48th
meeting held on 31st December, 2009 has decided that inflationary trends in the
initial three to four months of 2010 might be examined for the base year selection as
the year 2009 is not a normal year. The CPI (Urban) indices would be compiled at the
State & UT level only not at city/town level. House Rent Indices, therefore, would
be available only at State/UT level. Considering the practical difficulty of
collection of house rent data, the Group recommend using official data on house
rent index of CPI(Urban) being released by CSO. For monitoring purpose, RBI
needs to track both sale/resale price index as well as the rent index on a regular
basis.
5.8 Frequency of compilation: The Group recommends compiling real estate price
index on quarterly intervals so as to capture the movement of these prices on a
more frequent basis.
5.9 Proposed Real Estate Price Index Methodology: The Group recommends undertaking
this exercise in stages. To begin with, two cities (say for Delhi and Mumbai) may be
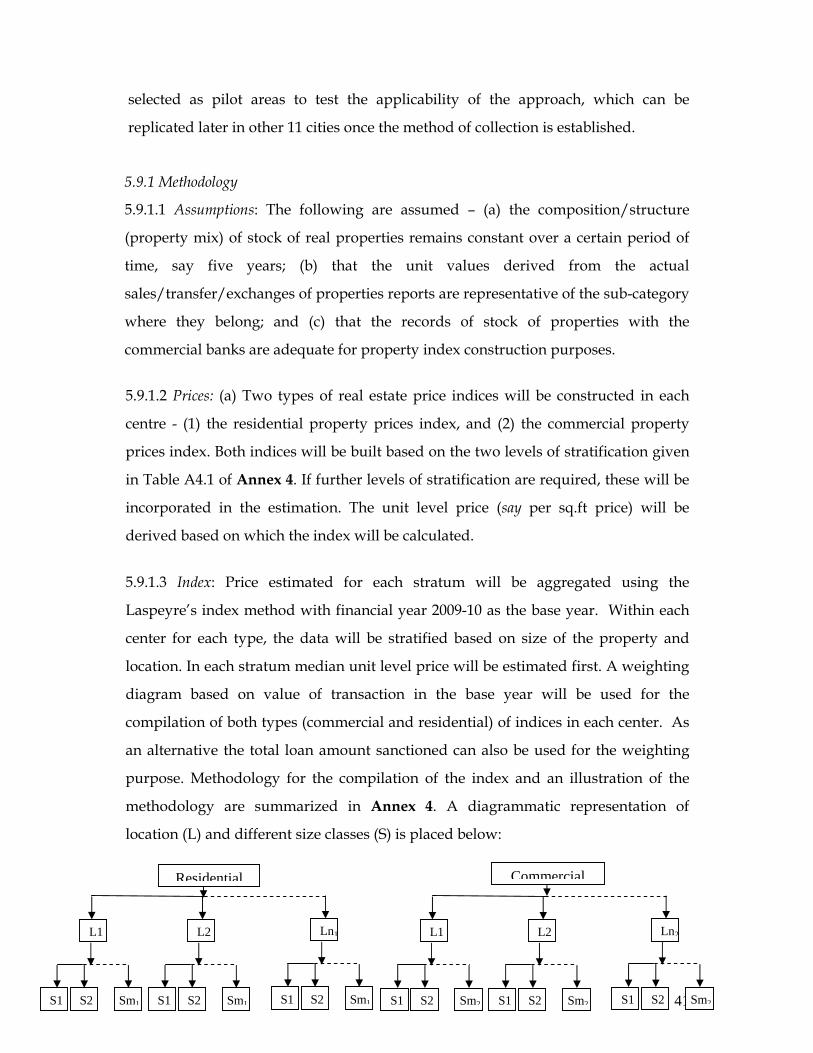
41
selected as pilot areas to test the applicability of the approach, which can be
replicated later in other 11 cities once the method of collection is established.
5.9.1 Methodology
5.9.1.1 Assumptions: The following are assumed – (a) the composition/structure
(property mix) of stock of real properties remains constant over a certain period of
time, say five years; (b) that the unit values derived from the actual
sales/transfer/exchanges of properties reports are representative of the sub-category
where they belong; and (c) that the records of stock of properties with the
commercial banks are adequate for property index construction purposes.
5.9.1.2 Prices: (a) Two types of real estate price indices will be constructed in each
centre - (1) the residential property prices index, and (2) the commercial property
prices index. Both indices will be built based on the two levels of stratification given
in Table A4.1 of Annex 4. If further levels of stratification are required, these will be
incorporated in the estimation. The unit level price (say per sq.ft price) will be
derived based on which the index will be calculated.
5.9.1.3 Index: Price estimated for each stratum will be aggregated using the
Laspeyre’s index method with financial year 2009-10 as the base year. Within each
center for each type, the data will be stratified based on size of the property and
location. In each stratum median unit level price will be estimated first. A weighting
diagram based on value of transaction in the base year will be used for the
compilation of both types (commercial and residential) of indices in each center. As
an alternative the total loan amount sanctioned can also be used for the weighting
purpose. Methodology for the compilation of the index and an illustration of the
methodology are summarized in Annex 4. A diagrammatic representation of
location (L) and different size classes (S) is placed below:
Residential
L1
S1 S2 Sm1
L2
S1 S2 Sm1
Ln1
S1 S2 Sm1
Commercial
L1
S1 S2 Sm2
L2
S1 S2 Sm2
Ln2
S1 S2 Sm2

42
5.10 The Group deliberated on relying only on the bank data because of possible
problem of representation for the economy as a whole. The Group felt necessary to
supplement the bank data through a survey conducted annually. This will also
ensure robustness of the data available with the banking system. It is emphasized
that in collection of the house price data, sampling frame becomes large. So the
stratification criteria and weights are to be decided in an appropriate manner so that
every stratum is well represented in the sample. In this context, the Group
recommended selecting random sample from the available data from banks and
follow the method of similar to post-enumeration check.
5.11 Institutional set up: Importance of real estate asset price monitoring in RBI is
enormous. Besides monetary policy and financial stability angle, real estate price
index of RBI being proposed here has the potential of a national-level price index.
This new endeavour would undergo various stages of implementation which needs
to resolve associated challenges. The proposed statistical system needs to be
structured organisationally as a separate unit in the Statistics Department of RBI.

43
Annex 1 A1.1 Time dummy variable index method: A time dummy hedonic regression model
is specified with the characteristics as independent variables and the natural log of
the collected price as the dependent variable. Model specification for the time
dummy method look like this:
∑=
+++=k
iitkttitkktit Dzp
1)ln( εδβα (A1.1)
For k set of observations and time period t and not all good appearing in all periods,
pit is the price of ith observation in tth time period expressed in natural logarithmic
scale. α is the constant term, βk is the regression coefficient or implicit hedonic price,
zk is the value of the characteristics, δt is the regression coefficient for time dummy,
Dt is the time dummy variable with a value of 1 in period t and 0 otherwise and εit,
error term.
A1.2 The quality-adjusted price index can be calculated directly by taking the
exponential of the time-dummy coefficients of interest after estimating the
regression coefficients. In other words, Index = exp (δt), where δt is the regression
coefficient of the time dummy when the hedonic functional form is semi-log. When
we compare the relative price of a good, between period t and period t-1, for any
given quality specification, represented by z, then this ratio is equal to the relative
exponential of the time dummy variables. This is the simplest and most common
approach. Many statistical agencies world-wide use this method to calculate price
indexes.
A1.3 Whenever an item replacement takes place between the base and reference
periods, quality change potentially occurs. The change in quality due to item
replacement is taken care of by the associated characteristics, and the pure price
change will be captured by the regression coefficient of the time dummy variable.
The disadvantage of the time dummy variable index is that it is sensitive to
specification bias and multi-collinearity. Multi-collinearity arises when the

44
independent variables are correlated, violating one of the basic assumptions of the
multiple regression concept.
A1.4 Characteristics price index method: An alternative approach for a comparison
between price of houses in period ‘t’ and ‘t+1’ is to estimate a hedonic regression for
period ‘t+1’, and insert the values of the characteristics of modal house in period ‘t’
into the period ‘t+1’ regression. This would generate predictions of the price of
modal house existing in period ‘t’, at period ‘t+1’ shadow or implicit prices. This
price can be compared with the price of the modal house in period ‘t’ obtained from
regression for period ‘t’.
Similarly another set of implicit prices could be generated by inserting the
characteristics of modal house of period ‘t+1’ into the period ‘t’ regression
coefficients. This price is then compared with the price of the same modal house in
period ‘t+1’ obtained from regression equation for period ‘t+1’.
The geometric mean of these two indexes gives us the desired characteristics price
index. Let the regression equation for the period ‘t’ be given as
∑=
++=k
iititittit xp
10ln εββ (A1.2)
where xit = variable for characteristics i and β0 , βi are the partial regression
coefficients.
Substituting in regression equations of t and t+1, specification of modal house itX in
the period t, we have
∑=
++=k
iititittit Xp
10ln εββ and
∑=
++++ ++=k
iititittit Xp
111101ln εββ
The hedonic index specification in period t = itit pp /1+ (A1.3)
Similarly, substituting average specification 1+itX in the period t+1 for variables in
regression equations of ‘t’ and ‘t+1’, we have

45
∑=
+ ++=k
iititittit Xp
110
'ln εββ and
∑=
++++ ++=k
iititittit Xp
11110
'1ln εββ
The hedonic index specification in period t = '
'1
it
itp
p + (A1.4)
and the final hedonic index is the geometric mean of (A1.3) and (A1.4).
Geometric mean of (A1.3) and (A1.4) = ⎟⎠⎞
⎜⎝⎛⎟
⎠
⎞⎜⎝
⎛++
'
'11 *
it
it
it
itp
pp
p (A1.5)
In other words, this is nothing but the valuation of the typical base period (t) house
by the current period’s implicit prices, obtained from the current period’s hedonic
function, and compared with the same valuation for the base period. This is
analogous to the Laspeyres type price index. Similarly the alternative index is the
comparison of typical current period’s price with the hedonic function of the base
period. The geometric mean of these two indexes would give the desired
characteristics price index.

46
Annex 2
Top 30 centres arranged according to housing loan in 2008
1 MUMBAI 2 CHENNAI 3 DELHI 4 BANGALORE 5 HYDERABAD 6 KOLKATA 7 PUNE 8 JAIPUR 9 CHANDIGARH
10 THIRUVANANTHAPURAM 11 KOCHI 12 AHMEDABAD 13 LUCKNOW 14 BHUBANESWAR 15 COIMBATORE 16 INDORE 17 LUDHIANA 18 NAGPUR 19 MANGALORE 20 BHOPAL 21 VISAKHAPATNAM 22 KANPUR 23 NEW BOMBAY 24 THANE 25 MYSORE 26 GURGAON 27 VIJAYAWADA 28 VADODARA 29 JALANDHAR 30 SURAT

47
Annex 3
Return – Real Estate Asset Price Monitoring
I. Type of property
Residential Commercial II. Type of transaction
Sale Resale III. Address of property [State …………. City ………….. Location……….. Pin……….] IV. Characteristics of the transaction
1. Floor space area (sq. ft.): __________
2. Date (dd/mm/yyyy) of disbursement of first loan 3. Purchase Price (incl. land, but excl. registration fee, stamp duty, brokerage
fee, etc.)
[Rs. lakhs] _________________________________ 4. Valuation Price of the Property [Rs. Lakhs] _________________________
(as valued by the lender) V. Characteristics of borrower
1. Gender of borrower: Male Female
2. Whether the borrower is:
Self-employed/Business-person Other Employed Others
3. Monthly income (Rs.) of the borrower _________
VI. Other financial information
1. Loan amount taken (Rs. lakh) _________
2. Maturity period (Contractual) _________
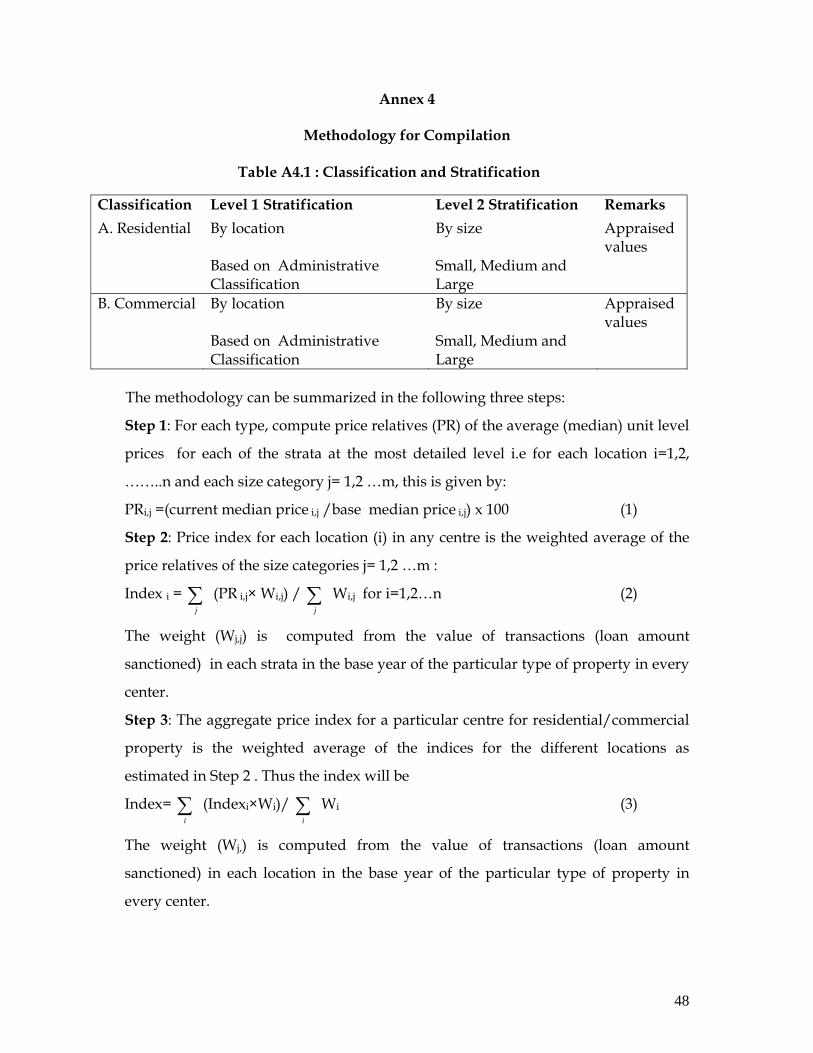
48
Annex 4
Methodology for Compilation
Table A4.1 : Classification and Stratification
Classification Level 1 Stratification Level 2 Stratification Remarks A. Residential By location By size Appraised
values Based on Administrative
Classification Small, Medium and Large
B. Commercial By location By size Appraised values
Based on Administrative Classification
Small, Medium and Large
The methodology can be summarized in the following three steps:
Step 1: For each type, compute price relatives (PR) of the average (median) unit level
prices for each of the strata at the most detailed level i.e for each location i=1,2,
……..n and each size category j= 1,2 …m, this is given by:
PRi,j =(current median price i,j /base median price i,j) x 100 (1)
Step 2: Price index for each location (i) in any centre is the weighted average of the
price relatives of the size categories j= 1,2 …m :
Index i = j∑ (PR i,j× Wi,j) /
j∑ Wi,j for i=1,2…n (2)
The weight (Wj,j) is computed from the value of transactions (loan amount
sanctioned) in each strata in the base year of the particular type of property in every
center.
Step 3: The aggregate price index for a particular centre for residential/commercial
property is the weighted average of the indices for the different locations as
estimated in Step 2 . Thus the index will be
Index= i∑ (Indexi×Wi)/
i∑ Wi (3)
The weight (Wj,) is computed from the value of transactions (loan amount
sanctioned) in each location in the base year of the particular type of property in
every center.

49
Illustration of Methodology
Let us consider the case of residential properties in Mumbai. Here the stratification
can be made according to six administrative zones say Zone 1 to Zone 6; and three
size categories based on floor space area, say Small (Less than 500 Sq.ft), Medium
(500-1000 Sq.ft) and Large (More than 1000 Sq.ft). Thus here we have 18 stratum in
total (Six stratum in first level of stratification and three in second making 6x3=18
stratum).
Let the quarter for which the index to be compiled is Q1 of 2010 (t1); and the base
year is 2009(tB). In the first step the unit value prices (per square feet prices) for the
individual cases are obtained dividing the prices by the area (Sq.ft). The median is
obtained next for 18 stratums separately in tB and t1. The price relatives is then
calculated for each of the 18 strata by using the equation (1). Subsequently following
Step 2 and Step 3 the Residential index for Mumbai for Q1:2010 can be calculated. A
numerical example is given in Table A3.2 using assumed values.
Table A4.2 Illustration for the Steps Involved
Z1 Z2 ….
S M L S M L S M L
2009 (tB) Median 1000 1500 2000 1500 2000 2500 …. …. ….
Q1:10(t1) Median 1500 3000 4000 1500 3000 5000 …. …. ….
PR=t1/tB *100 150 200 200 100 150 200 …. …. ….
Weights 0.50 0.25 0.25 0.60 0.20 0.20 …. …. ….
Zone Index 150*0.5+200*0.25+200*0.25 = 175
100*0.6+150*0.2+200*0.2 = 130 ….
Weights 0.30 0.20 … Residential Index Mumbai for Q1:10 175*0.3+130*0.2+150*0.1+200*0.1+150*0.2+100*0.1=138.5
50
Annex 5
Property markets in some of the key emerging market Asian Economies
Housing has a critical role of anchoring the economic growth expectations in most of
the island countries of the south-east Asian economies like Singapore, Malayasia,
Taiwan, Thailand, and Indonesia. In a recent paper brought out by the ECB (“Wealth
Effects in Emerging Market Economies” by Tuomas A. Peltonen, Ricardo M. Sousa and
Isabel S. Vansteenkiste, Working Paper Series No 1000, January 2009), the
importance of housing, stock market, and money wealth effects on consumption has
been brought out very clearly in respect of the emerging market economies. Using
quarterly data of fourteen such countries for the period 1990:1-2008:2, it has been
observed that : (i) wealth effects are statistically significant and relatively large in
magnitude; (ii) housing wealth effects tend to be smaller for Asian emerging markets
while stock market wealth effects are, in general, smaller for Latin American
countries; (iii) housing wealth effects have increased for Asian countries in recent
years; and (iv) consumption reacts stronger to negative than to positive shocks in
housing and financial wealth. There is a large body of literature that studies the
effect of asset price fluctuations on private consumption and authors have used
different econometric techniques and databases to address the issue. More recently,
interest in the topic has regained ground against the background of the current
financial turmoil which has led to concerns by numerous academics, central banks
and governments about the potential macroeconomic implications of a downturn in
house and equity prices.
Property markets have certain distinctive features that distinguish real estates from
the other asset class namely (i) Supply of property is intensively local and inelastic
with varying degrees depending on a host of factors like availability of land, basic
amenities, key infrastructural facilities, length of planning and construction phases
as also regulatory and availability of housing finance at affordable rates. (ii) Delivery
of the new stock can take quite a long time owing to the. (iii) Rents could be sticky
because of the use of long-term rental contracts. (iv) Market prices lack transparency
and most transactions occur through bilateral negotiations. (v) Liquidity is
51
constrained because of transaction costs. (vi) Borrowers rely heavily on external
finance. Another feature that is increasingly being revealed is that an inevitable
cyclical behaviour in housing prices backed by behavioural aspects could become
disruptive and broad-based through huge swings in the residential house prices,
particularly so in a developed market condition without having concomitant
governance and regulatory structure.
Some of the emerging market economies in Asia, have become systemically
important because of reasons rooted in the Asian crisis episode. Current status on
the housing price scenarios in some of these key emerging market economies with a
side-by side comparable picture drawn from the developed economies would
highlight the attendant issues and importance attached with the housing prices.
Everywhere there is a precipitous feeling about runaway asset bubble formation of
another kind, particularly in the countries where there exist developed kind of
market structure because of world-wide loose and accommodative macroeconomic
policy stances, both on the fiscal and monetary fronts. Trying to stabilize asset prices
is problematic for a variety of reasons, not the least of which is that it is nearly
impossible to know for sure whether a given change in asset values result from
fundamental factors or not. A convergent view that emerged in the past among the
mainstream monetary policy makers is that they need not respond to changes in
asset prices, except that they signal changes in expected inflation. However, it could
be necessary to respond to the toxic side effects of asset price bubbles for financial
stability purpose. Nominal monetary shocks try to create real effects on activity
primarily because certain prices and wages do not adjust pro rata so that the initial
effects of monetary shocks is likely to be much more on flexible asset prices.
Theoretically, therefore, this combination of flexible asset prices and sticky
goods/labour prices could lead to overshooting in asset prices. It could depend on
the size of monetary shocks and the local structure of the asset market like say that
of real estate market. Due to unprecedented size of monetary as well as fiscal
stimulus arranged across the world economies to arrest deflationary impact of the
sub-prime led housing bubble busting, flexible asset markets have probably buoyed

52
upwards, particularly in the well organized markets for equities and housing. All
these have made the central banks poring over asset price movements with a
hitherto unprecedented gusto so as to understand the nature of recovery and
sustainability of such price movements.
A5.1 Among the Asian leaders in the housing sector, Singapore has a success story
to narrate so far as asset price and bubble-bust impact on growth is concerned; it
seems to be coming out relatively unscathed second time in the recent reckoning
since the Asian Financial Crisis, confirming thereby an efficient regime of
governance and market regulatory structure. The country is also expressing its
thankfulness to a series of well-timed and well-thought-through domestic measures,
and very effective stimulus packages in China, India and Indonesia. When the year
2009 began, Singapore economy was forecasted to shrink by up to 8 per cent, which
turned out to be close to – 2 per cent, a 6 percentage point improvement. Singapore’s
natural peer group, the developed economies however, continue to suffer recession
and high unemployment. On the other hand recessionary spell across the developed
economies is set for, as it were, a heightened “normal” level of unemployment, with
the United States hitting a 10.2 per cent, Britain 7.9 per cent, France 8.3 per cent and
Ireland 12.5 per cent. Ireland’s case, of course has become a telling one; with the
property prices down by 18 per cent, GDP has shrunk by 13.6 per cent from its peak!
The year 2009 for Singapore was almost poised to trudge the grim Irish path, but
thank to its Asian stature and prudent saving behavior, it could augur the lamp
bearer of emerging Asian markets backed by China and India. House prices in
Singapore recovered very fast as portrayed in the following chart.
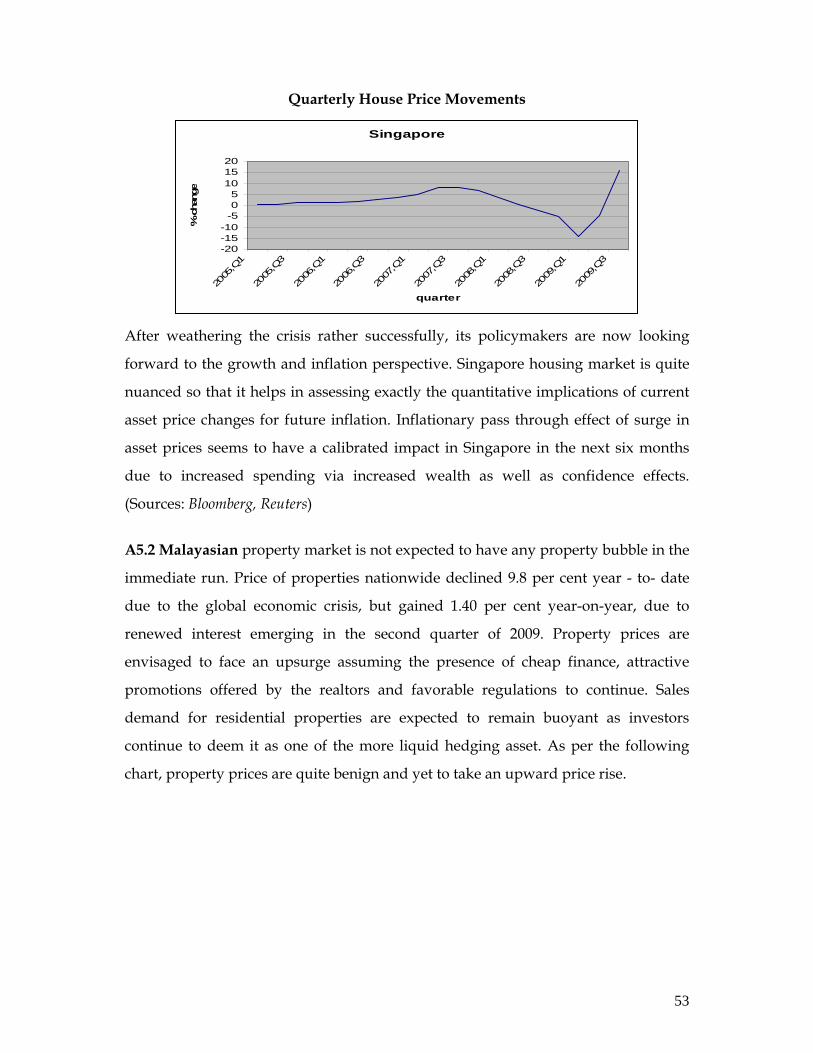
53
Quarterly House Price Movements
Singapore
-20-15-10-505
101520
2005
,Q1
2005
,Q3
2006
,Q1
2006
,Q3
2007
,Q1
2007
,Q3
2008
,Q1
2008
,Q3
2009
,Q1
2009
,Q3
quarter
% c
hang
e
After weathering the crisis rather successfully, its policymakers are now looking
forward to the growth and inflation perspective. Singapore housing market is quite
nuanced so that it helps in assessing exactly the quantitative implications of current
asset price changes for future inflation. Inflationary pass through effect of surge in
asset prices seems to have a calibrated impact in Singapore in the next six months
due to increased spending via increased wealth as well as confidence effects.
(Sources: Bloomberg, Reuters)
A5.2 Malayasian property market is not expected to have any property bubble in the
immediate run. Price of properties nationwide declined 9.8 per cent year - to- date
due to the global economic crisis, but gained 1.40 per cent year-on-year, due to
renewed interest emerging in the second quarter of 2009. Property prices are
envisaged to face an upsurge assuming the presence of cheap finance, attractive
promotions offered by the realtors and favorable regulations to continue. Sales
demand for residential properties are expected to remain buoyant as investors
continue to deem it as one of the more liquid hedging asset. As per the following
chart, property prices are quite benign and yet to take an upward price rise.
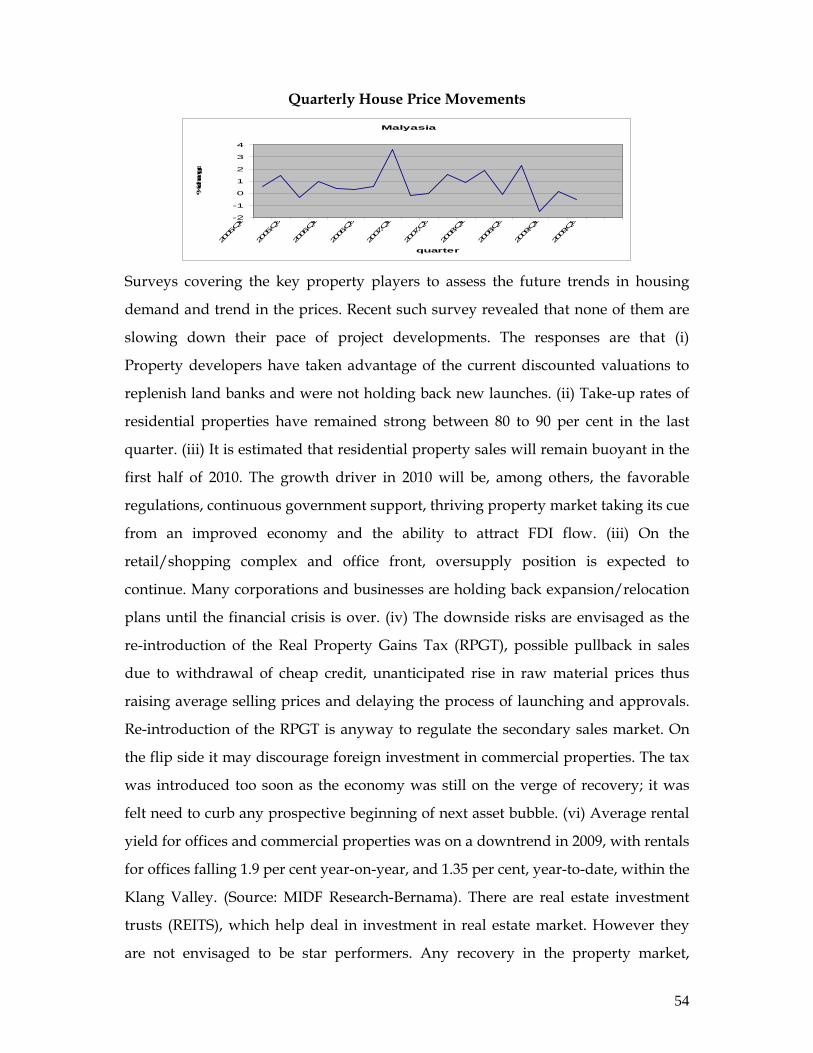
54
Quarterly House Price Movements
Malyasia
-2
-1
0
1
2
3
4
2005,Q1
2005,Q3
2006,Q1
2006,Q3
2007,Q1
2007,Q3
2008,Q1
2008,Q3
2009,Q1
2009,Q3
quarter
% chang
e
Surveys covering the key property players to assess the future trends in housing
demand and trend in the prices. Recent such survey revealed that none of them are
slowing down their pace of project developments. The responses are that (i)
Property developers have taken advantage of the current discounted valuations to
replenish land banks and were not holding back new launches. (ii) Take-up rates of
residential properties have remained strong between 80 to 90 per cent in the last
quarter. (iii) It is estimated that residential property sales will remain buoyant in the
first half of 2010. The growth driver in 2010 will be, among others, the favorable
regulations, continuous government support, thriving property market taking its cue
from an improved economy and the ability to attract FDI flow. (iii) On the
retail/shopping complex and office front, oversupply position is expected to
continue. Many corporations and businesses are holding back expansion/relocation
plans until the financial crisis is over. (iv) The downside risks are envisaged as the
re-introduction of the Real Property Gains Tax (RPGT), possible pullback in sales
due to withdrawal of cheap credit, unanticipated rise in raw material prices thus
raising average selling prices and delaying the process of launching and approvals.
Re-introduction of the RPGT is anyway to regulate the secondary sales market. On
the flip side it may discourage foreign investment in commercial properties. The tax
was introduced too soon as the economy was still on the verge of recovery; it was
felt need to curb any prospective beginning of next asset bubble. (vi) Average rental
yield for offices and commercial properties was on a downtrend in 2009, with rentals
for offices falling 1.9 per cent year-on-year, and 1.35 per cent, year-to-date, within the
Klang Valley. (Source: MIDF Research-Bernama). There are real estate investment
trusts (REITS), which help deal in investment in real estate market. However they
are not envisaged to be star performers. Any recovery in the property market,
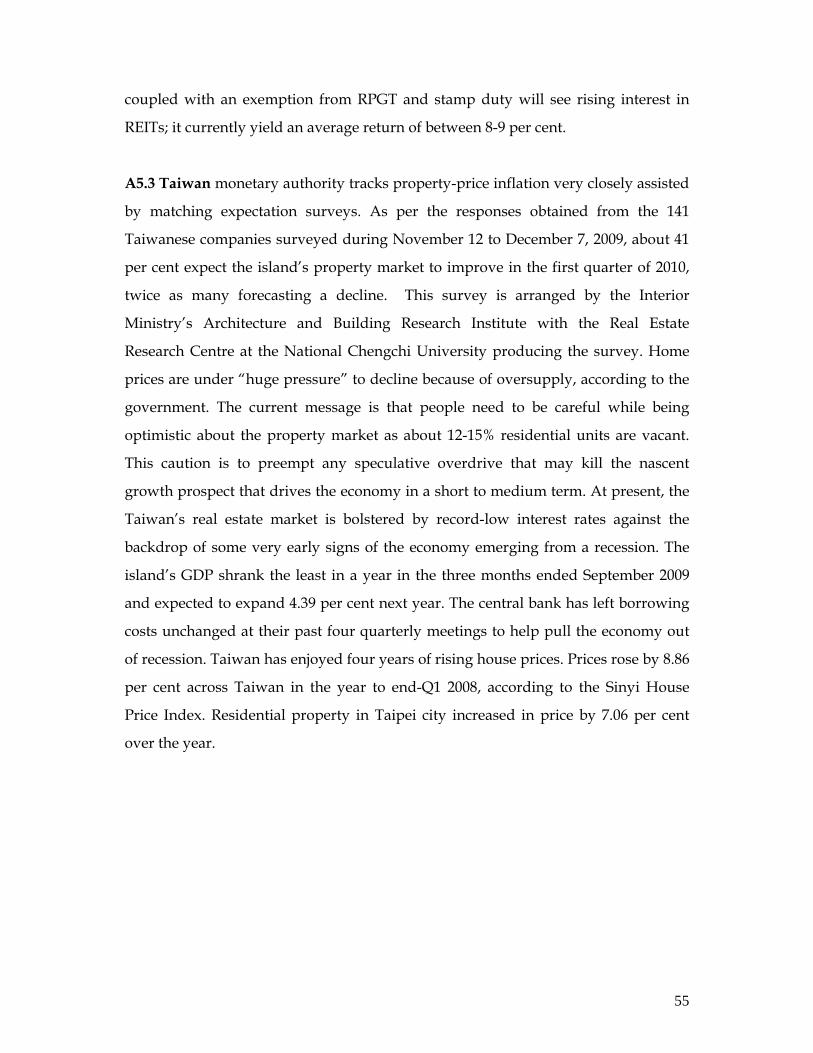
55
coupled with an exemption from RPGT and stamp duty will see rising interest in
REITs; it currently yield an average return of between 8-9 per cent.
A5.3 Taiwan monetary authority tracks property-price inflation very closely assisted
by matching expectation surveys. As per the responses obtained from the 141
Taiwanese companies surveyed during November 12 to December 7, 2009, about 41
per cent expect the island’s property market to improve in the first quarter of 2010,
twice as many forecasting a decline. This survey is arranged by the Interior
Ministry’s Architecture and Building Research Institute with the Real Estate
Research Centre at the National Chengchi University producing the survey. Home
prices are under “huge pressure” to decline because of oversupply, according to the
government. The current message is that people need to be careful while being
optimistic about the property market as about 12-15% residential units are vacant.
This caution is to preempt any speculative overdrive that may kill the nascent
growth prospect that drives the economy in a short to medium term. At present, the
Taiwan’s real estate market is bolstered by record-low interest rates against the
backdrop of some very early signs of the economy emerging from a recession. The
island’s GDP shrank the least in a year in the three months ended September 2009
and expected to expand 4.39 per cent next year. The central bank has left borrowing
costs unchanged at their past four quarterly meetings to help pull the economy out
of recession. Taiwan has enjoyed four years of rising house prices. Prices rose by 8.86
per cent across Taiwan in the year to end-Q1 2008, according to the Sinyi House
Price Index. Residential property in Taipei city increased in price by 7.06 per cent
over the year.
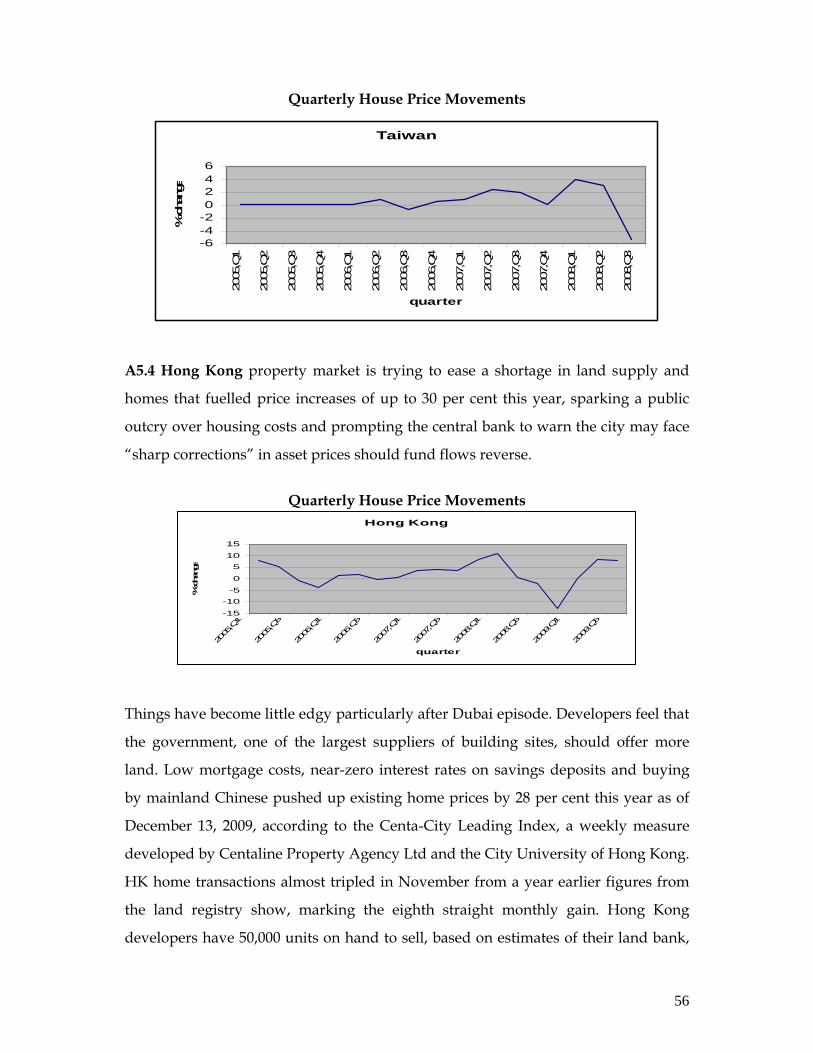
56
Quarterly House Price Movements
Taiwan
-6-4-20246
2005
,Q1
2005
,Q2
2005
,Q3
2005
,Q4
2006
,Q1
2006
,Q2
2006
,Q3
2006
,Q4
2007
,Q1
2007
,Q2
2007
,Q3
2007
,Q4
2008
,Q1
2008
,Q2
2008
,Q3
quarter
% cha
nge
A5.4 Hong Kong property market is trying to ease a shortage in land supply and
homes that fuelled price increases of up to 30 per cent this year, sparking a public
outcry over housing costs and prompting the central bank to warn the city may face
“sharp corrections” in asset prices should fund flows reverse.
Quarterly House Price Movements
Hong Kong
-15
-10-5
0
510
15
2005,Q1
2005,Q3
2006,Q1
2006,Q3
2007,Q1
2007,Q3
2008,Q1
2008,Q3
2009,Q1
2009,Q3
quarter
% cha
nge
Things have become little edgy particularly after Dubai episode. Developers feel that
the government, one of the largest suppliers of building sites, should offer more
land. Low mortgage costs, near-zero interest rates on savings deposits and buying
by mainland Chinese pushed up existing home prices by 28 per cent this year as of
December 13, 2009, according to the Centa-City Leading Index, a weekly measure
developed by Centaline Property Agency Ltd and the City University of Hong Kong.
HK home transactions almost tripled in November from a year earlier figures from
the land registry show, marking the eighth straight monthly gain. Hong Kong
developers have 50,000 units on hand to sell, based on estimates of their land bank,

57
sites under constructions and homes that were built, compared with 73,000 units in
September 2007. The Hang Seng Property index, which tracks the city’s biggest
developers, has risen 61 per cent this year, making it the best-performing component
in the benchmark.
A5.5 In South Korea, the Seoul house price index inched up in 2009, rising 3.6 per
cent (2.8 per cent in real terms) from April to October 2009. Nationally, the house
price index rose 2.1% (1.3% in real terms) over the same period, according to data
from Koomin Bank. However the government moved swiftly to tighten loan
conditions, to forestall a perceived housing bubble. In July, it reduced loan-to-value
ratios from 60% to 50% for the purchase of properties in Seoul and other urban
areas. It also instructed banks to scrutinize borrowers’ income when granting loans.
In Korea, every time residential property prices rise sharply, the government
intervenes. For instance in 2006, when the index rose 18.9 per cent (16.4 per cent in
real terms) in Seoul, capital gains taxes fore properties in “speculative areas” were
hiked.
Quarterly House Price Movements
South Korea
-2-1012345
2005
,Q1
2005
,Q3
2006
,Q1
2006
,Q3
2007
,Q1
2007
,Q3
2008
,Q1
2008
,Q3
quarter
% cha
nge
House price rises slowed in 2007 to 5.4 per cent in Seoul (1.75 per cent in real terms)
and 3.1 per cent nationally (0.6 per cent in real terms). In 2008, house price rises were
a mere 5 per cent for Seoul (0.86 per cent after inflation) and 3.1 per cent nationally (-
1.5 per cent after inflation). The quick recovery of house prices in 2009 may be
attributed to government spending and tax breaks to households; increased financial

58
system liquidity; and optimism that the economy is set to improve. Foreigners can
buy freely in South Korea, except for acquisition of land located in development-
restricted zones.
A5.6 In China, housing sales and property prices in China rose in the first half of
2009 backed by direct government intervention, House prices in 70 major cities rose
by 2% (3.2% in real terms) in August 2009 from a year earlier, the third month of
house price increases, according to data from the National Bureau of Statistics of
China (NBSC).
Quarterly House Price Movements
China
-4-202468
101214
2005
,Q1
2005
,Q3
2006
,Q1
2006
,Q3
2007
,Q1
2007
,Q3
2008
,Q1
2008
,Q3
2009
,Q1
2009
,Q3
quarter
% c
hang
e
Prompted by a fear of a forming property bubble in China, government officials
implemented several measures to deflate the bubble in 2007, which led to a
slowdown in house price growth in the first half of 2008. With the global financial
crisis, house prices eventually dropped in the second half of 2008. To encourage
purchase of houses and help the residential property sector to recover, fiscal
measures, which includes tax cuts and additional spending for the real estate sector,
were introduced by the government. Buyers and developers took advantage of the
relaxed lending conditions and lower interest rates. With the revival of the real estate
sector, residential property prices are expected to sustain its growth for the rest of
2009 and 2010, according to Colliers International.

59
A5.7 US housing market fiasco: Present worries and alert messages in connection
with asset price movements owe a lot to the financial mess triggered by the US sub-
prime crisis that led to the Great Recession that now heavily stalks the world
economy growth. Moreover, uncertainties loom large about the downside risk
associated with the unwinding of the concerted stimulus packages and equally
accommodative loose monetary policy, which otherwise run the risk of tripping
either towards fresh bubble formation in the asset prices or stirring up the inflation
dragon in absence of sustained growth impetus which are yet to come up in the form
of private sector activities and investment intentions.
For most Americans, the US housing market collapsed about four years ago. The
worst affected were New York City and south Florida, where the financial crisis and
recession shuttered construction projects in what were among the hottest US real
estate markets. Manhattan rents fell as much as 7 per cent in the year ended
December 15 as the recession helped some tenants move up to larger apartments for
less. Rents for studio apartments dropped 7 per cent to an average of $2247 a month,
the Real Estate Group of New York said on Tuesday. One bedroom apartments fell
5.6 per cent to $3262. Both the figures are building with doormen. The biggest
difference between this year and last year is the amount of inventory. Rent in
Manhattan is falling as unemployment climbs; joblessness is now at 10 per cent
(seasonally adjusted). The city lost 25000 finance related jobs in the year till
November 2009, including 700 in the month itself! Buildings’ rents without doormen
declined somewhat at a lower pace, namely 3.8 per cent to $1921 for studio
apartment and less than one per cent to $2636 for one-bedroom.
In a recent summing up of the state of affairs in the US economy, the fist decade of
the new millennium shows zero gains for US homeowners as “housing prices
adjusted for inflation”; they are roughly back to where they were at the beginning of
the decade (Paul Krugman). And for those who bought in the decade’s middle years
– when all the serious people ridiculed the warnings that housing prices made no
sense, that we are in the middle of a gigantic bubble, the story is now sordid when

60
the disaster struck. Historically cyclical house prices is just trying to trough its
lowest ever nadir across the globe; the more it buoyed up, the more it has gone
down to keep the mean reversion tendency so inherent in asset prices dynamics.
Almost a quarter of all mortgages in America are underwater, with owners owing
more than their houses are worth.
A5.8 Housing condition in the United Kingdom has registered an unexpectedly
buoyant demand and a chronic lack of housing for sale were the key drivers of the
housing market in 2009. The Y-o-Y fall in house prices in England and Wales eased
to 1.9 per cent in December, the smallest annual drop since May 2008, according to
the property data company Hometrack. The monthly pace of house price rises
suffered a seasonal slowdown to 0.1 per cent in December from November’s 0.2 per
cent and Hometrack forecast prices would drop a further 1 per cent in 2010 as a
whole. According to mortgage lenders Halifax and Nationwide report, prices have
already risen by around 2 per cent in the year to November. Estate agents surveyed
by Hometrack reported a 41 per cent increase in registrations from prospective home
buyers in 2009, while the supply of property rose by just 7 per cent. A probable rise
in unemployment and growing concern about tax rises and spending cuts after an
election due by June were likely to limit demand. Against the backdrop of low sales
volumes, equity –rich households could continue to put upward pressure on prices
in localized markets in 2010. (Source – Reuters).
Annex 6
House Price Data Availability for the Developed Economies
Historically speaking, real estate prices playing a critical role behind financial crises
has been recognized as far as back as the South Sea bubble. Time series data on
housing, particularly the property prices, are available for the advanced economies
and mostly so in respect of the United States, where variety of housing data are
available in greater. The same is not the case for emerging market economies.
Keeping track of the macroeconomic impact of asset price fluctuations in emerging

61
markets is assuming an important dimension as these economies are becoming a key
engine of growth in the world economy and may play an important role in the
resolution of global imbalances. Since an increasingly large number of emerging
market economies is becoming financially developed, their access to financial assets
and the possibility to extract equity from them has also risen, hence, increasing the
potential macroeconomic impact of domestic asset price movements. Measuring
wealth effects for emerging markets and assessing implications of asset prices is only
of recent origin (Annex 5).
There is a large body of literature that studies the effect of asset price fluctuations on
private consumption, mostly relating to the developed countries like the US, Canada
or OECD countries where residential property plays a crucial role of investment
consumption by the households. More recently, interest in the topic has regained
ground against the background of the current financial turmoil which has led to
concerns by numerous academics, central banks and governments about the
potential macroeconomic implications of a downturn in house and equity prices.
Major developed countries’ house price indices are indicated in the following Table.
House price indices exist for many of these countries for last two decades or so.

62
Definition and source for house prices
Country HPI Source
US Nationwide single family house price index. Weighted, repeat-sales index . Releases quarterly.
OFHEO
Japan Average mansion price per household- capital area; Nationwide urban land price index as a proxy for HPI
JREI
Germany Index for total Germany, total resales Bundesbank
Greece Releases quarterly indices of prices of dwellings by region for urban areas.
The Bank of Greece
France Publishes in their quarterly press releases. Indices are for apartments and houses by region.
FNAIM
Italy Releases a semi-annual housing report with the average price of residential buildings for the 13 urban areas.
Nomisma Spa / Banca D'Italia
UK Mix-adjusted house price index released on quarterly/monthly basis
Nationwide
Canada
Multiple listing series, average price in Canadian dollars MoF
Australia (i) Index of a weighted average of 8 capital cities. (ii) Weighted average median house price
(i) AB S, (ii) REIA
Denmark Index of one-family house sold Statistics Denmark
Austria Quarterly indices are based on the price per square metre for new and used condominiums and single family homes
Oesterreichische (Austria) National Bank
Spain Precio medio del m2 de la vivienda, Banco de Espana
Finland Housing prices in metropolitan area. Bank of Finalnd
Ireland Second hand houses Irish Department of Environment
Korea Nationwide house price index Kookmin Bank,
Netherlands Existing dwellings Nederlandsche Bank
Norway Nationwide index for dwellings Statistics Norway
New Zealand
Quotable value index for dwellings (new and existing) Reserve Bank
Sweden One and two dwelling buildings Statistics Sweden
Switzerland Single-family home Swiss National Bank
OFHEO: Office of Federal Housing Enterprise Oversight, - an agency within the US Department of Housing and Urban Development. On July 30, 2008 OFHEO became part of the new Federal Housing Finance Agency (FHFA). The index is now termed the FHFA HPI. JREI: Japan Real Estate Institute.