Experiments Testing hypotheses…. Agenda Homework assignment Review evaluation planning Observation...
44
Experiments Testing hypotheses…
-
date post
20-Dec-2015 -
Category
Documents
-
view
215 -
download
1
Transcript of Experiments Testing hypotheses…. Agenda Homework assignment Review evaluation planning Observation...

Experiments
Testing hypotheses…

Agenda
Homework assignment Review evaluation planning Observation continued Empirical studies In-class practice

Recall evaluation distinctions Form of results of
obtained Quantitative Qualitative
Who is experimenting with the design End users HCI experts
Approach Experimental Naturalistic Predictive

Evaluation techniques
Predictive modeling Questionnaire Experiments Heuristic evaluation Cognitive walkthrough Think aloud (protocol analysis) Interviews Experience Sampling Focus Groups
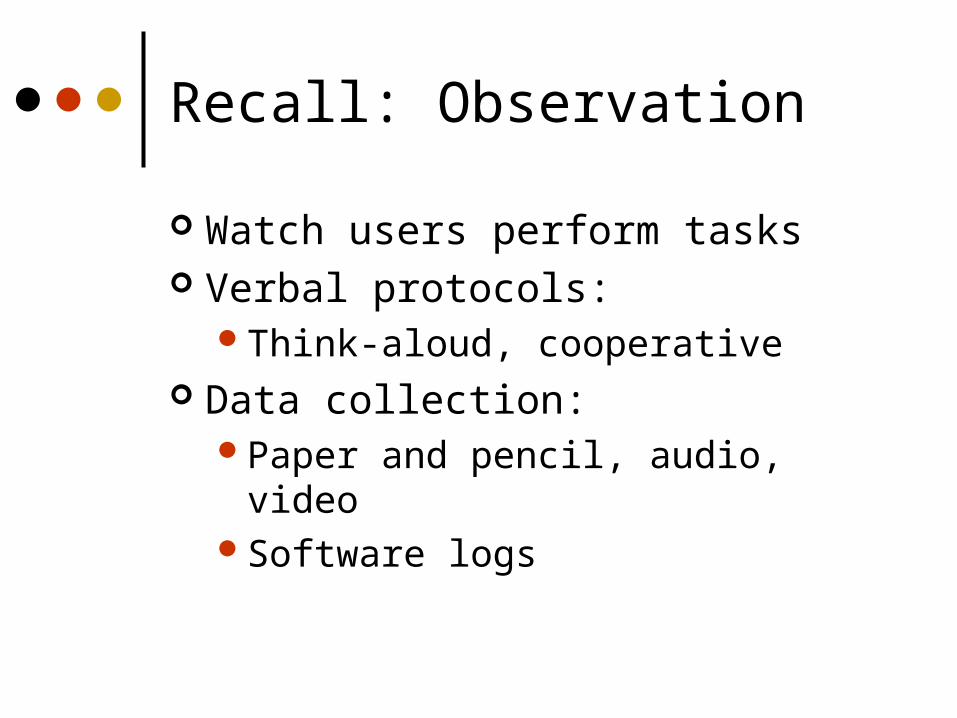
Recall: Observation
Watch users perform tasks Verbal protocols:
Think-aloud, cooperative Data collection:
Paper and pencil, audio, videoSoftware logs

Analysis
Many approaches Task based
How do users approach the problem What problems do users have Need not be exhaustive, look for interesting
cases Performance based
Frequency and timing of actions, errors, task completion, etc.
Very time consuming!!

UsabilityLab
http://www.surgeworks.com/services/observation_room2.htm
Large viewing area in this one-way mirror which includes an angled sheet of glass the improves light capture and prevents sound transmission between rooms.
Doors for participant room and observation rooms are located such that participants are unaware of observers movements in and out of the observation room.
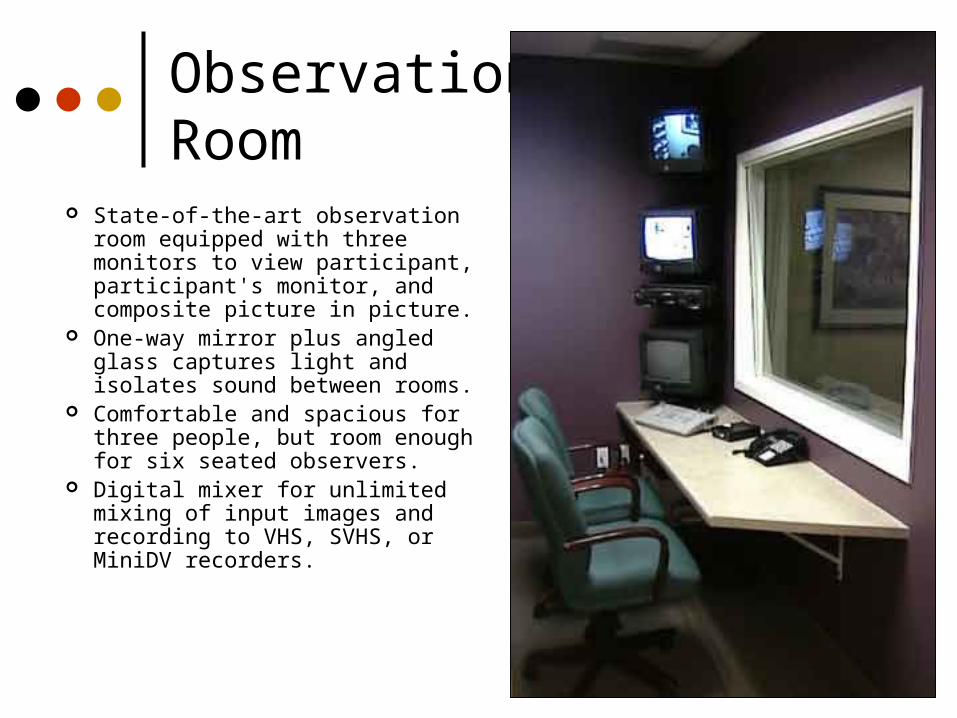
ObservationRoom
State-of-the-art observation room equipped with three monitors to view participant, participant's monitor, and composite picture in picture.
One-way mirror plus angled glass captures light and isolates sound between rooms.
Comfortable and spacious for three people, but room enough for six seated observers.
Digital mixer for unlimited mixing of input images and recording to VHS, SVHS, or MiniDV recorders.

Experiments Design the experiment to collect the
data to test the hypotheses to evaluate the interface to refine the design
Generally quantitative, experimental, with end users.
See 14.4

Conducting an Experiment
Determine the TASK Determine the performance measures Develop the experiment IRB approval Recruit participants Collect the data Inspect & analyze the data Draw conclusions to resolve design problems Redesign and implement the revised interface

The Task
Benchmark tasks - gather quantitative data Representative tasks - add breadth, can
help understand process Tell them what to do, not how to do it Issues:
Lab testing vs. field testing Validity - typical users; typical tasks; typical
setting? Run pilot versions to shake out the bugs

“Benchmark” Tasks
Specific, clearly stated task for users to carry out
Example: Email handler “Find the message from Mary and reply with
a response of ‘Tuesday morning at 11’.”
Users perform these under a variety of conditions and you measure performance

Defining Performance
Based on the task Specific, objective measures/metrics Examples:
Speed (reaction time, time to complete) Accuracy (errors, hits/misses) Production (number of files processed) Score (number of points earned) …others…?
Preference, satisfaction, etc. (i.e. questionnaire response) are also valid measurements

Types of Variables
Independent What you’re studying, what you
intentionally vary (e.g., interface feature, interaction device, selection technique)
DependentPerformance measures you record or
examine (e.g., time, number of errors)
“Controlling” Variables
Prevent a variable from affecting the results in any systematic way
Methods of controlling for a variable: Don’t allow it to vary
• e.g., all males Allow it to vary randomly
• e.g., randomly assign participants to different groups Counterbalance - systematically vary it
• e.g., equal number of males, females in each group The appropriate option depends on
circumstances

Hypotheses
What you predict will happen More specifically, the way you predict the
dependent variable (i.e., accuracy) will depend on the independent variable(s)
“Null” hypothesis (Ho) Stating that there will be no effect e.g., “There will be no difference in
performance between the two groups” Data used to try to disprove this null
hypothesis
Example
Do people complete operations faster with a black-and-white display or a color one? Independent - display type (color or b/w) Dependent - time to complete task (minutes) Controlled variables - same number of males
and females in each group Hypothesis: Time to complete the task will be
shorter for users with color displayHo: Timecolor = Timeb/w
Note: Within/between design issues
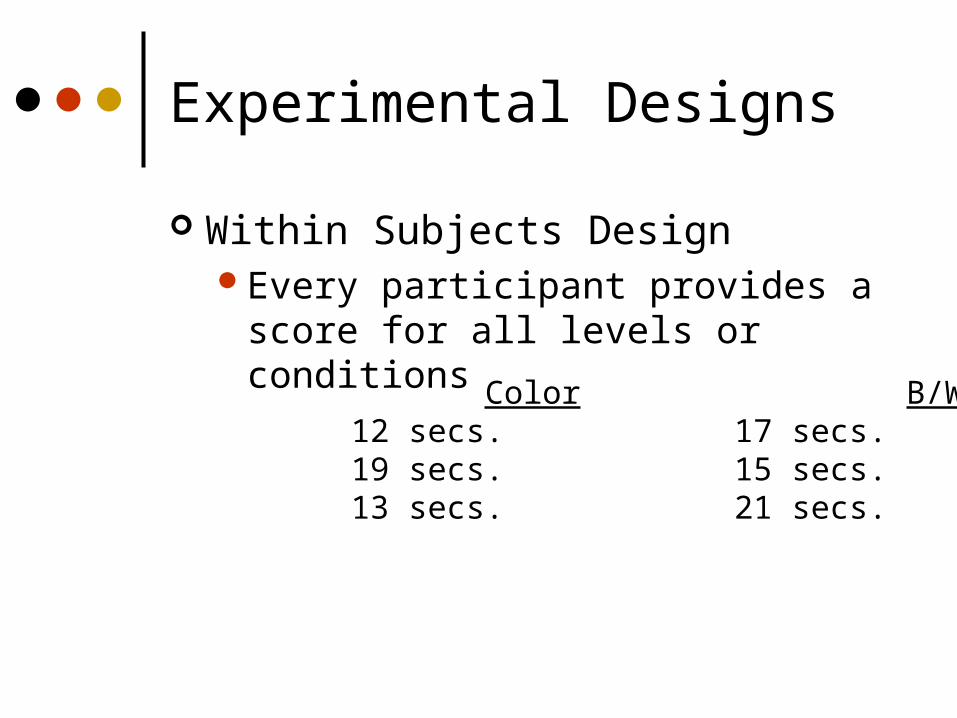
Experimental Designs
Within Subjects DesignEvery participant provides a score for
all levels or conditions
Color B/WP1 12 secs. 17 secs.P2 19 secs. 15 secs.P3 13 secs. 21 secs....

Experimental Designs
Between SubjectsEach participant provides results for
only one condition
Color B/WP1 12 secs. P2 17 secs.P3 19 secs. P5 15 secs.P4 13 secs. P6 21 secs....
Within vs. Between
What are the advantages and disadvantages of the two techniques?
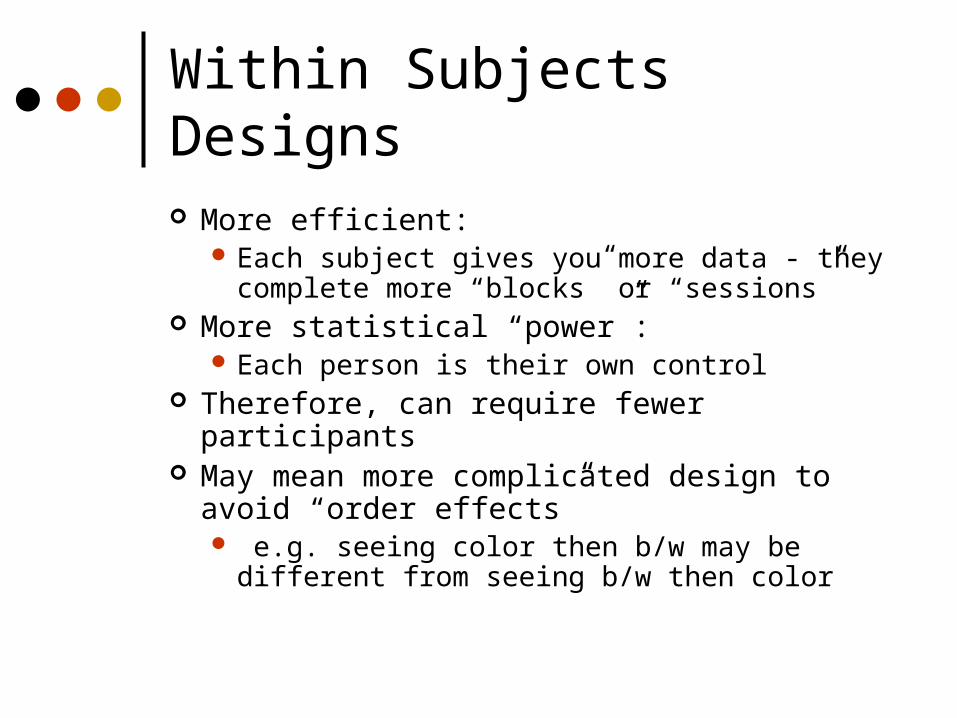
Within Subjects Designs
More efficient: Each subject gives you more data - they
complete more “blocks” or “sessions” More statistical “power”:
Each person is their own control Therefore, can require fewer participants May mean more complicated design to
avoid “order effects” e.g. seeing color then b/w may be different
from seeing b/w then color

Between Subjects Designs
Fewer order effectsParticipant may learn from first
conditionFatigue may make second
performance worse Simpler design & analysis Easier to recruit participants (only one
session) Less efficient

What about subjects?
How many?Book advice:at least 10Other advice:6 subjects per
experimental conditionReal advice: depends on statistics
Relating subjects and experimental conditionsWithin/between subjects design

Now What…?
You’ve got your task, performance measures, experimental design, etc.
You have hypotheses about what will happen in the experiment
Now you need to gather the data Assign participants so that your variables are
properly controlled Same gathering techniques as observation –
emphasis on recording and logging

Data Inspection
Look at the results First look at each participant’s data
Were there outliers, people who fell asleep, anyone who tried to mess up the study, etc.?
Then look at aggregateresults and descriptivestatistics

Inspecting Your Data
“What happened in this study?” Keep in mind the goals and
hypotheses you had at the beginning Questions:
Overall, how did people do?“5 W’s” (Where, what, why, when, and
for whom were the problems?)

Descriptive Statistics
For all variables, get a feel for results: Total scores, times, ratings, etc. Minimum, maximum Mean, median, ranges, etc.
What is the difference between mean & median? Why use one or the other?
e.g. “Twenty participants completed both sessions (10 males, 10 females; mean age 22.4, range 18-37 years).” e.g. “The median time to complete the task in the mouse-input group was 34.5 s (min=19.2, max=305 s).”

Subgroup Stats
Look at descriptive stats (means, medians, ranges, etc.) for any subgroups e.g. “The mean error rate for the mouse-
input group was 3.4%. The mean error rate for the keyboard group was 5.6%.”
e.g. “The median completion time (in seconds) for the three groups were: novices: 4.4, moderate users: 4.6, and experts: 2.6.”

Plot the Data
Look for the trends graphically
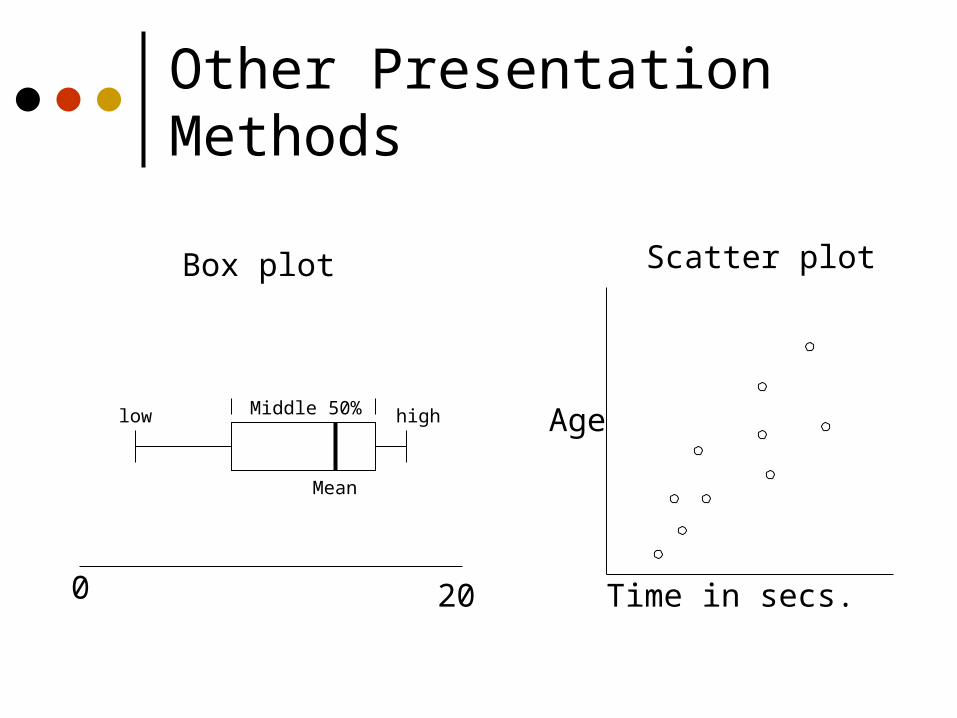
Other Presentation Methods
0 20
Mean
low highMiddle 50%
Time in secs.
Age
Box plot Scatter plot

Experimental Results
How does one know if an experiment’s results mean anything or confirm any beliefs?
Example: 40 people participated, 28 preferred interface 1, 12 preferred interface 2
What do you conclude?

Inferential (Diagnostic) Stats
Tests to determine if what you see in the data (e.g., differences in the means) are reliable (replicable), and if they are likely caused by the independent variables, and not due to random effects e.g. t-test to compare two means e.g. ANOVA (Analysis of Variance) to
compare several means e.g. test “significance level” of a correlation
between two variables

Means Not Always Perfect
Experiment 1
Group 1 Group 2Mean: 7 Mean: 10
1,10,10 3,6,21
Experiment 2
Group 1 Group 2Mean: 7 Mean: 10
6,7,8 8,11,11
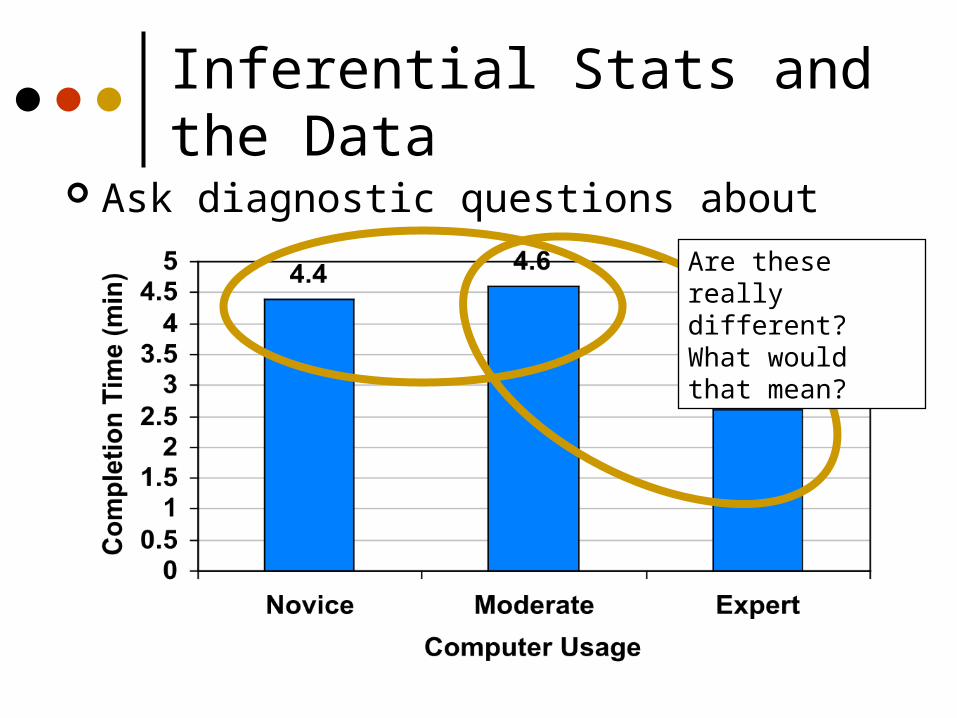
Inferential Stats and the Data
Ask diagnostic questions about the data
Are these really different? What would that mean?

Hypothesis Testing
Recall: We set up a “null hypothesis” e.g. there should be no difference between
the completion times of the three groups Or H0: TimeNovice = TimeModerate = TimeExpert
Our real hypothesis was, say, that experts should perform more quickly than novices

Hypothesis Testing
“Significance level” (p): The probability that your null hypothesis was
wrong, simply by chance Can also think of this as the probability that your
“real” hypothesis (not the null), is wrong The cutoff or threshold level of p (“alpha” level)
is often set at 0.05, or 5% of the time you’ll get the result you saw, just by chance
e.g. If your statistical t-test (testing the difference between two means) returns a t-value of t=4.5, and a p-value of p=.01, the difference between the means is statistically significant
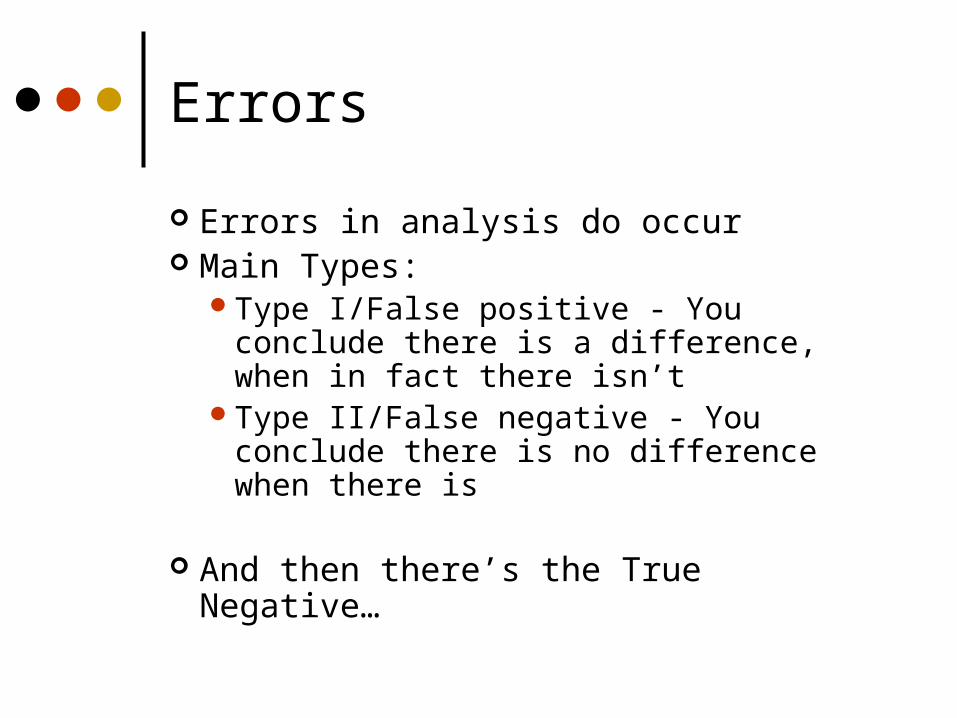
Errors
Errors in analysis do occur Main Types:
Type I/False positive - You conclude there is a difference, when in fact there isn’t
Type II/False negative - You conclude there is no difference when there is
And then there’s the True Negative…

Drawing Conclusions
Make your conclusions based on the descriptive stats, but back them up with inferential stats e.g., “The expert group performed faster
than the novice group t(1,34) = 4.6, p > .01.” Translate the stats into words that regular
people can understand e.g., “Thus, those who have computer
experience will be able to perform better, right from the beginning…”
Feeding Back Into Design
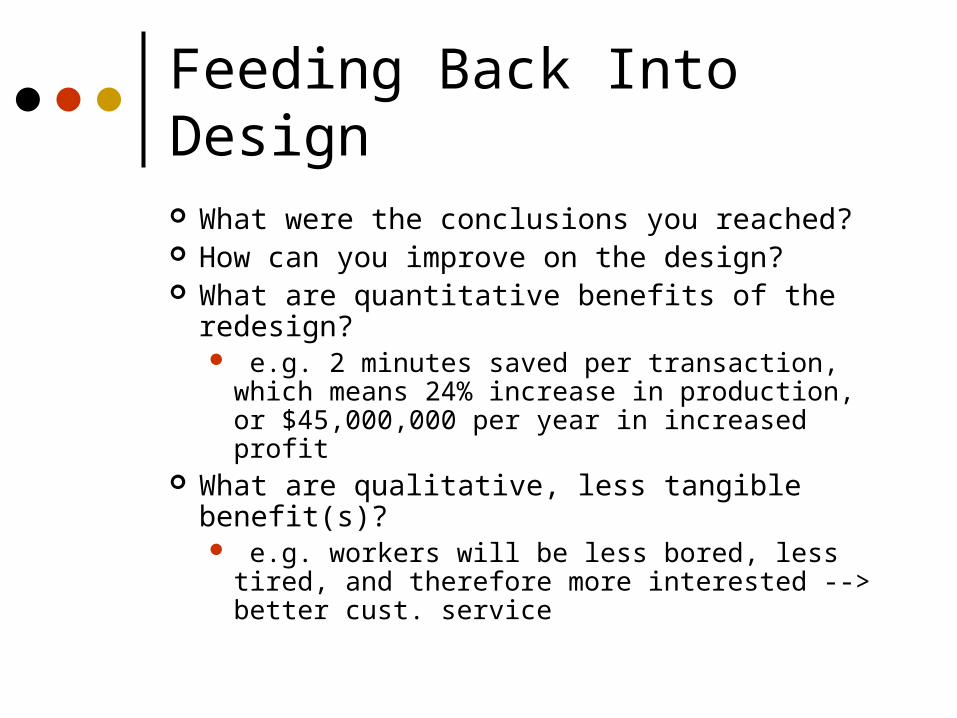
What were the conclusions you reached? How can you improve on the design? What are quantitative benefits of the redesign?
e.g. 2 minutes saved per transaction, which means 24% increase in production, or $45,000,000 per year in increased profit
What are qualitative, less tangible benefit(s)? e.g. workers will be less bored, less tired, and
therefore more interested --> better cust. service

Example: Heather’s simple experiment
Designing interface for categorizing keywords in a transcript
Wanted baseline for comparison Experiment comparing:
Pen and paper, not real timePen and paper, real timeSimulated interface, real time
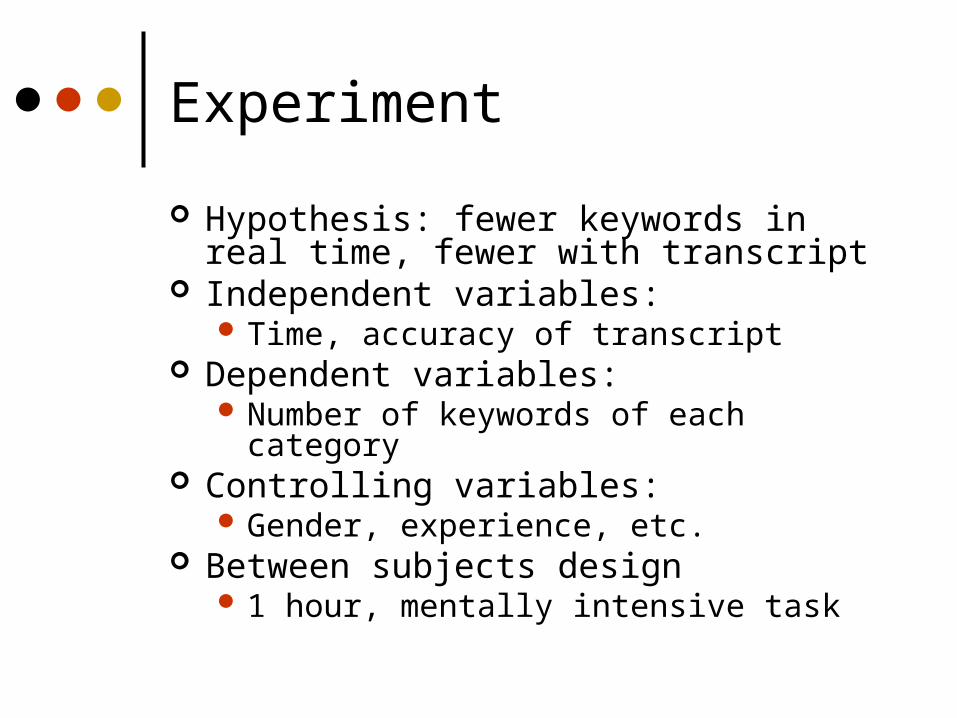
Experiment
Hypothesis: fewer keywords in real time, fewer with transcript
Independent variables: Time, accuracy of transcript
Dependent variables: Number of keywords of each category
Controlling variables: Gender, experience, etc.
Between subjects design 1 hour, mentally intensive task

Results
Overall Non-Real Time
Rate
Comparable Non-Real
Time Rate
Real Time Rate
Error + Delay Rate
Domain-specific tags
7.5 - 9.4 5.1
Domain- independent tags
10 12 9.8 5.8
Conversation tags
2.3 1.8 3 2.5
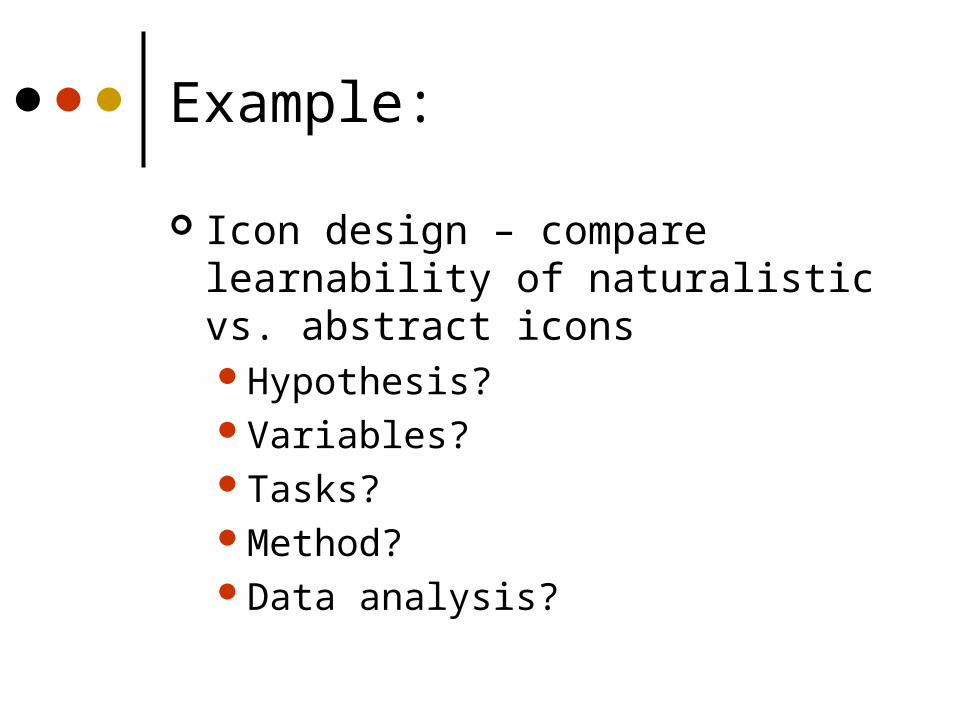
Example:
Icon design – compare learnability of naturalistic vs. abstract iconsHypothesis?Variables?Tasks?Method?Data analysis?

Example: IM voice chat
Make an evaluation plan (observation and/or experiments)
Consider:TasksWhat data you want to gatherHow you would gatherWhat analysis you would do after