Experiments on Adaptive Techniques.for Host-Based...
66
SANDIA REPORT SAND2001-3065 Unlimited Release Printed September 2001 Experiments on Adaptive Techniques for Host-Based Intrusion Detection Timothy Draelos, Michael Collins, David Duggan, Edward Thomas, and Donald Wunsch Prepared by Sandia National Laboratories Albuquerque, New Mexico 87185 and Livermore, California 94550 Sandia is a multiprogram laboratory operated by Sandia Corporation, a Lockheed Martin Company, for the United States Department of Energy under Contract DE-AC04-94AL85000. Approved for public release; further dissemination unlimited.
Transcript of Experiments on Adaptive Techniques.for Host-Based...
SANDIA REPORTSAND2001-3065Unlimited ReleasePrinted September 2001
Experiments on Adaptive Techniques forHost-Based Intrusion Detection
Timothy Draelos, Michael Collins, David Duggan, Edward Thomas, and Donald Wunsch
Prepared bySandia National LaboratoriesAlbuquerque, New Mexico 87185 and Livermore, California 94550
Sandia is a multiprogram laboratory operated by Sandia Corporation,a Lockheed Martin Company, for the United States Department ofEnergy under Contract DE-AC04-94AL85000.
Approved for public release; further dissemination unlimited.

Issued by Sandia National Laboratories, operated for the United States Departmentof Energy by Sandia Corporation.
NOTICE: This report was prepared as an account of work sponsored by an agencyof the United States Government. Neither the United States Government, nor anyagency thereof, nor any of their employees, nor any of their contractors,subcontractors, or their employees, make any warranty, express or implied, orassume any legal liability or responsibility for the accuracy, completeness, orusefulness of any information, apparatus, product, or process disclosed, or representthat its use would not infringe privately owned rights. Reference herein to anyspecific commercial product, process, or service by trade name, trademark,manufacturer, or otherwise, does not necessarily constitute or imply its endorsement,recommendation, or favoring by the United States Government, any agency thereof,or any of their contractors or subcontractors. The views and opinions expressedherein do not necessarily state or reflect those of the United States Government, anyagency thereof, or any of their contractors.
Printed in the United States of America. This report has been reproduced directlyfrom the best available copy.
Available to DOE and DOE contractors fromU.S. Department of EnergyOffice of Scientific and Technical InformationP.O. Box 62Oak Ridge, TN 37831
Telephone: (865)576-8401Facsimile: (865)576-5728E-Mail: [email protected] ordering: http://www.doe.gov/bridge
Available to the public fromU.S. Department of CommerceNational Technical Information Service5285 Port Royal RdSpringfield, VA 22161
Telephone: (800)553-6847Facsimile: (703)605-6900E-Mail: [email protected] order: http://www.ntis.gov/ordering.htm
3
SAND2001-3065Unlimited Release
Printed September 2001
Experiments on Adaptive Techniquesfor Host-Based Intrusion Detection
Timothy Draelos and Michael CollinsCryptography and Information Systems Surety Department
David DugganNetworked Systems Survivability and Assurance Department
Edward ThomasIndependent Surveillance Assessment & Statistics Department
Sandia National LaboratoriesP. O. Box 5800
Albuquerque, NM 87185-0785
Donald WunschDepartment of Electrical & Computer Engineering
University of Missouri/Rolla131 Emerson Electric Co. Hall
131 Miner CircleRolla, MO 65409-0040
ABSTRACTThis research explores four experiments of adaptive host-based intrusion detection (ID) techniquesin an attempt to develop systems that can detect novel exploits. The technique considered to havethe most potential is adaptive critic designs (ACDs) because of their utilization of reinforcementlearning, which allows learning exploits that are difficult to pinpoint in sensor data. Preliminaryresults of ID using an ACD, an Elman recurrent neural network, and a statistical anomalydetection technique demonstrate an ability to learn to distinguish between clean and exploit data.We used the Solaris Basic Security Module (BSM) as a data source and performed considerablepreprocessing on the raw data. A detection approach called generalized signature-based ID isrecommended as a middle ground between signature-based ID, which has an inability to detectnovel exploits, and anomaly detection, which detects too many events including events that are notexploits. The primary results of the ID experiments demonstrate the use of custom data forgeneralized signature-based intrusion detection and the ability of neural network-based systems tolearn in this application environment.

4

5
CONTENTS
1. Introduction......................................................................................................................... 9
1.1. Related Work ........................................................................................................ 111.2. Organization of Report ......................................................................................... 12
2. Data Sources ..................................................................................................................... 12
2.1. Exploit Classes...................................................................................................... 142.2. Solaris Basic Security Module.............................................................................. 152.3. Data Collection for Intrusion Detection System Training and Testing ................ 152.4. Data Representation and Preprocessing................................................................ 19
3. Intrusion Detection Approaches ....................................................................................... 223.1. Signature-Based Intrusion Detection .................................................................... 233.2. Generalized Signature-Based Intrusion Detection................................................ 263.3. Anomaly Detection ............................................................................................... 263.4. Combination of Detection Approaches................................................................. 27
4. Intrusion Detection Experiments ...................................................................................... 28
4.1. Intrusion Detection System Control...................................................................... 294.2. Intrusion Detection using an Elman Recurrent Neural Network .......................... 324.3. Intrusion Detection Using Adaptive Critic Designs ............................................. 374.4. Anomaly Detection of Intrusions.......................................................................... 46
5. Conclusions....................................................................................................................... 56
6. References......................................................................................................................... 58
7. Appendix A—Details of the Solaris BSM........................................................................ 60
7.1. BSM Statistics....................................................................................................... 61
FIGURES1. Theoretical comparison of intrusion detection approaches ....................................................23
2. Comparison of different intrusion detection approaches in reality ........................................25
3. Potential combination of intrusion detection approaches.......................................................28
4. Future direction of intrusion detection systems......................................................................29
5. State-based intrusion detection system control ......................................................................30
6. Adaptive critic design for intrusion detection system control................................................32
7. Elman network Experiment 1 after 10,000 training epochs ...................................................34
8. Elman network Experiment 1 after 50,000 training epochs ...................................................34

6
9. Elman Experiment 2 network training results on multiple exploits .......................................36
10. Elman Experiment 2 network test results on multiple exploits..............................................36
11. Elman Experiment 2 network training results on Variant data set .........................................37
12. Adaptive critic design for BSM-based intrusion detection ....................................................40
13. Improved adaptive critic design for HDP training .................................................................40
14. ACD training results after 10 iterations..................................................................................43
15. ACD training results after 20 iterations..................................................................................43
16. ACD test results after 10 training iterations ...........................................................................44
17. ACD test results after 20 training iterations ...........................................................................44
18. ACD training results on multiple exploits..............................................................................45
20. ACD training results on Variant data set................................................................................46
21. Fraction of events by type in training set ...............................................................................48
22. Distribution of fraction of events by type per session in training set .....................................48
23. Maximum value of EWMA within each session of training set ............................................50
24. Distribution of maximum value of EWMA within each session of training set ....................50
25. Maximum value of EWMA within each session of test set ...................................................51
26. EWMA process for Session 13 ..............................................................................................51
27. EWMA process for Session 187 ............................................................................................52
TABLES1. Possible cost assignments for intrusion detection decisions ..................................................11
2. Clean and exploit BSM files for training and testing ID systems ..........................................18
3. Strengths and weaknesses of intrusion detection approaches ................................................27
4. Expected incidence of false alarms for each intrusion detection approach............................28
5. Numeric eXpert-BSM configuration parameters ...................................................................31
6. Elman recurrent neural network-related questions, Experiment 1 .........................................33
7. Elman recurrent neural network-related questions, Experiment 2 .........................................35
8. The reinforcement-learning approach for penalizing or rewarding the IDS ..........................38
9. Labels and hexadecimal identifiers for BSM tokens..............................................................58
10. Token frequencies in the analyzed audit files ........................................................................59
11. Frequency of token patterns in the 1998 DARPA audit file ..................................................61
12. Frequency of token patterns in the 2000 DARPA audit file ..................................................62
13. Frequency of token patterns in the rdist audit file..................................................................62

7
NOMENCLATUREACD adaptive critic design
BSM Basic Security Module
CMAC cerebellar model articulation controller
DHP dual heuristic programming
DOS denial of service
EWMA exponentially weighted moving average
HDP heuristic dynamic programming
ID intrusion detection
IDS intrusion detection system
IP Internet protocol
MLP multilayer perceptron
PCA principal components analysis
R&D research and development
STAT state transition analysis technique
uid user identification
ACSAC Annual Computer Security Applications Conference
DARPA Defense Advanced Research Projects Agency
DISCEX DARPA Information Survivability Conference and Exposition
MIT Massachusetts Institute of Technology
NISSC National Information Systems Security Conference
Sandia Sandia National Laboratories/New Mexico
UMR University of Missouri/Rolla

8
MATLAB™ A high performance language for technical computing, MATLAB isdeveloped and marketed by The MathWorks, Inc.
NT™ NT is a trademark of Microsoft Corporation for its Windowsmicrocomputer operating system.
Solaris™ Solaris is a trademark of Sun Microsystems for its microcomputeroperating system.
SPARC™ SPARC is a trademark of Sparc International for a computer architecturedeveloped by Sun Microsystems.
UNIX™ UNIX is a trademark of AT&T Bell Laboratories for its microcomputeroperating system.
SNORT SNORT shareware is a small, highly configurable, portable network-basedIDS.
RealSecure™ RealSecure is a trademark of Internet Security Systems (ISS) for itsintrusion detection system.
NFR™ NFR is a trademark of Network Flight Recorder, Inc. for its intrusiondetection system.
Cisco Secure™ Cisco Secure is a trademark of Cisco Systems, Inc., for its intrusiondetection system.
eXpert-BSM™ eXpert-BSM is a trademark of SRI International for its intrusion detectionsystem.

9
Experiments on Adaptive Techniques forHost-Based Intrusion Detection
1. Introduction
The potential of intrusions into computer networks has created a sense of urgency in developingsystems capable of detecting attacks before damage results. As computing has become more andmore distributed, the number of legitimate network transactions has increased dramatically,setting up a classic information surety dilemma of preventing unauthorized use of networkresources while allowing authorized use.
Firewalls are intended to provide a form of electronic protection. However, even with the adventof firewalls, adversaries can attack computer systems by exploiting errors in firewallconfiguration and ambiguities in security policies, finding ways around firewalls, and attackingnetwork services allowed through the firewall. The failure of firewalls to fully protect computersystems from unauthorized use demands additional defenses in the form of intrusion detectionand response.
Current network intrusion detection systems have many shortcomings including
� The inability to analyze large amounts of network traffic� The propensity to generate huge quantities of false alarms� The inability to identify new or evolving adversarial behaviors.
Intrusion detection is the process of monitoring computer networks and systems for violations ofsecurity policy [B00]. The components of an intrusion detection system (IDS) are as follows:
� Information source—the data utilized by the IDS� Analysis engine—the process by which the intrusion decision is made� Response—the action taken when an intrusion is detected.
The research project discussed in this report utilized a computer system’s audit logs as theinformation source. We focused on the development of new adaptive analysis engines ratherthan on responses to intrusions. Therefore, our work falls under the genre of host-basedintrusion detection. The data source for this project was limited to audit logs on SunMicrosystems workstations running the Solaris™ Basic Security Module (BSM). Host-basedintrusion detection is considered the best way to discover exploits on the contents of computersystems and its applications. This is especially true as network data becomes increasinglyprotected with encryption.
Intrusions are generally categorized as misuse or as anomalous behavior. Misuse refers toknown unauthorized attacks, while anomalous behavior refers to behaviors or activities otherthan those normally observed. Misuse detection is found in current intrusion detection systems

10
where patterns of use are scanned for known attacks. These systems are limited to protectionagainst known and identifiable attacks, and are vulnerable to slight variations on knownauthorized attacks as well as to new attacks. Anomaly detection is a much more difficultproblem involving recognition of abnormal behaviors of users or applications, and a judgmentabout the authorization of the activity. Current anomaly detection systems can suffer a high falsepositive rate if trained too tightly and a high missed exploit rate if trained too loosely. In general,an optimal threshold exists which minimizes these error rates, but that threshold can be difficultto find and may change over time and with differing traffic patterns.
Multiple approaches exist for the analysis engine, which is designed to make the actual intrusiondecision. In this report, we present experiments on three different analysis approaches:
1. Adaptive critic designs (ACDs) 2. An Elman recurrent neural network1 3. Statistical anomaly detection.
The original goal was the development of a complete ACD-based intrusion detection system todetect unknown adversarial behaviors. The reason for this focus is that ACDs are capable of twocritical components important to the IDS application:
1. ACDs have the ability to learn in a very murky training environment.
One of the difficulties of training an analysis engine to perform intrusion detection is thatthe exact moment of intrusion is often very unclear. Moreover, how should one treat theevents leading up to, but not technically crossing the line of, what is called an intrusion?ACDs utilize a reinforcement-based learning approach, which assesses a penalty orreward to a system based on the job just completed. In other words, it communicates tothe system that it should have detected an intrusion somewhere in the previous timeperiod, without specifying exactly where. The intrusion detection problem does not offerthe pristine supervised learning environment that one finds in an application likecharacter recognition, where exact outcomes are precisely known in advance and samplesabound for each training character.
2. ACDs have the ability to assign costs in a realistic and complex manner.
In general, IDSs apply a binary cost structure of “proper detection is good” and “falsealarm is bad.” ACDs can allow different quantitative costs to various kinds of detectionand different kinds of false alarms. For example, Table 1 might be used in the training ofan ACD-based IDS.
1 Neural network, inspired by biological neural processing, is the name for a distributed organization of simple
processing units that is able to acquire, store, and predict information through a learning process.

11
Table 1. Possible cost assignments for intrusion detection decisions.
Activity Cost (Negative = Reward)
No detection 0
False positive 100
Missed detection of low-impact exploit 0
Missed detection of medium-impact exploit 100
Missed detection of high-impact exploit 1,000
Detection of failed low-impact exploit –10
Detection of failed medium-impact exploit –100
Detection of failed high-impact exploit –1,000
Detection of low-impact exploit –10
Detection of medium-impact exploit –1,000
Detection of high-impact exploit –10,000
1.1. Related WorkThe work documented in this report presents new approaches to a challenging information suretyproblem. The goal is to develop a method capable of detecting a wide variety of old and newexploits. Other researchers are exploring ways of developing intrusion detection systems toadapt to new, unseen attacks. Ghosh et al. [GSS99, GWC98] have employed neural networksfor both anomaly and misuse detection. They used a feed-forward, single hidden layerperceptron neural network. To capture a sense of time in the data, they used a leaky-bucketenhancement to the back-propagation training algorithm. Cannady [C00] applied areinforcement-learning algorithm, a cerebellar model articulation controller (CMAC), tonetwork-based anomaly detection in order to detect denial-of-service (DOS) attacks. Anotherneural network approach is aimed at learning a legitimate user behavior and detecting anomalieswhen an intruder poses as legitimate [RLM98]. Hoglund et al. [HHS00] used self-organizingmaps to detect anomalies in user profiling information. Encouraging results on the use of BSMdata were reported by Endler [E98], who used a neural network as a misuse detector.
Approaches based on state or cost are two methods of intrusion detection that are relevant to theuse of adaptive critics. ACDs employ both of those methodologies. A system that models thestate of each computer process according to its current privileges and detects unauthorizedtransitions of privilege is described by Nuansri et al. [NSD99]. Another state-based approach[HCDB99] allows adaptive security levels based on the state of the system. In yet anotherapproach, the state transition analysis technique (STAT), intrusions are specified as sequences of

12
actions that cause transitions in the security state of a system [VEK00]. Taking a state-basedapproach to intrusion detection in which the number of states is limited makes sense because thedimensionality of the space is reduced to a finite set of states and the approach looks forunauthorized transitions between the states.
Stolfo et al. [SFLPC00] describe a cost-based approach to fraud and intrusion detection. Thisapproach recognizes the various costs associated with both detecting and responding tointrusions. These costs are real but are sometimes difficult to quantify. Identified costs includethe following:
� Damage costs caused by an undetected attack� Challenge costs incurred when responding to a detected attack� Operational costs needed to operate and maintain an IDS.
The ACD approach makes decisions based on both the state of the environment and the cost ofeach action, and is therefore both state-based and cost-based. Exploring the potential of variouscost schemes would be worth an entire research project. The work presented in this report is apreliminary evaluation of the use of ACDs for intrusion detection. From first principles, thepotential of ACDs for this security problem is enormous, and the goal is best approached in aseries of small steps.
1.2. Organization of ReportSection 2 of this report describes the data source issues relevant to this research, including adescription of exploits, the specifics of the audit data used, the need for preprocessing of thedata, and the collection of custom training and test data for our analysis engines. Section 3presents the standard approaches to intrusion detection, specifically signature-based and anomalydetection, as well as a new approach called generalized signature-based intrusion detection.Section 4 presents the intrusion detection experiments conducted during this project involvingIDS control and detection using ACDs, recurrent neural nets, and statistical anomalies. Section5 provides concluding remarks.
2. Data Sources
Just as a burglar alarm system uses sensors to acquire the information necessary to trigger analarm, an IDS must utilize information from one or more sources to arrive at an intrusiondecision. In this context, the sensor or data source does not discriminate between normal andabnormal activity but merely collects data. Of course, high-quality data is crucial to automatedintrusion detection, as the following poem points out:
A computer, to print out a fact, Will divide, multiply, and subtract.But this output can beNo more than debris,If the input was short of exact.
13
IDSs are currently hamstrung by available data sources (sensors), which typically includeauditing programs and tcpdump for network traffic. Both of these are incomplete in theircoverage of potential avenues into a computer, and neither was designed with automatedintrusion detection in mind, making them less effective, especially for IDSs that require training.For these reasons, research and development (R&D) of new intrusion detection sensors isadvised. The point of view of IDS-directed sensor R&D will impact the completeness andrepresentation of data provided to IDSs, and will advance the underlying science. New sensorsas well as improvements in existing sensors will greatly benefit the effectiveness of ID.
The following list includes standard intrusion detection data sources:
� Audit data
� BSM
� System logs
� File system statistics
� Application information
� ftp, telnet, lpr, etc.
� Network packets
� tcpdump, libpcap
� Other security products
� Firewall log files
� Out-of-band information
� Economic and geopolitical indicators, computer-security news bulletins, etc.
To summarize, the difficulties with intrusion detection begin with the actual data. The designerof an IDS must handle a subset of the following difficulties for any current data source:
� Inappropriate data representation for automated intrusion detection
� Temporal nature of data
� Variable-length information
� Massive amounts of data
� Incomplete coverage of the computer system.Another issue critical to effective ID that is not well understood is exploit characterization, i.e.,providing explanations of the nature of exploits and their manifestations. Malicious intrusionsinvolve a series of exploits that are important to detect even if the overall outcome of an attack isunsuccessful. The problem of how best to characterize exploits (e.g., by outcome, manifestation,technique, state, or statistically) is not clear. In addition, the complexity and sheer volume ofdata is a challenge to any IDS. Visualization and analysis techniques such as cluster/pattern

14
analysis and exploit/attack taxonomies (similar to those applied in the biological sciences) mayoffer some insight into these problems.
2.1. Exploit ClassesA security-significant event is one that violates a system security policy by attempting tocompromise confidentiality or integrity of data within the system, or by reducing the availabilityof the data or the system itself. These events are called intrusions or attacks. An attack consistsof one or more steps called exploits. An exploit could be a buffer overflow that raises a user’sprivilege level, or a simple database command that erases the entire database after the correctprivilege has been attained. Host-based intrusion detection often uses the audit informationcreated and collected by the operating system. Unless these audit data were designed to coverevery security-significant event possible, exploits can be designed that can go undetected,resulting in no manifestation in the audit file.
Determination of a taxonomy for exploits is a research topic that has received little attention inthe research community. Work done in this area is closely associated with the development of aspecific IDS. Each of the several available taxonomies has used a different approach in itsdefinition. The taxonomy developed in the thesis “A Database of Computer Attacks for theEvaluation of Intrusion Detection Systems” [K99] is an example of an incomplete taxonomy thatillustrates the problems with taxonomies created thus far. An individual exploit can be placedwithin several of the five categories of the author’s taxonomy. Each of the taxonomies uses adifferent characteristic of exploits as its basis, and, therefore, the taxonomies are incompatible.
The following classes of exploits are defined for professional-level adversaries, but may also beoperated by script-kiddie-level adversaries:2
� DOS
� Buffer overflow
� Direct exploits (i.e., directed at known bugs in applications)
� Placing of trojan horses
� Data exfiltration (i.e., getting data out of a machine).
An overall taxonomy for exploit classification has yet to be developed. The approach for thisclassification will need to be determined at an initial level under one of the existingorganizational strategies, which include:
2 A script-kiddie-level adversary is a person, normally not someone who is technologically sophisticated, who
randomly seeks out a specific weakness over the Internet in order to gain root access to a system without reallyunderstanding what it is they are exploiting because the weakness was discovered by someone else. A script kiddieis not looking to target specific information or a specific company, but rather uses knowledge of a vulnerability toscan the Internet for a victim who possesses that vulnerability. (Source: http://webopedia.internet.com.)

15
� Technical implementation (e.g., buffer overflow)
� Intended outcome (e.g., privilege escalation)
� Detectable manifestation (e.g., file checksum modified).
Each of these strategies has advantages and disadvantages.
Detecting exploit attempts is just as important as detecting successful exploits. For variousreasons such as complexity and unintended interactions, exploits that should work for aparticular version of software may not work. Detecting these attempts will permit an earlierresponse than will waiting for a successful exploit to occur. Since a number of exploits usuallyare available to take advantage of some security vulnerability, any information that can be usedto prevent a successful attack will deprive the adversary of some advantage.
2.2. Solaris Basic Security ModuleThe Solaris™ operating system contains an audit capability called the Basic Security Module(BSM). This facility allows successes and failures for certain actions to be logged for later use.While many actions can be logged, not all the communications paths into the system are covered,leaving the uncovered paths available for use by an adversary.
BSM was developed originally as a response to needs of the government community and, inparticular, the U.S. Department of Defense for use in classified processing. Certain auditcapabilities were required and BSM fulfilled those requirements. BSM technology was createdfor use in computer accounting. Later, for security reasons, it was expanded to incorporate moreareas. Auditing the access to files and services such as print service was expanded to includeaccess to system calls, privilege escalation, and network access. Both success and failure in theattempted access to these resources also became an audit item.
BSM audit files contain audit records that are comprised of audit tokens each having a differentset of token fields. Generally, BSM records are variable in length because each record can havea variable number of tokens (not all tokens appear in each record), and several audit tokens(especially those with textual fields) have variable length.
See Appendix A for a more detailed description of the BSM audit log structure. Appendix Aalso includes some statistical analysis of the contents of BSM files, the frequency of differenttokens, and the frequency of patterns of tokens.
2.3. Data Collection for Intrusion Detection System Training and TestingProper data collection for training an intrusion detection system poses a considerable challenge.The sheer volume of data generated by most systems, the inherently temporal nature of this data,the great diversity of what constitutes normal operating conditions for networked systems, andthe lack of any clearly superior method of representing the data, required us to give considerablethought to the question of just what our training and test sets would look like. Before describingthe particular choices we finally made, we review these difficulties.

16
Over the last three years, a large quantity of data has been gathered at Massachusetts Institute ofTechnology’s (MIT’s) Lincoln Laboratory under contract to the Defense Advanced ResearchProjects Agency (DARPA) for the purpose of testing and comparing IDSs. This is the mostwell-known and widely used data set for IDS research. The Lincoln archive includes BSM auditfiles and tcpdump files from a variety of UNIX™ systems, as well as Microsoft Windows NT™
audit files. Audit information was collected from live networks, with certain exploitsdeliberately introduced into the network. When this data was used for benchmarking variousIDSs, some exploits other than those deliberately introduced were detected. It turned out thatthese detections were not false alarms but rather actual exploits being run against the networkfrom the outside. Of course, without careful analysis, they could easily have been marked asfalse alarms—a problem inherent in live data used for studies in network intrusion detection.Real networks come under attack quite frequently, but many attacks go unrecognized.
Another difficulty of using live data is the high level of background noise—the large number ofdaemons and other operating system services which cause numerous kernel events to behappening continually, more or less independently of what the users of the computer system aredoing. Of course, an IDS must be robust in the presence of a high noise level, but it may bedifficult for a network architecture to learn anything in such a noisy environment. A plausiblebootstrapping approach is to do preliminary training on less noisy (and therefore artificial) data,then do further training to teach the network to tolerate more noise. Also note that a persistentproblem in neural network research is the lack of any good general method for optimizing thenumber of hidden layers and hidden nodes; these parameters are most often determined by trialand error. The level of complexity needed to learn in a less noisy environment provides a lowerbound on the resources needed to function in a more noisy environment.
Another issue is the difficulty or even the impossibility of pinpointing the time of an attack. Thisposes a problem for both live and artificial data. In MIT’s DARPA data, sessions are labeled asclean or exploit, but no indication is given of the location of an exploit within a session. Thisgreatly reduces the value of this data for our purposes. In general, a session that contains exploitactivity may begin with a perfectly normal series of operations such as logging on as an ordinaryuser with a valid password. As another example, one machine being pinged by another is neitherabnormal nor suspicious; so how many pings should occur before the behavior is identified as apossible port scan?
Given the difficulties with live data in general and MIT’s data in particular, we chose to generateour own artificial data. We also chose to use BSM audit files exclusively. The data produced bytcpdump or other similar tools is qualitatively different from BSM data, so that using both wouldhave entailed two largely separate lines of work. This was not a viable option for us.Furthermore, many interesting exploits occur entirely on one machine, making no use of networkconnections. Tcpdump would not be relevant for detecting such exploits. In contrast, someevidence of network-based attacks should be present in BSM audit trails.
To generate intrusion data, a variety of exploits were compiled and run on a SPARC™ Ultrarunning Solaris 2.5. Most of the exploits were obtained through SecurityFocus.com.3 Audit 3 Source: http://www.securityfocus.com. SecurityFocus.com, Inc., San Mateo, CA.

17
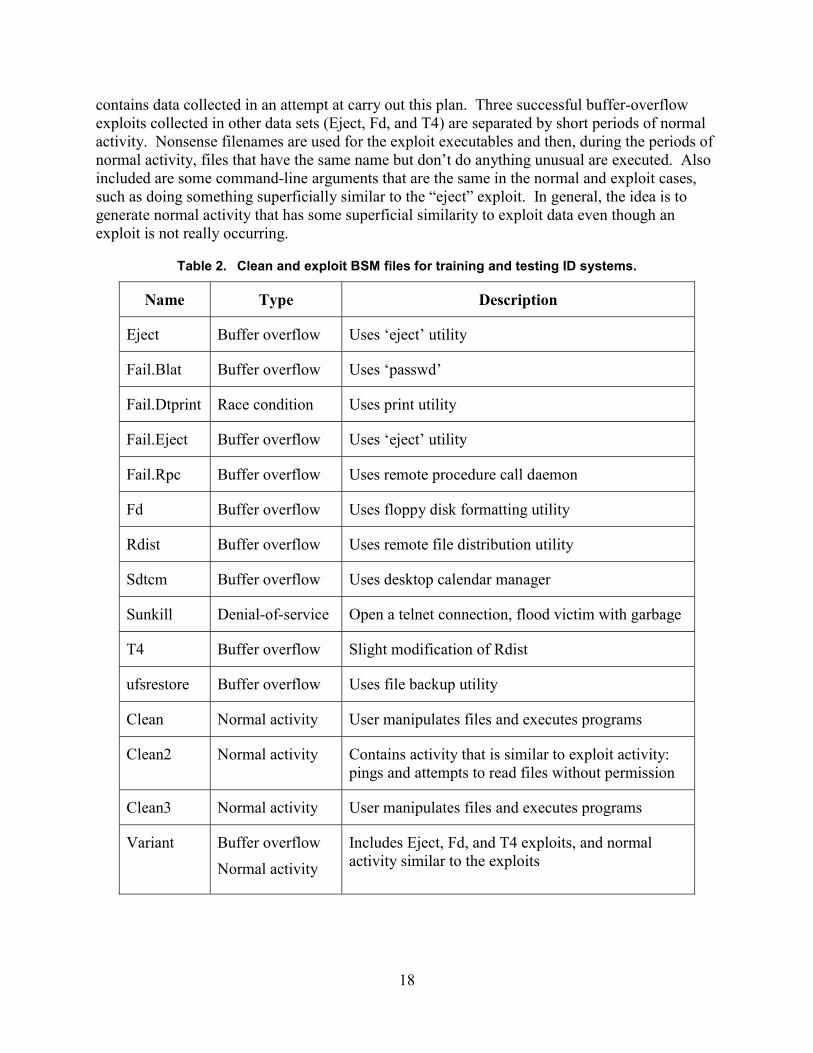
information was gathered with BSM configured to record all events. Our machines were on anisolated local network. They had no connection to the outside world, and no one using them forany work other than our intrusion detection experiments. This reduces the amount ofbackground noise in the BSM audit data. However, the operating system was still running avariety of nonessential services, so there was a fair amount of other activity going on during theexploits. See Table 2 for a list of collected data sets of both clean (normal) and exploit activity.
Most of the exploits were local elevation-of-privilege attacks. In such an attack, an ordinaryuser, after logging in normally, tries to obtain a root shell without knowledge of the rootpassword. This is generally accomplished through exploiting buffer overflows or raceconditions. Such attacks are possible because of bugs or careless coding practices in varioussystem libraries and services. We included both successful and unsuccessful attempts at gainingroot access; when root access was obtained, or the attempt failed, we terminated the exploit. Anactual attacker, after becoming root, would proceed to use this elevated privilege to do somethingillicit on the system such as deleting or modifying files, installing trojan horses, or readingconfidential data. But simply by becoming root without the root password, or by evenattempting to do so, the user has already behaved in an abnormal manner, and we can attempt todetect this behavior. The sooner an attack is detected, the better. Since many different attacksmake use of fundamentally similar mechanisms, it should be possible to detect attacks in theirearly stages by learning to recognize these common features.
The data also include some attacks against remote machines; the target for these attacks wasanother SPARC machine running Solaris 2.5. We ran a port scan, which is a way for an attackerto probe for possible vulnerabilities on a remote machine; and we also ran a DOS attack, inwhich the attacker causes the remote machine to crash. Audit trails from both the attacker andtarget were used for training.
Our clean data sets contained a variety of normal activities for a UNIX system, with usersrunning compilers and text editors, modifying files, and using various standard system services.Since false alarms are a major concern, it is necessary for the clean data to contain activities thatare superficially similar to activities commonly seen in exploits. Thus, the clean data alsoincluded users pinging or connecting to remote machines and sometimes trying unsuccessfully toaccess files or services for which they did not have permission.
One potential concern with such artificially generated data (and, possibly, with live data as well)is that the network may learn to use simple but irrelevant details to distinguish the clean andexploit cases. The presence of a particular filename or port number, or the use of a particularcommand-line argument, could be enough to separate the two classes of training data. Toaddress this issue we wrote scripts that would replicate essentially identical behavior (bothnormal and exploit) while varying these details. Note that preprocessing the data (seeSection 2.4) may eliminate most of these problems by stripping out filenames or port numbersand leaving only information deemed to be relevant.
We have noted the importance of perturbing the data by including in the training set differentversions of the same basic attack and by varying unimportant details like file names and userIDs. This should help generalization and prevent an IDS from learning to distinguish attacksfrom normal behavior by using such clues. The BSM audit file identified as Variant in Table 2
18
contains data collected in an attempt at carry out this plan. Three successful buffer-overflowexploits collected in other data sets (Eject, Fd, and T4) are separated by short periods of normalactivity. Nonsense filenames are used for the exploit executables and then, during the periods ofnormal activity, files that have the same name but don’t do anything unusual are executed. Alsoincluded are some command-line arguments that are the same in the normal and exploit cases,such as doing something superficially similar to the “eject” exploit. In general, the idea is togenerate normal activity that has some superficial similarity to exploit data even though anexploit is not really occurring.
Table 2. Clean and exploit BSM files for training and testing ID systems.
Name Type Description
Eject Buffer overflow Uses ‘eject’ utility
Fail.Blat Buffer overflow Uses ‘passwd’
Fail.Dtprint Race condition Uses print utility
Fail.Eject Buffer overflow Uses ‘eject’ utility
Fail.Rpc Buffer overflow Uses remote procedure call daemon
Fd Buffer overflow Uses floppy disk formatting utility
Rdist Buffer overflow Uses remote file distribution utility
Sdtcm Buffer overflow Uses desktop calendar manager
Sunkill Denial-of-service Open a telnet connection, flood victim with garbage
T4 Buffer overflow Slight modification of Rdist
ufsrestore Buffer overflow Uses file backup utility
Clean Normal activity User manipulates files and executes programs
Clean2 Normal activity Contains activity that is similar to exploit activity:pings and attempts to read files without permission
Clean3 Normal activity User manipulates files and executes programs
Variant Buffer overflow
Normal activity
Includes Eject, Fd, and T4 exploits, and normalactivity similar to the exploits
19
2.4. Data Representation and PreprocessingGiven the essentially temporal nature of the data, the choice of some type of recurrent networkarchitecture was clear. In recurrent network architecture, there are connections from someinternal nodes to the input nodes. Thus, the raw input vector is combined with a memory ofprevious states, so that the response of the network to an input depends on the context in whichthis vector is seen. Such a network can learn to respond to temporal patterns in the data. Theability to find temporal patterns is essential for our application, since an exploit necessarilyconsists of a sequence of interrelated actions; no single BSM event is likely to be suspicious inisolation.
Since BSM data are divided into records, it was natural to feed one input vector into the networkfor each BSM record. The difficult problem is to determine the contents of that vector. Neuralnetworks require fixed-length input vectors, so variable-length fields such as file names andcommand-line arguments need to be mapped to fixed-length, reasonably short inputs. Many ofthe fields in a typical BSM record are not likely to be useful for intrusion detection and can bediscarded. Fields with a fixed but large range, such as port numbers or process ids, can besimplified based on prior knowledge. Given a port number, for example, we may only recordone bit indicating that it was a reserved port or a user port.
2.4.1. BSM Filtering
Using BSM records as input vectors to a neural network-based IDS causes several difficulties.Among these are the variable length of each record, the redundant information included in eachrecord, and the representation of information in each record. For effective training of a neuralnetwork, the feature vector used to represent the state space of the host computer system shouldbe as small and informative as possible. In other words, dimensions of the vector that do notcontribute unique information with respect to exploit detection will only make IDS training moredifficult. Therefore, considerable effort has been spent simplifying the input BSM data as muchas possible without leaving out too much significant information. The decision about what toretain and what to leave out is a heuristic decision that will be fine-tuned through trial and error.The original free format of each BSM record was converted to a strict, fixed-size format forinput to a neural network. The section below describes each BSM token that was included in thefeature vectors of Sandia National Laboratories/New Mexico (Sandia) and the University ofMissouri/Rolla (UMR), and the translation of the token data.
2.4.1.1 UMR Feature VectorDr. Donald Wunsch of UMR, a collaborator in this work, applied his expertise in adaptive criticdesigns to the problem of intrusion detection. UMR performed BSM filtering using thefollowing rules, and achieved data compression and a fixed-length feature vector:
� Each BSM record begins with the header token. From this token, the 16-bit event typevalue that defines the system call described by the record is retained. This value is fed as16 binary inputs, where –1 corresponds to 0, and +1 to 1.

20
� The subject token contains the identification information. The user identification number(uid) is translated to a binary input as follows: +1 if the user is root, –1 if the user is asystem account (e.g., the uid, equals –2) or if the uid is unavailable, and 0 in all othercases. A total of 3 binary inputs are used to feed the audit, effective, and real useridentification numbers.
� The machine Internet Protocol (IP) address is translated to one binary input: 0 if it is thelocal machine, +1 if it is the remote machine address that was used to start the session, or–1 if it is some other remote machine. If the value is more than 65534, the 32-bit portaddress is entered using 16 binary inputs all set to –1.
� Since the process token has the same format as the subject token, the same rules are used.An additional binary input is used to indicate if the process token is not present, in whichcase the input is set to –1 and all other inputs for this token are set to 0. This technique isused for all tokens that can be absent from the current record.
� The return token contains an 8-bit error code and 32-bit return value. Eight binary inputsare used to enter the error code, but the return value is entered through one input asfollows: –1 if it is a negative number, 0 if it is zero, and +1 if it is positive (i.e., only thesign of return value is entered).
� The arg token contains a 32-bit argument value for the system call, an 8-bit argumentnumber, and a descriptive text string. The value and number are represented as 32 + 8binary inputs. To enter the text information, the 29 different strings appearing in the datawere enumerated using 5 binary inputs. To enter an unknown string, all 5 inputs are setto –1. An additional input is used to indicate the absence of the arg token from thecurrent record. If there are several arg tokens in the record, the whole record is repeatedwith new values of the arg inputs.
� A similar approach is used to enter the exec_args token. The total count of arguments isentered through one input scaled to [0,1]. If there is no exec_args token in the record,this input is set to zero. Eight binary inputs are used to enter the ordinal number of thecurrent argument. The length of the text argument is scaled to [0,1] and fed in via oneinput. Instead of entering the text string, we enter its spectrum, 256 values correspondingto the frequency of each character in the string. The frequency of a character is computedas the number of appearances of this character in the string divided by the length of thestring.
� The path token is fed in using the same spectral decomposition. It yields another 256inputs for the spectrum, one input for the length, plus another input indicating thepresence of this token in the record.
� Two fields are taken from the attribute token: the mode, entered through 32 binaryinputs; and the user identification number, which is coded the same way as for the subjecttoken. An additional input indicates the presence of the token.
� To input the text token, 4 binary inputs are used to code one of nine enumerated strings.These inputs are set to –1 for an unknown string, and to 0 if the text token is not present.

21
� The IP address and port number used in in_addr, iport, and socket_inet tokens are codedas for the subject token. Together with the presence indicators, it yields 2 inputs for thein_addr token, 17 inputs for the iport token, and 18 inputs for the socket_inet token.
Thus, the total number of inputs is 711.
2.4.1.2 Sandia Feature VectorExperiments conducted at Sandia using neural networks utilized a feature vector using a fewdifferent filtering rules than the UMR feature vector (see Section 2.4.1.1), as indicated below.
Sandia feature vector rules differing from the UMR feature vector:
� The header token contains the time and date of the event recorded by the BSM record inan 8-byte field. Three of the eight bytes are included in the feature vector. These bytesrepresent a time span of about 5 minutes.
� The text strings present in the arg, exec_arg, path, and text tokens are represented using asimple hash algorithm with a 1-byte output. For the arg and text token, a single byte isused to represent the descriptive text string. For the exec_args token, which can includemany arguments in a single token, the first argument, last argument, and those argumentsbetween the first and last are each represented with a separate byte from the hashalgorithm. The path string in the path token is separated into a path minus the filenameand filename itself. Each of these strings is hashed to produce two separate bytes.
� The session id is included in the feature vector as a 16-bit unsigned integer.
� Numeric fields in various tokens are presented to the neural network as a single inputrather than as multiple binary inputs.
The Sandia feature vector representing 35 separate dimensions or inputs is described below as aC structure.
struct feature_vector {u_short event_id; /* header Token */u_char event_id_mod;u_char timeMSB;u_char timeMid;u_char timeLSB;u_char arg_num; /* arg Token */u_long arg_val;u_char arg_hash;u_long file_mode; /* attr Token */u_char attr_uid;u_char attr_gid;u_char arg_count; /* exec_args Token */u_char arg_first;u_char arg_mid;u_char arg_last;u_char ip_addr; /* in_addr Token */u_char in_exist;u_short port; /* iport Token */u_char port_exist;u_char path_len; /* path Token */u_char path_hash;
22
u_char file_hash;u_char proc_uid; /* process Token */u_char proc_gid;u_char proc_ruid;u_char proc_exist;u_char ret_error; /* return Token */u_char ret_val;u_char sock_type; /* socket Token */u_short sock_port;u_char subj_uid; /* subject Token */u_char subj_gid;u_char subj_ruid;u_short sess_id;u_char text_hash; /* text Token */
};
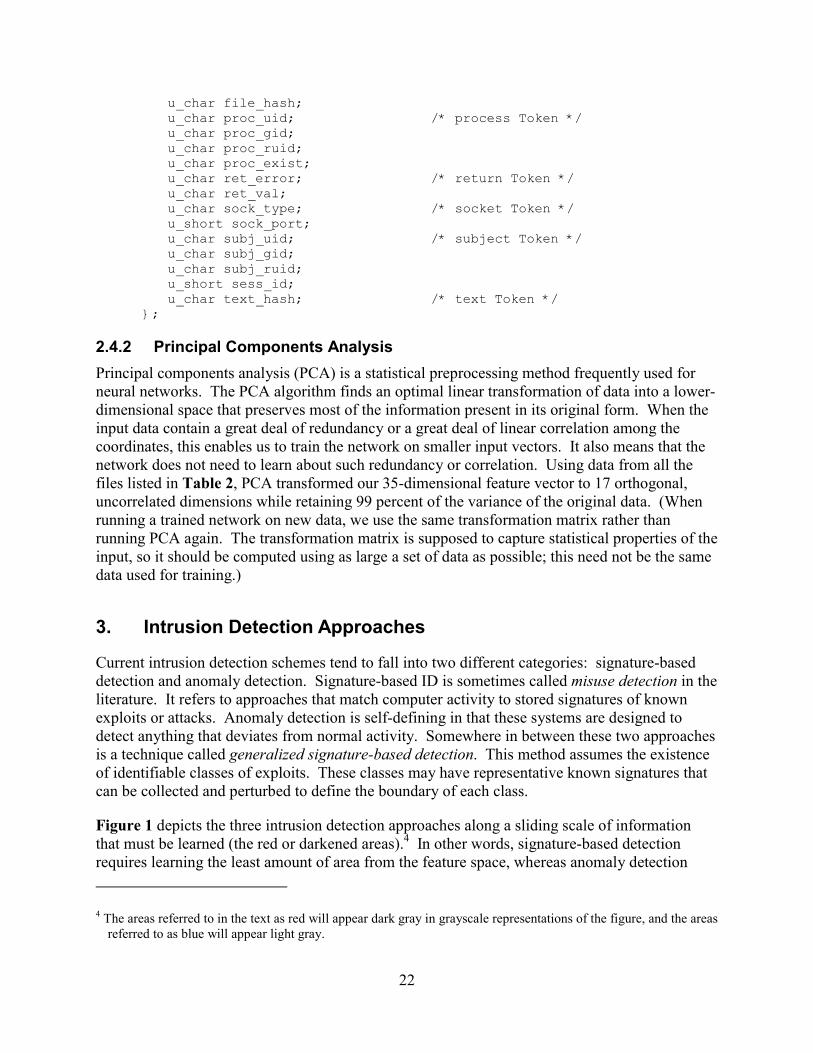
2.4.2 Principal Components AnalysisPrincipal components analysis (PCA) is a statistical preprocessing method frequently used forneural networks. The PCA algorithm finds an optimal linear transformation of data into a lower-dimensional space that preserves most of the information present in its original form. When theinput data contain a great deal of redundancy or a great deal of linear correlation among thecoordinates, this enables us to train the network on smaller input vectors. It also means that thenetwork does not need to learn about such redundancy or correlation. Using data from all thefiles listed in Table 2, PCA transformed our 35-dimensional feature vector to 17 orthogonal,uncorrelated dimensions while retaining 99 percent of the variance of the original data. (Whenrunning a trained network on new data, we use the same transformation matrix rather thanrunning PCA again. The transformation matrix is supposed to capture statistical properties of theinput, so it should be computed using as large a set of data as possible; this need not be the samedata used for training.)
3. Intrusion Detection Approaches
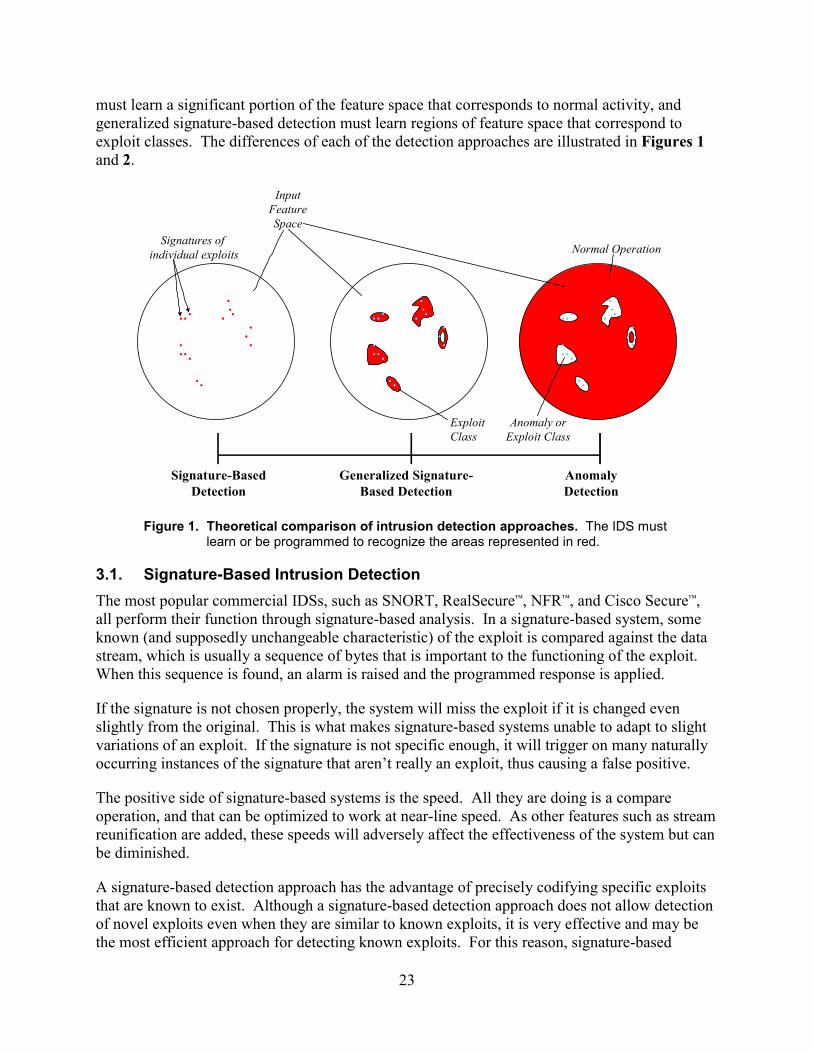
Current intrusion detection schemes tend to fall into two different categories: signature-baseddetection and anomaly detection. Signature-based ID is sometimes called misuse detection in theliterature. It refers to approaches that match computer activity to stored signatures of knownexploits or attacks. Anomaly detection is self-defining in that these systems are designed todetect anything that deviates from normal activity. Somewhere in between these two approachesis a technique called generalized signature-based detection. This method assumes the existenceof identifiable classes of exploits. These classes may have representative known signatures thatcan be collected and perturbed to define the boundary of each class.
Figure 1 depicts the three intrusion detection approaches along a sliding scale of informationthat must be learned (the red or darkened areas).4 In other words, signature-based detectionrequires learning the least amount of area from the feature space, whereas anomaly detection 4 The areas referred to in the text as red will appear dark gray in grayscale representations of the figure, and the areas
referred to as blue will appear light gray.
23
must learn a significant portion of the feature space that corresponds to normal activity, andgeneralized signature-based detection must learn regions of feature space that correspond toexploit classes. The differences of each of the detection approaches are illustrated in Figures 1and 2.
Generalized Signature-Based Detection
AnomalyDetection
Signature-BasedDetection
.
InputFeatureSpace
Signatures of individual exploits
ExploitClass
.
..
.
..
.
. .
.
.
.. .
.
...
..
..
.
. .
.
.
.. .
.
.. .
..
..
.
. .
.
.
.. .
.
...
..
..
.
. .
.
.
.. .
.
.. .
..
..
.
. .
.
.
.. .
.
...
..
..
.
. .
.
.
.. .
.
..
Normal Operation
Anomaly orExploit Class
Figure 1. Theoretical comparison of intrusion detection approaches. The IDS mustlearn or be programmed to recognize the areas represented in red.
3.1. Signature-Based Intrusion DetectionThe most popular commercial IDSs, such as SNORT, RealSecure™, NFR™, and Cisco Secure™,all perform their function through signature-based analysis. In a signature-based system, someknown (and supposedly unchangeable characteristic) of the exploit is compared against the datastream, which is usually a sequence of bytes that is important to the functioning of the exploit.When this sequence is found, an alarm is raised and the programmed response is applied.
If the signature is not chosen properly, the system will miss the exploit if it is changed evenslightly from the original. This is what makes signature-based systems unable to adapt to slightvariations of an exploit. If the signature is not specific enough, it will trigger on many naturallyoccurring instances of the signature that aren’t really an exploit, thus causing a false positive.
The positive side of signature-based systems is the speed. All they are doing is a compareoperation, and that can be optimized to work at near-line speed. As other features such as streamreunification are added, these speeds will adversely affect the effectiveness of the system but canbe diminished.
A signature-based detection approach has the advantage of precisely codifying specific exploitsthat are known to exist. Although a signature-based detection approach does not allow detectionof novel exploits even when they are similar to known exploits, it is very effective and may bethe most efficient approach for detecting known exploits. For this reason, signature-based

24
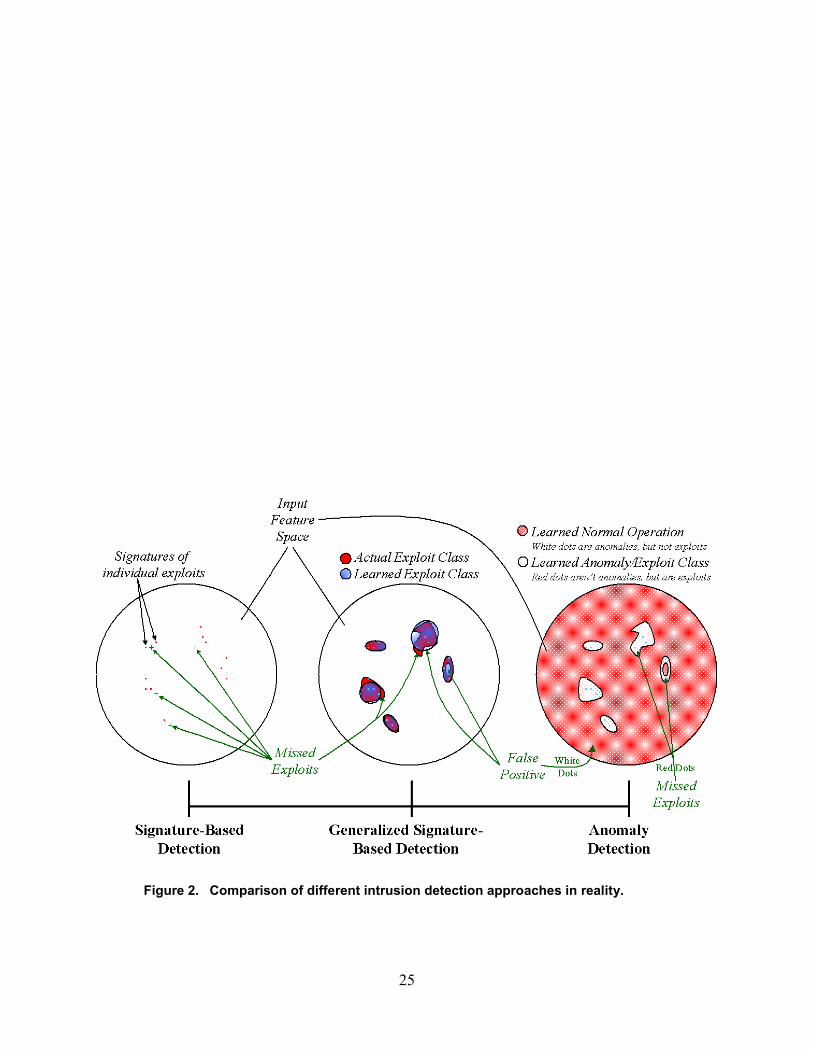
detection can achieve low false-positive errors with a high incidence of missed exploits. The leftcircle in Figure 1 illustrates the signature-based detection concept. It indicates individual pointsin feature space that represent exploit signatures. The left circle in Figure 2 illustrates theproblem of missing exploits that are close in proximity to known exploit signatures in featurespace.
25
Figure 2. Comparison of different intrusion detection approaches in reality.

26
3.2. Generalized Signature-Based Intrusion DetectionGeneralized signature-based intrusion detection approaches fall between signature-based andanomaly-based detection on the scale of “what an IDS must learn” (see Figure 1). The basicidea is to take advantage of the fact that there are well-defined known exploits. With thisinformation, one can theoretically generalize a specific exploit with a representation that will,hopefully, include many exploits that are similar, thereby providing a means to detect new,unseen exploits. A single exploit signature can be generalized by perturbing various dimensionsof the exploit’s feature vector in sensible ways. Each perturbed exploit will help define a class ofsimilar exploits in feature space. The existence of a class or group of such similar exploitsdepends on the representation of each. Assuming classes of exploits (i.e., exploits that aresimilar in some sense) do exist, the job of the generalized signature-based IDS is to determinethe borders of these classes or regions in such a way that all exploits can be discriminated fromnormal data.
One of the problems with this intrusion detection approach is how best to characterize classes ofexploits. Do exploits that are similar in end result (e.g., elevation of privilege) or in theirtechnique (e.g., buffer overflow) manifest themselves in close proximity in feature space? Or iseach exploit, for all practical purposes, randomly distributed points in feature space? These aredifficult questions to answer, but based on the particular feature vector chosen to represent anexploit, one can, at the very least, perturb various elements of the feature vector to acquireadditional samples that are close in proximity in feature space. When one defines a region orclass of exploits in feature space using this method, the question becomes, “How much of theregion represents normal activity?” Figure 2 illustrates the reality of generalized signature-based detection and the kinds of errors that occur. If exploit classes are defined in a controlledmanner with a rich set of examples, generalized signature-based ID is expected to result in fewermissed exploits than basic signature-based IDs, but will potentially result in more false-positiveerrors.
One reason this approach is attractive is that anomaly detection requires learning an enormousamount of data, and yet much of what is detected may not be an exploit at all. The goal ofgeneralized signature-based detection is to learn to detect exploits rather than anomalies ingeneral.
3.3. Anomaly DetectionAnomaly detection is an approach to detecting intrusions by first learning the characteristics ofnormal activity. Then, anything that is abnormal is considered an intrusion. The two primaryissues in anomaly detection are
1. Learning normal activity
2. Responding to detected anomalies.
The difficulties with learning normal activity on a computer system are the complexities andever-changing face of computer systems. In addition to frequent hardware and software changesin a computer, users and their habits change over time, as do the kinds of traffic into and out of acomputer. Even in the most controlled environments, the space of normal activity is considered

27
to be infinite. This fact is represented in Figures 1, 2, and 3 by the large circle of red that mustbe learned. The need to indefinitely learn normal activity has been termed perpetual novelty[SF01]. Nevertheless, techniques for anomaly detection can be designed to be as independent aspossible of computer system variability. For example, Ghosh et al. [GS99] argue thatmonitoring process behavior in a computer system can be more easily captured than userbehavior, and also is independent of user variability.
Once an anomaly is detected, a decision must be made about the significance and meaning of theanomaly. Since the goal of the system is exploit or intrusion detection, anomaly detectionrequires additional qualification before raising an alarm. For this reason, anomaly detectors areknown to have a high incidence of false positive errors. However, anomaly detectors definitelyhave the ability to detect new and unseen exploits that would be missed by a signature-basedapproach.
Figure 1 illustrates the concept of anomaly detection with the right circle, which is filled in red(or dark gray) to indicate the large space of normal activity. Exploits are identified by the whiteregions, with individual exploits represented as blue (or light gray) dots. The problems withanomaly detection are shown in Figure 2, where the red filling is spotted to indicate that normalactivity will never fully be learned. Each of these white dots is potentially a falsely identifiedexploit, or, at least, an anomaly. Missed exploits also are illustrated in Figure 2. Section 4.4 ofthis report describes an intrusion detection experiment using a statistical anomaly detectionscheme.
3.4. Combination of Detection ApproachesAs noted in the previous sections on detection approaches, each approach has particular strengthsand weaknesses that are summarized in Table 3.
Although not precise and certainly open to debate, Table 4 provides a judgment as to theexpected errors from each of these approaches. This information motivates the consideration ofa system that can combine and take advantage of the strengths of each approach. Figure 3illustrates the possible architecture and decision rule of such a system.
Table 3. Strengths and weaknesses of intrusion detection approaches.
Detection Approach Strength Weakness
Signature-based Efficient and simple High maintenance
Generalized signature-based Learn classes of exploits Difficult to define classes
Anomaly Detect novel exploits Perpetual novelty

28
Table 4. Expected incidence of false alarms for each intrusion detection approach.
Detection Approach Incidence of MissedExploits
False Positive Errors
Signature-based High Low
Generalized signature-based Average Average
Anomaly Average High
Figure 3. Potential combination of intrusion detection approaches.
4. Intrusion Detection Experiments
Each experiment provides preliminary results of an adaptive intrusion detection technique. Byadaptive, we mean that the system can learn and adapt to new situations. In other words, thestate of the IDS changes continually in response to changing conditions. To some extent, suchchange is inherent in the recurrent network architecture described in Section 2.4. The networkresponse to the current vector will be different depending upon the recent history of BSM inputs.Furthermore, the capacity for adaptive behavior is inherent in any neural network architecture,since it is possible to continue training (with a small learning rate for stability) while the systemis in use.
29
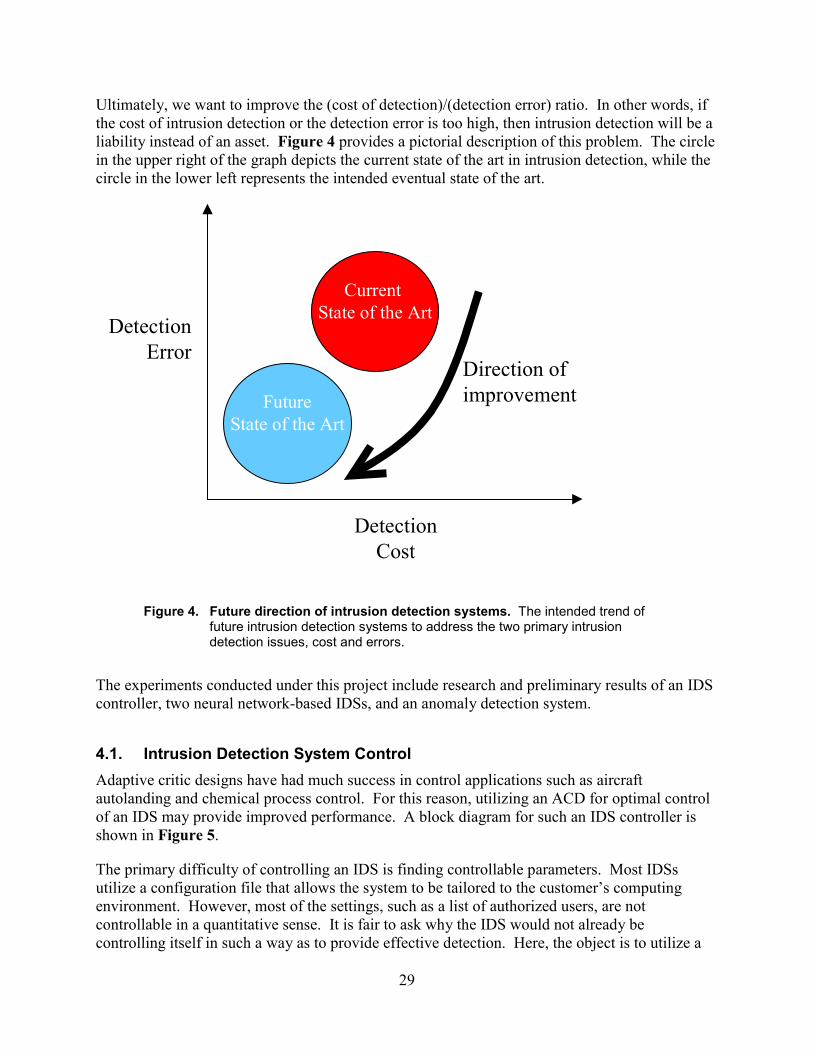
Ultimately, we want to improve the (cost of detection)/(detection error) ratio. In other words, ifthe cost of intrusion detection or the detection error is too high, then intrusion detection will be aliability instead of an asset. Figure 4 provides a pictorial description of this problem. The circlein the upper right of the graph depicts the current state of the art in intrusion detection, while thecircle in the lower left represents the intended eventual state of the art.
Figure 4. Future direction of intrusion detection systems. The intended trend offuture intrusion detection systems to address the two primary intrusiondetection issues, cost and errors.
The experiments conducted under this project include research and preliminary results of an IDScontroller, two neural network-based IDSs, and an anomaly detection system.
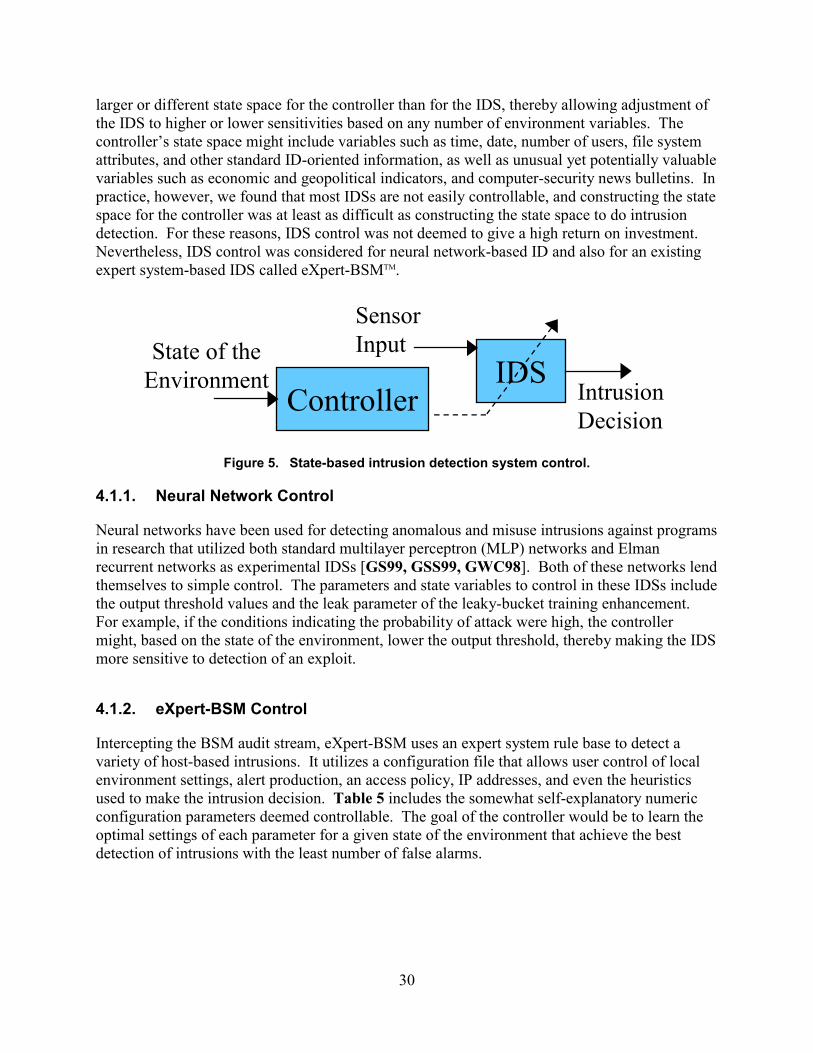
4.1. Intrusion Detection System ControlAdaptive critic designs have had much success in control applications such as aircraftautolanding and chemical process control. For this reason, utilizing an ACD for optimal controlof an IDS may provide improved performance. A block diagram for such an IDS controller isshown in Figure 5.
The primary difficulty of controlling an IDS is finding controllable parameters. Most IDSsutilize a configuration file that allows the system to be tailored to the customer’s computingenvironment. However, most of the settings, such as a list of authorized users, are notcontrollable in a quantitative sense. It is fair to ask why the IDS would not already becontrolling itself in such a way as to provide effective detection. Here, the object is to utilize a
FutureState of the Art
Current State of the Art
Detection Error
Detection Cost
Direction of improvement
30
larger or different state space for the controller than for the IDS, thereby allowing adjustment ofthe IDS to higher or lower sensitivities based on any number of environment variables. Thecontroller’s state space might include variables such as time, date, number of users, file systemattributes, and other standard ID-oriented information, as well as unusual yet potentially valuablevariables such as economic and geopolitical indicators, and computer-security news bulletins. Inpractice, however, we found that most IDSs are not easily controllable, and constructing the statespace for the controller was at least as difficult as constructing the state space to do intrusiondetection. For these reasons, IDS control was not deemed to give a high return on investment.Nevertheless, IDS control was considered for neural network-based ID and also for an existingexpert system-based IDS called eXpert-BSMTM.
IDSController
SensorInput
Intrusion Decision
State of theEnvironment
Figure 5. State-based intrusion detection system control.
4.1.1. Neural Network Control
Neural networks have been used for detecting anomalous and misuse intrusions against programsin research that utilized both standard multilayer perceptron (MLP) networks and Elmanrecurrent networks as experimental IDSs [GS99, GSS99, GWC98]. Both of these networks lendthemselves to simple control. The parameters and state variables to control in these IDSs includethe output threshold values and the leak parameter of the leaky-bucket training enhancement.For example, if the conditions indicating the probability of attack were high, the controllermight, based on the state of the environment, lower the output threshold, thereby making the IDSmore sensitive to detection of an exploit.
4.1.2. eXpert-BSM Control
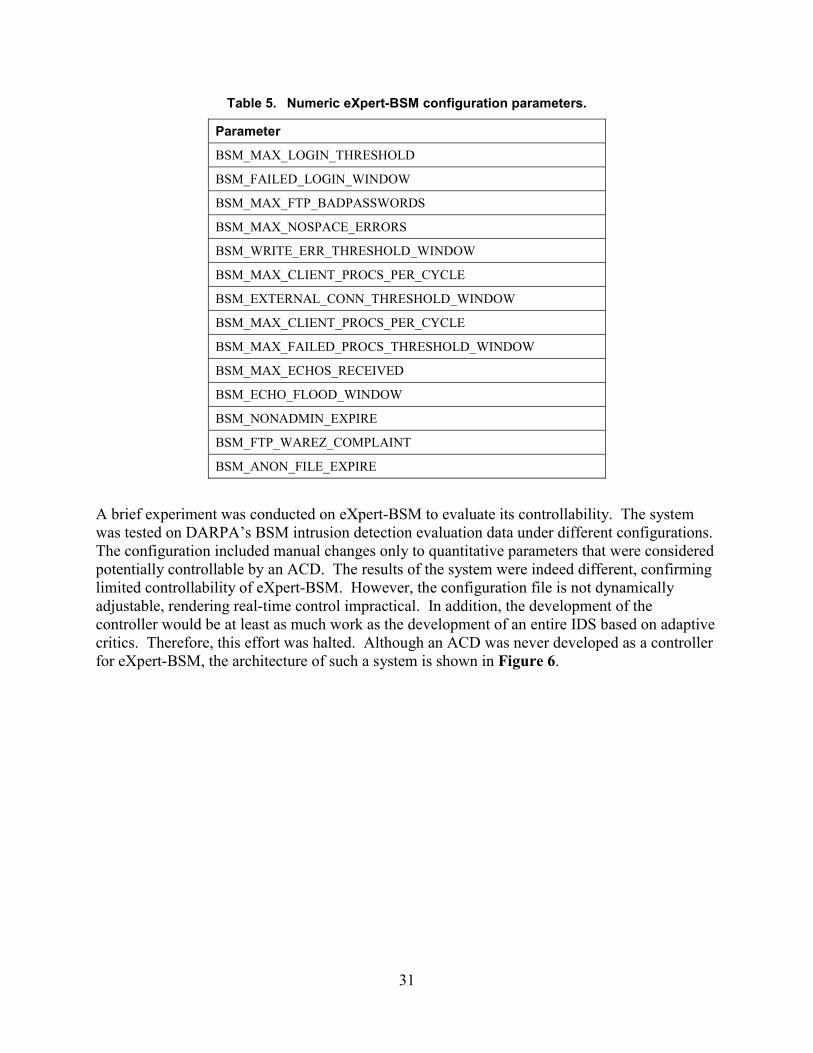
Intercepting the BSM audit stream, eXpert-BSM uses an expert system rule base to detect avariety of host-based intrusions. It utilizes a configuration file that allows user control of localenvironment settings, alert production, an access policy, IP addresses, and even the heuristicsused to make the intrusion decision. Table 5 includes the somewhat self-explanatory numericconfiguration parameters deemed controllable. The goal of the controller would be to learn theoptimal settings of each parameter for a given state of the environment that achieve the bestdetection of intrusions with the least number of false alarms.
31
Table 5. Numeric eXpert-BSM configuration parameters.
Parameter
BSM_MAX_LOGIN_THRESHOLD
BSM_FAILED_LOGIN_WINDOW
BSM_MAX_FTP_BADPASSWORDS
BSM_MAX_NOSPACE_ERRORS
BSM_WRITE_ERR_THRESHOLD_WINDOW
BSM_MAX_CLIENT_PROCS_PER_CYCLE
BSM_EXTERNAL_CONN_THRESHOLD_WINDOW
BSM_MAX_CLIENT_PROCS_PER_CYCLE
BSM_MAX_FAILED_PROCS_THRESHOLD_WINDOW
BSM_MAX_ECHOS_RECEIVED
BSM_ECHO_FLOOD_WINDOW
BSM_NONADMIN_EXPIRE
BSM_FTP_WAREZ_COMPLAINT
BSM_ANON_FILE_EXPIRE
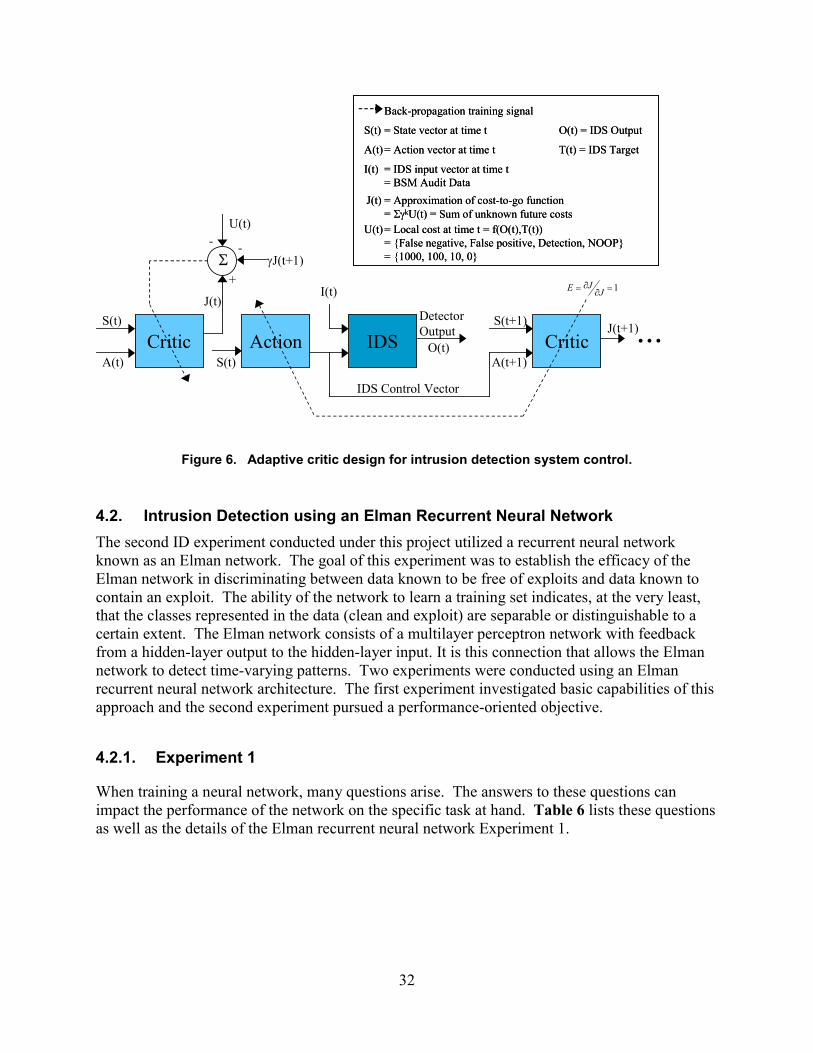
A brief experiment was conducted on eXpert-BSM to evaluate its controllability. The systemwas tested on DARPA’s BSM intrusion detection evaluation data under different configurations.The configuration included manual changes only to quantitative parameters that were consideredpotentially controllable by an ACD. The results of the system were indeed different, confirminglimited controllability of eXpert-BSM. However, the configuration file is not dynamicallyadjustable, rendering real-time control impractical. In addition, the development of thecontroller would be at least as much work as the development of an entire IDS based on adaptivecritics. Therefore, this effort was halted. Although an ACD was never developed as a controllerfor eXpert-BSM, the architecture of such a system is shown in Figure 6.
32
Figure 6. Adaptive critic design for intrusion detection system control.
4.2. Intrusion Detection using an Elman Recurrent Neural NetworkThe second ID experiment conducted under this project utilized a recurrent neural networkknown as an Elman network. The goal of this experiment was to establish the efficacy of theElman network in discriminating between data known to be free of exploits and data known tocontain an exploit. The ability of the network to learn a training set indicates, at the very least,that the classes represented in the data (clean and exploit) are separable or distinguishable to acertain extent. The Elman network consists of a multilayer perceptron network with feedbackfrom a hidden-layer output to the hidden-layer input. It is this connection that allows the Elmannetwork to detect time-varying patterns. Two experiments were conducted using an Elmanrecurrent neural network architecture. The first experiment investigated basic capabilities of thisapproach and the second experiment pursued a performance-oriented objective.
4.2.1. Experiment 1
When training a neural network, many questions arise. The answers to these questions canimpact the performance of the network on the specific task at hand. Table 6 lists these questionsas well as the details of the Elman recurrent neural network Experiment 1.
Back-propagation training signal
S(t) = State vector at time t O(t) = IDS Output
A(t)= Action vector at time t T(t) = IDS Target
J(t) = Approximation of cost-to-go function= ��kU(t) = Sum of unknown future costs
U(t)= Local cost at time t = f(O(t),T(t))= {False negative, False positive, Detection, NOOP}= {1000, 100, 10, 0}
I(t) = IDS input vector at time t= BSM Audit Data
Critic Action IDS CriticS(t)
...
� �J(t+1)
J(t)S(t)
IDS Control Vector
--
+
U(t)
A(t+1)A(t)
DetectorOutput
I(t)
S(t+1)
1��
�� JJE
J(t+1)O(t)

33
Table 6. Elman recurrent neural network-related questions, Experiment 1.Important neural network-related questions and the corresponding answers forthe Elman recurrent neural network Experiment 1.
Questions Answers for Elman network Experiment 1
How many hidden layers? 1
How many nodes in each hidden layer? 88
Which training algorithm? Gradient descent back-propagation withmomentum and adaptive learning rate
What activation functions? Logistic sigmoid
What learning rate? Adaptive
When one performs supervised training of a neural network, a target or “correct” output value foreach input feature vector is used. Clean data were assigned a target value of 0, while exploit datawere assigned a value of 1. However, it is unrealistic to expect the neural network to recognizean exploit after just one or a few BSM records. To address this problem, the target networkoutput is ramped up gradually from clean (0 ) to exploit (1) at the beginning of an exploit.
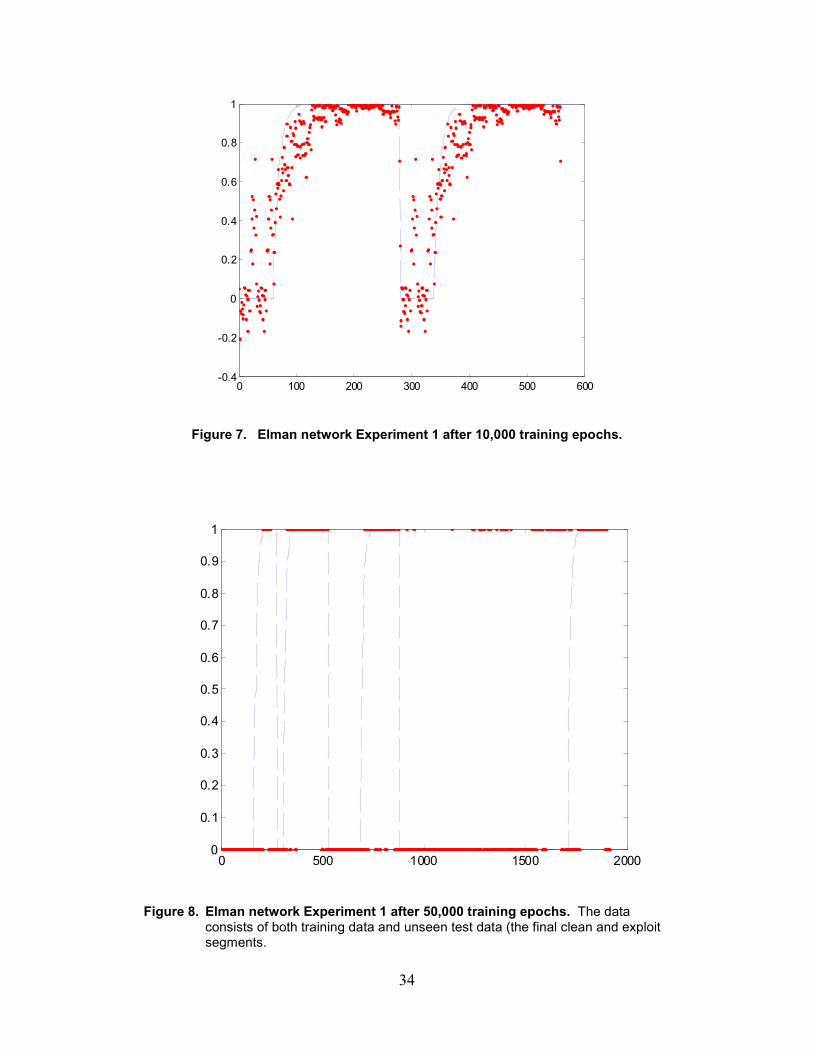
Figure 7 shows the results of an Experiment 1 network on a fragment of clean data followed bya fragment of exploit data (repeated once), in this case the Rdist exploit (see Table 2 in Section2.3). Network responses are plotted as red (or dark gray) dots, and target outputs are plotted as ablue (or gray) dashed line. The shape of the target ramp is obvious on the left side of the exploitdata sequence. This result clearly shows that there is reason to believe that a clean fragment ofdata can be distinguished from an exploit fragment. At the very least, this is a validation of acredible feature vector.
Inspection of Figure 7 indicates that some form of postprocessing might be necessary to arrive ata final decision about whether an intrusion exists in a fragment of data or not. The obviousproblem is placing too much value on stray or outlying samples in a clean fragment that might beconsidered an exploit. Figure 8 shows an Experiment 1 network output after postprocessingusing the following steps:
1. Median filter the output to suppress outliers. Any number of signal processing filterscould be utilized here to serve the intended purpose.
2. Threshold the median filtered data, resulting in a binary output.
The results shown in Figure 8 were produced using a 5-sample median filter and a threshold of0.5. However, a more complicated threshold scheme could be employed to minimize falsepositives and missed exploits. The first three exploit and clean fragments were part of thetraining data, while the final clean and exploit fragments were completely new to the network.
34
0 100 200 300 400 500 600-0.4
-0.2
0
0.2
0.4
0.6
0.8
1
Figure 7. Elman network Experiment 1 after 10,000 training epochs.
0 500 1000 1500 20000
0.1
0.2
0.3
0.4
0.5
0.6
0.7
0.8
0.9
1
Figure 8. Elman network Experiment 1 after 50,000 training epochs. The dataconsists of both training data and unseen test data (the final clean and exploitsegments.

35
4.2.2 Experiment 2
While Experiment was performed early on in the research project, Experiment 2 involving anElman recurrent neural network took advantage of all the experience gained in the project. Inaddition to the specific tuning of the neural network as described in Table 7, principalcomponents analysis (see Section 2.4.2) was employed as well.
Table 7. Elman recurrent neural network-related questions, Experiment 2.Important neural network-related questions and the corresponding answers forthe Elman recurrent neural network Experiment 2.
Questions Answers for Elman network Experiment 2
How many hidden layers? 2
How many nodes in each hidden layer? 10 in both hidden layers
Which training algorithm? Resilient back-propagation
What activation functions? Tangent sigmoid
What learning rate? Adaptive
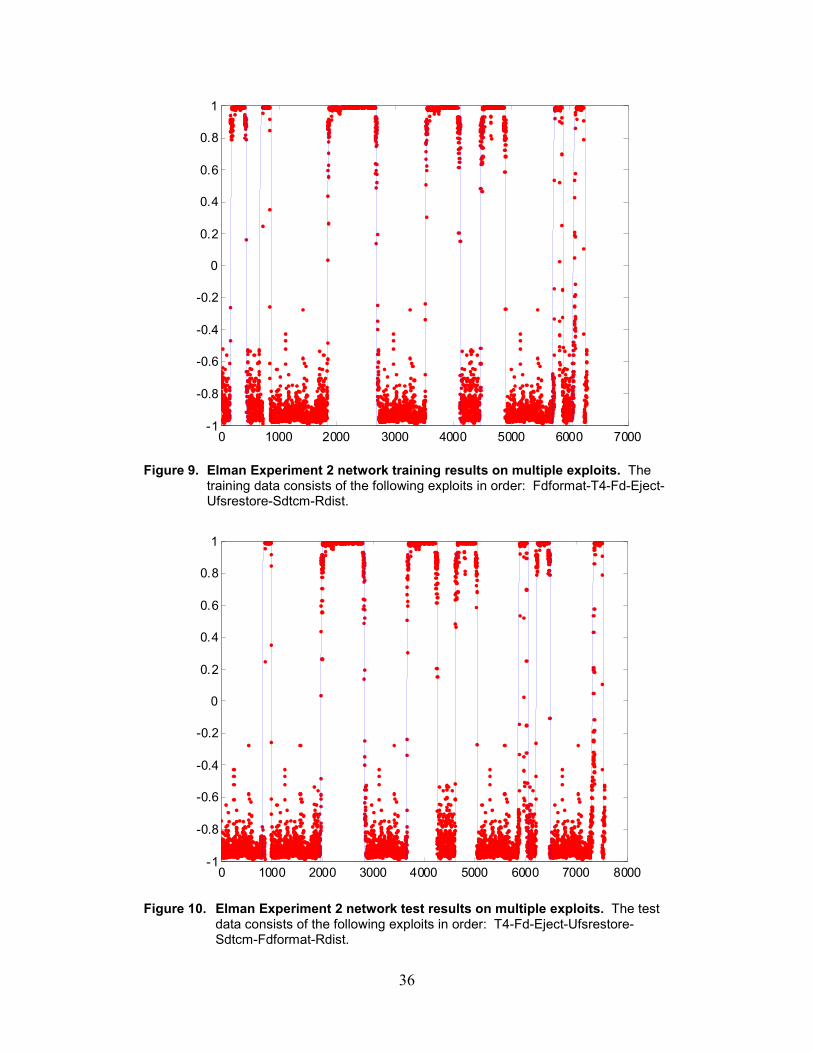
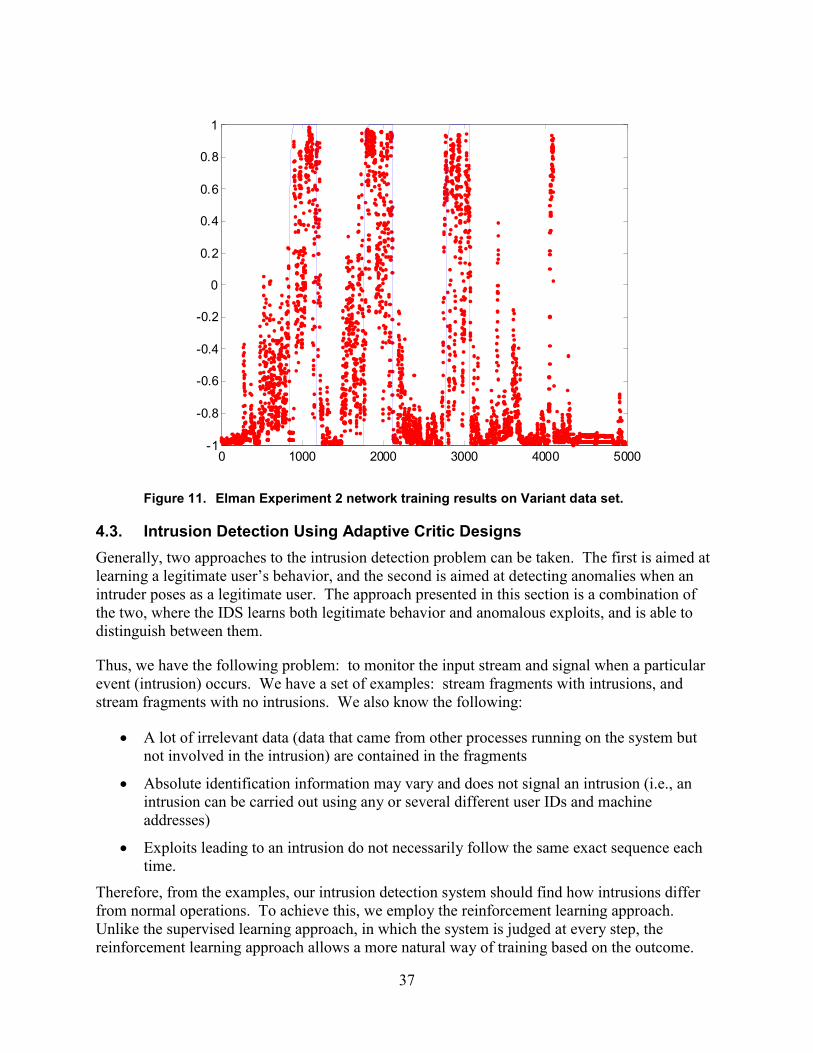
Results of this Elman Experiment 2 are shown in Figures 9–11, where the target outputs areshown in a solid line. The ability of the network to discriminate between clean data and datafrom several different exploits is clear. However, while figures 9 and 10 show results using wellcontrolled, very clean data, Figure 11 uses “messier” data that involved intentionally introducingsimilar activities as the exploits into the clean data.
36
0 1000 2000 3000 4000 5000 6000 7000-1
-0.8
-0.6
-0.4
-0.2
0
0.2
0.4
0.6
0.8
1
Figure 9. Elman Experiment 2 network training results on multiple exploits. Thetraining data consists of the following exploits in order: Fdformat-T4-Fd-Eject-Ufsrestore-Sdtcm-Rdist.
0 1000 2000 3000 4000 5000 6000 7000 8000-1
-0.8
-0.6
-0.4
-0.2
0
0.2
0.4
0.6
0.8
1
Figure 10. Elman Experiment 2 network test results on multiple exploits. The testdata consists of the following exploits in order: T4-Fd-Eject-Ufsrestore-Sdtcm-Fdformat-Rdist.
37
0 1000 2000 3000 4000 5000-1
-0.8
-0.6
-0.4
-0.2
0
0.2
0.4
0.6
0.8
1
Figure 11. Elman Experiment 2 network training results on Variant data set.
4.3. Intrusion Detection Using Adaptive Critic DesignsGenerally, two approaches to the intrusion detection problem can be taken. The first is aimed atlearning a legitimate user’s behavior, and the second is aimed at detecting anomalies when anintruder poses as a legitimate user. The approach presented in this section is a combination ofthe two, where the IDS learns both legitimate behavior and anomalous exploits, and is able todistinguish between them.
Thus, we have the following problem: to monitor the input stream and signal when a particularevent (intrusion) occurs. We have a set of examples: stream fragments with intrusions, andstream fragments with no intrusions. We also know the following:
� A lot of irrelevant data (data that came from other processes running on the system butnot involved in the intrusion) are contained in the fragments
� Absolute identification information may vary and does not signal an intrusion (i.e., anintrusion can be carried out using any or several different user IDs and machineaddresses)
� Exploits leading to an intrusion do not necessarily follow the same exact sequence eachtime.
Therefore, from the examples, our intrusion detection system should find how intrusions differfrom normal operations. To achieve this, we employ the reinforcement learning approach.Unlike the supervised learning approach, in which the system is judged at every step, thereinforcement learning approach allows a more natural way of training based on the outcome.
38
Using reinforcement learning at the end of a training fragment, the system gets a reward if thesystem has correctly indicated the intrusion at any time during the fragment. The system ispenalized at the end of the fragment if the system has missed the intrusion or given a false alarm.As a result, the system has to find out what it did right or wrong, thereby solving a creditassignment problem. In a return, such a delayed credit gives the system the freedom of trial anderror exploration. Given a new, unknown fragment, the system makes its best guess based onexperience. At the end of the fragment, the system learns from its errors.
Since the system is trained only at the end of a training fragment, it is appropriate to implementlifelong training in which the system keeps learning while it is in field use. This approach allowsthe system to follow the changing environment and to catch up as new unknown attacks appear.
The important characteristic of an intrusion detection system is the false alarm rate. A falsealarm occurs if the system indicates an intrusion when none exists in the data. If a system “crieswolf” too often, most likely that system will be ignored. To minimize this possibility, weintroduced a set of immediate penalties for false alarms and missed intrusions, and required thesystem to minimize a discounted sum of penalties, thus casting our problem as a dynamicprogramming problem.
4.3.1. Methodology
We use the heuristic dynamic programming (HDP) to approach the problem [PW97]. HDP isthe most straightforward member of the ACD family. Consider the agent-environment model.The agent senses state information from the environment, responds with an action, and isrewarded or penalized. In our case, the agent is the IDS and the environment is the computersystem together with a human system administrator. The environment provides the stateinformation through BSM data. The IDS indicates either an intrusion or no intrusion. When thesystem administrator investigates the alleged intrusion or discovers a missed one, theadministrator provides the IDS with a penalty or reward, summarized in Table 8.
Table 8. The reinforcement-learning approach for penalizing or rewarding the IDS.
Intrusion Alarm Penalty/Reward*
Yes Yes –1
Yes No 1
No Yes 1
No No 0
* A negative number indicates a reward.
The adaptive critic design we use (see Figure 12) is comprised of two neural networks: actionand critic. The action network senses the input state information and responds with an action.The critic network gets the state information, analyzes the action taken, and estimates the

39
cumulative cost. The incurred immediate cost is used to correct this estimate during training ofthe critic. Then, this estimate is minimized via training of the action network.
Consider U(t), the immediate cost incurred at moment t. Then, the estimated cumulative costJ*(t) is expressed as follows:
� � � �� ��
k
k ktUtJ �* , (Equation 1)
where � is a discount factor (0<�<1). Let R(t) represent the state information at moment t,A(t)=A(R(t)) represent the response of the action network, and J(t)=J(R(t),A(t)) represent theoutput of the critic. The critic is trained, minimizing the following error functional
� �
� � � � � � � �tJtUtJtE
tEt
����
�
1
,2
�
(Equation 2)
i.e., �J(t + 1) + U(t) is the target value for J(t). The update rule for the critic weights WC is givenby
� � � � � �� �� �
CCC W
tJtJtUtJW
�
������ 1�� , (Equation 3)
where �C is a small positive learning rate.
Since we seek a decision policy (realized by the action network) that minimizes the cumulativecost, we minimize J(t) using gradients computed by the critic and action networks
� �� �
� �
AAA W
tA
tA
tJW
�
�
�
���� � , (Equation 4)
where �WA is the weights update for the action network, and �A is a small positive learning rate.
To address the temporal nature of the state information given by BSM data, we added a recurrentidentification network to our design. The purpose of this network is to extract the stateinformation R(t) from the input BSM data X(t) and maintain that information in the recurrentlayer. This network is trained together with the critic
� � � � � �� �� �� �
� �
III W
tR
tR
tJtJtUtJW
�
�
�
������ 1�� , (Equation 5)
where �R(t)/�WI is the gradient computed by the identification network with respect to itsweights WI. Derivatives with respect to the recurrent layer weights are calculated to depth 0. Inother words, we don’t go recursively back in time through delay elements computing thesederivatives (i.e., the delay elements of the recurrent layer are considered as additional inputs).
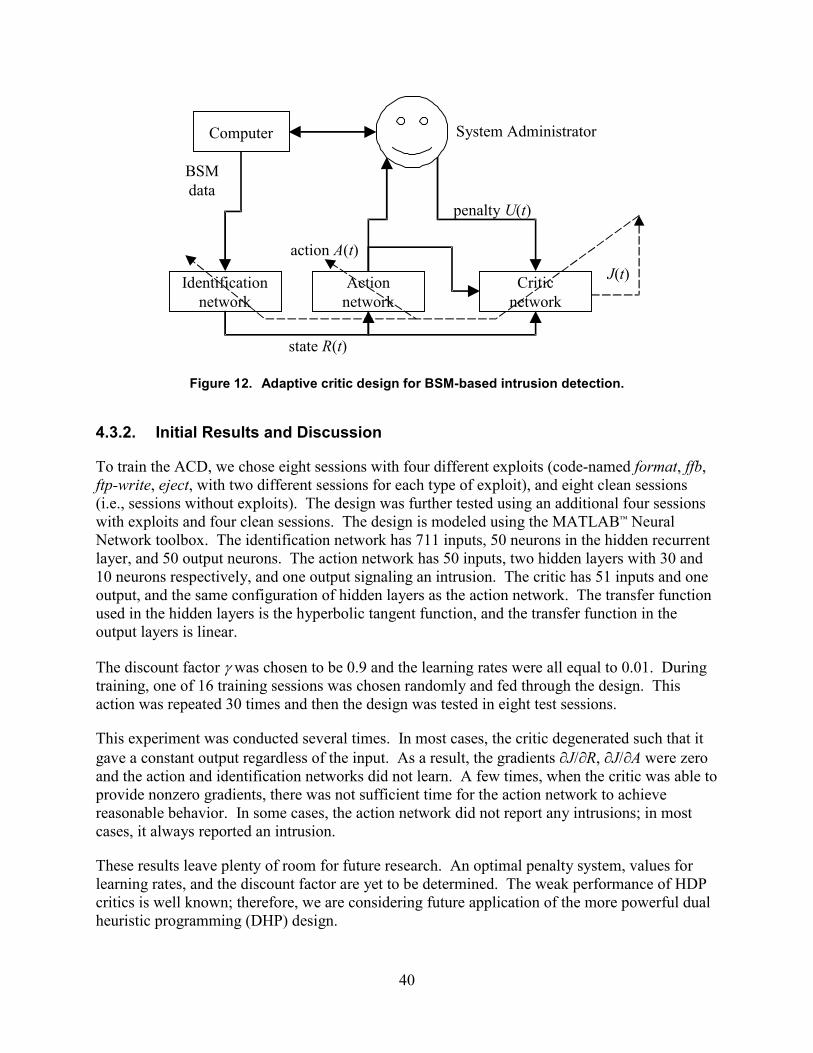
40
Identificationnetwork
Actionnetwork
Criticnetwork
Computer System Administrator
BSMdata
state R(t)
action A(t)
penalty U(t)
J(t)
Figure 12. Adaptive critic design for BSM-based intrusion detection.
4.3.2. Initial Results and Discussion
To train the ACD, we chose eight sessions with four different exploits (code-named format, ffb,ftp-write, eject, with two different sessions for each type of exploit), and eight clean sessions(i.e., sessions without exploits). The design was further tested using an additional four sessionswith exploits and four clean sessions. The design is modeled using the MATLAB™ NeuralNetwork toolbox. The identification network has 711 inputs, 50 neurons in the hidden recurrentlayer, and 50 output neurons. The action network has 50 inputs, two hidden layers with 30 and10 neurons respectively, and one output signaling an intrusion. The critic has 51 inputs and oneoutput, and the same configuration of hidden layers as the action network. The transfer functionused in the hidden layers is the hyperbolic tangent function, and the transfer function in theoutput layers is linear.
The discount factor � was chosen to be 0.9 and the learning rates were all equal to 0.01. Duringtraining, one of 16 training sessions was chosen randomly and fed through the design. Thisaction was repeated 30 times and then the design was tested in eight test sessions.
This experiment was conducted several times. In most cases, the critic degenerated such that itgave a constant output regardless of the input. As a result, the gradients �J/�R, �J/�A were zeroand the action and identification networks did not learn. A few times, when the critic was able toprovide nonzero gradients, there was not sufficient time for the action network to achievereasonable behavior. In some cases, the action network did not report any intrusions; in mostcases, it always reported an intrusion.
These results leave plenty of room for future research. An optimal penalty system, values forlearning rates, and the discount factor are yet to be determined. The weak performance of HDPcritics is well known; therefore, we are considering future application of the more powerful dualheuristic programming (DHP) design.
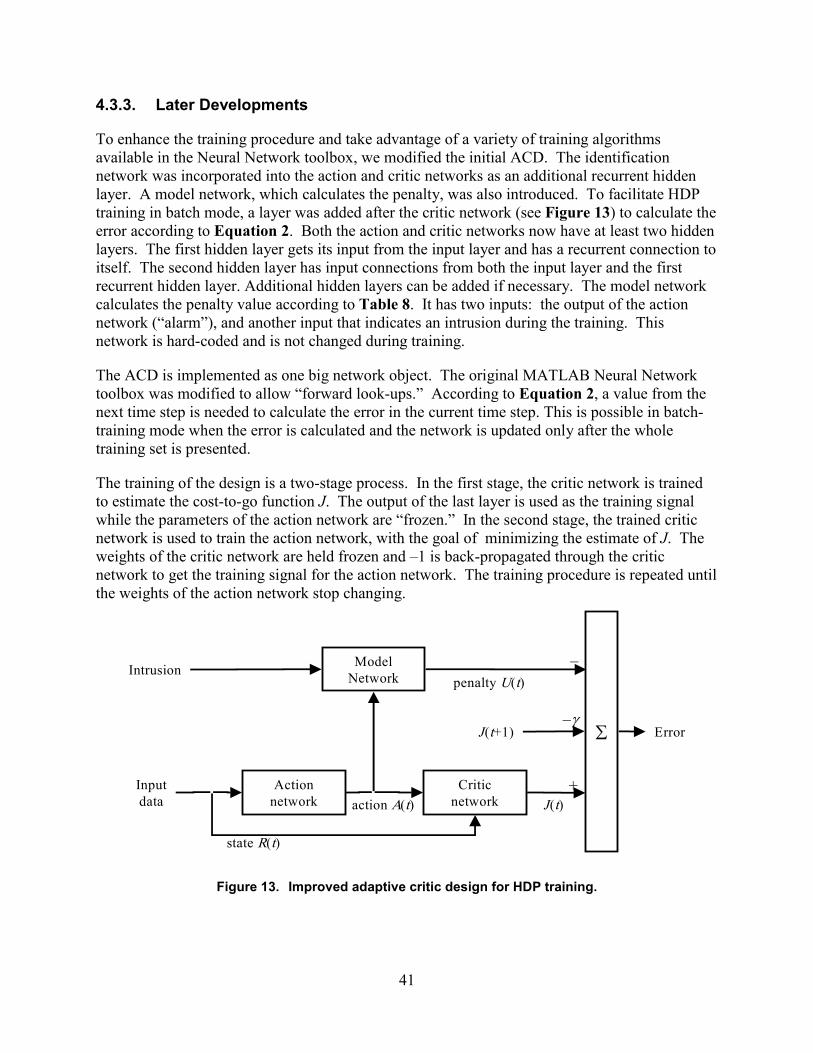
41
4.3.3. Later Developments
To enhance the training procedure and take advantage of a variety of training algorithmsavailable in the Neural Network toolbox, we modified the initial ACD. The identificationnetwork was incorporated into the action and critic networks as an additional recurrent hiddenlayer. A model network, which calculates the penalty, was also introduced. To facilitate HDPtraining in batch mode, a layer was added after the critic network (see Figure 13) to calculate theerror according to Equation 2. Both the action and critic networks now have at least two hiddenlayers. The first hidden layer gets its input from the input layer and has a recurrent connection toitself. The second hidden layer has input connections from both the input layer and the firstrecurrent hidden layer. Additional hidden layers can be added if necessary. The model networkcalculates the penalty value according to Table 8. It has two inputs: the output of the actionnetwork (“alarm”), and another input that indicates an intrusion during the training. Thisnetwork is hard-coded and is not changed during training.
The ACD is implemented as one big network object. The original MATLAB Neural Networktoolbox was modified to allow “forward look-ups.” According to Equation 2, a value from thenext time step is needed to calculate the error in the current time step. This is possible in batch-training mode when the error is calculated and the network is updated only after the wholetraining set is presented.
The training of the design is a two-stage process. In the first stage, the critic network is trainedto estimate the cost-to-go function J. The output of the last layer is used as the training signalwhile the parameters of the action network are “frozen.” In the second stage, the trained criticnetwork is used to train the action network, with the goal of minimizing the estimate of J. Theweights of the critic network are held frozen and –1 is back-propagated through the criticnetwork to get the training signal for the action network. The training procedure is repeated untilthe weights of the action network stop changing.
ModelNetwork
Actionnetwork
Criticnetwork
Inputdata
state R(t)
action A(t)
penalty U(t)
J(t)
J(t+1) �–�
–
+
Intrusion
Error
Figure 13. Improved adaptive critic design for HDP training.

42
4.3.4. Final Results
Figures 14–17 show the ability of an ACD-based IDS to learn a training set. One epoch oftraining data consisted of the following exploit and clean data sets (see Table 2 for a descriptionof the data sets):
Clean–Fd–Clean–Clean2–Rdist–Clean2–Clean–Sdtcm
The action network of the ACD-based IDS had three hidden layers, each with 10 nodes, and thecritic network had three hidden layers, each with 5 nodes. Each training iteration consisted of 5epochs of critic training and 5 epochs of action network training. The resilient back-propagationalgorithm was used to update weights. Inputs were preprocessed with principal componentsanalysis, which reduced the input dimension from 35 to 17.
Network responses are plotted as dots, and target outputs are plotted as a solid line. Note that theACD’s response to intrusions is easily distinguished from its response to normal behavior, inspite of the fact that the outputs are not always close to target outputs. We also noted a shift inthe effective output range as training continued; this appeared to be an artifact of the ACDtraining iterations.
The plots show the generalization performance of the network after 10 and then after 20iterations. The clean data is a mix of some clean training data with “clean3” sessions that thenetwork had not previously seen. There are two exploits, neither of which was in the trainingset. The longer one is the “sunkill” DOS attack (with data from the attacker’s machine), theother shorter one at the end of the test run is the “fdformat” buffer overflow attack. As with thetraining data, the neural net’s response to intrusions is distinguishable from its response tonormal behavior.
Figures 18 and 19 show results from the same ACD using slightly different numbers of trainingepochs on different training data. Each iteration consisted of 25 epochs of critic training and 50epochs of action-network training. In this case, one epoch of training data consisted of theFdformat, T4, Fd, Eject, Ufsrestore, Sdtcm, and Rdist exploits, with each exploit separated by acombination of the Clean, Clean2, and Clean3 data sets. The test data is simply a replica of thetraining except for the Fdformat exploit moved in time. The ACD is clearly able to discriminatebetween all exploits and the clean data. However, Figure 20 shows the difficulty the ACD hadin learning the Variant data set where exploit-similar activity is introduced into the normal data.The ACD output (shown as red or dark gray dots) does not closely follow the target (shown as asolid gray line) and is particularly in error in the normal fragments of the data.
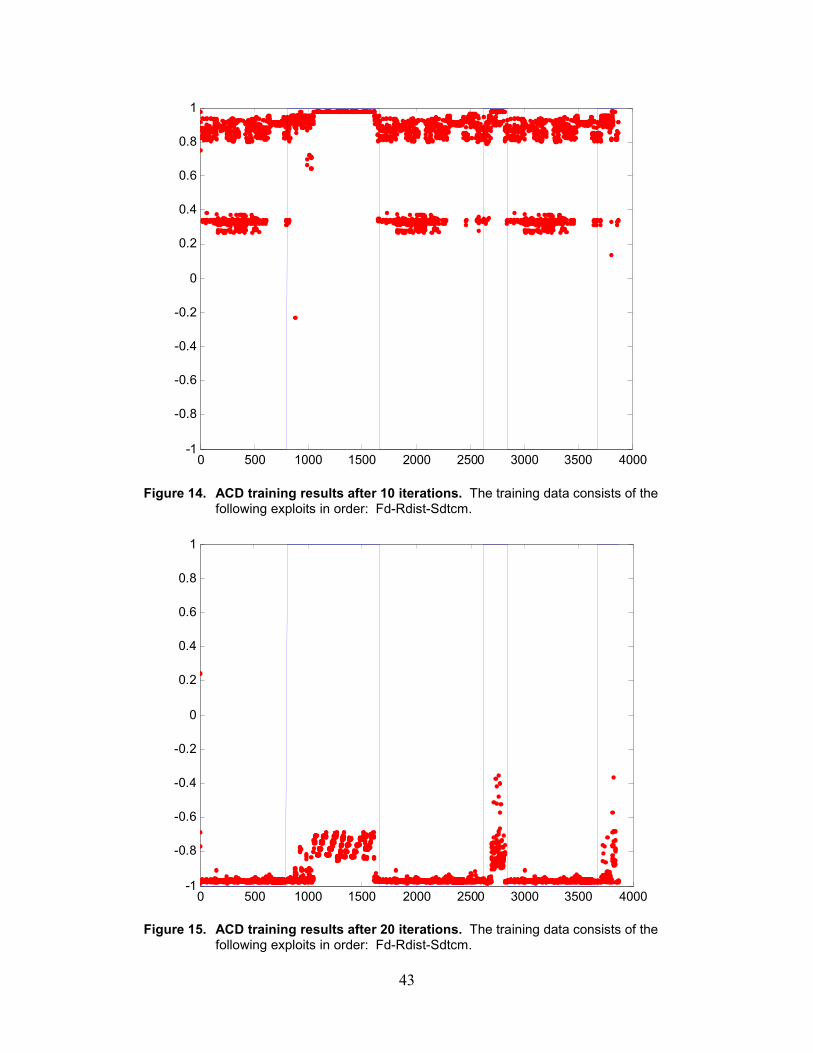
43
0 500 1000 1500 2000 2500 3000 3500 4000-1
-0.8
-0.6
-0.4
-0.2
0
0.2
0.4
0.6
0.8
1
Figure 14. ACD training results after 10 iterations. The training data consists of thefollowing exploits in order: Fd-Rdist-Sdtcm.
0 500 1000 1500 2000 2500 3000 3500 4000-1
-0.8
-0.6
-0.4
-0.2
0
0.2
0.4
0.6
0.8
1
Figure 15. ACD training results after 20 iterations. The training data consists of thefollowing exploits in order: Fd-Rdist-Sdtcm.

44
0 500 1000 1500 2000 2500 3000-1
-0.8
-0.6
-0.4
-0.2
0
0.2
0.4
0.6
0.8
1
Figure 16. ACD test results after 10 training iterations. The test data consists of thefollowing exploits in order: Sunkill-Fdformat.
0 500 1000 1500 2000 2500 3000-1
-0.8
-0.6
-0.4
-0.2
0
0.2
0.4
0.6
0.8
1
Figure 17. ACD test results after 20 training iterations. The test data consists of thefollowing exploits in order: Sunkill-Fdformat.
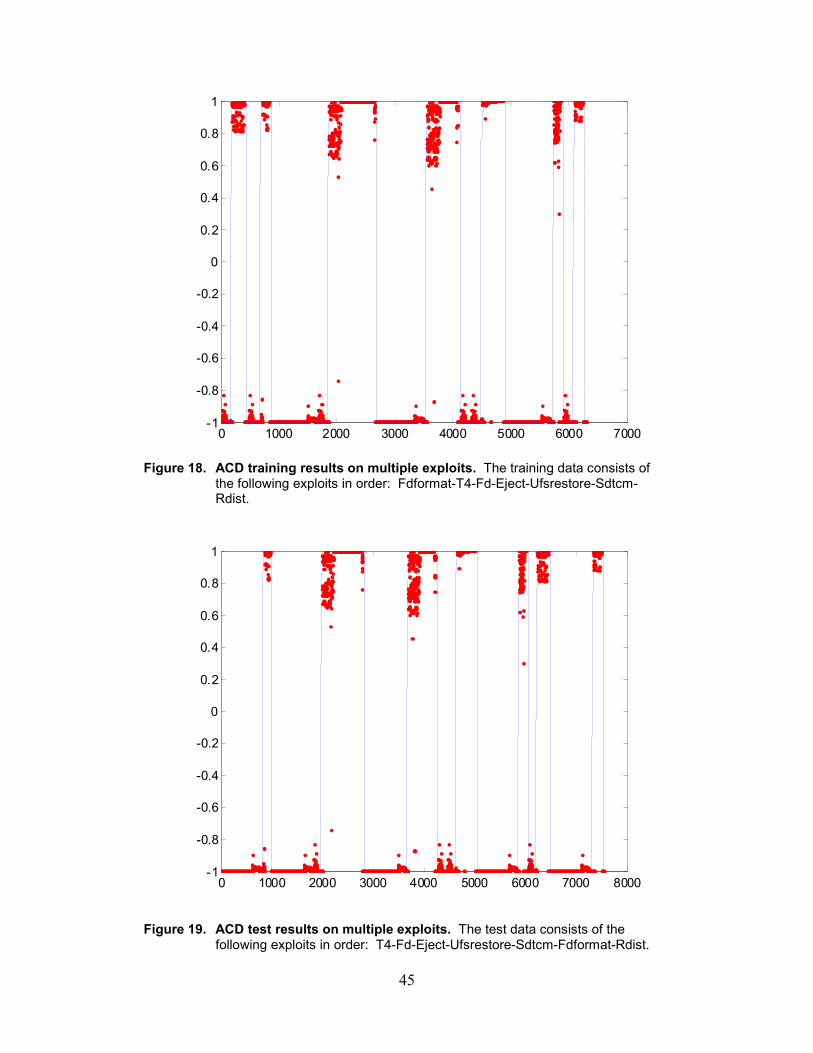
45
0 1000 2000 3000 4000 5000 6000 7000-1
-0.8
-0.6
-0.4
-0.2
0
0.2
0.4
0.6
0.8
1
Figure 18. ACD training results on multiple exploits. The training data consists ofthe following exploits in order: Fdformat-T4-Fd-Eject-Ufsrestore-Sdtcm-Rdist.
0 1000 2000 3000 4000 5000 6000 7000 8000-1
-0.8
-0.6
-0.4
-0.2
0
0.2
0.4
0.6
0.8
1
Figure 19. ACD test results on multiple exploits. The test data consists of thefollowing exploits in order: T4-Fd-Eject-Ufsrestore-Sdtcm-Fdformat-Rdist.
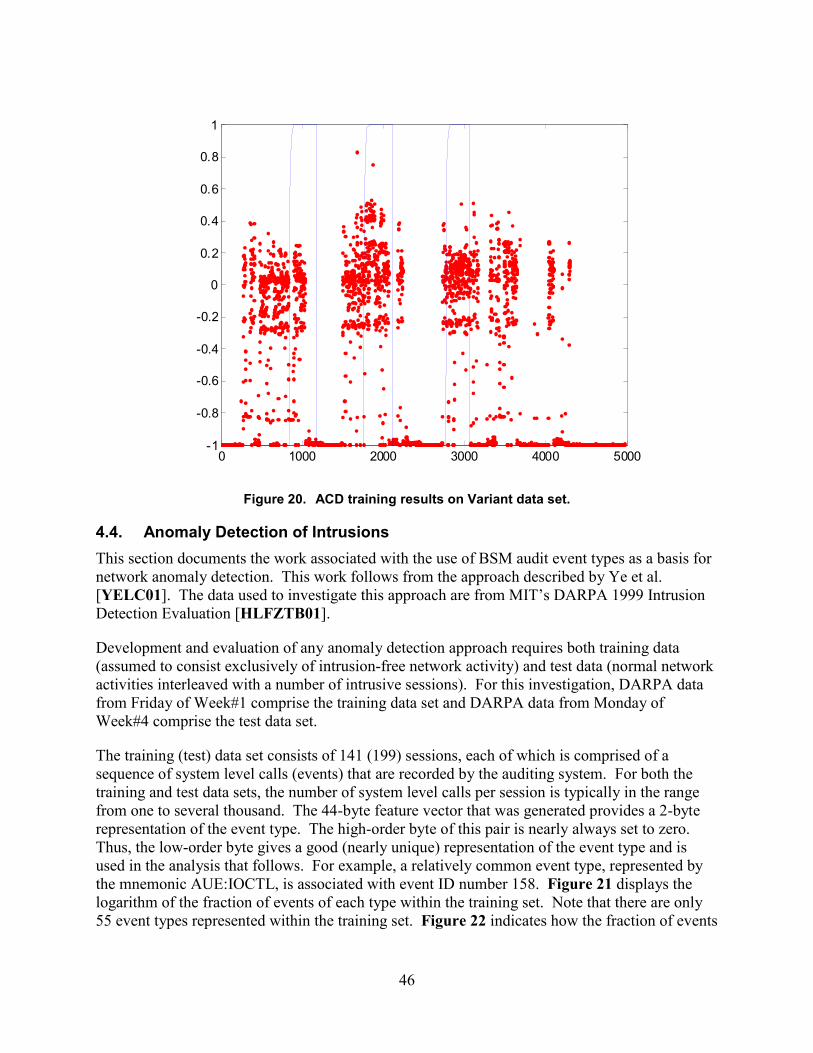
46
0 1000 2000 3000 4000 5000-1
-0.8
-0.6
-0.4
-0.2
0
0.2
0.4
0.6
0.8
1
Figure 20. ACD training results on Variant data set.
4.4. Anomaly Detection of IntrusionsThis section documents the work associated with the use of BSM audit event types as a basis fornetwork anomaly detection. This work follows from the approach described by Ye et al.[YELC01]. The data used to investigate this approach are from MIT’s DARPA 1999 IntrusionDetection Evaluation [HLFZTB01].
Development and evaluation of any anomaly detection approach requires both training data(assumed to consist exclusively of intrusion-free network activity) and test data (normal networkactivities interleaved with a number of intrusive sessions). For this investigation, DARPA datafrom Friday of Week#1 comprise the training data set and DARPA data from Monday ofWeek#4 comprise the test data set.
The training (test) data set consists of 141 (199) sessions, each of which is comprised of asequence of system level calls (events) that are recorded by the auditing system. For both thetraining and test data sets, the number of system level calls per session is typically in the rangefrom one to several thousand. The 44-byte feature vector that was generated provides a 2-byterepresentation of the event type. The high-order byte of this pair is nearly always set to zero.Thus, the low-order byte gives a good (nearly unique) representation of the event type and isused in the analysis that follows. For example, a relatively common event type, represented bythe mnemonic AUE:IOCTL, is associated with event ID number 158. Figure 21 displays thelogarithm of the fraction of events of each type within the training set. Note that there are only55 event types represented within the training set. Figure 22 indicates how the fraction of events

47
within each event type varies across sessions. For example, the fraction of events associatedwith event ID number 133 within a session varied from 0.00038 to 0.075.
The premise underlying the work by Ye et al. [YELC01] is that the local occurrence frequenciesof the various event types may provide an indication that a specific session is anomalous andtherefore potentially intrusive. For example, a large number of rare events occurring in arelatively short sequence of events would by definition be anomalous. Specifically, Ye et al.create a multivariate observation vector for the tth event in the event stream:
� � 0 and 1 where,0for ),,( 0,1,,,284,2,1 ��������� itiititttt OOOtOOO ����O , and where
�i is an indicator function that takes the value 1 if event type i is present in the currentobservation, and 0 if event type i is not present. Ye et al. recommend that the smoothingparameter, �, be set to 0.3. So, each event type indexed by i has its own exponentially weightedmoving average (EWMA) process denoted by Oi,t. Evidently, as described by Ye et al., the eventstream is ordered by time and includes events in concurrent time-interleaved sessions.
The high-dimensional observation vector Ot is mapped to a one-dimensional space by computingthe chi-squared distance from the current observation to the mean of the observations in the
training data set. That is, � �
��
�
�
k
i i
iti
O
OO
1
2,2
t� , where iO is the proportion of all events within
the training set that are of the ith type. An alert is generated when 2t� exceeds a prescribed
threshold. A problem with this metric is the singularity when 0�iO . There are numerous waysto resolve this problem. For example, one could simply eliminate (from the summation) thoseevent types that do not appear in the training set. However, this would eliminate the sensitivityof this metric (when applied prospectively to future data) to those rare event types that are notrepresented in the training set. Another approach would be to add a small amount to iO (say,
��= 10-6), such that � �
��
�
��
�
k
i i
iti
O
OO
1
2,
)()(
�
�2t� .
A more fundamental problem with this approach is that the event stream is not localized to asession. The effective signal from activities associated with an intrusive session could bedampened by events from concurrent nonintrusive sessions. A more sensitive variation of thisapproach would be to establish separate EWMA processes and chi-squared metrics for eachsession.
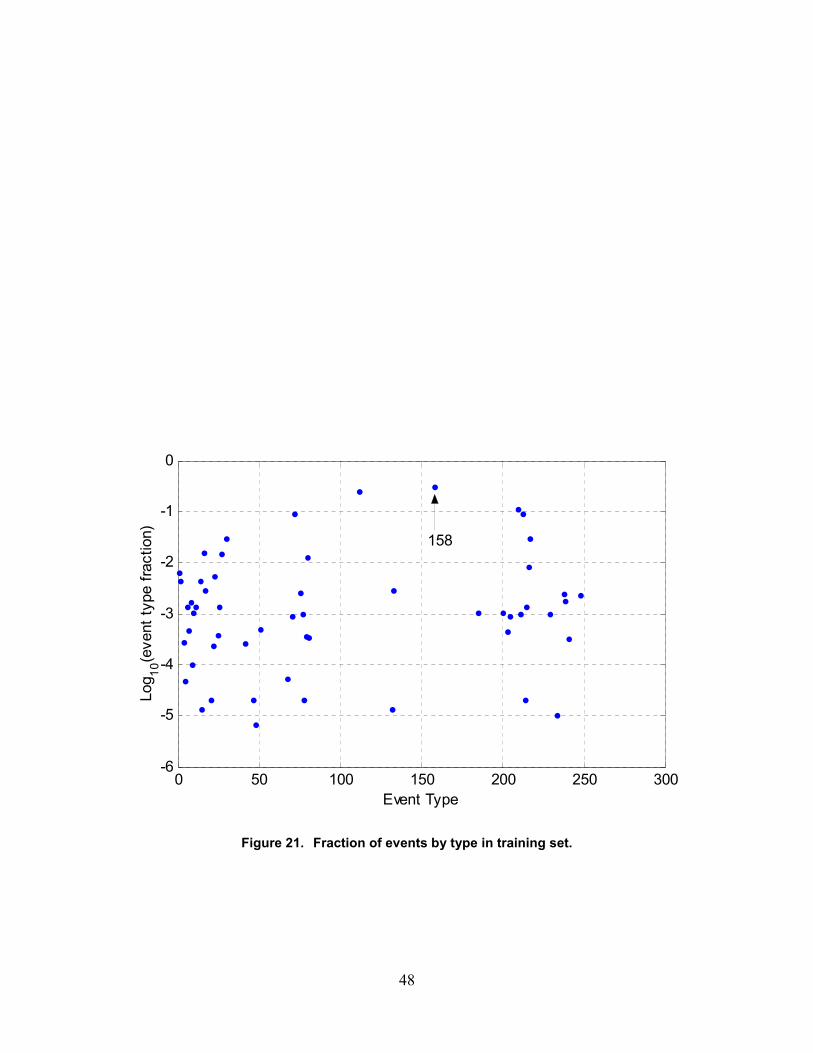
48
0 50 100 150 200 250 300-6
-5
-4
-3
-2
-1
0
Log 10
(eve
nt ty
pe fr
actio
n)
Event Type
158
Figure 21. Fraction of events by type in training set.
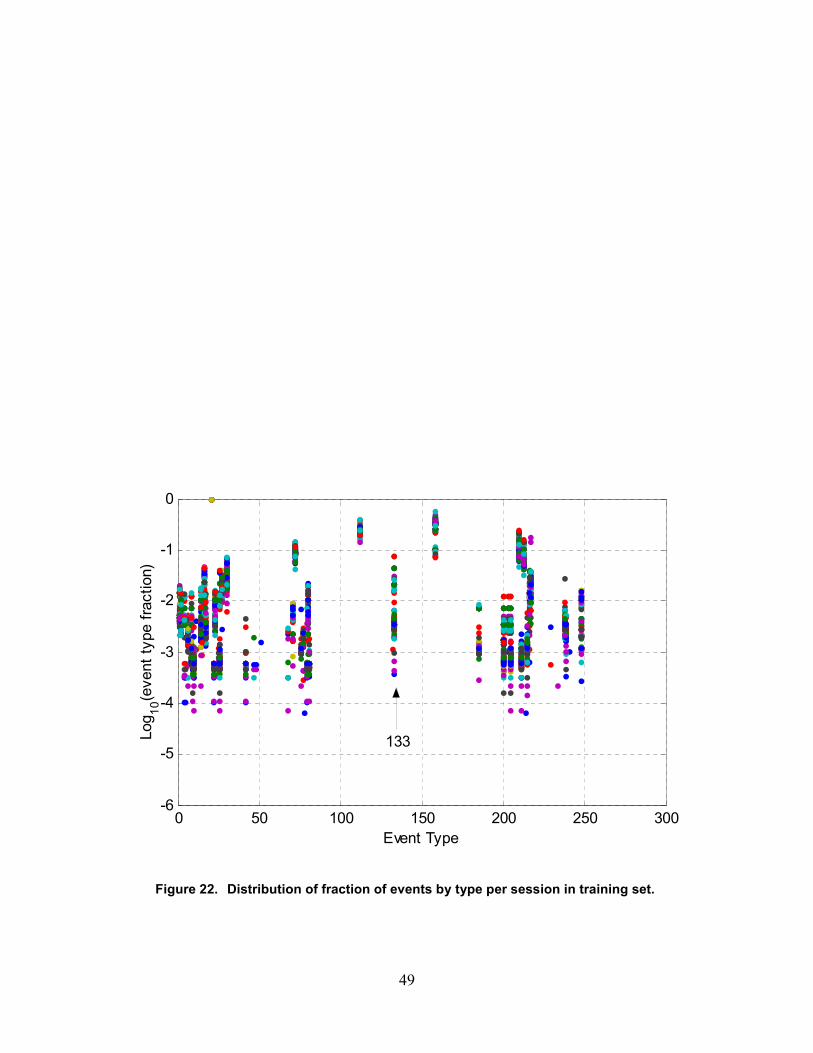
49
0 50 100 150 200 250 300-6
-5
-4
-3
-2
-1
0
Log 10
(eve
nt ty
pe fr
actio
n)
Event Type
133
Figure 22. Distribution of fraction of events by type per session in training set.

50
4.4.1. Proposed Anomaly Detection Method
The method proposed here develops a single EWMA process for each session. Let Et be theevent type of the tth event within a session. Let � �6
10 10log �
���tEt OX , where
tEO is the
proportion of all events within the training set that are of the Etth type. The EWMA process is
defined as � � 11�
����� ttt YXY �� , where 10 and 00 ��� �Y . For purposes of illustration, wewill set 3.�� . Smaller values for � will increase the memory of the system while larger valuesfor � will decrease the memory of the EWMA process. An alert is generated (signifying anabnormal session) when Yt exceeds some threshold that is developed based on the training set.
The DARPA data is used to illustrate the method. Figure 23 displays the maximum value of theEWMA process obtained during each session within the training set. Figure 24 displays ahistogram of the distribution of these values. Assuming the training set sessions arerepresentative of future nonintrusive network activity, the distribution of values in Figure 24 canbe used to set a threshold for generating an alert. Here, depending on limitations of false alarms,one might want to set a threshold at somewhere in the neighborhood of 3.5 to 4 (for purposes ofanalyzing the test set, a threshold was set at 4). Figure 25 displays the maximum values of theEWMA for each session within the test set. Given a threshold at 4, we find two sessions thatgenerate an alert (sessions 13 and 187). Figures 26 and 27 display the EWMA processes foreach of these sessions. In the case of Session 13, there are a number of rare events that takeplace close in time in the vicinity of events 1000–1020. These relatively rare events have eventidentification numbers 48 (AUE_RMDIR), 4 (AUE_CREAT), and 202 (AUE_UTIME). In thecase of Session 187, there are a number of consecutive instances of the rare event ID 15(AUE_KILL) in the vicinity of events 1090–1120.
Examination of known attacks reported by DARPA [HLFZTB01, p. 54, tables 6 and 7] confirmsthat Session 13 is a detection of Attack ID no. 41.084031. It is also interesting to considersessions 104–108, which are known to be part of a multisession attack sequence. Each of thesesessions consists of a single event with event ID 21. In this case, the full 2-byte representation ofthe event IDs is 6165 (AUE_ftpd:ftp access:lo). Event ID 21 occurred six times in 303,289 totalevents within the training set, giving a probability of occurrence of �
tEO 1.98x10⁻⁵. Each of
these six events within the training set corresponded to a full 2-byte representation of the eventID of 6165. Thus, the single-byte specification was sufficient in this case. The value for theEWMA in these cases is � � 405.110log3. 6
10 ������
tEO .
As is clear in Figure 24, based on its relatively low value, this value for the EWMA is notindicative of unusual activity. Assuming these sessions involve the same user, a modification ofthe proposed strategy is suggested, i.e., develop the EWMA over successive sessions involvingthe same user. In this case, such a strategy applied to sessions 104–108 would result in a valuefor the EWMA of –3.90 at the fifth session. Such a value would be considered at leastmarginally significant.
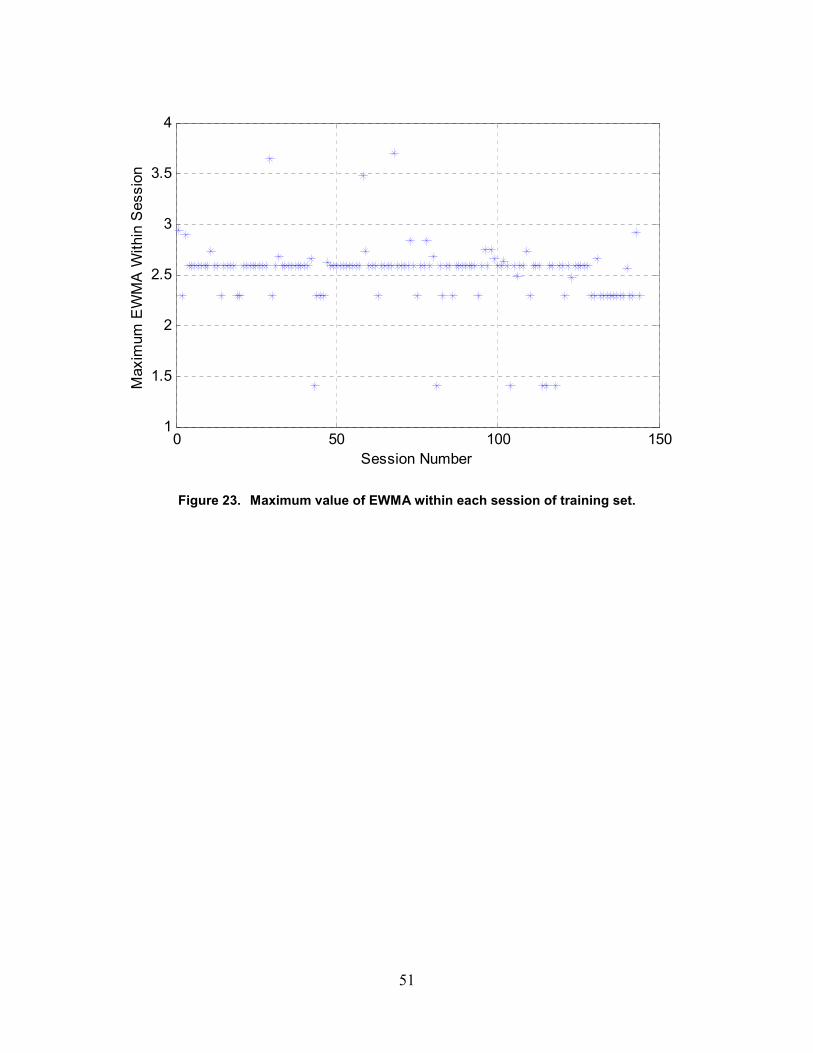
51
0 50 100 1501
1.5
2
2.5
3
3.5
4
Session Number
Max
imum
EW
MA
With
in S
essi
on
Figure 23. Maximum value of EWMA within each session of training set.
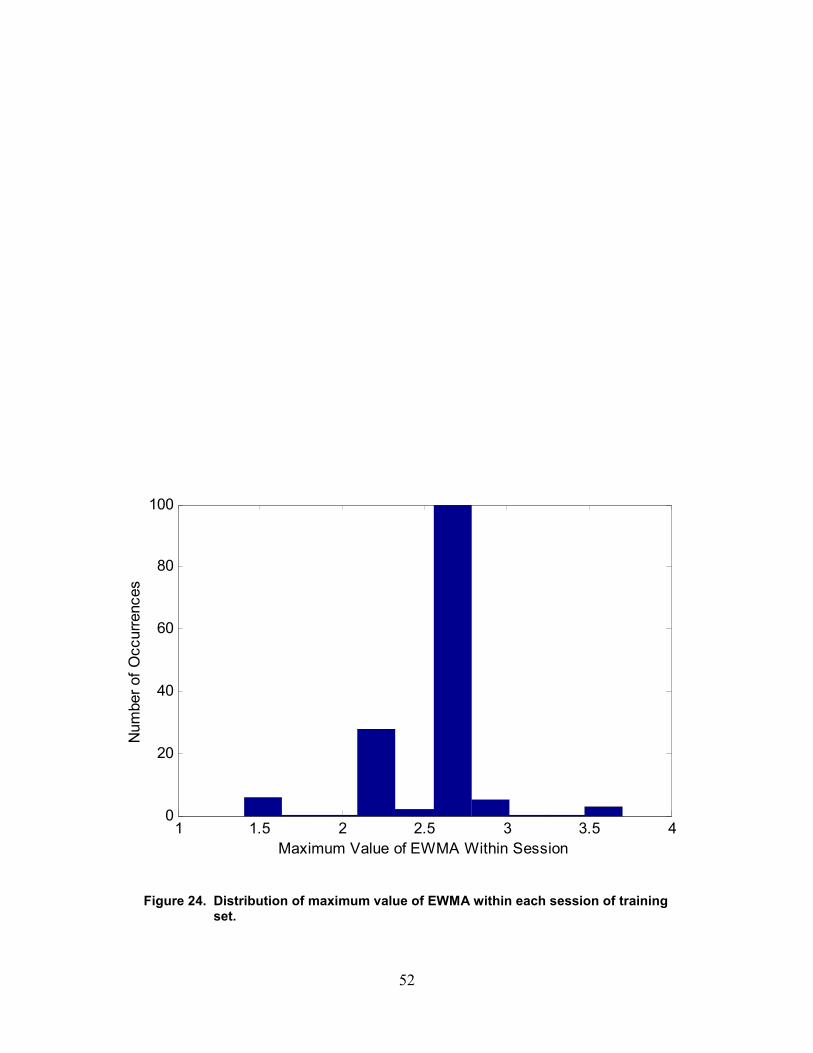
52
1 1.5 2 2.5 3 3.5 40
20
40
60
80
100
Num
ber o
f Occ
urre
nces
Maximum Value of EWMA Within Session
Figure 24. Distribution of maximum value of EWMA within each session of trainingset.
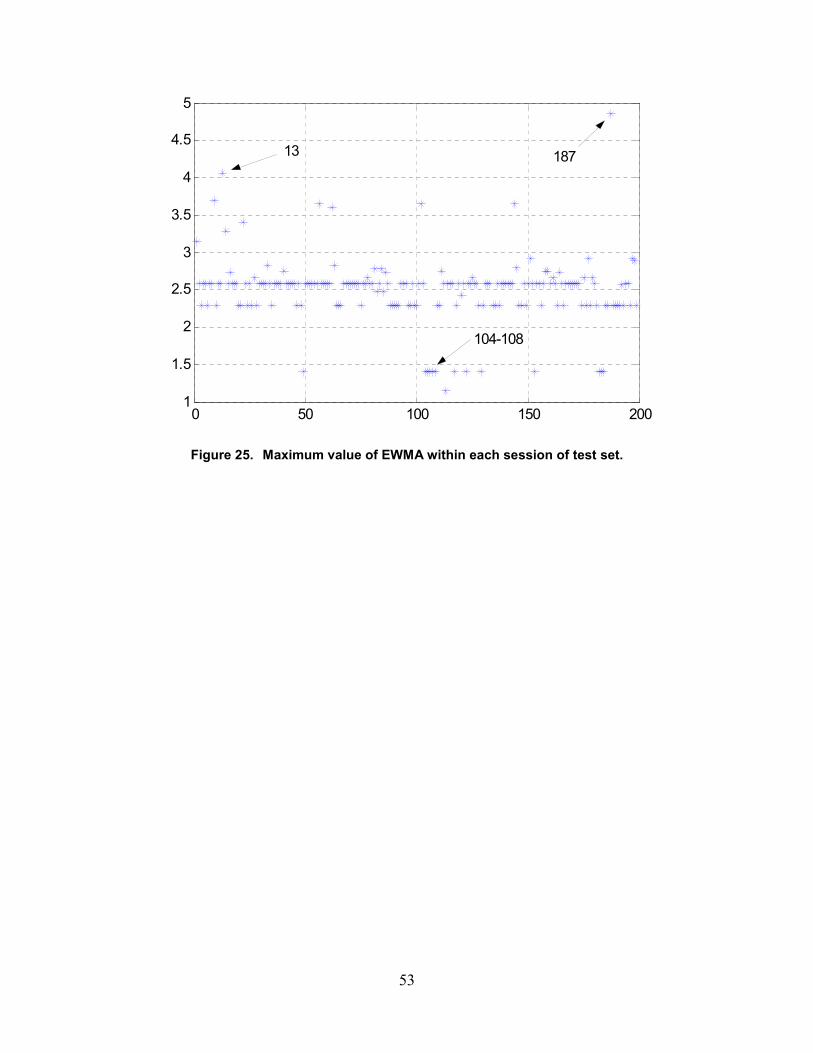
53
0 50 100 150 2001
1.5
2
2.5
3
3.5
4
4.5
5
13 187
104-108
Figure 25. Maximum value of EWMA within each session of test set.
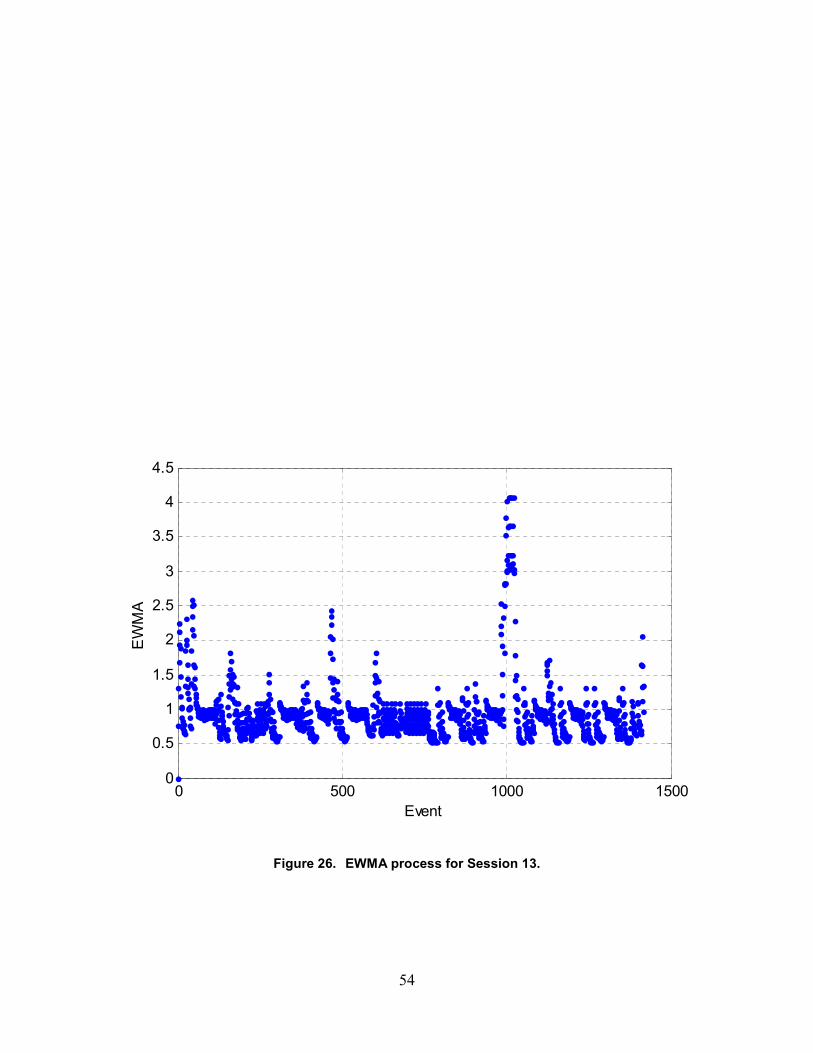
54
0 500 1000 15000
0.5
1
1.5
2
2.5
3
3.5
4
4.5
Event
EW
MA
Figure 26. EWMA process for Session 13.
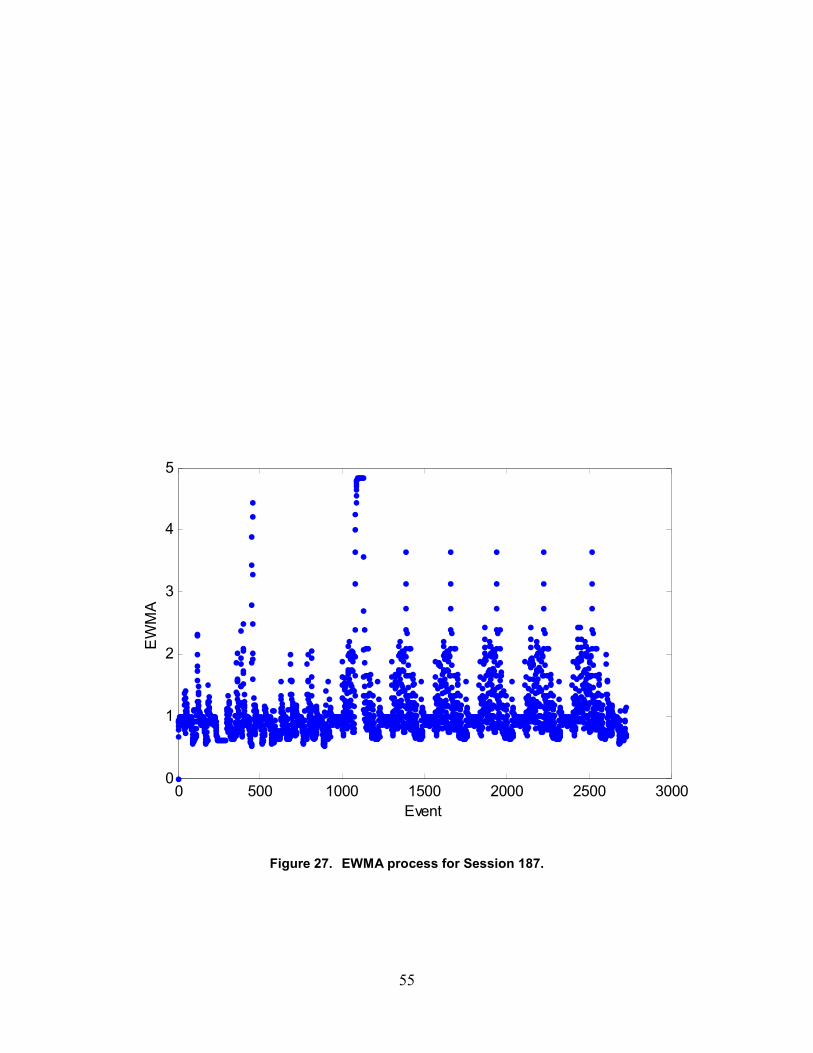
55
0 500 1000 1500 2000 2500 30000
1
2
3
4
5
Event
EW
MA
Figure 27. EWMA process for Session 187.

56
4.4.2. Modifications to Proposed Anomaly Detection Method
Admittedly, the proposed detection method could be developed further. An alert is generatedonly when there is a relatively high concentration of rare events in a local window such that theEWMA exceeds a certain threshold. The window size (and hence sensitivity to the currentevent) could be adjusted by varying �. What is an appropriate value for � in this context remainsto be seen. One also could develop more objective rules for constructing an appropriatethreshold based on target false alarm rates. One might also consider other rules for generating analert, e.g., if the EWMA remains above a certain threshold (different than the threshold above)for a certain number of events.
In a broader sense, one could use Xt in conjunction with some type of control-charting techniqueother than the EWMA. Examples of other techniques include the cumulative sum and movingaverage techniques, as reported by Wetherill and Brown [WB91]. It is not clear whatadvantages, if any, each technique might offer over others in this context.
The proposed method is sensitive to a high local density of rare events. The sequence ofprobabilities of individual events is used to generate an alert. It may be, however, that theprobability of a sequence of events is more informative. For example, Event ID V closelyfollowed by Event ID W may be a strong indicator of intrusive activity. However, theimplementation of a strategy that provides an alert based on the probability of a sequence ofevents may be problematic due to difficulties associated with enumerating possible sequences ofevents.
4.4.3. Conclusions Regarding Anomaly Detection Strategies
The method described here outlines an empirical approach for anomaly detection that does notdepend on knowledge of subject matter. It is clear that the method would be vulnerable to acoordinated attack over multiple sessions. Even in its domain of applicability, the efficacy of theapproach is unknown. Clearly, as is generally the case for anomaly detection methods, theefficacy of the approach will improve as the training set is enlarged to span a wider variety ofnormal nonintrusive activities.
5. Conclusions
Intrusion detection is a need and a problem that is not going to go away soon. The challenge ofdetecting novel exploits and attacks deserves special attention. The preliminary results presentedin this report confirm the ability of neural networks and statistical anomaly detectors to learn thedifferences between clean and exploit data.
To our knowledge, ACDs have not been used for intrusion detection until now. Preliminaryresults suggest that this approach to ID deserves more attention. Although our research barelyscraped the surface of the potential of adaptive critic designs, it yielded promising initial results.

57
The foremost lesson learned from this research is that much work will be required in order toachieve effective detection of novel exploits. The second most important lesson learned fromthis research is that IDS control is probably not truly useful. Although the concept of IDScontrol is promising, practically speaking, a better course of action appears to be to incorporatethe most effective mechanisms into the IDS.
The third and final lesson learned from this research is that with current ID sensors, considerableeffort must be devoted to data preprocessing before presentation to a neural network. Even moreimportantly, the availability of new sensors designed from the ground up for automated IDwould dramatically improve the possibility of detecting intrusions.
In addition to ID sensor research and development, other avenues for further research activitieshave been identified. They include
� Performing extensive signature-generalization data collection
The creation of rich data sets that represent classes of exploits will allow generalizedsignature-based ID to discriminate between different kinds of exploits, including failedexploit attempts. This idea should be expanded to other ID sensors besides BSM.
� Realizing the full potential of ACDs for intrusion detection
Even though the Elman recurrent neural network produced comparable if not superiorresults to the ACD-based IDS, it is expected that the situation will reverse as the Elmanneural networks are tested on more challenging problems. The following aspects ofACDs for intrusion detection warrants further research.
� Taking full advantage of reinforcement learning
The use of reinforcement learning techniques in ACDs offers great promise in the IDenvironment. The ability to learn about the existence of an exploit even when its preciselocation is unknown is significant.
� Developing cost-oriented decision-making
When put into practice, many costs are associated with ID (see Section 1.1). An IDS thatcan make decisions based on a cost policy established for a particular site would offer agreat benefit. ACDs have the potential to do just that.
� Continuing anomaly detection research
The statistical anomaly detection work presented in Section 4.4 successfully detectedexploits in DARPA’s ID evaluation data, yet many potential improvements are available.Anomaly detectors will continue to be valuable in detecting novel exploits.
58
6. References
[B00] R.G. Bace, 2000, Intrusion Detection, p. 3. Macmillan Technical Publishing,Indianapolis, IN.
[C00] J. Cannady, 2000, “Applying CMAC-based online learning to intrusiondetection.” International Joint Conference on Neural Networks, 2000 (IJCNN2000), S.I. Amari, C.L. Giles, M. Gori, V. Piuri, ed., vol. 5, pp. 405–410.
[C98] J. Cannady, 1998, “Artificial neural networks for misuse detection.”Proceedings of the 1998 National Information Systems Security Conference(NISSC ’98), pp. 443–456, Arlington, VA.
[E98] D. Endler, 1998, “Intrusion detection. Applying machine learning to Solarisaudit data.” Proceedings of 14th Annual Computer Security ApplicationsConference, pp. 268-279.
[GS99] A.K. Ghosh and A. Schwartzbard, 1999, “A study in using neural networksfor anomaly and misuse detection.” Proceedings of the 8th USENIX SecuritySymposium, August 1999.
[GSS99] A.K. Ghosh, A. Schwartzbard, and M. Schatz, 1999, “Learning programbehavior profiles for intrusion detection.” Proceedings of the 1st USENIXWorkshop on Intrusion Detection and Network Monitoring, pp. 51–62, SantaClara, CA, April 1999.
[GWC98] A.K. Ghosh, J. Wanken, and F. Charron, 1998, “Detecting anomalous andunknown intrusions against programs.’ Proceedings of the 1998 AnnualComputer Security Applications Conference (ACSAC ’98), December 1998.
[HCDB99] H. Hinton, C. Cowan, L. Delcambre, S. Bowers, 1999, “SAM: SecurityAdaptation Manager.” Proceedings of the 15th Annual Computer SecurityApplications Conference, pp. 361–370, Phoenix, AZ.
[HFS98] S.A. Hofmeyr, S. Forrest, and A. Somayaji, 1998, “Intrusion detection usingsequences of system calls.” Journal of Computer Security, vol. 6, pp. 151–180.
[HHS00] A.J. Hoglund, K. Hatonen, A.S. Sorvari, 2000, “A computer host-based useranomaly detection system using the self-organizing map.” Proceedings of theIEEE-INNS-ENNS International Joint Conference on Neural Networks, 2000,S.I. Amari, C.L. Giles, M. Gori, V. Piuri, ed., vol. 5, pp. 411–416.
[HLFZTB01] J.W. Haines, R.P. Lippmann, D.J. Fried, M.A. Zissman, E. Tran, and S.B.Boswell, 2001, 1999 Intrusion Detection Evaluation: Design and Procedures.ESC-TR-99-061, Technical Report 1062, Lincoln Laboratory. MassachusettsInstitute of Technology, Cambridge, MA.
[K99] K. Kendall, 1999, A Database of Computer Attacks for the Evaluation ofIntrusion Detection Systems. Massachusetts Institute of Technology,Cambridge, MA (master’s thesis).

59
[L00] R.P. Lippmann, D.J. Fried, I. Graf, J.W. Haines, K.R. Kendall, D. McClung,D. Weber, S.E. Webster, D. Wyschogrod, R.K. Cunningham, and M.A.Zissman, 2000, “Evaluating Intrusion Detection Systems: The 1998 DARPAOff-Line Intrusion Detection Evaluation.” Proceedings of the 2000 DARPAInformation Survivability Conference and Exposition (DISCEX), vol. 2, HiltonHead, SC, January 2000. IEEE Computer Society Press, Los Alamitos, CA.
[NSD99] N. Nuansri, S. Singh, and T. Dillon, 1999, “A process state-transition analysisand its application to intrusion detection.” Proceedings of the 15th AnnualComputer Security Applications Conference, pp. 378-387, Phoenix, AZ.
[PW97] D. Prokhorov and D. Wunsch, 1997, “Adaptive Critic Designs.” IEEETransactions on Neural Networks 8, pp. 997–1007.
[RLM98] J. Ryan, M.J. Lin, R. Miikkulainen, 1998, “Intrusion Detection with NeuralNetworks.” Advances in Neural Information Processing Systems 10, M.I.Jordan, M.J. Kearns, S.A. Solla, ed., pp. 943–949. MIT Press, Cambridge,MA.
[S00] Sun Microsystems, 2000, SunSHIELD Basic Security Module Guide. SunMicrosystems, Inc., Palo Alto, CA.
[SF01] S. Forrest, 2001, personal. communication. University of New Mexico,Albuquerque, NM.
[SFLPC00] S. Stolfo, W. Fan, W Lee, A. Prodromidis, and P. Chan, 2000, “Cost-basedModeling for Fraud and Intrusion Detection: Results from the JAM Project.”Proceedings of the 2000 DARPA Information Survivability Conference andExposition (DISCEX), vol. 2, Hilton Head, SC, January 2000. IEEEComputer Society Press, Los Alamitos, CA.
[VEK00] G. Vigna, S. Eckmann, and R. Kemmerer, 2000, “The STAT Tool Suite.”Proceedings of the 2000 DARPA Information Survivability Conference andExposition (DISCEX), vol. 2, Hilton Head, SC, January 2000. IEEEComputer Society Press, Los Alamitos, CA.
[WB91] G.B. Wetherill and D.W. Brown, 1991, Statistical Process Control Theoryand Practice. Chapman and Hall, London, England.
[YELC01] N. Ye, S.M. Emran, X. Li, and Q. Chen, 2001, “Statistical Process Control forComputer Intrusion Detection.” Proceedings of the 2001 DARPA InformationSurvivability Conference and Exposition (DISCEX), vol. 1, Anaheim, CA,June 2001. IEEE Computer Society Press, Los Alamitos, CA.

60
7. Appendix A—Details of the Solaris BSM
A common source of data for IDSs is an audit mechanism for a host computer. SunMicrosystems provides an auditing facility called Basic Security Module (BSM) with its Solarisoperating system. BSM keeps a log of ongoing system activities in audit trail files. The auditfiles contain audit records, which contain information about one audit event (a system call).Possible events are defined in /etc/security/audit_event. The structure of an audit record isdescribed by Sun Microsystems [S00]. An audit record usually comprises several audit tokens.
� Each record starts with a header token containing information about the type of event, thetime when the event occurred, and the length of the record in bytes. Usually, a recordalso contains a subject token and a return token.
� The subject token stores identification data: effective and real user IDs, effective and realgroup IDs, process IDs, session IDs, machine and port IDs, and audit user IDs. The samesession ID is assigned to a session at login and to all of its offsprings, allowing theopportunity to divide the audit data into sessions. Similarly, the audit user ID does notchange, and keeps the user ID of the original user who has logged in.
� The return token stores the return value for the system call described by the record, andthe error number, if any.
� Other widely used tokens are arg tokens, exec_args tokens, path tokens, attribute tokens,and process tokens. A text token stores a text string passed in the system call. Whendealing with remote machines (e.g., during a telnet session) in_addr, iport, andsocket_inet tokens are used.
� The arg token contains an argument of the system call. It is a 32-bit value, and anoptional text string of variable length. There are as many argument tokens in a record asare needed by the system call.
� The exec_args token keeps text strings passed as arguments to an exec system call. Eachargument is represented as a variable-length string.
� The path token stores a variable-length text string with a path to a file system object. Ifthere are several paths used in the system call, the record contains several path tokens.
� If a path token contains a valid file system path, the path token is followed by theattribute token. The attribute token contains file system attributes of the object referredto by the path in the path token.
� The process token is similar to the subject token and is used when the system call isdealing with a process (e.g., kill).
� In_addr and iport tokens store numbers that represent an IP address and a port used in thecall. The socket_inet token describes a socket connection to a local port and keeps anaddress of the port and an IP address of remote machine.

61
7.1. BSM StatisticsA brief statistical analysis performed on three BSM audit files is presented in this appendix. Thefollowing files were analyzed:
� 1998 DARPA—The BSM audit file from Tuesday, Week 1 of the 1998 DARPA IDevaluation test data [L00].
� 2000 DARPA—The BSM audit file 20000307142426.20000207173942.mill.bsm fromthe 2000 DARPA ID evaluation data.
� rdist—custom BSM data acquired on a Sun workstation running Solaris 2.5 using aremote file distribution utility exploit.
Table 9 contains the labels and hexadecimal values of all of the tokens present in the analyzedaudit files.
Table 9. Labels and hexadecimal identifiers for BSM tokens.
Token Identifier Token Label
11 hex Audit File
13 hex Trailer
14 hex Header
23 hex Path
24 hex Subject
26 hex Process
27 hex Return
28 hex Text
2a hex Internet Address
2c hex TCP/UDP Port Address
2d hex System Call Arguments
2e hex Socket
31 hex Attribute
3c hex Exec System Call Arguments
3e hex Attribute 32
72 hex Return 64

62
Table 10 contains the token frequencies in each of the analyzed files. Note that the number ofaudit records in the file can be measured with the number of header tokens (14 hex) plus thenumber of audit file tokens (11 hex).
Table 10. Token frequencies in the analyzed audit files. Token DARPA 1998 DARPA 2000 rdistIdentifier Token Count Token Count Token Count---------- ----------- ----------- ----------- 11 hex 2 2 2 13 hex 2114291 104907 14 hex 2114291 104907 418 23 hex 1666366 57355 372 24 hex 2114291 104907 418 26 hex 229739 711 1 27 hex 2114291 104791 418 28 hex 579 30 2a hex 307 2c hex 307 2d hex 1669290 183663 759 2e hex 540 68723 31 hex 1599489 368 3c hex 15797 551 3e hex 54285 72 hex 116

63
Tables 11, 12, and 13 list the frequency of token patterns contained in all the records for each ofthe corresponding audit files. For example, 16,648 records in the 1998 DARPA data [L00] wererepresented by the series or pattern of tokens 23 3E 2D 2D 24 27 13. The variability in thecontent and length of audit records within a file is obvious from these tables.
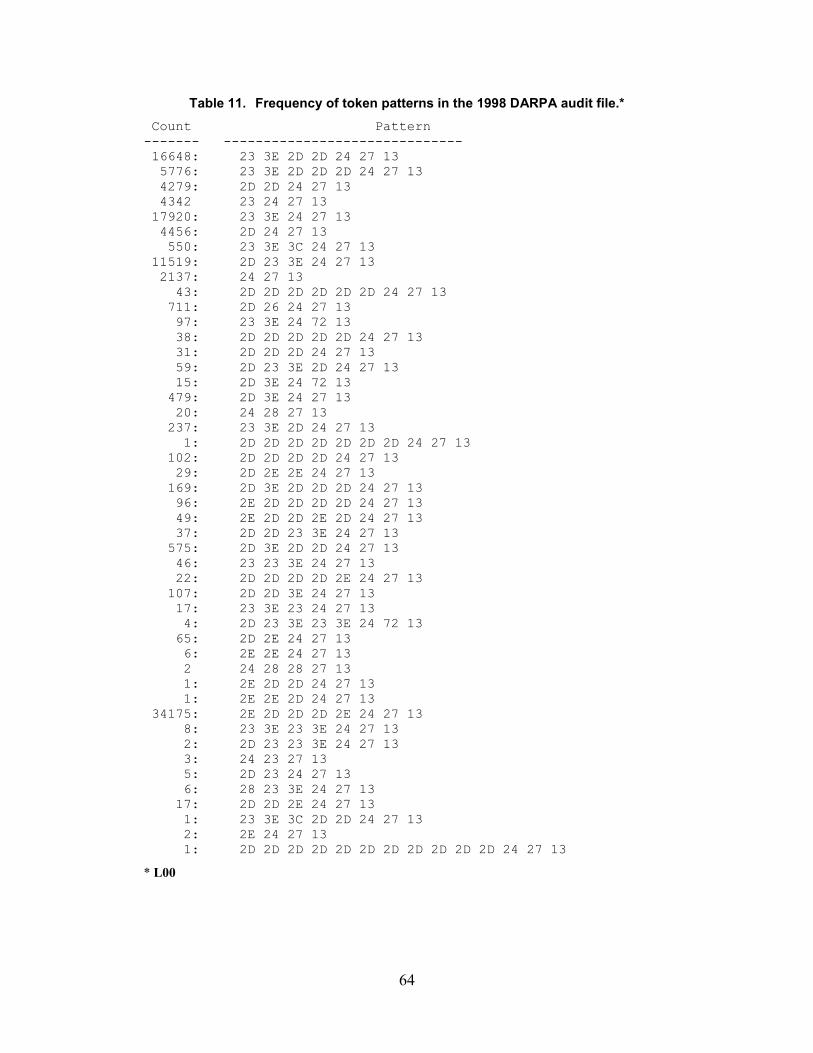
64
Table 11. Frequency of token patterns in the 1998 DARPA audit file.* Count Pattern------- ------------------------------ 16648: 23 3E 2D 2D 24 27 13 5776: 23 3E 2D 2D 2D 24 27 13 4279: 2D 2D 24 27 13 4342 23 24 27 13 17920: 23 3E 24 27 13 4456: 2D 24 27 13 550: 23 3E 3C 24 27 13 11519: 2D 23 3E 24 27 13 2137: 24 27 13 43: 2D 2D 2D 2D 2D 2D 24 27 13 711: 2D 26 24 27 13 97: 23 3E 24 72 13 38: 2D 2D 2D 2D 2D 24 27 13 31: 2D 2D 2D 24 27 13 59: 2D 23 3E 2D 24 27 13 15: 2D 3E 24 72 13 479: 2D 3E 24 27 13 20: 24 28 27 13 237: 23 3E 2D 24 27 13 1: 2D 2D 2D 2D 2D 2D 2D 24 27 13 102: 2D 2D 2D 2D 24 27 13 29: 2D 2E 2E 24 27 13 169: 2D 3E 2D 2D 2D 24 27 13 96: 2E 2D 2D 2D 2D 24 27 13 49: 2E 2D 2D 2E 2D 24 27 13 37: 2D 2D 23 3E 24 27 13 575: 2D 3E 2D 2D 24 27 13 46: 23 23 3E 24 27 13 22: 2D 2D 2D 2D 2E 24 27 13 107: 2D 2D 3E 24 27 13 17: 23 3E 23 24 27 13 4: 2D 23 3E 23 3E 24 72 13 65: 2D 2E 24 27 13 6: 2E 2E 24 27 13 2 24 28 28 27 13 1: 2E 2D 2D 24 27 13 1: 2E 2E 2D 24 27 13 34175: 2E 2D 2D 2D 2E 24 27 13 8: 23 3E 23 3E 24 27 13 2: 2D 23 23 3E 24 27 13 3: 24 23 27 13 5: 2D 23 24 27 13 6: 28 23 3E 24 27 13 17: 2D 2D 2E 24 27 13 1: 23 3E 3C 2D 2D 24 27 13 2: 2E 24 27 13 1: 2D 2D 2D 2D 2D 2D 2D 2D 2D 2D 2D 24 27 13
* L00

65
Table 12. Frequency of token patterns in the 2000 DARPA audit file. Count Pattern------- ------------------------------------------------- 30320: 24 27 13 79436: 23 31 2D 2D 2D 24 27 13 72121: 2D 24 27 13 513591: 2D 23 31 24 27 13 796996: 23 31 24 27 13 15797: 23 31 3C 24 27 13 65916: 23 24 27 13 112487: 2D 2D 24 27 13 175964: 23 31 2D 2D 24 27 13 8996: 23 31 2D 24 27 13 307: 24 28 2A 2C 27 13 591: 2D 2D 23 31 24 27 13 720: 2D 2D 2D 2D 2D 2D 24 27 13 272: 24 28 27 13 1505: 2D 2D 2D 24 27 13 1155: 2D 2D 2D 2D 24 27 13 6079: 2D 23 31 2D 24 27 13 519: 23 31 23 24 27 13 540: 2D 2D 2E 24 27 13 581: 23 31 23 31 24 27 13 206: 2D 2D 2D 2D 2D 24 27 13 60: 2D 2D 2D 2D 2D 2D 2D 2D 2D 2D 2D 2D 24 27 13 349: 23 23 31 24 27 13 37: 23 23 24 27 13 4: 2D 23 24 27 13 1: 23 31 2D 23 23 31 23 23 31 24 27 13 1: 23 31 23 23 31 23 23 31 23 23 23 23 23 31 23 23
23 23 23 31 23 23 23 24 27 13 229739: 2D 26 24 27 13
Table 13. Frequency of token patterns in the rdist audit file. Count Pattern------- ------------------- 10 2D 23 31 24 27 15 23 31 24 27 343 23 31 2D 2D 24 27 1 2D 26 24 27 30 2D 24 27 4 24 27 5 2D 2D 2D 2D 24 27 6 2D 2D 24 27 3 23 24 27

66
DISTRIBUTION:
5 Dr. Donald WunschUniversity of Missouri-RollaDepartment of Electrical & Computer Engineering131 Emerson Electric Co. Hall131 Miner CircleRolla, MO 65409-0040
1 MS0428 D. D. Carlson, 12300
1 MS0785 D. P. Duggan, 6516
5 MS0785 T. J. Draelos, 6514
1 MS0785 M. J. Collins, 6514
1 MS0784 R. C. Parks, 6512
1 MS0785 M. E. Senglaub, 6516
1 MS0785 D. L. Harris, 6516
1 MS0784 R. E. Trellue, 6501
1 MS0451 S. G. Varnado, 6200
1 MS0829 J. M. Sjulin, 12323
1 MS0829 E. V. Thomas, 12323
1 MS0806 T. D. Tarman, 9336
1 MS0806 L. G. Pierson, 9336
1 MS0806 E. L. Witzke, 9336
1 MS0813 R. A. Suppona, 9327
1 MS0785 R. L. Hutchinson, 6516
1 MS0455 L. R. Phillips, 6517
1 MS0455 S. Y. Goldsmith, 6517
1 MS0455 R. S. Tamashiro, 6517
1 MS0784 M. J. Skroch, 6512
1 MS0801 M. R. Sjulin, 9330
1 MS 0188 LDRD Program Office, 1030 (attn: Donna Chavez)
2 MS 0899 Technical Library, 9616
1 MS 0612 Review & Approval Desk, 9612for DOE/OSTI
1 MS 9018 Central Technical Files, 8945-1