Experiments for First Year Electrical Engg Lab 2015-16rknec.edu/FirstYearContents/2015-16/First set...
27
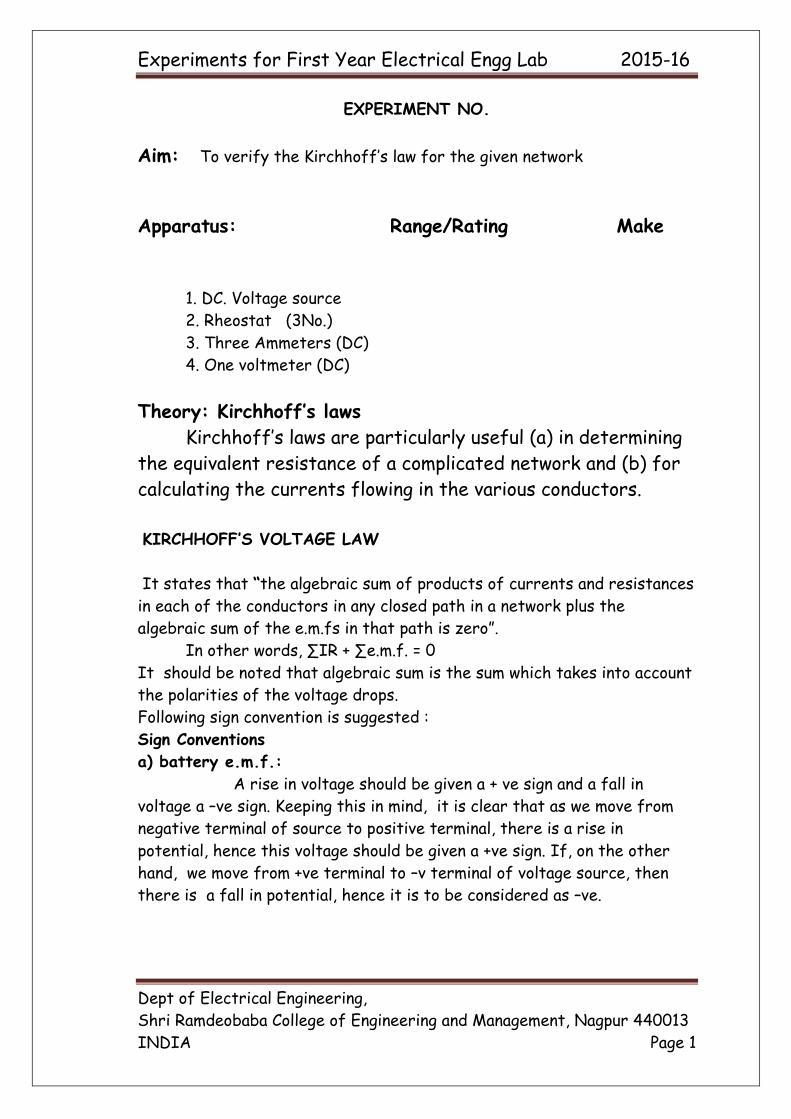
Experiments for First Year Electrical Engg Lab 2015-16 Dept of Electrical Engineering, Shri Ramdeobaba College of Engineering and Management, Nagpur 440013 INDIA Page 1 EXPERIMENT NO. Aim: To verify the Kirchhoff’s law for the given network Apparatus: Range/Rating Make 1. DC. Voltage source 2. Rheostat (3No.) 3. Three Ammeters (DC) 4. One voltmeter (DC) Theory: Kirchhoff’s laws Kirchhoff’s laws are particularly useful (a) in determining the equivalent resistance of a complicated network and (b) for calculating the currents flowing in the various conductors. KIRCHHOFF’S VOLTAGE LAW It states that “the algebraic sum of products of currents and resistances in each of the conductors in any closed path in a network plus the algebraic sum of the e.m.fs in that path is zero”. In other words, ∑IR + ∑e.m.f. = 0 It should be noted that algebraic sum is the sum which takes into account the polarities of the voltage drops. Following sign convention is suggested : Sign Conventions a) battery e.m.f.: A rise in voltage should be given a + ve sign and a fall in voltage a –ve sign. Keeping this in mind, it is clear that as we move from negative terminal of source to positive terminal, there is a rise in potential, hence this voltage should be given a +ve sign. If, on the other hand, we move from +ve terminal to –v terminal of voltage source, then there is a fall in potential, hence it is to be considered as –ve.
Transcript of Experiments for First Year Electrical Engg Lab 2015-16rknec.edu/FirstYearContents/2015-16/First set...
Experiments for First Year Electrical Engg Lab 2015-16
Dept of Electrical Engineering,
Shri Ramdeobaba College of Engineering and Management, Nagpur 440013
INDIA Page 1
EXPERIMENT NO.
Aim: To verify the Kirchhoff’s law for the given network
Apparatus: Range/Rating Make
1. DC. Voltage source
2. Rheostat (3No.)
3. Three Ammeters (DC)
4. One voltmeter (DC)
Theory: Kirchhoff’s laws
Kirchhoff’s laws are particularly useful (a) in determining
the equivalent resistance of a complicated network and (b) for
calculating the currents flowing in the various conductors.
KIRCHHOFF’S VOLTAGE LAW
It states that “the algebraic sum of products of currents and resistances
in each of the conductors in any closed path in a network plus the
algebraic sum of the e.m.fs in that path is zero”.
In other words, ∑IR + ∑e.m.f. = 0
It should be noted that algebraic sum is the sum which takes into account
the polarities of the voltage drops.
Following sign convention is suggested :
Sign Conventions
a) battery e.m.f.:
A rise in voltage should be given a + ve sign and a fall in
voltage a –ve sign. Keeping this in mind, it is clear that as we move from
negative terminal of source to positive terminal, there is a rise in
potential, hence this voltage should be given a +ve sign. If, on the other
hand, we move from +ve terminal to –v terminal of voltage source, then
there is a fall in potential, hence it is to be considered as –ve.
Experiments for First Year Electrical Engg Lab 2015-16
Dept of Electrical Engineering,
Shri Ramdeobaba College of Engineering and Management, Nagpur 440013
INDIA Page 2
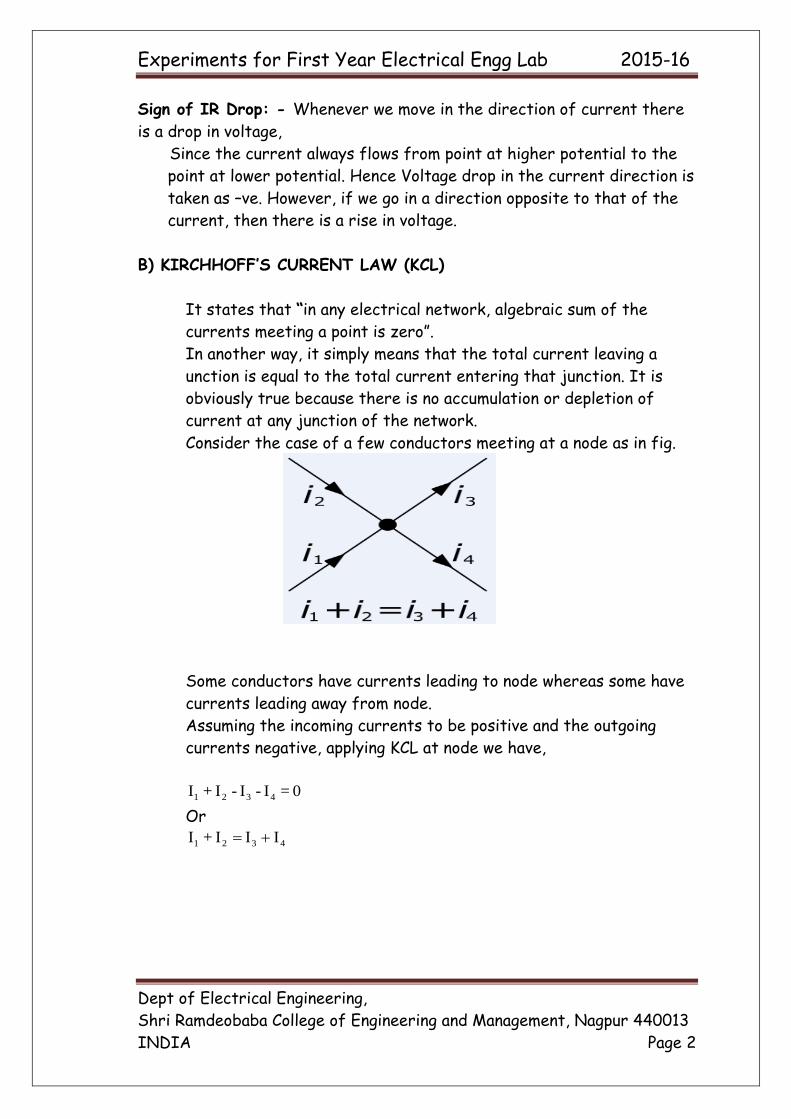
Sign of IR Drop: - Whenever we move in the direction of current there
is a drop in voltage,
Since the current always flows from point at higher potential to the
point at lower potential. Hence Voltage drop in the current direction is
taken as –ve. However, if we go in a direction opposite to that of the
current, then there is a rise in voltage.
B) KIRCHHOFF’S CURRENT LAW (KCL)
It states that “in any electrical network, algebraic sum of the
currents meeting a point is zero”.
In another way, it simply means that the total current leaving a
unction is equal to the total current entering that junction. It is
obviously true because there is no accumulation or depletion of
current at any junction of the network.
Consider the case of a few conductors meeting at a node as in fig.
Some conductors have currents leading to node whereas some have
currents leading away from node.
Assuming the incoming currents to be positive and the outgoing
currents negative, applying KCL at node we have,
0 = I - I -I+I 4321
Or I I I+I 4321
Experiments for First Year Electrical Engg Lab 2015-16
Dept of Electrical Engineering,
Shri Ramdeobaba College of Engineering and Management, Nagpur 440013
INDIA Page 3
Procedure: i. Connect the circuit as per circuit diag.
ii. Keep all the rheostats at maximum position
iii. Switch on the DC voltage supply, Adjust the voltage to any
suitable value
iv. Change the position of rheostats check that none of the
ammeter reads excessive
current.
v. Take the reading of all the ammeters.
vi. Measure the voltages across all the rheostats.
vii. Changed the voltage of power supply and repeat step (v) and (v1).
viii. Verify Kirchhoff’s laws.
Result & Conclusion:
Discussion: 1. What are the sources of errors?
2. Can you apply Kirchhoff’s laws to a.c. circuit? If yes how the law
will differ for a.c.
circuits?
3. What do you mean by node and a mesh?
4. The circuit consists of a voltage source & the R-L-C combination
in series with it. Draw the circuit and apply KVL to the loop formed.
5. While performing the experiment how will you note the direction
of the circuit?
Experiments for First Year Electrical Engg Lab 2015-16
Dept of Electrical Engineering,
Shri Ramdeobaba College of Engineering and Management, Nagpur 440013
INDIA Page 4
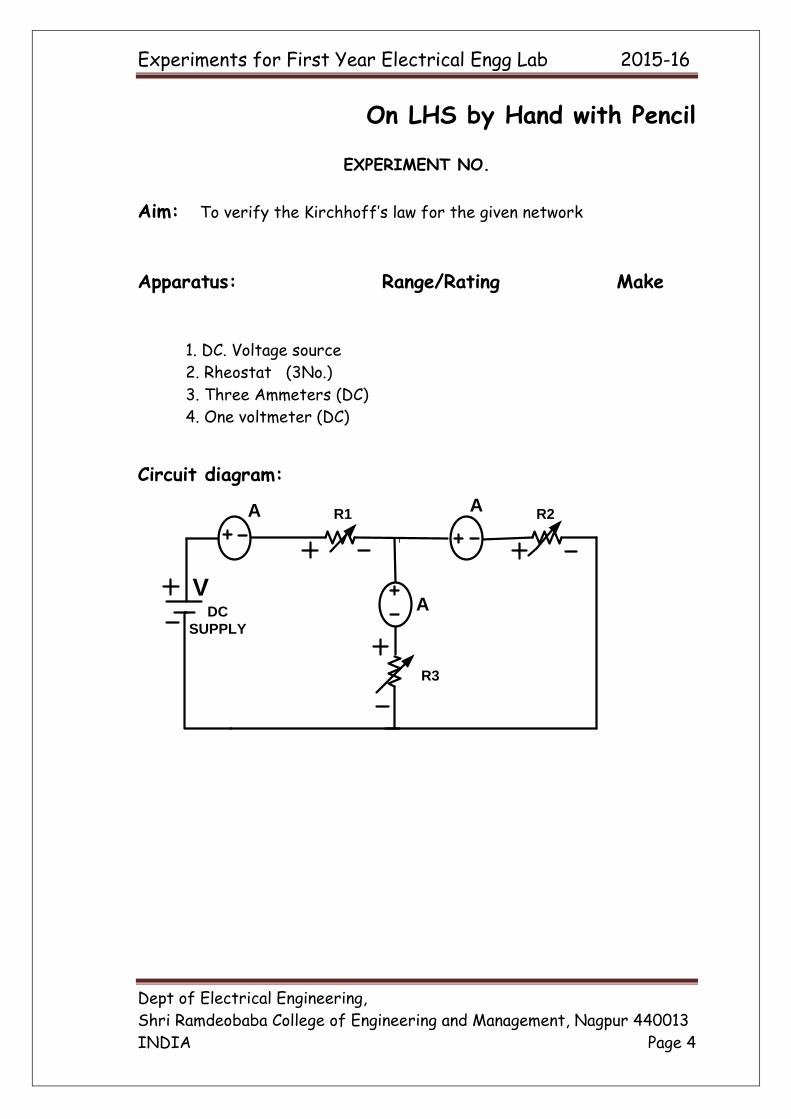
On LHS by Hand with Pencil
EXPERIMENT NO.
Aim: To verify the Kirchhoff’s law for the given network
Apparatus: Range/Rating Make
1. DC. Voltage source
2. Rheostat (3No.)
3. Three Ammeters (DC)
4. One voltmeter (DC)
Circuit diagram:
A A
A
R1 R2
R3
VDC
SUPPLY
Experiments for First Year Electrical Engg Lab 2015-16
Dept of Electrical Engineering,
Shri Ramdeobaba College of Engineering and Management, Nagpur 440013
INDIA Page 5
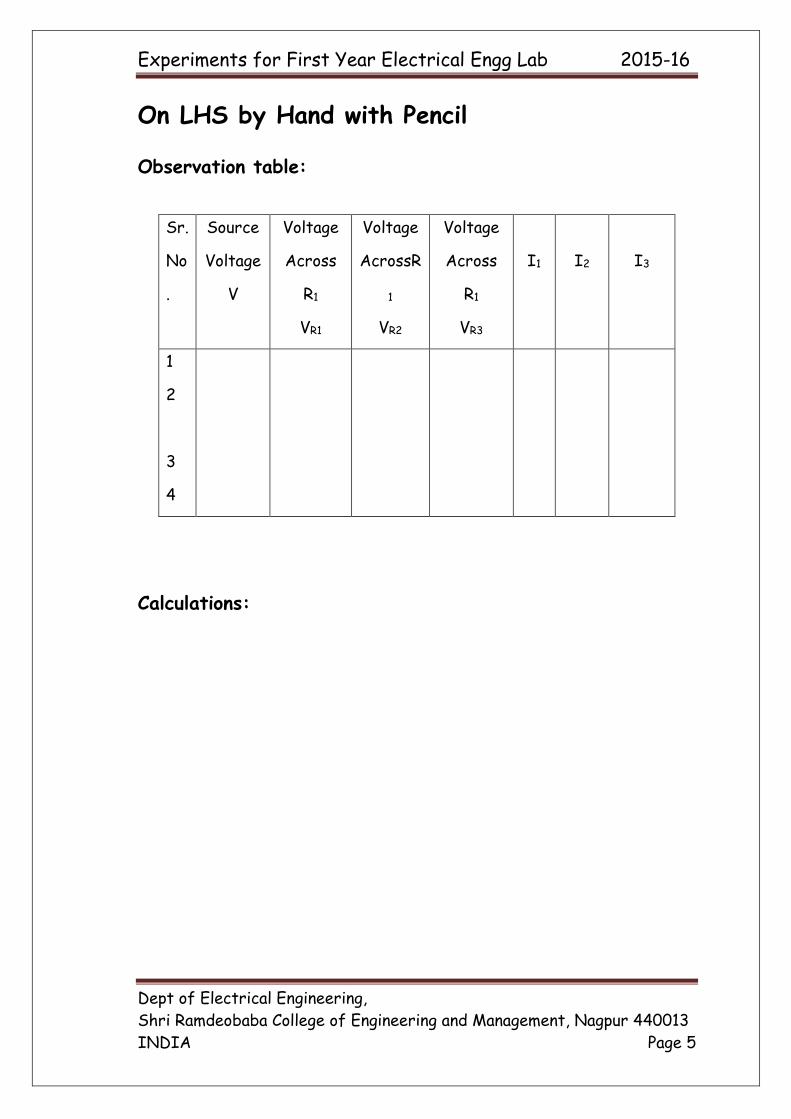
On LHS by Hand with Pencil
Observation table:
Calculations:
Sr.
No
.
Source
Voltage
V
Voltage
Across
R1
VR1
Voltage
AcrossR
1
VR2
Voltage
Across
R1
VR3
I1
I2
I3
1
2
3
4
Experiments for First Year Electrical Engg Lab 2015-16
Dept of Electrical Engineering,
Shri Ramdeobaba College of Engineering and Management, Nagpur 440013
INDIA Page 6
EXPERIMENT NO
Aim: To study RLC series circuit.
.
Apparatus: Range/Rating Make 1. Single phase dimmer- stat
2. Ammeter (AC)
3. Voltmeter (AC)
4. Rheostat
5. Inductor
6. Capacitor
7. Multi Function Meter
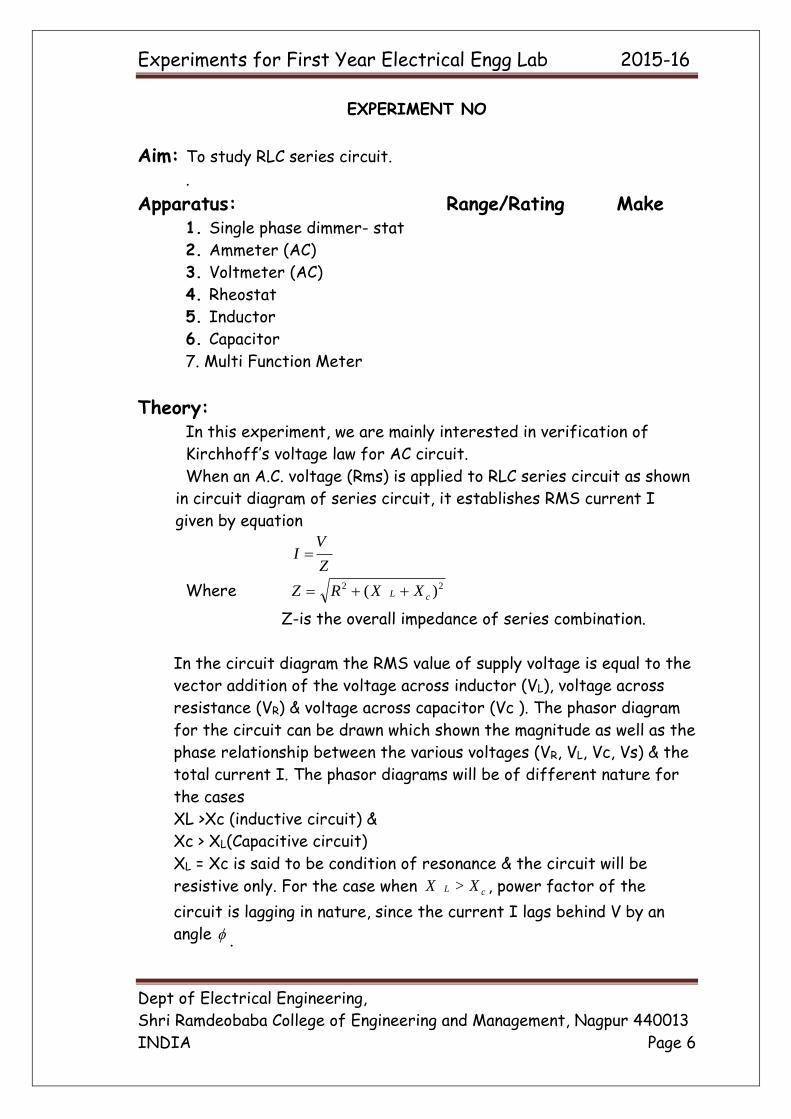
Theory: In this experiment, we are mainly interested in verification of
Kirchhoff’s voltage law for AC circuit.
When an A.C. voltage (Rms) is applied to RLC series circuit as shown
in circuit diagram of series circuit, it establishes RMS current I
given by equation
Z
VI
Where 22 )( cL XXRZ
Z-is the overall impedance of series combination.
In the circuit diagram the RMS value of supply voltage is equal to the
vector addition of the voltage across inductor (VL), voltage across
resistance (VR) & voltage across capacitor (Vc ). The phasor diagram
for the circuit can be drawn which shown the magnitude as well as the
phase relationship between the various voltages (VR, VL, Vc, Vs) & the
total current I. The phasor diagrams will be of different nature for
the cases
XL >Xc (inductive circuit) &
Xc > XL(Capacitive circuit)
XL = Xc is said to be condition of resonance & the circuit will be
resistive only. For the case when cL XX > , power factor of the
circuit is lagging in nature, since the current I lags behind V by an
angle .
Experiments for First Year Electrical Engg Lab 2015-16
Dept of Electrical Engineering,
Shri Ramdeobaba College of Engineering and Management, Nagpur 440013
INDIA Page 7
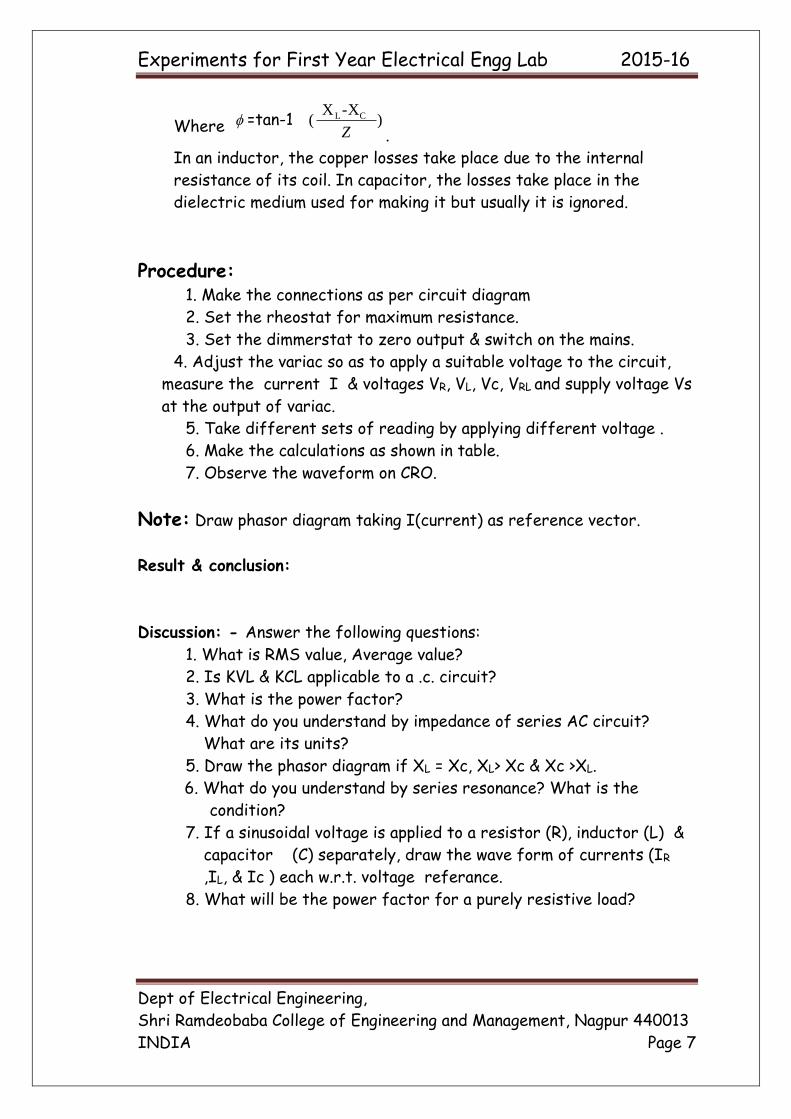
Where =tan-1 ) -XX
( CL
Z .
In an inductor, the copper losses take place due to the internal
resistance of its coil. In capacitor, the losses take place in the
dielectric medium used for making it but usually it is ignored.
Procedure: 1. Make the connections as per circuit diagram
2. Set the rheostat for maximum resistance.
3. Set the dimmerstat to zero output & switch on the mains.
4. Adjust the variac so as to apply a suitable voltage to the circuit,
measure the current I & voltages VR, VL, Vc, VRL and supply voltage Vs
at the output of variac.
5. Take different sets of reading by applying different voltage .
6. Make the calculations as shown in table.
7. Observe the waveform on CRO.
Note: Draw phasor diagram taking I(current) as reference vector.
Result & conclusion:
Discussion: - Answer the following questions:
1. What is RMS value, Average value?
2. Is KVL & KCL applicable to a .c. circuit?
3. What is the power factor?
4. What do you understand by impedance of series AC circuit?
What are its units?
5. Draw the phasor diagram if XL = Xc, XL> Xc & Xc >XL.
6. What do you understand by series resonance? What is the
condition?
7. If a sinusoidal voltage is applied to a resistor (R), inductor (L) &
capacitor (C) separately, draw the wave form of currents (IR
,IL, & Ic ) each w.r.t. voltage referance.
8. What will be the power factor for a purely resistive load?
Experiments for First Year Electrical Engg Lab 2015-16
Dept of Electrical Engineering,
Shri Ramdeobaba College of Engineering and Management, Nagpur 440013
INDIA Page 8
On LHS by Hand with Pencil
EXPERIMENT NO.
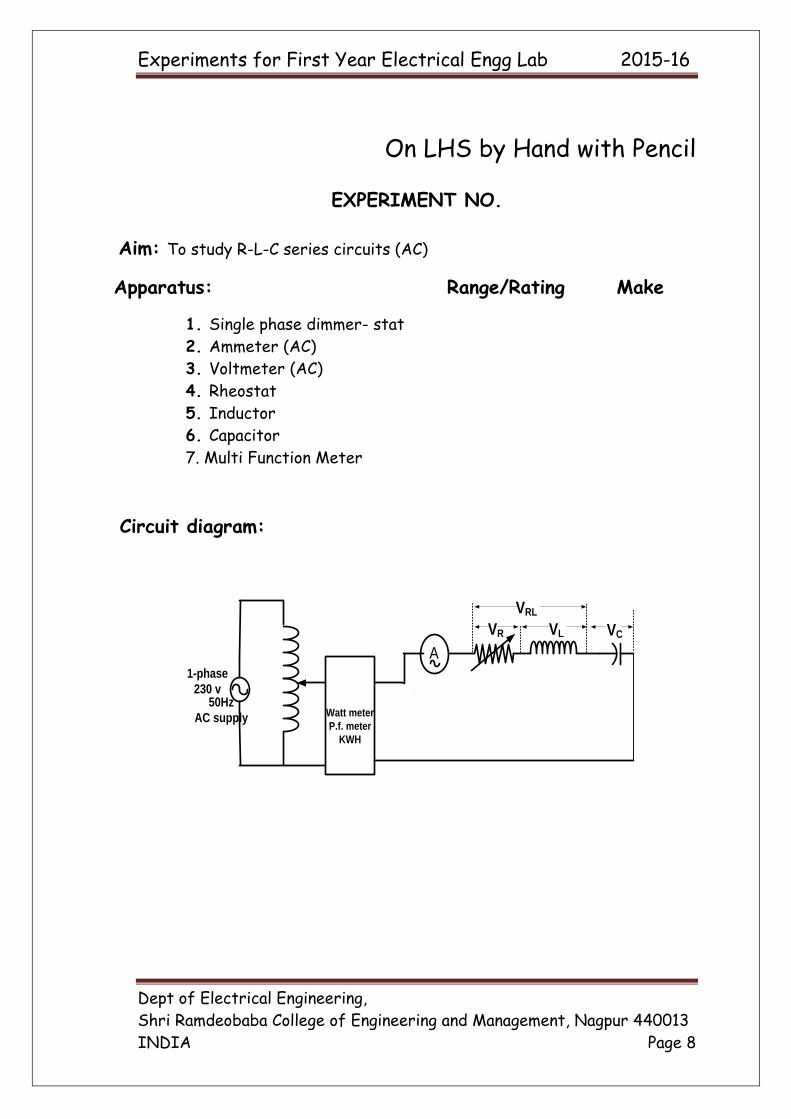
Aim: To study R-L-C series circuits (AC)
Apparatus: Range/Rating Make
1. Single phase dimmer- stat
2. Ammeter (AC)
3. Voltmeter (AC)
4. Rheostat
5. Inductor
6. Capacitor
7. Multi Function Meter
Circuit diagram:
1-phase
230 v
A
Watt meter
P.f. meter
KWH
VR VL VC
VRL
50Hz
AC supply

Experiments for First Year Electrical Engg Lab 2015-16
Dept of Electrical Engineering,
Shri Ramdeobaba College of Engineering and Management, Nagpur 440013
INDIA Page 9
On LHS by Hand with Pencil
Observation table:
RLC Series circuit:
r-internal resistance of coil =--------
Calculations -RLC Series circuit:
Sr.
No
.
Position
of
rheostat
Vs
volt
I
Amp
VR
volt
VL
Volt
Vc
volt
VRL
volt
P.f.
of
ckt
1
2
Middle
position
Maximum
position
100V
100V
Sr
.N
o.
I
VR R
I
VZ L
L
22 rZX LL
I
VsZ
from
calculations
=cos-1 )(Z
rR
from
phaso
r dig
from
p.f.
mete
r
Experiments for First Year Electrical Engg Lab 2015-16
Dept of Electrical Engineering,
Shri Ramdeobaba College of Engineering and Management, Nagpur 440013
INDIA Page 10
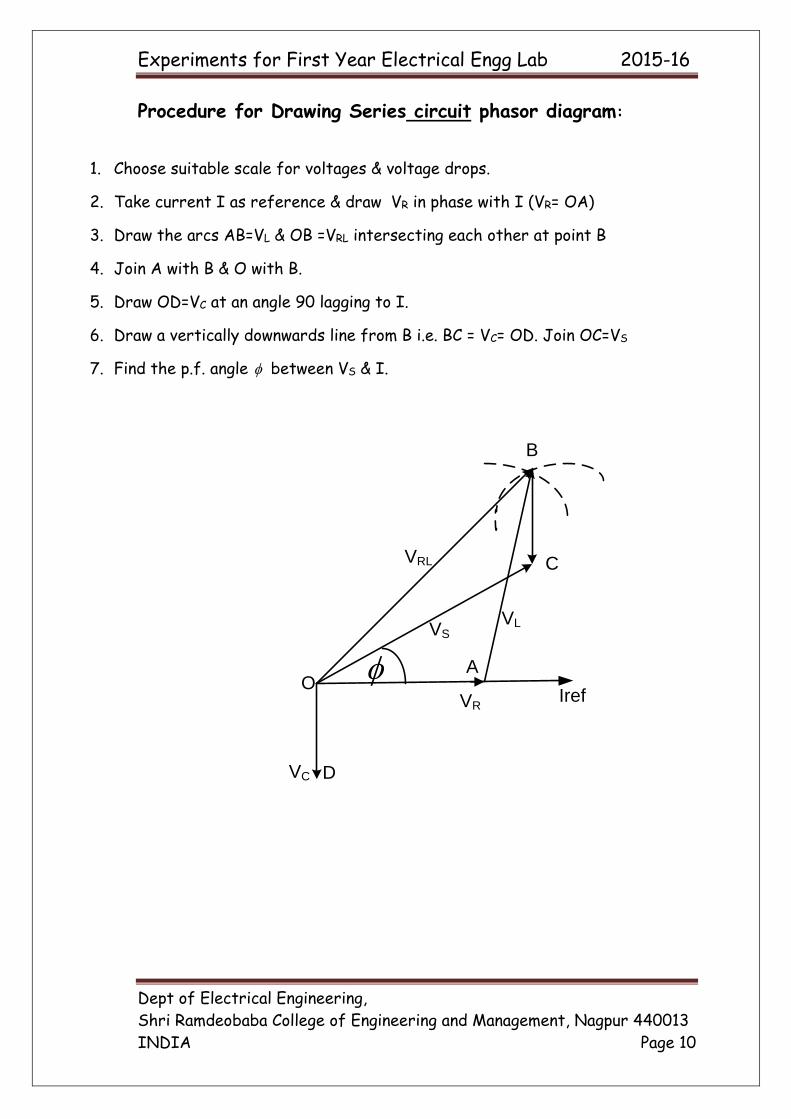
Procedure for Drawing Series circuit phasor diagram:
1. Choose suitable scale for voltages & voltage drops.
2. Take current I as reference & draw VR in phase with I (VR= OA)
3. Draw the arcs AB=VL & OB =VRL intersecting each other at point B
4. Join A with B & O with B.
5. Draw OD=VC at an angle 90 lagging to I.
6. Draw a vertically downwards line from B i.e. BC = VC= OD. Join OC=VS
7. Find the p.f. angle between VS & I.
VRL
IrefVR
VC
VSVL
B
O
D
C
A
Experiments for First Year Electrical Engg Lab 2015-16
Dept of Electrical Engineering,
Shri Ramdeobaba College of Engineering and Management, Nagpur 440013
INDIA Page 11
EXPERIMENT NO.
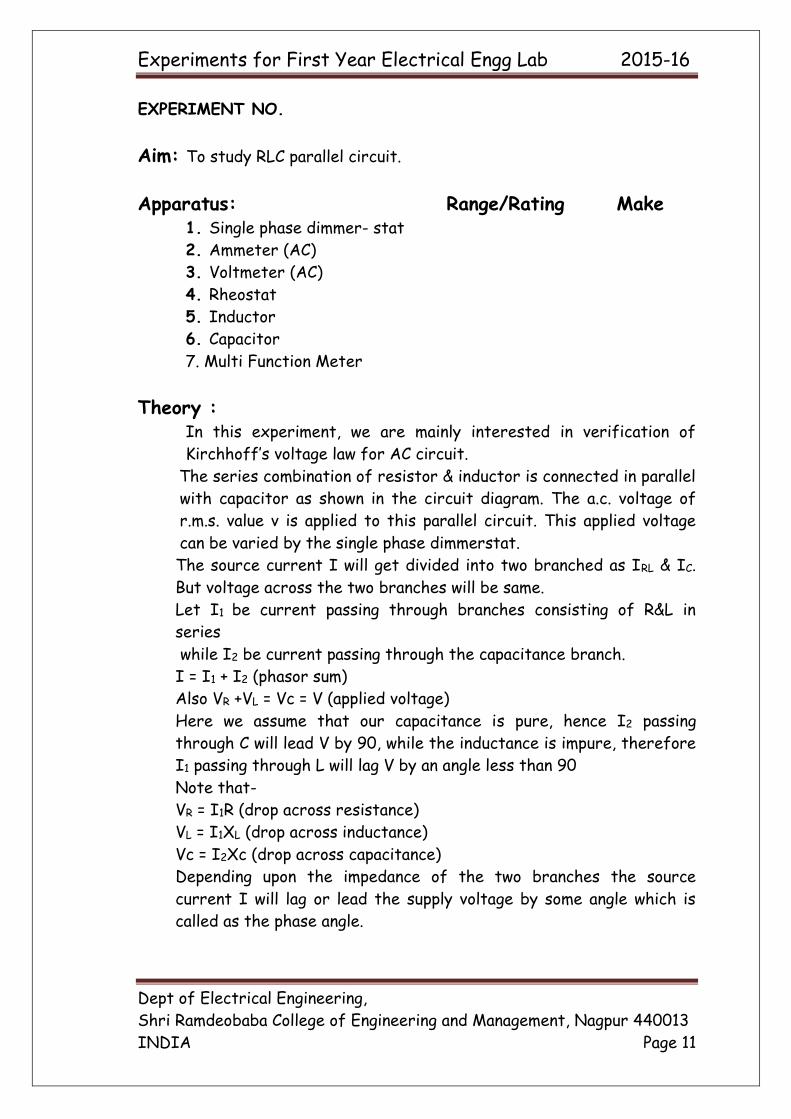
Aim: To study RLC parallel circuit.
Apparatus: Range/Rating Make 1. Single phase dimmer- stat
2. Ammeter (AC)
3. Voltmeter (AC)
4. Rheostat
5. Inductor
6. Capacitor
7. Multi Function Meter
Theory : In this experiment, we are mainly interested in verification of
Kirchhoff’s voltage law for AC circuit.
The series combination of resistor & inductor is connected in parallel
with capacitor as shown in the circuit diagram. The a.c. voltage of
r.m.s. value v is applied to this parallel circuit. This applied voltage
can be varied by the single phase dimmerstat.
The source current I will get divided into two branched as IRL & IC.
But voltage across the two branches will be same.
Let I1 be current passing through branches consisting of R&L in
series
while I2 be current passing through the capacitance branch.
I = I1 + I2 (phasor sum)
Also VR +VL = Vc = V (applied voltage)
Here we assume that our capacitance is pure, hence I2 passing
through C will lead V by 90, while the inductance is impure, therefore
I1 passing through L will lag V by an angle less than 90
Note that-
VR = I1R (drop across resistance)
VL = I1XL (drop across inductance)
Vc = I2Xc (drop across capacitance)
Depending upon the impedance of the two branches the source
current I will lag or lead the supply voltage by some angle which is
called as the phase angle.

Experiments for First Year Electrical Engg Lab 2015-16
Dept of Electrical Engineering,
Shri Ramdeobaba College of Engineering and Management, Nagpur 440013
INDIA Page 12
Procedure:
1. Make the connections as shown in the circuit diagram.
2. Set the Dimmer- stat (variac) to zero output.
3. Set the rheostat to maximum.
4. Switch on the supply.
5. Adjust the variac to give a suitable voltage to the circuit.
6. Note down the voltage across R, L, C, & R-L with a.c. voltmeter.
Note down the reading of all the meters.
7. Take different readings for different another position of
rheostat.
Note: Draw phasor diagram for each reading.
Result & conclusion:
Discussion: - Answer the following questions:
1. Define following terms with their units-
Admittance
Conductance
Susceptance
2. What is meant by lagging and leading current in AC circuit? Show
it by phasor diagram and waveform diagram.
3. Define following powers-
Active power
Re-active power
Apparent power
4. Draw the power triangle for inductive load and capacitive load.
5. What is phasor diagram? What is difference between vector
diagram and phasor diagram?
6. Two branches are connected in parallel. One branch consists of R-
L series combination while other branch consists of R-C series
combination. Draw the phasor diagram showing all the voltages &
all the currents.
7. What do you mean by parallel resonance? What is the condition?
Experiments for First Year Electrical Engg Lab 2015-16
Dept of Electrical Engineering,
Shri Ramdeobaba College of Engineering and Management, Nagpur 440013
INDIA Page 13
On LHS by Hand with Pencil
EXPERIMENT NO.
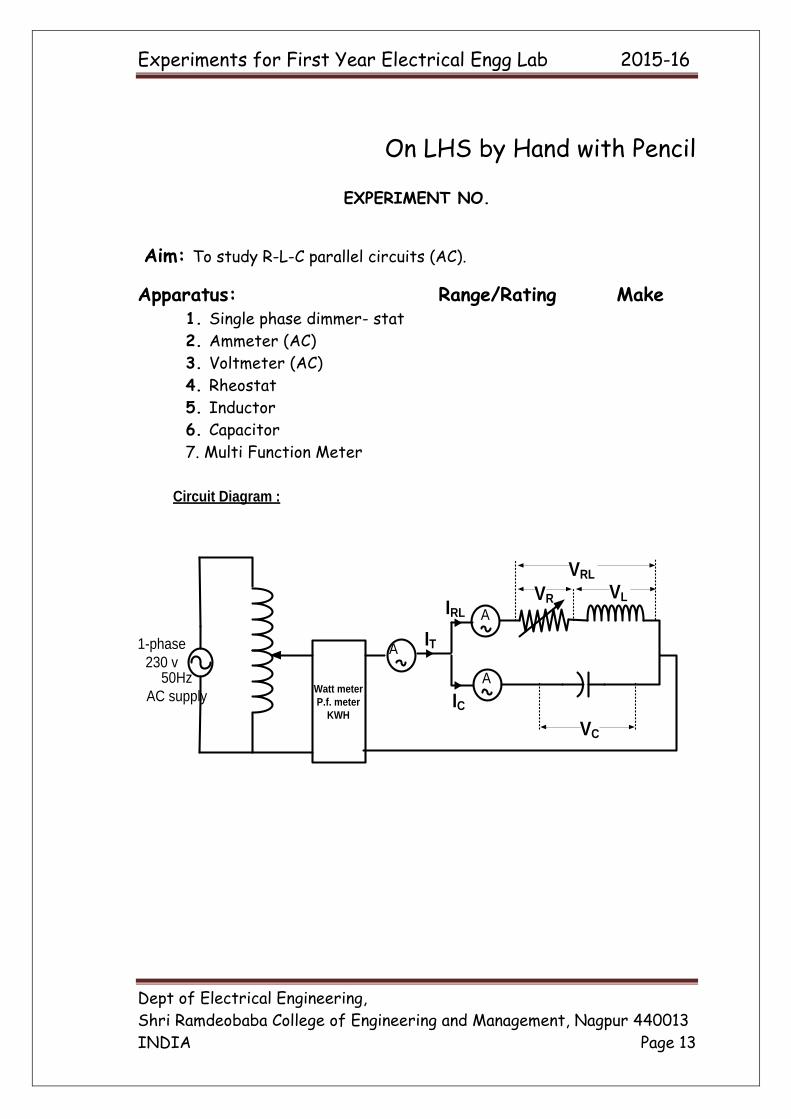
Aim: To study R-L-C parallel circuits (AC).
Apparatus: Range/Rating Make 1. Single phase dimmer- stat
2. Ammeter (AC)
3. Voltmeter (AC)
4. Rheostat
5. Inductor
6. Capacitor
7. Multi Function Meter
1-phase
230 vA
A
A
Watt meter
P.f. meter
KWH
VR VL
VC
VRL
50Hz
AC supply
Circuit Diagram :
IT
IC
IRL
Experiments for First Year Electrical Engg Lab 2015-16
Dept of Electrical Engineering,
Shri Ramdeobaba College of Engineering and Management, Nagpur 440013
INDIA Page 14
On LHS by Hand with Pencil
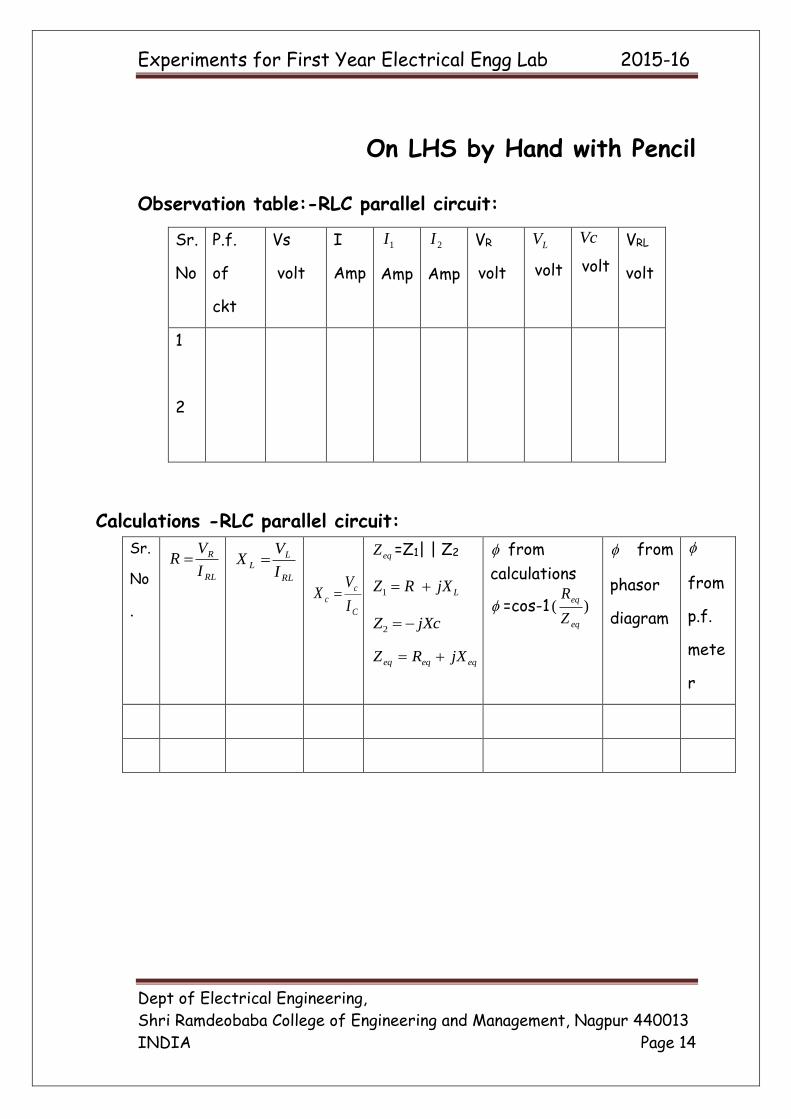
Observation table:-RLC parallel circuit:
Calculations -RLC parallel circuit:
Sr.
No
P.f.
of
ckt
Vs
volt
I
Amp
1I
Amp
2I
Amp
VR
volt
LV
volt
Vc
volt
VRL
volt
1
2
Sr.
No
.
RL
R
I
VR
RL
LL
I
VX
C
c
cI
VX
eqZ =Z1| | Z2
LjXRZ 1
jXcZ 2
eqeqeq jXRZ
from
calculations
=cos-1 )(eq
eq
Z
R
from
phasor
diagram
from
p.f.
mete
r
Experiments for First Year Electrical Engg Lab 2015-16
Dept of Electrical Engineering,
Shri Ramdeobaba College of Engineering and Management, Nagpur 440013
INDIA Page 15
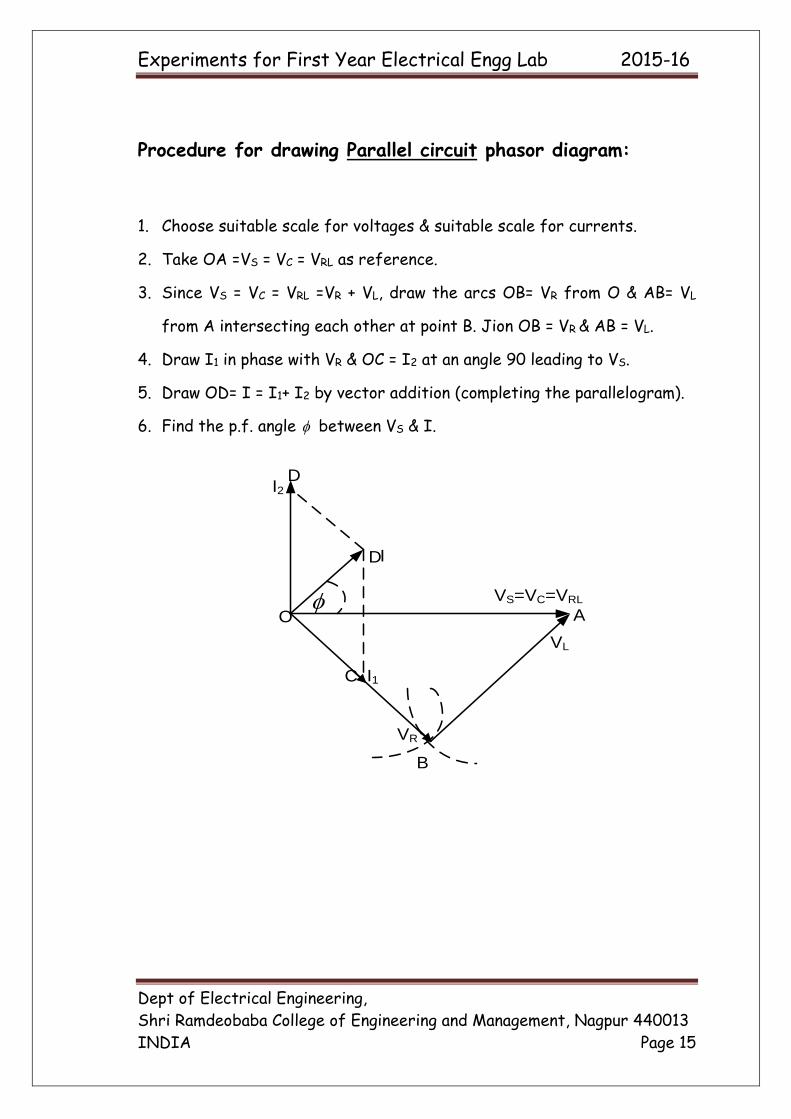
Procedure for drawing Parallel circuit phasor diagram:
1. Choose suitable scale for voltages & suitable scale for currents.
2. Take OA =VS = VC = VRL as reference.
3. Since VS = VC = VRL =VR + VL, draw the arcs OB= VR from O & AB= VL
from A intersecting each other at point B. Jion OB = VR & AB = VL.
4. Draw I1 in phase with VR & OC = I2 at an angle 90 leading to VS.
5. Draw OD= I = I1+ I2 by vector addition (completing the parallelogram).
6. Find the p.f. angle between VS & I.
D
D
O A
B
VL
I2
I1
VR
VS=VC=VRL
I
C
Experiments for First Year Electrical Engg Lab 2015-16
Dept of Electrical Engineering,
Shri Ramdeobaba College of Engineering and Management, Nagpur 440013
INDIA Page 16
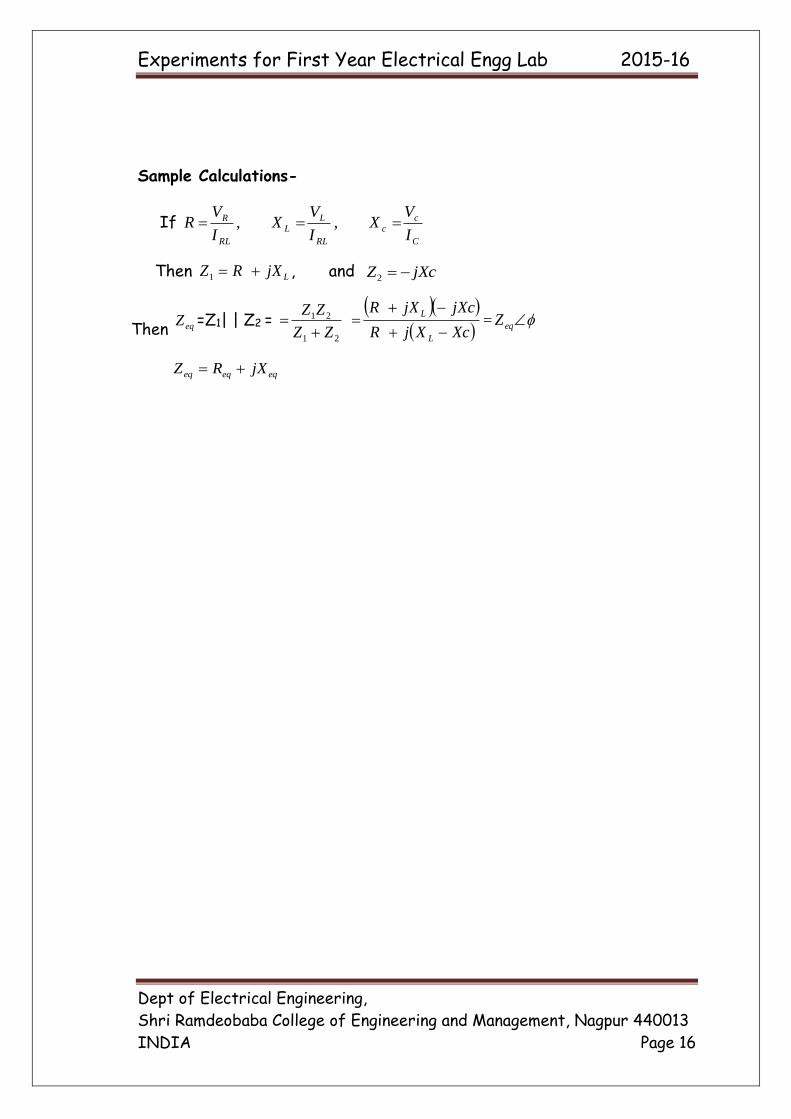
Sample Calculations-
If RL
R
I
VR ,
RL
LL
I
VX ,
C
cc
I
VX
Then LjXRZ 1 , and jXcZ 2
Then eqZ =Z1| | Z2 = 21
21
ZZ
ZZ
XcXjR
jXcjXR
L
L
= eqZ
eqeqeq jXRZ
Experiments for First Year Electrical Engg Lab 2015-16
Dept of Electrical Engineering,
Shri Ramdeobaba College of Engineering and Management, Nagpur 440013
INDIA Page 17
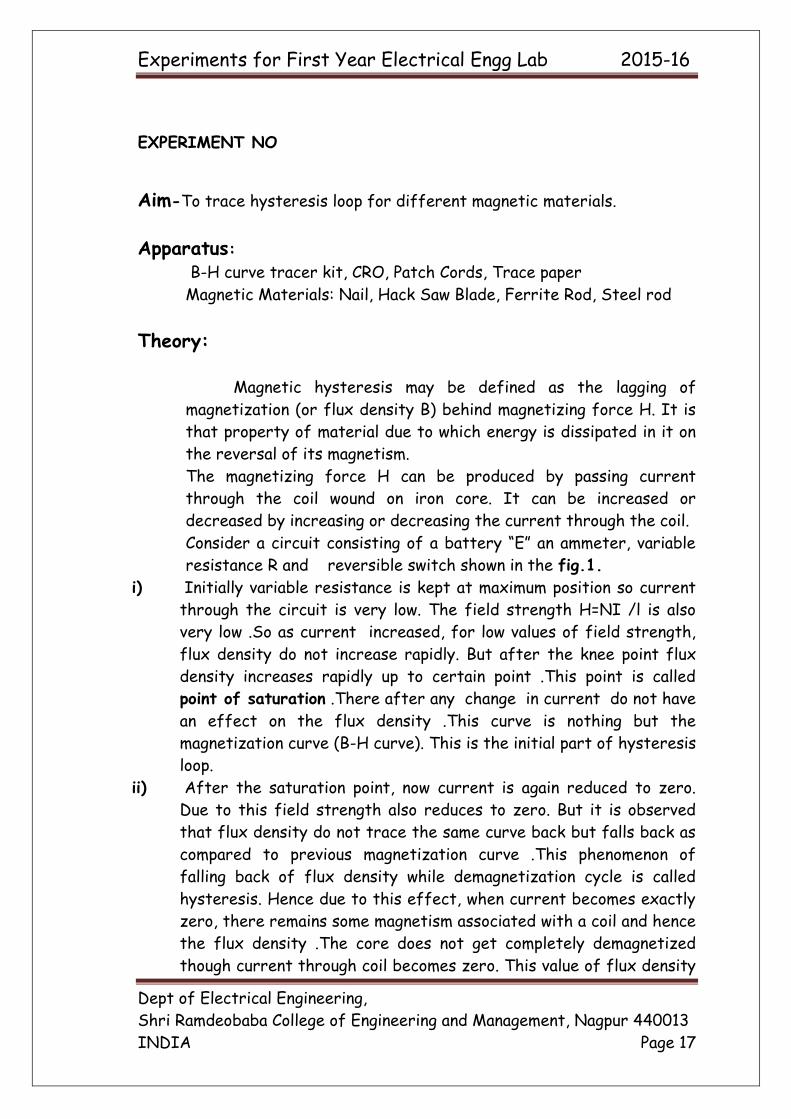
EXPERIMENT NO
Aim-To trace hysteresis loop for different magnetic materials.
Apparatus: B-H curve tracer kit, CRO, Patch Cords, Trace paper
Magnetic Materials: Nail, Hack Saw Blade, Ferrite Rod, Steel rod
Theory:
Magnetic hysteresis may be defined as the lagging of
magnetization (or flux density B) behind magnetizing force H. It is
that property of material due to which energy is dissipated in it on
the reversal of its magnetism.
The magnetizing force H can be produced by passing current
through the coil wound on iron core. It can be increased or
decreased by increasing or decreasing the current through the coil.
Consider a circuit consisting of a battery “E” an ammeter, variable
resistance R and reversible switch shown in the fig.1.
i) Initially variable resistance is kept at maximum position so current
through the circuit is very low. The field strength H=NI /l is also
very low .So as current increased, for low values of field strength,
flux density do not increase rapidly. But after the knee point flux
density increases rapidly up to certain point .This point is called
point of saturation .There after any change in current do not have
an effect on the flux density .This curve is nothing but the
magnetization curve (B-H curve). This is the initial part of hysteresis
loop.
ii) After the saturation point, now current is again reduced to zero.
Due to this field strength also reduces to zero. But it is observed
that flux density do not trace the same curve back but falls back as
compared to previous magnetization curve .This phenomenon of
falling back of flux density while demagnetization cycle is called
hysteresis. Hence due to this effect, when current becomes exactly
zero, there remains some magnetism associated with a coil and hence
the flux density .The core does not get completely demagnetized
though current through coil becomes zero. This value of flux density
Experiments for First Year Electrical Engg Lab 2015-16
Dept of Electrical Engineering,
Shri Ramdeobaba College of Engineering and Management, Nagpur 440013
INDIA Page 18
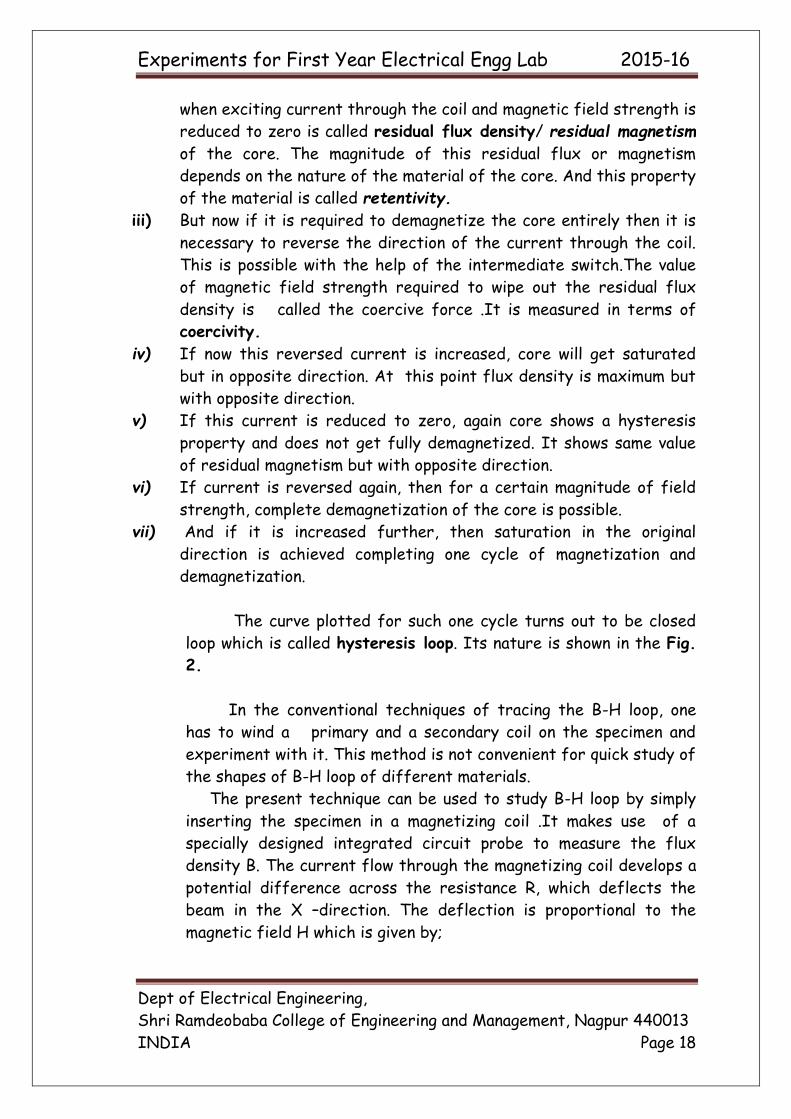
when exciting current through the coil and magnetic field strength is
reduced to zero is called residual flux density/ residual magnetism
of the core. The magnitude of this residual flux or magnetism
depends on the nature of the material of the core. And this property
of the material is called retentivity.
iii) But now if it is required to demagnetize the core entirely then it is
necessary to reverse the direction of the current through the coil.
This is possible with the help of the intermediate switch.The value
of magnetic field strength required to wipe out the residual flux
density is called the coercive force .It is measured in terms of
coercivity.
iv) If now this reversed current is increased, core will get saturated
but in opposite direction. At this point flux density is maximum but
with opposite direction.
v) If this current is reduced to zero, again core shows a hysteresis
property and does not get fully demagnetized. It shows same value
of residual magnetism but with opposite direction.
vi) If current is reversed again, then for a certain magnitude of field
strength, complete demagnetization of the core is possible.
vii) And if it is increased further, then saturation in the original
direction is achieved completing one cycle of magnetization and
demagnetization.
The curve plotted for such one cycle turns out to be closed
loop which is called hysteresis loop. Its nature is shown in the Fig.
2.
In the conventional techniques of tracing the B-H loop, one
has to wind a primary and a secondary coil on the specimen and
experiment with it. This method is not convenient for quick study of
the shapes of B-H loop of different materials.
The present technique can be used to study B-H loop by simply
inserting the specimen in a magnetizing coil .It makes use of a
specially designed integrated circuit probe to measure the flux
density B. The current flow through the magnetizing coil develops a
potential difference across the resistance R, which deflects the
beam in the X –direction. The deflection is proportional to the
magnetic field H which is given by;
Experiments for First Year Electrical Engg Lab 2015-16
Dept of Electrical Engineering,
Shri Ramdeobaba College of Engineering and Management, Nagpur 440013
INDIA Page 19
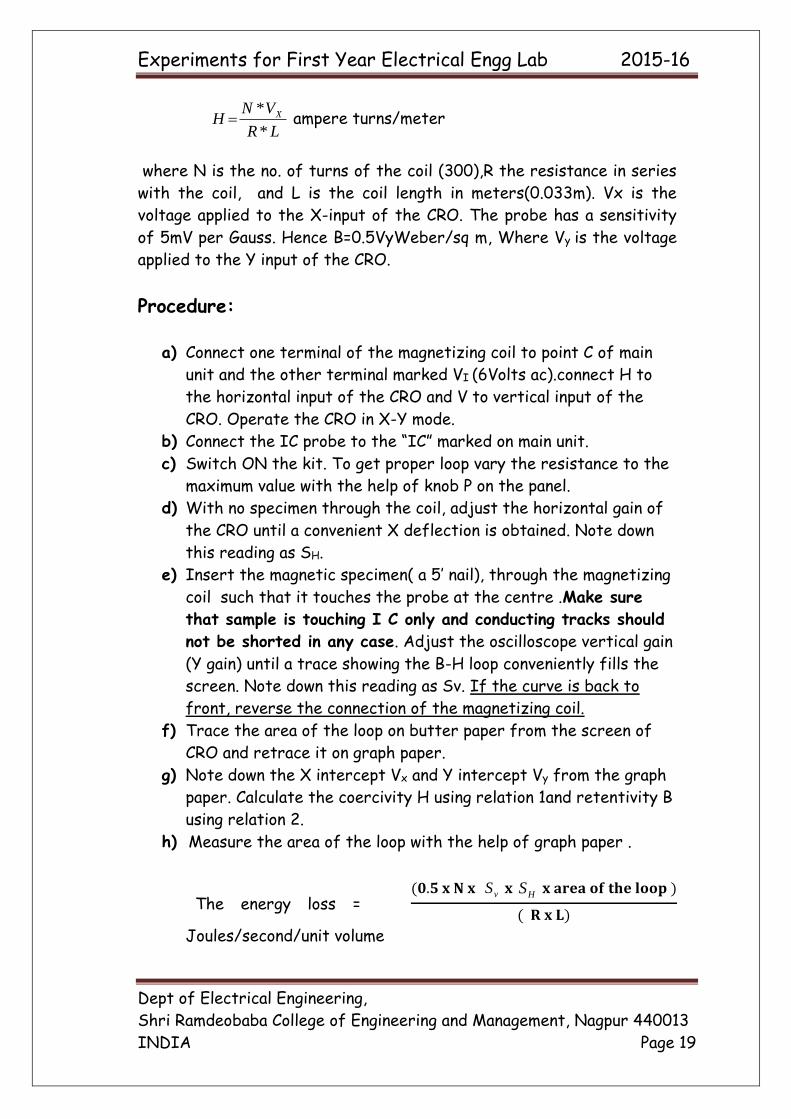
LR
VNH X
*
*
ampere turns/meter
where N is the no. of turns of the coil (300),R the resistance in series
with the coil, and L is the coil length in meters(0.033m). Vx is the
voltage applied to the X-input of the CRO. The probe has a sensitivity
of 5mV per Gauss. Hence B=0.5VyWeber/sq m, Where Vy is the voltage
applied to the Y input of the CRO.
Procedure:
a) Connect one terminal of the magnetizing coil to point C of main
unit and the other terminal marked VI (6Volts ac).connect H to
the horizontal input of the CRO and V to vertical input of the
CRO. Operate the CRO in X-Y mode.
b) Connect the IC probe to the “IC” marked on main unit.
c) Switch ON the kit. To get proper loop vary the resistance to the
maximum value with the help of knob P on the panel.
d) With no specimen through the coil, adjust the horizontal gain of
the CRO until a convenient X deflection is obtained. Note down
this reading as SH.
e) Insert the magnetic specimen( a 5’ nail), through the magnetizing
coil such that it touches the probe at the centre .Make sure
that sample is touching I C only and conducting tracks should
not be shorted in any case. Adjust the oscilloscope vertical gain
(Y gain) until a trace showing the B-H loop conveniently fills the
screen. Note down this reading as Sv. If the curve is back to
front, reverse the connection of the magnetizing coil.
f) Trace the area of the loop on butter paper from the screen of
CRO and retrace it on graph paper.
g) Note down the X intercept Vx and Y intercept Vy from the graph
paper. Calculate the coercivity H using relation 1and retentivity B
using relation 2.
h) Measure the area of the loop with the help of graph paper .
The energy loss = (𝟎.𝟓 𝐱 𝐍 𝐱 vS 𝐱 HS 𝐱 𝐚𝐫𝐞𝐚 𝐨𝐟 𝐭𝐡𝐞 𝐥𝐨𝐨𝐩 )
( 𝐑 𝐱 𝐋)
Joules/second/unit volume
Experiments for First Year Electrical Engg Lab 2015-16
Dept of Electrical Engineering,
Shri Ramdeobaba College of Engineering and Management, Nagpur 440013
INDIA Page 20
Where Sv and SH are vertical and horizontal sensitivities of the
CRO for that particular setting of the gains.
(i) Repeat the experiment by varying the a.c.voltage by connecting
coil between points C& V2(9Volts)andV3(12V).The part of the
curve showing saturation changes in length.
j) Repeat the experiment with different specimen and note your
comments on the properties of different materials.
Precautions: (a) The specimen should touch the probe.
(b) If the area of the loop is expressed in cm2, the sensitivities should
be expressed in volts/cm. If the area of the loop is expressed in
sq.meter the sensitivities should be expressed in volts/meter. The
length of the coil should be in meter.
Conclusion:-
Discussion:- 1) Draw and briefly explain the hysteresis loop.
2) What is saturation in magnetic material?
3) What is residual magnetism?
4) What is relative permeability and absolute permeability?
5) Why B-H curve is different for different material?
6) Plot B-H curve for non magnetic material?
7) Draw hysteresis loop for hard steel, cast and alloyed sheet,
laminated sheet on the same graph paper and compare.
8) Why hysteresis loop is thin /small for transformer stamping.
Experiments for First Year Electrical Engg Lab 2015-16
Dept of Electrical Engineering,
Shri Ramdeobaba College of Engineering and Management, Nagpur 440013
INDIA Page 21
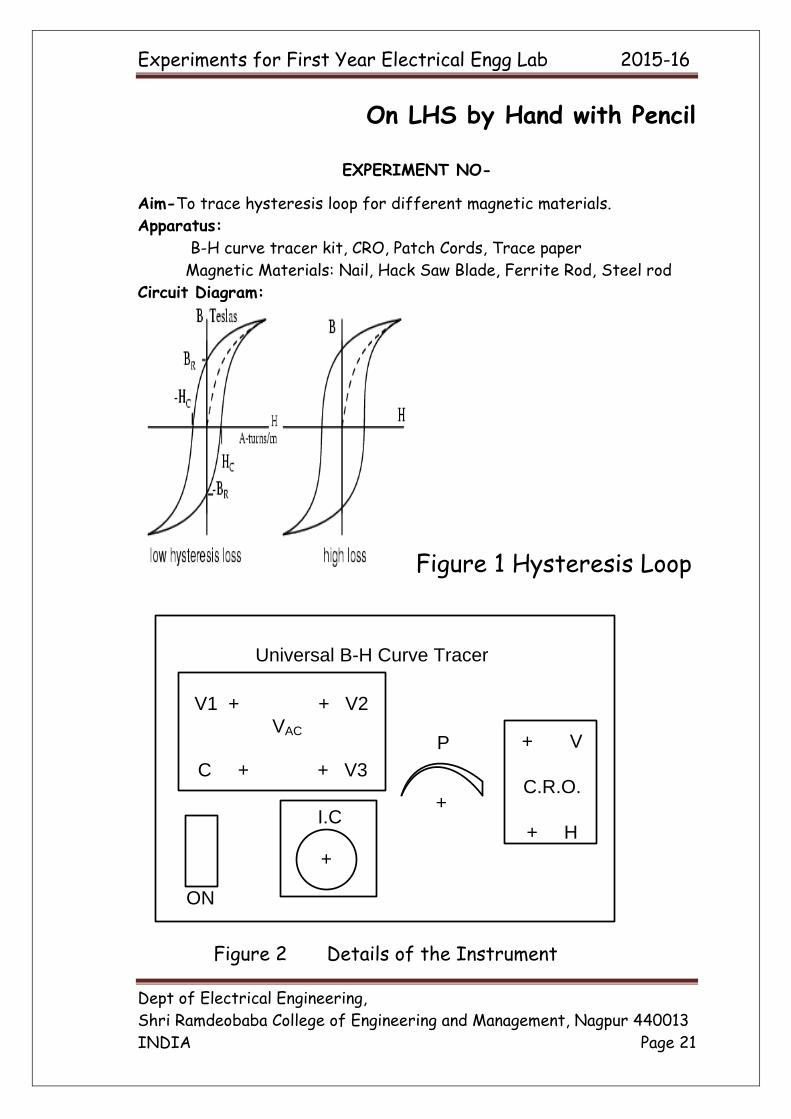
On LHS by Hand with Pencil
EXPERIMENT NO- Aim-To trace hysteresis loop for different magnetic materials.
Apparatus:
B-H curve tracer kit, CRO, Patch Cords, Trace paper
Magnetic Materials: Nail, Hack Saw Blade, Ferrite Rod, Steel rod
Circuit Diagram:
Figure 1 Hysteresis Loop
Universal B-H Curve Tracer
ON
V1 + + V2
VAC
C + + V3
+
I.C
+ V
C.R.O.
+ H
P
+
Figure 2 Details of the Instrument
Experiments for First Year Electrical Engg Lab 2015-16
Dept of Electrical Engineering,
Shri Ramdeobaba College of Engineering and Management, Nagpur 440013
INDIA Page 22
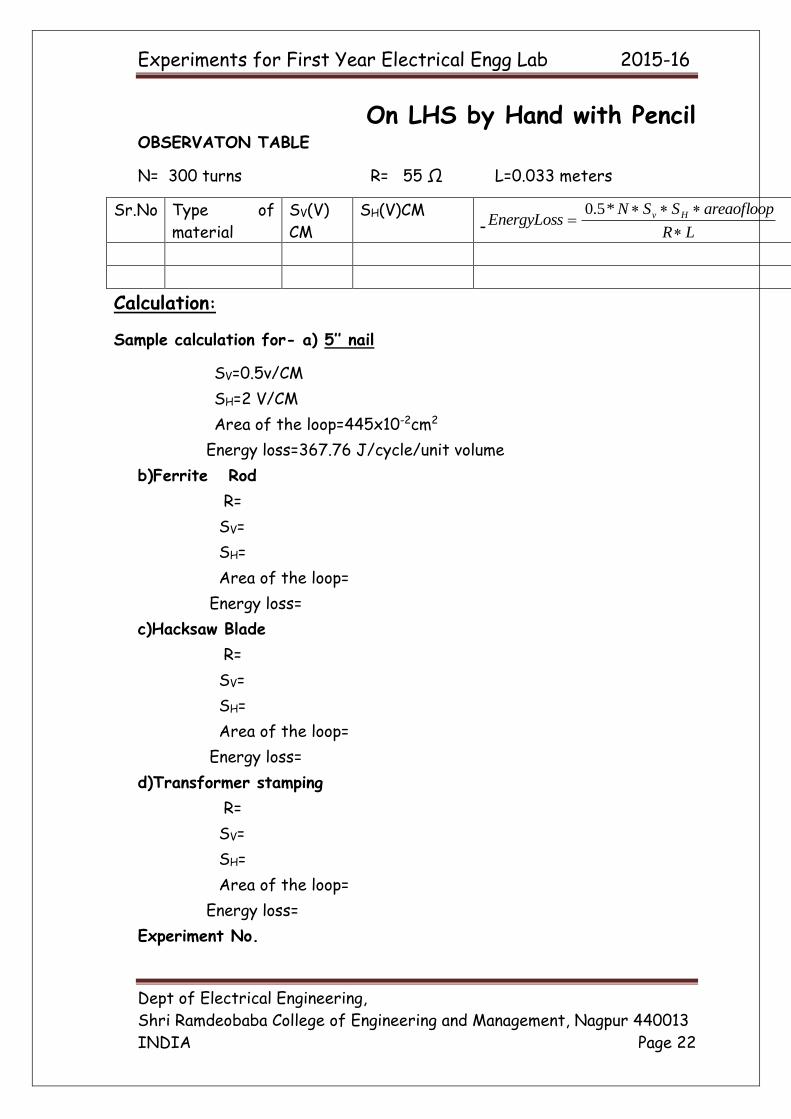
On LHS by Hand with Pencil OBSERVATON TABLE
N= 300 turns R= 55 Ω L=0.033 meters
Sr.No Type of
material
SV(V)
CM
SH(V)CM
LR
areaofloopSSNEnergyLoss Hv
*5.0
Calculation:
Sample calculation for- a) 5’’ nail
SV=0.5v/CM
SH=2 V/CM
Area of the loop=445x10-2cm2
Energy loss=367.76 J/cycle/unit volume
b)Ferrite Rod
R=
SV=
SH=
Area of the loop=
Energy loss=
c)Hacksaw Blade
R=
SV=
SH=
Area of the loop=
Energy loss=
d)Transformer stamping
R=
SV=
SH=
Area of the loop=
Energy loss=
Experiment No.
Experiments for First Year Electrical Engg Lab 2015-16
Dept of Electrical Engineering,
Shri Ramdeobaba College of Engineering and Management, Nagpur 440013
INDIA Page 23
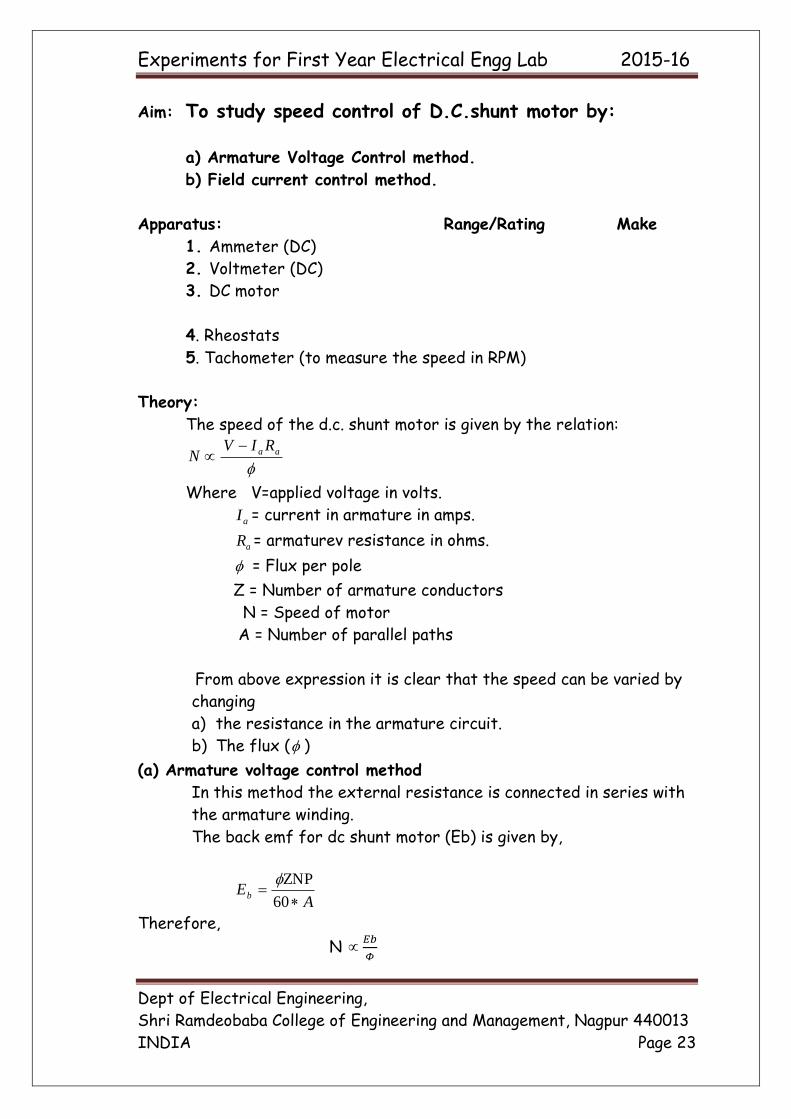
Aim: To study speed control of D.C.shunt motor by:
a) Armature Voltage Control method.
b) Field current control method.
Apparatus: Range/Rating Make
1. Ammeter (DC)
2. Voltmeter (DC)
3. DC motor
4. Rheostats
5. Tachometer (to measure the speed in RPM)
Theory:
The speed of the d.c. shunt motor is given by the relation:
aa RIVN
Where V=applied voltage in volts.
aI = current in armature in amps.
aR = armaturev resistance in ohms.
= Flux per pole
Z = Number of armature conductors
N = Speed of motor
A = Number of parallel paths
From above expression it is clear that the speed can be varied by
changing
a) the resistance in the armature circuit.
b) The flux ( )
(a) Armature voltage control method
In this method the external resistance is connected in series with
the armature winding.
The back emf for dc shunt motor (Eb) is given by,
AEb
60
ZNP
Therefore,
N 𝐸𝑏
𝛷
Experiments for First Year Electrical Engg Lab 2015-16
Dept of Electrical Engineering,
Shri Ramdeobaba College of Engineering and Management, Nagpur 440013
INDIA Page 24
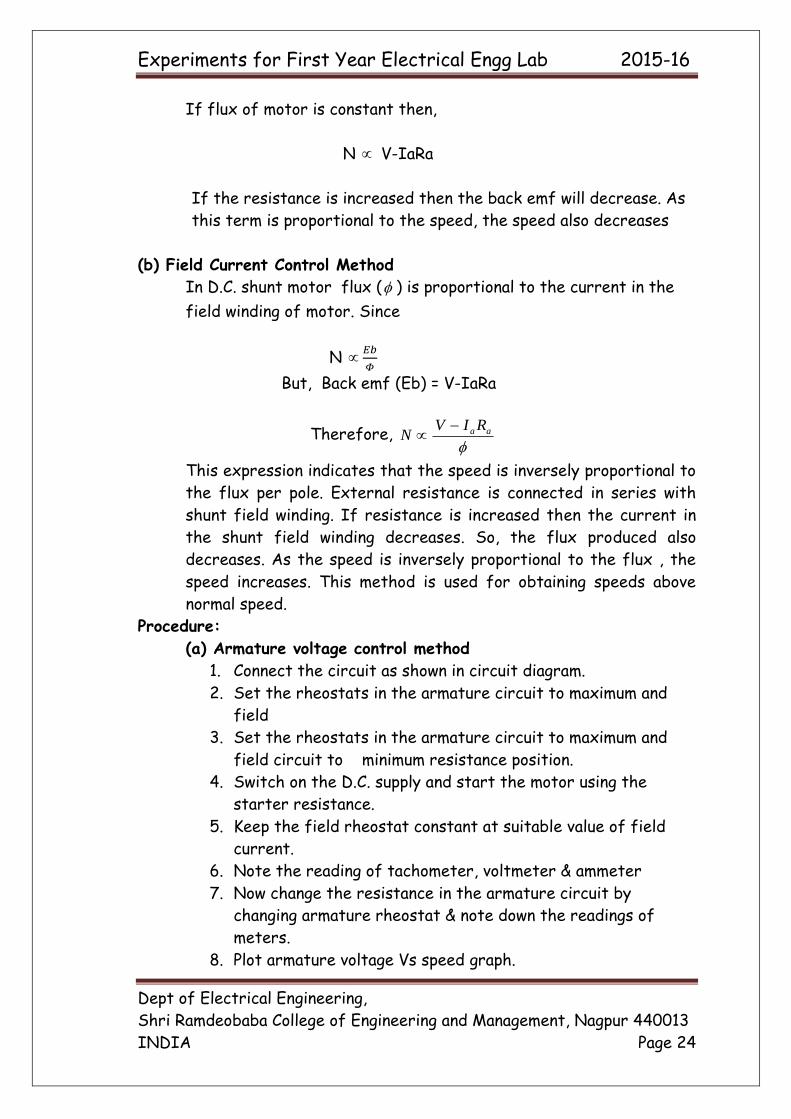
If flux of motor is constant then,
N V-IaRa
If the resistance is increased then the back emf will decrease. As
this term is proportional to the speed, the speed also decreases
(b) Field Current Control Method
In D.C. shunt motor flux ( ) is proportional to the current in the
field winding of motor. Since
N 𝐸𝑏
𝛷
But, Back emf (Eb) = V-IaRa
Therefore,
aa RIVN
This expression indicates that the speed is inversely proportional to
the flux per pole. External resistance is connected in series with
shunt field winding. If resistance is increased then the current in
the shunt field winding decreases. So, the flux produced also
decreases. As the speed is inversely proportional to the flux , the
speed increases. This method is used for obtaining speeds above
normal speed.
Procedure:
(a) Armature voltage control method
1. Connect the circuit as shown in circuit diagram.
2. Set the rheostats in the armature circuit to maximum and
field
3. Set the rheostats in the armature circuit to maximum and
field circuit to minimum resistance position.
4. Switch on the D.C. supply and start the motor using the
starter resistance.
5. Keep the field rheostat constant at suitable value of field
current.
6. Note the reading of tachometer, voltmeter & ammeter
7. Now change the resistance in the armature circuit by
changing armature rheostat & note down the readings of
meters.
8. Plot armature voltage Vs speed graph.
Experiments for First Year Electrical Engg Lab 2015-16
Dept of Electrical Engineering,
Shri Ramdeobaba College of Engineering and Management, Nagpur 440013
INDIA Page 25
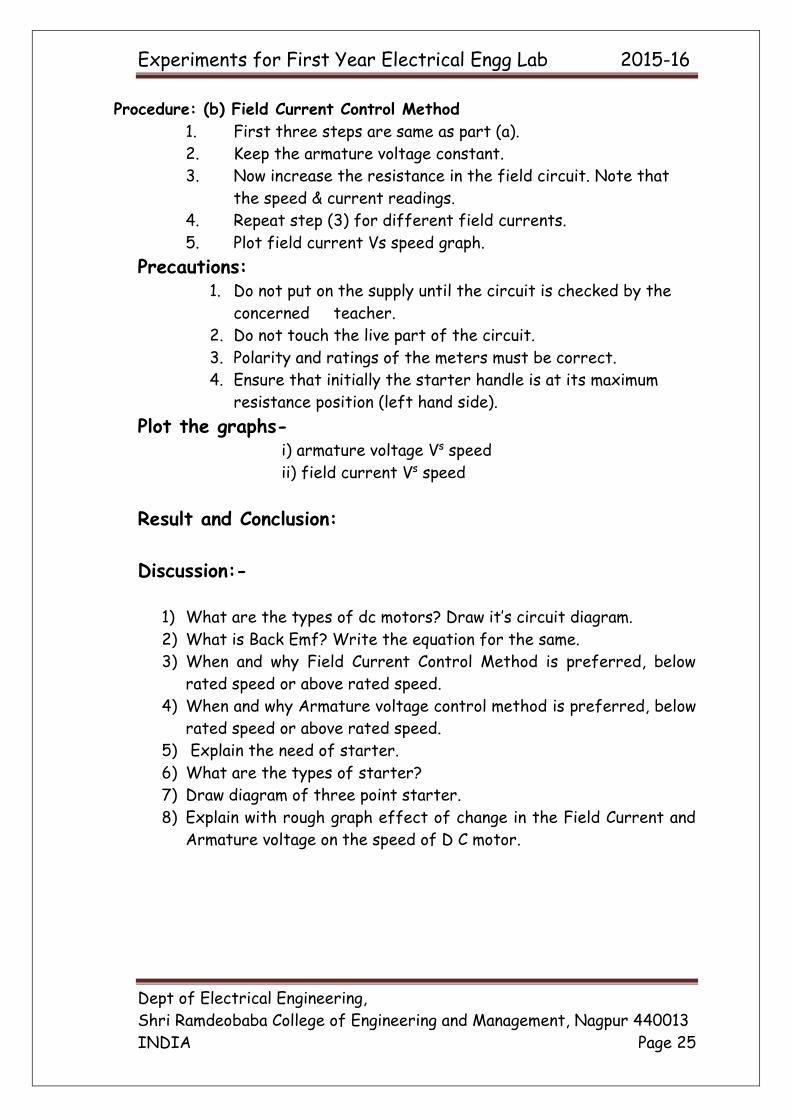
Procedure: (b) Field Current Control Method
1. First three steps are same as part (a).
2. Keep the armature voltage constant.
3. Now increase the resistance in the field circuit. Note that
the speed & current readings.
4. Repeat step (3) for different field currents.
5. Plot field current Vs speed graph.
Precautions: 1. Do not put on the supply until the circuit is checked by the
concerned teacher.
2. Do not touch the live part of the circuit.
3. Polarity and ratings of the meters must be correct.
4. Ensure that initially the starter handle is at its maximum
resistance position (left hand side).
Plot the graphs- i) armature voltage Vs speed
ii) field current Vs speed
Result and Conclusion:
Discussion:-
1) What are the types of dc motors? Draw it’s circuit diagram.
2) What is Back Emf? Write the equation for the same.
3) When and why Field Current Control Method is preferred, below
rated speed or above rated speed.
4) When and why Armature voltage control method is preferred, below
rated speed or above rated speed.
5) Explain the need of starter.
6) What are the types of starter?
7) Draw diagram of three point starter.
8) Explain with rough graph effect of change in the Field Current and
Armature voltage on the speed of D C motor.
Experiments for First Year Electrical Engg Lab 2015-16
Dept of Electrical Engineering,
Shri Ramdeobaba College of Engineering and Management, Nagpur 440013
INDIA Page 26
On LHS by Hand with Pencil
Experiment No
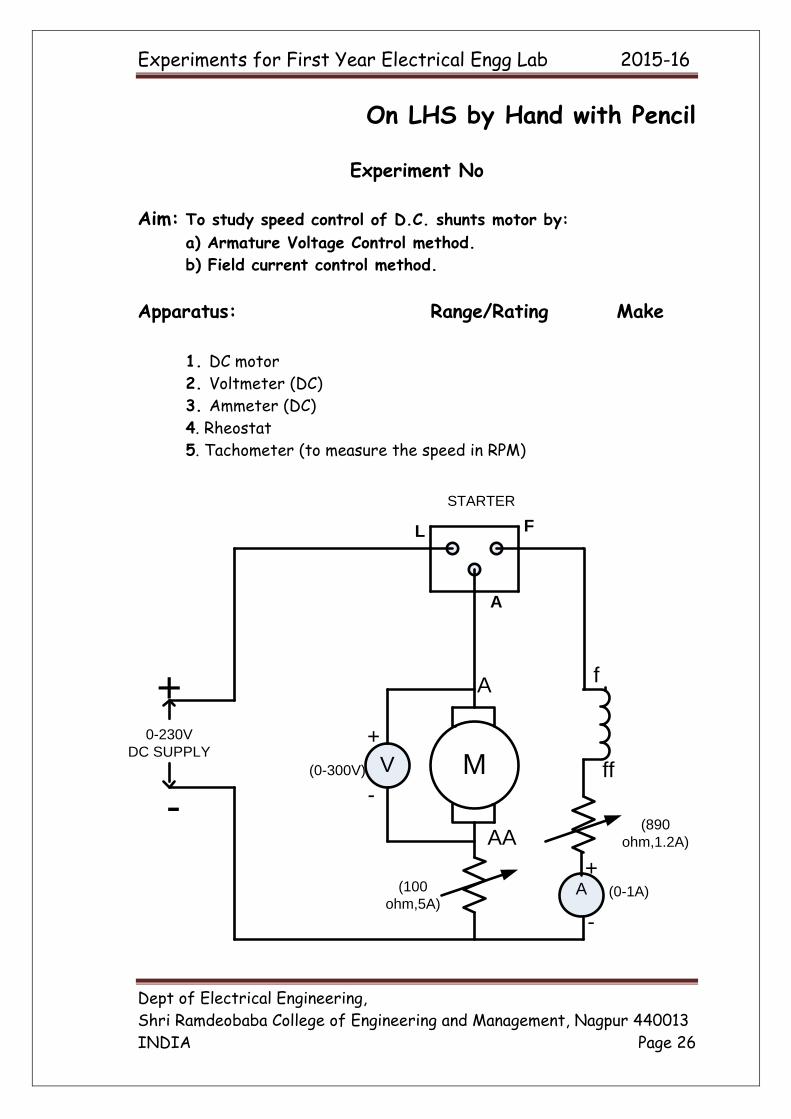
Aim: To study speed control of D.C. shunts motor by:
a) Armature Voltage Control method.
b) Field current control method.
Apparatus: Range/Rating Make
1. DC motor
2. Voltmeter (DC)
3. Ammeter (DC)
4. Rheostat
5. Tachometer (to measure the speed in RPM)
MV
+
-
+
-
+
-
(0-1A)
(890
ohm,1.2A)
(100
ohm,5A)
L
A
F
0-230V
DC SUPPLY
(0-300V)
A
AA
f
ff
A
STARTER
Experiments for First Year Electrical Engg Lab 2015-16
Dept of Electrical Engineering,
Shri Ramdeobaba College of Engineering and Management, Nagpur 440013
INDIA Page 27
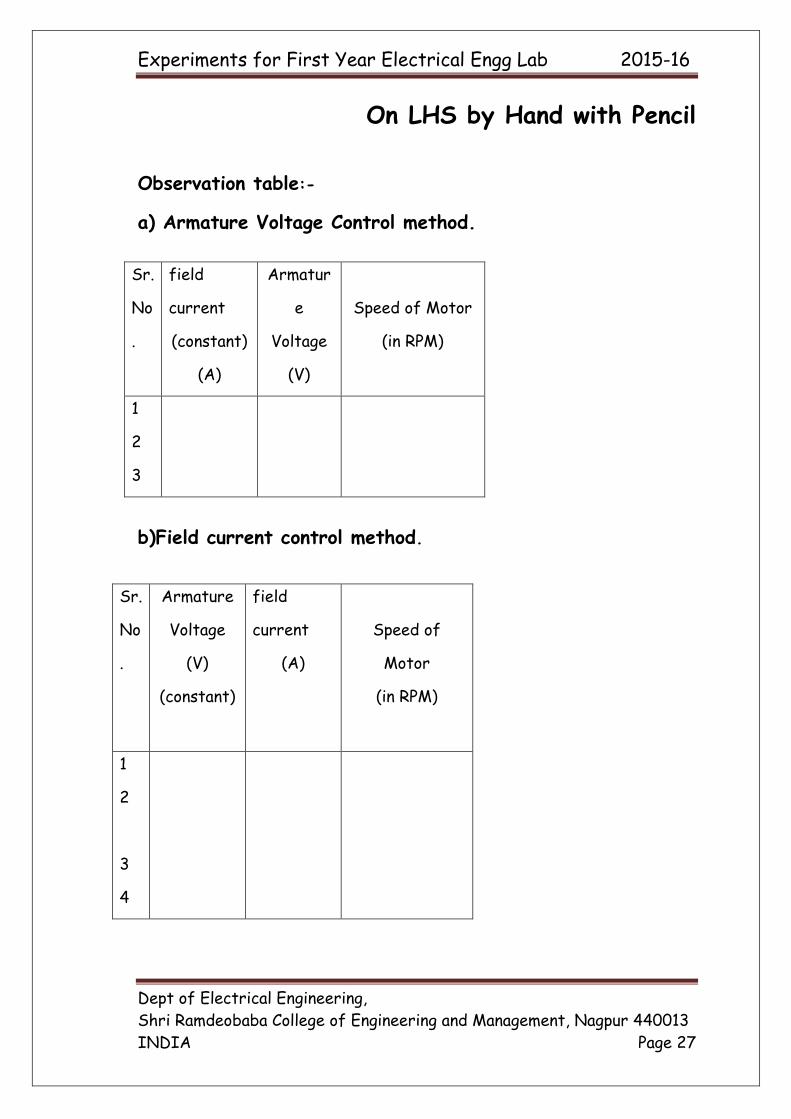
On LHS by Hand with Pencil
Observation table:-
a) Armature Voltage Control method.
b)Field current control method.
Sr.
No
.
field
current
(constant)
(A)
Armatur
e
Voltage
(V)
Speed of Motor
(in RPM)
1
2
3
Sr.
No
.
Armature
Voltage
(V)
(constant)
field
current
(A)
Speed of
Motor
(in RPM)
1
2
3
4