
Experiments for First Year Electrical Engg Lab 2014-15 Practical... · Experiments for First Year...
23
Experiments for First Year Electrical Engg Lab 2014-15 Dept of Electrical Engineering, Shri Ramdeobaba College of Engineering and Management, Nagpur 440013 INDIA Page 1 Experiment No Aim: To determine Regulation and Efficiency of a single phase transformer by open circuit (O.C.) and short circuit (S.C.) tests Apparatus: - Single phase transformer Single phase dimmer stat Ammeter (AC) Voltmeter (AC) Multi-function meter THEORY:-Open Circuit Test: The main purpose of this test is to find the iron loss and no load current which are useful in calculating core loss resistance and magnetizing reactance of the transformer. In O.C. test primary winding is connected to a.c. supply, keeping secondary open. Sometimes a voltmeter may be connected across secondary as voltmeter resistance is very high & voltmeter current is negligibly small so that secondary is treated as open circuit. Usually low voltage side is used as primary and high voltage side as secondary to conduct O.C. test. When primary voltage is adjusted to its rated value with the help of variac, readings of ammeter and wattmeter are to be recorded. Ammeter gives no load current. Transformer no load current is always very small, 2 to 5 % of its full load current. As secondary is open, I2 = 0, hence secondary copper losses are zero. And I1 = I0 is very low hence copper losses on primary are also very low. Thus the total copper losses in O.C. test are negligibly small, hence neglected. Therefore the wattmeter reading in O.C. test gives iron losses which remain constant for all the loads. Short Circuit Test: The main purpose of this test is to find full load copper loss and winding parameters (R01 &X01 or R02 & X02) which are helpful for finding regulation of transformer.
Transcript of Experiments for First Year Electrical Engg Lab 2014-15 Practical... · Experiments for First Year...
Experiments for First Year Electrical Engg Lab 2014-15
Dept of Electrical Engineering,
Shri Ramdeobaba College of Engineering and Management, Nagpur 440013
INDIA Page 1
Experiment No
Aim: To determine Regulation and Efficiency of a single phase transformer by
open circuit (O.C.) and short circuit (S.C.) tests
Apparatus: -
Single phase transformer
Single phase dimmer stat
Ammeter (AC)
Voltmeter (AC)
Multi-function meter
THEORY:-Open Circuit Test:
The main purpose of this test is to find the iron loss and no load current
which are useful in calculating core loss resistance and magnetizing
reactance of the transformer.
In O.C. test primary winding is connected to a.c. supply, keeping secondary
open. Sometimes a voltmeter may be connected across secondary as
voltmeter resistance is very high & voltmeter current is negligibly small so
that secondary is treated as open circuit. Usually low voltage side is used
as primary and high voltage side as secondary to conduct O.C. test.
When primary voltage is adjusted to its rated value with the help of
variac, readings of ammeter and wattmeter are to be recorded.
Ammeter gives no load current. Transformer no load current is always very
small, 2 to 5 % of its full load current.
As secondary is open, I2 = 0, hence secondary copper losses are zero. And
I1 = I0 is very low hence copper losses on primary are also very low. Thus
the total copper losses in O.C. test are negligibly small, hence neglected.
Therefore the wattmeter reading in O.C. test gives iron losses which
remain constant for all the loads.
Short Circuit Test:
The main purpose of this test is to find full load copper loss and winding
parameters (R01 &X01 or R02 & X02) which are helpful for finding
regulation of transformer.
Experiments for First Year Electrical Engg Lab 2014-15
Dept of Electrical Engineering,
Shri Ramdeobaba College of Engineering and Management, Nagpur 440013
INDIA Page 2
In this test, secondary is short circuited with the help of ammeter.
(secondary may be short circuited with thick copper wire or solid link). As
secondary is shorted, its resistance is very very small and on rated
voltage it may draw very large current. Such large current can cause
overheating and burning of the transformer. To limit this short circuit
current, primary is supplied with low/reduced voltage (5 – 15% of the
rated voltage) which is just enough to cause rated current to flow
through primary which can be observed on an ammeter. The reduced
voltage can be adjusted with the help of variac. The wattmeter reading as
well as voltmeter, ammeter readings are recorded.
As the voltage applied is low which is a small fraction of the rated voltage
and iron losses are function of applied voltage, hence iron losses are
negligibly small. Since the currents flowing through the windings are
rated currents hence the total copper loss is full load copper loss. Hence
the wattmeter reading is the power loss which is equal to full load copper
losses.
Procedure: A) O.C. test:
1) Connect the circuit as shown in circuit diagram.
2) Switch on the supply after checking connection by concerned teacher.
3) Increase the input voltage to the transformer winding upto rated value
(230V) slowly using dimmer stat.
4) Measure the primary voltage, primary current, primary circuit power
and secondary voltage of transformer.
5) Reduce the voltage slowly using Variac.
6) Switch off the supply and remove connections.
Procedure : B) S.C. test
1) Connect the circuit as shown in circuit diagram.
2) Switch on the supply after checking connection by concerned teacher.
3) Increase the input voltage very carefully and slowly so that the
current in secondary winding reaches rated value (8.6A) slowly using
dimmer stat.
4) Measure the primary voltage, primary current, primary circuit power
and secondary current of transformer.
5) Reduce the voltage slowly using dimmer stat.
6) Switch off the supply and remove connections.
Experiments for First Year Electrical Engg Lab 2014-15
Dept of Electrical Engineering,
Shri Ramdeobaba College of Engineering and Management, Nagpur 440013
INDIA Page 3
Precaution:
1) Do not put on the supply until the circuit is checked by concerned
teacher.
2) Do not touch any live part of circuit.
3) Be careful for primary & secondary winding rated current.
Result & Conclusion:
Discussion Questions
1) What is regulation and efficiency of a transformer?
2) Why core losses remain almost constant at any load?
3) Justify-open circuit test gives core losses while short circuit test gives
copper losses.
4) What are the advantages and disadvantages of direct loading method over
open circuit (o.c.) and short circuit (s.c.) test?
5) Discuss the effect of output power on efficiency and regulation.
6) Why reduced voltage is required for s.c. test?
7) Why s.c. test is generally performed with L.V. side short circuited?
8) Why o.c. test is generally performed on L.V. side.
Experiments for First Year Electrical Engg Lab 2014-15
Dept of Electrical Engineering,
Shri Ramdeobaba College of Engineering and Management, Nagpur 440013
INDIA Page 4
On LHS by Hand with Pencil EXPERIMENT NO.
Aim: To determine Regulation and Efficiency of a single phase transformer by
open circuit (o.c.) and short circuit (s.c.) tests
Apparatus: - Range/Rating Make
1. Single phase dimmer stat
2. Ammeter (AC)
3. Voltmeter (AC)
4. 1-phaseTransformer
5. Multi-function meter
1-phase
230 v
A
Watt meter
P.f. meter
KWH
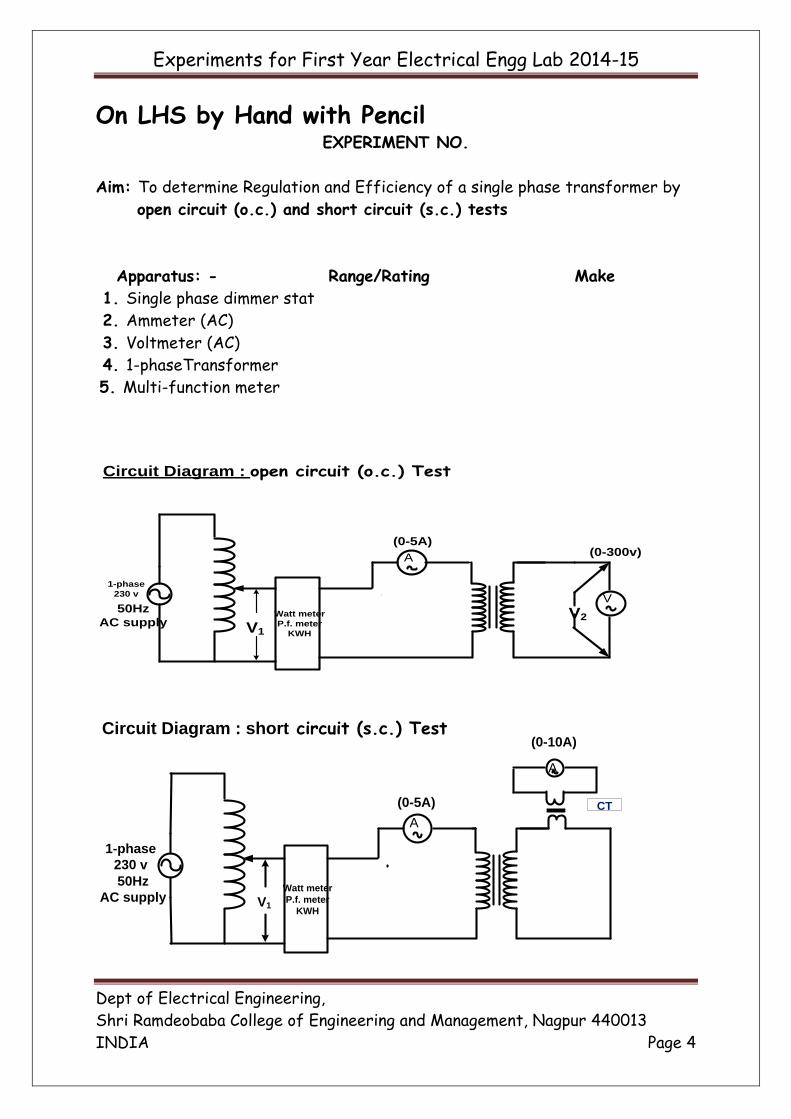
Circuit Diagram : open circuit (o.c.) Test
V2
V1
V
(0-5A)(0-300v)
50Hz
AC supply
1-phase
230 v
A
Watt meter
P.f. meter
KWH
50Hz
AC supply
A
V1
CT
Circuit Diagram : short circuit (s.c.) Test(0-10A)
(0-5A)
Experiments for First Year Electrical Engg Lab 2014-15
Dept of Electrical Engineering,
Shri Ramdeobaba College of Engineering and Management, Nagpur 440013
INDIA Page 5
On LHS by Hand with Pencil
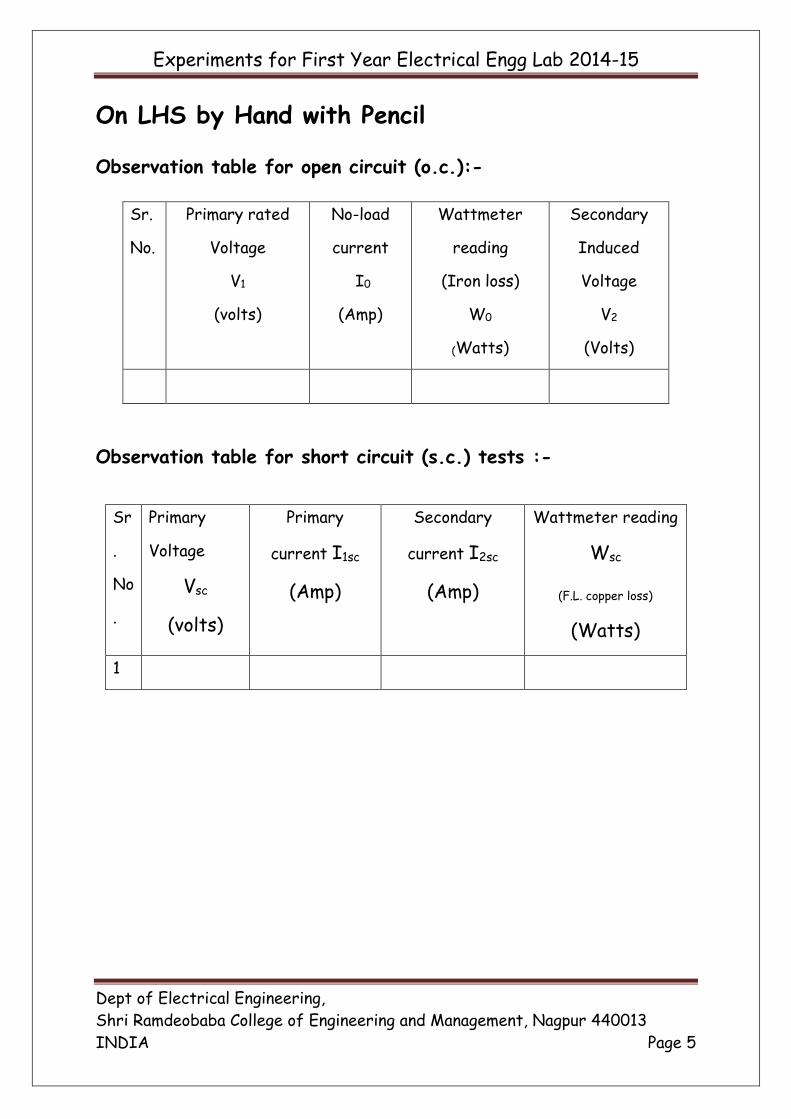
Observation table for open circuit (o.c.):-
Observation table for short circuit (s.c.) tests :-
Sr.
No.
Primary rated
Voltage
V1
(volts)
No-load
current
I0
(Amp)
Wattmeter
reading
(Iron loss)
W0
(Watts)
Secondary
Induced
Voltage
V2
(Volts)
Sr
.
No
.
Primary
Voltage
Vsc
(volts)
Primary
current I1sc
(Amp)
Secondary
current I2sc
(Amp)
Wattmeter reading
Wsc
(F.L. copper loss)
(Watts)
1
Experiments for First Year Electrical Engg Lab 2014-15
Dept of Electrical Engineering,
Shri Ramdeobaba College of Engineering and Management, Nagpur 440013
INDIA Page 6
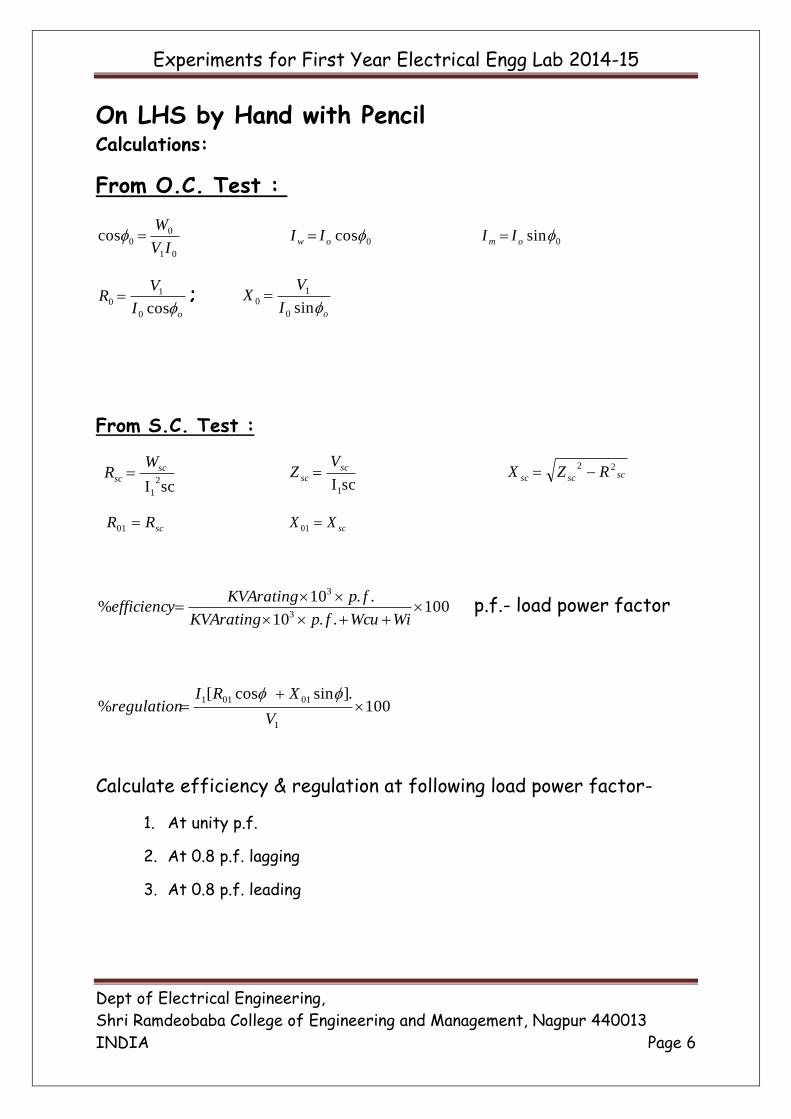
On LHS by Hand with Pencil Calculations:
From O.C. Test :
01
0
0cosIV
W 0cosow II 0sinom II
oI
VR
cos0
10 ;
oI
VX
sin0
10
From S.C. Test :
scI
2
1
scsc
WR
scI 1
sc
sc
VZ scscsc RZX 22
scRR 01 scXX 01
100..10
..10%
3
3
WiWcufpKVArating
fpKVAratingefficiency p.f.- load power factor
100].sincos[
%1
01011
V
XRIregulation
Calculate efficiency & regulation at following load power factor-
1. At unity p.f.
2. At 0.8 p.f. lagging
3. At 0.8 p.f. leading
Experiments for First Year Electrical Engg Lab 2014-15
Dept of Electrical Engineering,
Shri Ramdeobaba College of Engineering and Management, Nagpur 440013
INDIA Page 7
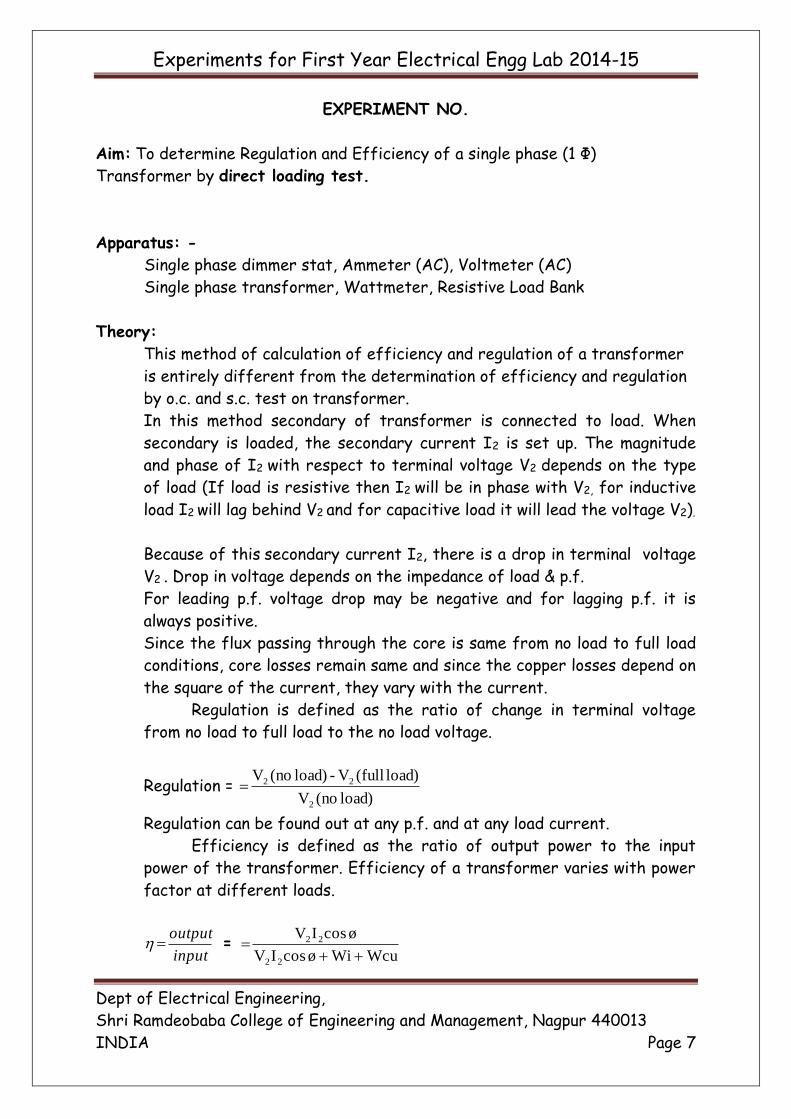
EXPERIMENT NO.
Aim: To determine Regulation and Efficiency of a single phase (1 Ф)
Transformer by direct loading test.
Apparatus: -
Single phase dimmer stat, Ammeter (AC), Voltmeter (AC)
Single phase transformer, Wattmeter, Resistive Load Bank
Theory:
This method of calculation of efficiency and regulation of a transformer
is entirely different from the determination of efficiency and regulation
by o.c. and s.c. test on transformer.
In this method secondary of transformer is connected to load. When
secondary is loaded, the secondary current I2 is set up. The magnitude
and phase of I2 with respect to terminal voltage V2 depends on the type
of load (If load is resistive then I2 will be in phase with V2, for inductive
load I2 will lag behind V2 and for capacitive load it will lead the voltage V2).
Because of this secondary current I2, there is a drop in terminal voltage
V2 . Drop in voltage depends on the impedance of load & p.f.
For leading p.f. voltage drop may be negative and for lagging p.f. it is
always positive.
Since the flux passing through the core is same from no load to full load
conditions, core losses remain same and since the copper losses depend on
the square of the current, they vary with the current.
Regulation is defined as the ratio of change in terminal voltage
from no load to full load to the no load voltage.
Regulation = load) (noV
load) (fullV-load) (noV
2
22
Regulation can be found out at any p.f. and at any load current.
Efficiency is defined as the ratio of output power to the input
power of the transformer. Efficiency of a transformer varies with power
factor at different loads.
input
output =
Wcu Wiø cosIV
ø cosIV
22
22
Experiments for First Year Electrical Engg Lab 2014-15
Dept of Electrical Engineering,
Shri Ramdeobaba College of Engineering and Management, Nagpur 440013
INDIA Page 8
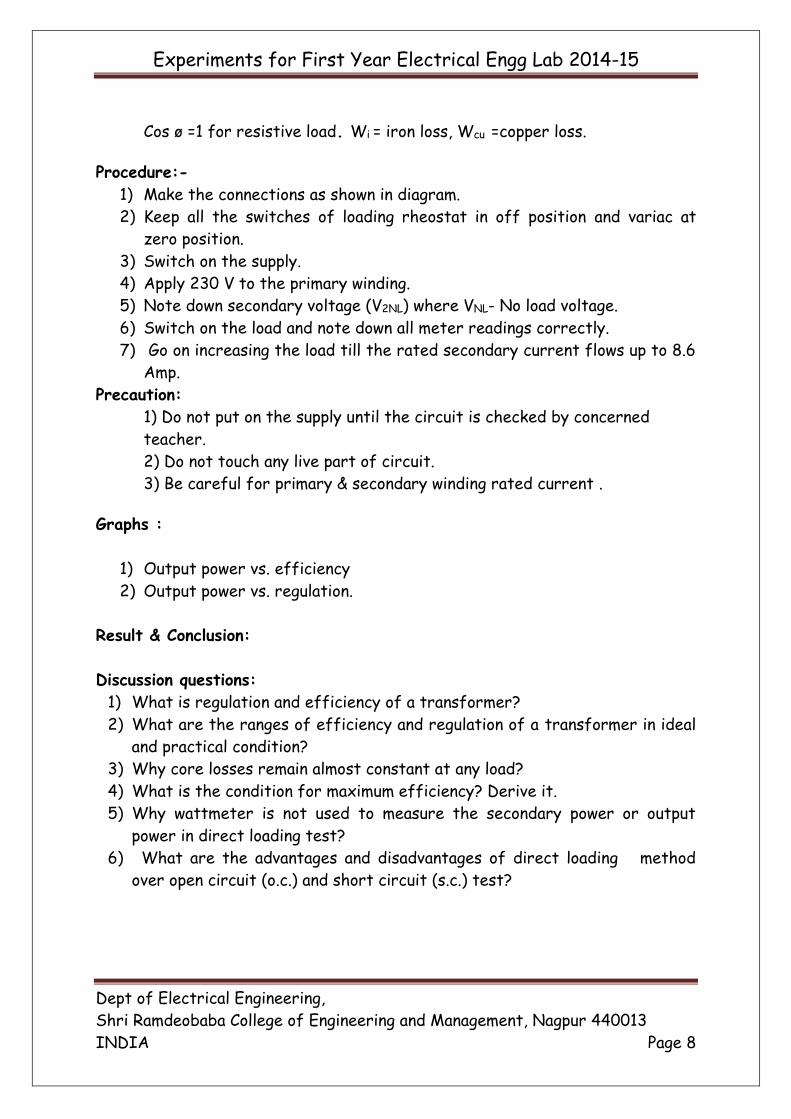
Cos ø =1 for resistive load. Wi = iron loss, Wcu =copper loss.
Procedure:-
1) Make the connections as shown in diagram.
2) Keep all the switches of loading rheostat in off position and variac at
zero position.
3) Switch on the supply.
4) Apply 230 V to the primary winding.
5) Note down secondary voltage (V2NL) where VNL- No load voltage.
6) Switch on the load and note down all meter readings correctly.
7) Go on increasing the load till the rated secondary current flows up to 8.6
Amp.
Precaution:
1) Do not put on the supply until the circuit is checked by concerned
teacher.
2) Do not touch any live part of circuit.
3) Be careful for primary & secondary winding rated current .
Graphs :
1) Output power vs. efficiency
2) Output power vs. regulation.
Result & Conclusion:
Discussion questions:
1) What is regulation and efficiency of a transformer?
2) What are the ranges of efficiency and regulation of a transformer in ideal
and practical condition?
3) Why core losses remain almost constant at any load?
4) What is the condition for maximum efficiency? Derive it.
5) Why wattmeter is not used to measure the secondary power or output
power in direct loading test?
6) What are the advantages and disadvantages of direct loading method
over open circuit (o.c.) and short circuit (s.c.) test?
Experiments for First Year Electrical Engg Lab 2014-15
Dept of Electrical Engineering,
Shri Ramdeobaba College of Engineering and Management, Nagpur 440013
INDIA Page 9
On LHS by Hand with Pencil
Apparatus: - Range/Rating Make
1. Single phase dimmer stat
2. Ammeter (AC)
3. Voltmeter (AC)
4. 1-phaseTransformer
5. Multi-function meter
6. Resistive Load Bank
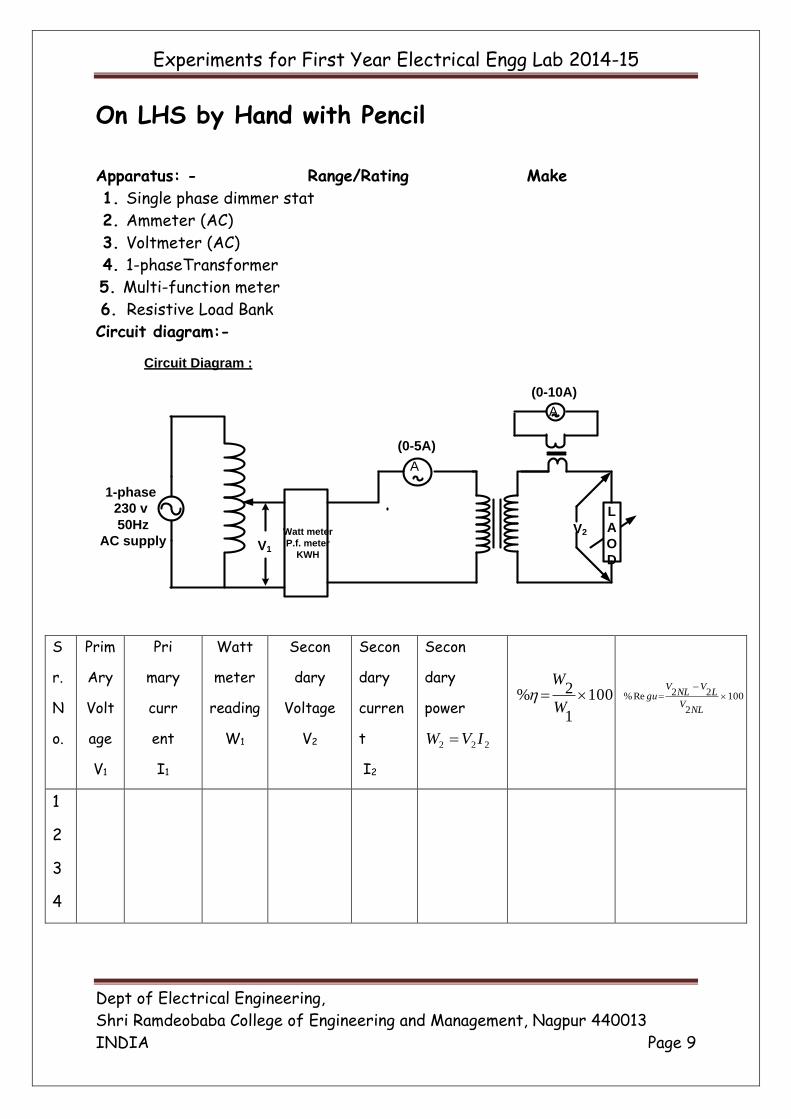
Circuit diagram:-
1-phase
230 v
A
Watt meter
P.f. meter
KWH
50Hz
AC supply
Circuit Diagram :
A
L
A
O
D
V2
V1
(0-10A)
(0-5A)
S
r.
N
o.
Prim
Ary
Volt
age
V1
Pri
mary
curr
ent
I1
Watt
meter
reading
W1
Secon
dary
Voltage
V2
Secon
dary
curren
t
I2
Secon
dary
power
222 IVW
100
1
2% W
W
100
2
22Re%
NLV
LV
NLV
gu
1
2
3
4
Experiments for First Year Electrical Engg Lab 2014-15
Dept of Electrical Engineering,
Shri Ramdeobaba College of Engineering and Management, Nagpur 440013
INDIA Page 10
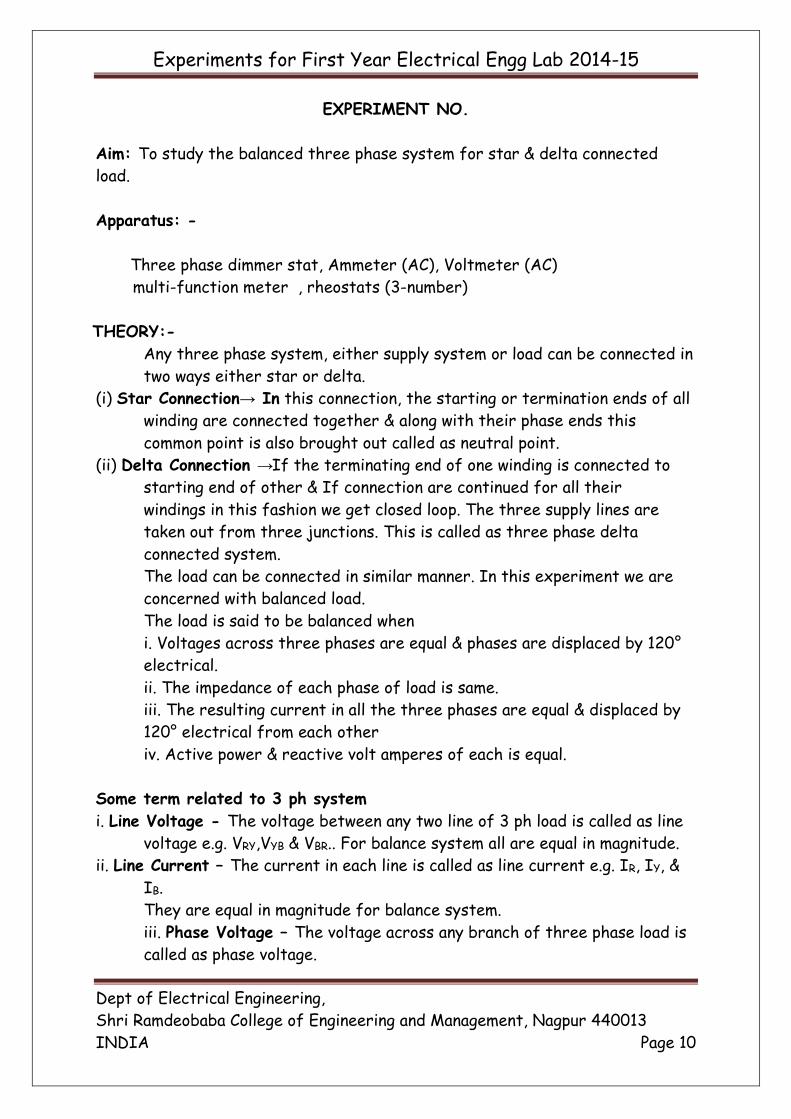
EXPERIMENT NO.
Aim: To study the balanced three phase system for star & delta connected
load.
Apparatus: -
Three phase dimmer stat, Ammeter (AC), Voltmeter (AC)
multi-function meter , rheostats (3-number)
THEORY:-
Any three phase system, either supply system or load can be connected in
two ways either star or delta.
(i) Star Connection→ In this connection, the starting or termination ends of all
winding are connected together & along with their phase ends this
common point is also brought out called as neutral point.
(ii) Delta Connection → If the terminating end of one winding is connected to
starting end of other & If connection are continued for all their
windings in this fashion we get closed loop. The three supply lines are
taken out from three junctions. This is called as three phase delta
connected system.
The load can be connected in similar manner. In this experiment we are
concerned with balanced load.
The load is said to be balanced when
i. Voltages across three phases are equal & phases are displaced by 120°
electrical.
ii. The impedance of each phase of load is same.
iii. The resulting current in all the three phases are equal & displaced by
120° electrical from each other
iv. Active power & reactive volt amperes of each is equal.
Some term related to 3 ph system
i. Line Voltage - The voltage between any two line of 3 ph load is called as line
voltage e.g. VRY,VYB & VBR.. For balance system all are equal in magnitude.
ii. Line Current – The current in each line is called as line current e.g. IR, IY, &
IB.
They are equal in magnitude for balance system.
iii. Phase Voltage – The voltage across any branch of three phase load is
called as phase voltage.
Experiments for First Year Electrical Engg Lab 2014-15
Dept of Electrical Engineering,
Shri Ramdeobaba College of Engineering and Management, Nagpur 440013
INDIA Page 11
VRN, VYN, & VBN are phase voltage
iv. Phase Current – current passing through any phase of load is called as
phase current.
For star connection of load-
Line voltage (VL) = √3 phase voltage (Vph)
Line current (IL) = Phase current (Iph)
For delta connection of load-
Line voltage (VL)= phase voltage (Vph)
Line current (IL)= √3 phase current(Iph)
The three phase power is given by,
P= power consumed by the load = √3VL IL cos( )
Where is phase angle & it depends on type of load i.e. inductive,
capacitive or resistive.
Procedure:
i. Connect circuit as shown in the circuit diagram
ii. Set demerstat to minimum position.
iii. Switch on the main supply
iv. Note the readings of ammeter, voltmeter & multifunction meter.
v. Note more readings by changing supply voltage.
Result & conclusion:
Phasor diagram: Draw the phasor diagrams for star and delta connection.
Discussion
1. What are the advantages of 3 phase system over single phase system?
2. In case of balanced load, is there any necessity of neutral wire? Why?
3. What should be the consumer load? Star or delta connected? Why?
4. What do you mean by phase sequence of three phase system?
5. If same resistance which were connected in star are connected in delta,
what will be the power consumed?
6. Show that for star connection, VL = √3 Vph &
for delta connection IL = √3 Iph.
Experiments for First Year Electrical Engg Lab 2014-15
Dept of Electrical Engineering,
Shri Ramdeobaba College of Engineering and Management, Nagpur 440013
INDIA Page 12
On LHS by Hand with Pencil EXPERIMENT NO.
Aim: To study the balanced three phase system for star & delta connected
load.
Apparatus: - Range/Rating Make
Three phase dimmer stat
Rheostats
Ammeter (AC),
Voltmeter (AC)
Multi function meter
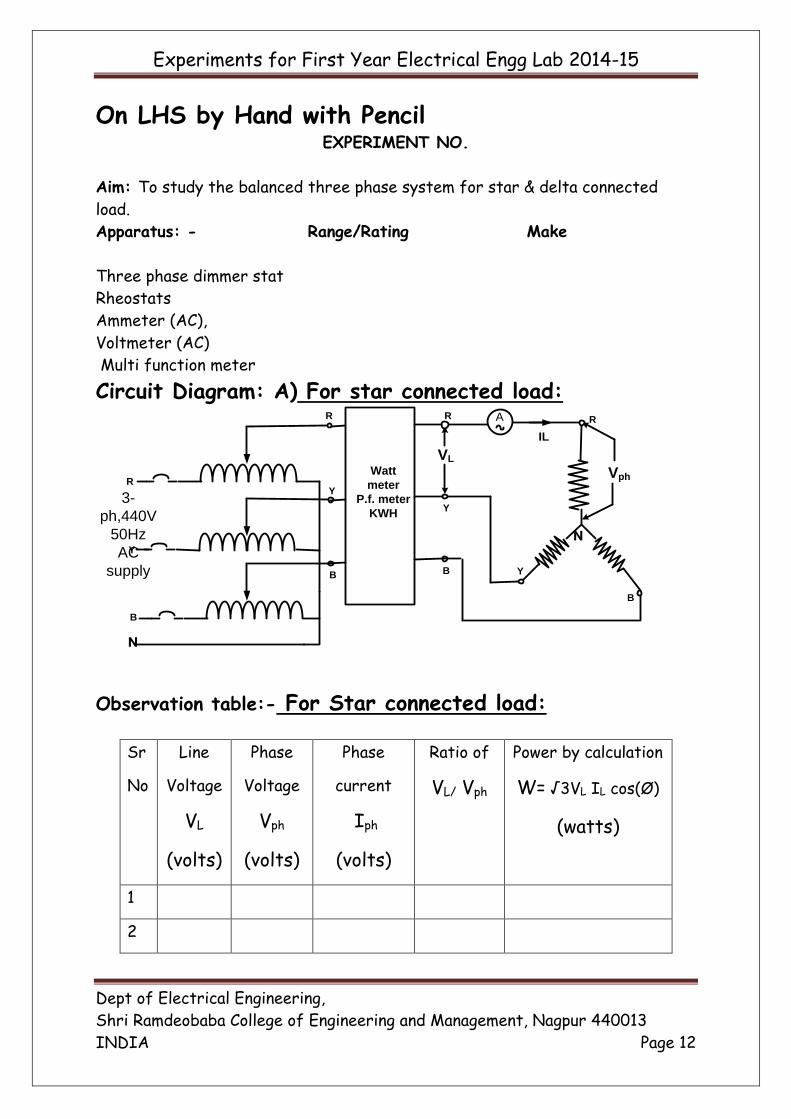
Circuit Diagram: A) For star connected load:
Watt
meter
P.f. meter
KWH
VL
VphR
B
Y
3-
ph,440V
50Hz
AC
supply
A
IL
RR R
Y
Y
YB B
B
Observation table:- For Star connected load:
Sr
No
Line
Voltage
VL
(volts)
Phase
Voltage
Vph
(volts)
Phase
current
Iph
(volts)
Ratio of
VL/ Vph
Power by calculation
W= √3VL IL cos(Ø)
(watts)
1
2

Experiments for First Year Electrical Engg Lab 2014-15
Dept of Electrical Engineering,
Shri Ramdeobaba College of Engineering and Management, Nagpur 440013
INDIA Page 13
On LHS by Hand with Pencil
Circuit Diagram: B) For Delta connected load:
Watt
meter
P.f. meter
KWH
VL
R
B
Y
3-
ph,440V
50Hz
AC
supply
A
IL
R
R R
Y
Y
Y
B B
B
A Iph
Observation table:- For Delta connected load:
Phasor diagram:
Draw phasor diagrams for star and delta connected load.
Sr No Line
Voltage
VL
(Volts)
Line
current
IL
(Amp)
Phase
current
Iph
(Amp)
Ratio of
IL / Iph
Active power by
calculation
W= √3VL IL
(watts)
1
2
3
Experiments for First Year Electrical Engg Lab 2014-15
Dept of Electrical Engineering,
Shri Ramdeobaba College of Engineering and Management, Nagpur 440013
INDIA Page 14
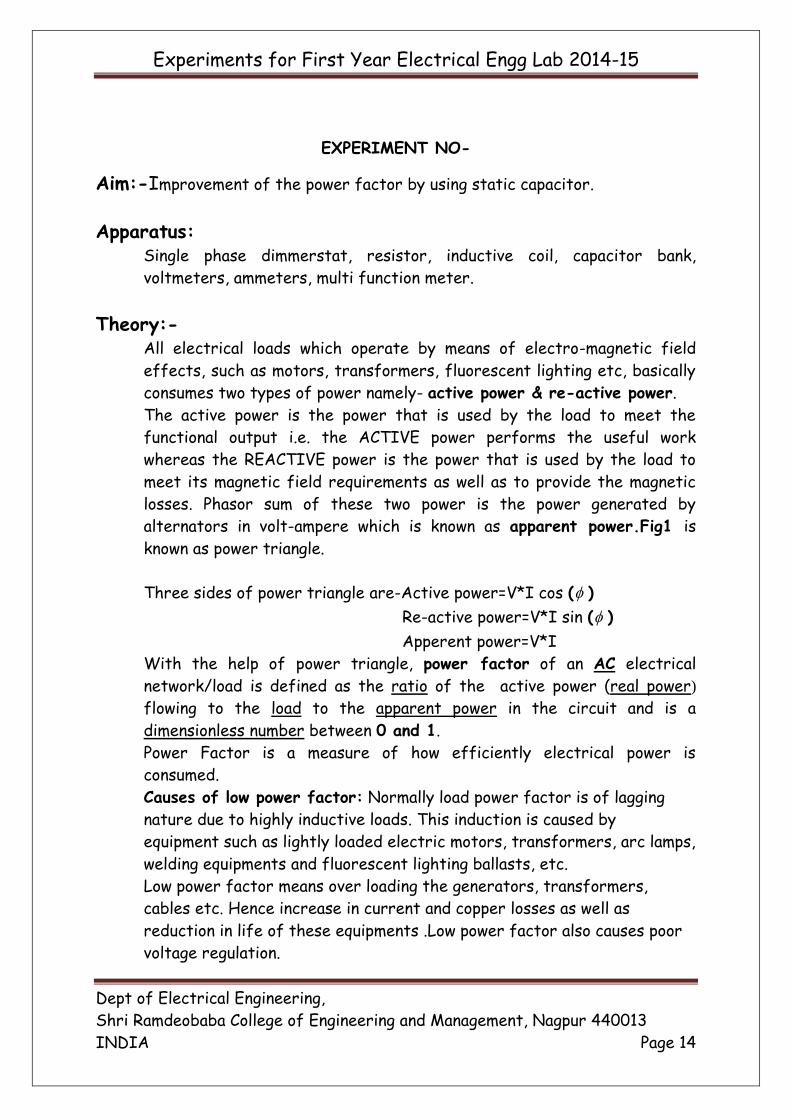
EXPERIMENT NO-
Aim:-Improvement of the power factor by using static capacitor.
Apparatus: Single phase dimmerstat, resistor, inductive coil, capacitor bank,
voltmeters, ammeters, multi function meter.
Theory:- All electrical loads which operate by means of electro-magnetic field
effects, such as motors, transformers, fluorescent lighting etc, basically
consumes two types of power namely- active power & re-active power.
The active power is the power that is used by the load to meet the
functional output i.e. the ACTIVE power performs the useful work
whereas the REACTIVE power is the power that is used by the load to
meet its magnetic field requirements as well as to provide the magnetic
losses. Phasor sum of these two power is the power generated by
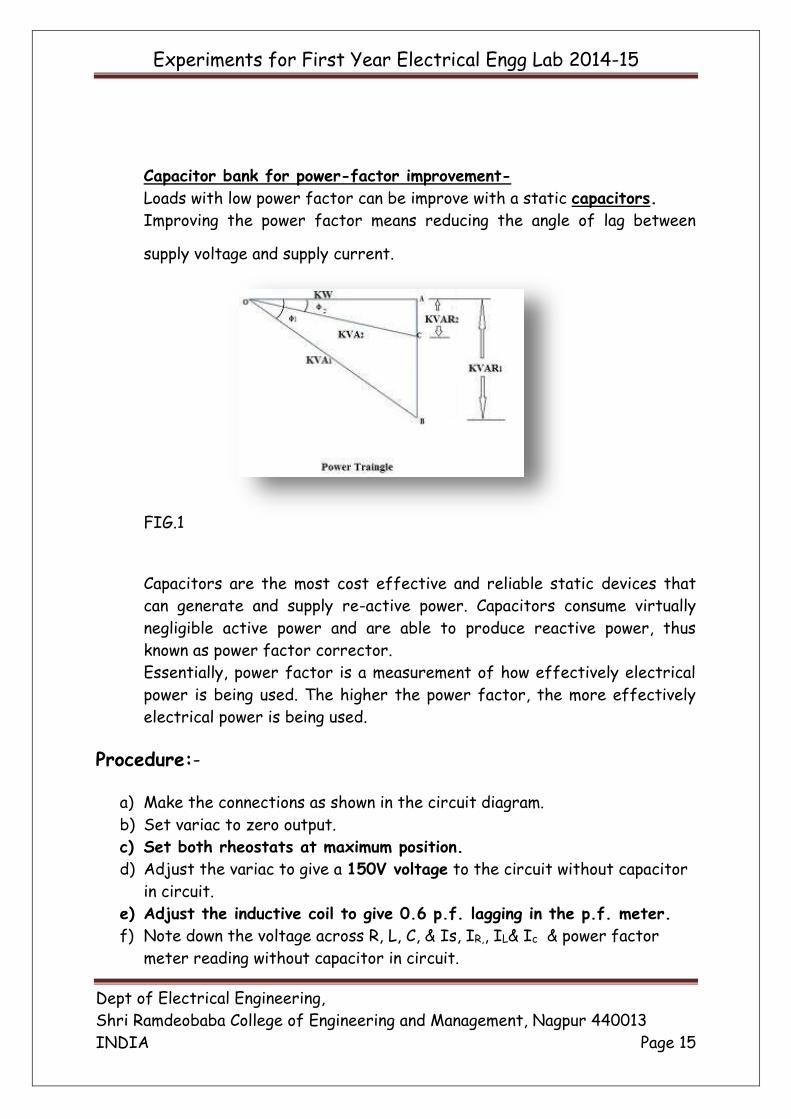
alternators in volt-ampere which is known as apparent power.Fig1 is
known as power triangle.
Three sides of power triangle are-Active power=V*I cos ( )
Re-active power=V*I sin ( )
Apperent power=V*I
With the help of power triangle, power factor of an AC electrical
network/load is defined as the ratio of the active power (real power)
flowing to the load to the apparent power in the circuit and is a
dimensionless number between 0 and 1.
Power Factor is a measure of how efficiently electrical power is
consumed.
Causes of low power factor: Normally load power factor is of lagging
nature due to highly inductive loads. This induction is caused by
equipment such as lightly loaded electric motors, transformers, arc lamps,
welding equipments and fluorescent lighting ballasts, etc.
Low power factor means over loading the generators, transformers,
cables etc. Hence increase in current and copper losses as well as
reduction in life of these equipments .Low power factor also causes poor
voltage regulation.
Experiments for First Year Electrical Engg Lab 2014-15
Dept of Electrical Engineering,
Shri Ramdeobaba College of Engineering and Management, Nagpur 440013
INDIA Page 15
Capacitor bank for power-factor improvement-
Loads with low power factor can be improve with a static capacitors.
Improving the power factor means reducing the angle of lag between
supply voltage and supply current.
FIG.1
Capacitors are the most cost effective and reliable static devices that
can generate and supply re-active power. Capacitors consume virtually
negligible active power and are able to produce reactive power, thus
known as power factor corrector.
Essentially, power factor is a measurement of how effectively electrical
power is being used. The higher the power factor, the more effectively
electrical power is being used.
Procedure:-
a) Make the connections as shown in the circuit diagram.
b) Set variac to zero output.
c) Set both rheostats at maximum position.
d) Adjust the variac to give a 150V voltage to the circuit without capacitor
in circuit.
e) Adjust the inductive coil to give 0.6 p.f. lagging in the p.f. meter.
f) Note down the voltage across R, L, C, & Is, IR,, IL& Ic & power factor
meter reading without capacitor in circuit.
Experiments for First Year Electrical Engg Lab 2014-15
Dept of Electrical Engineering,
Shri Ramdeobaba College of Engineering and Management, Nagpur 440013
INDIA Page 16
g) Take different readings for different values of capacitors in circuit &
notedown voltages, currents & p.f.meter reading in circuit.
h) Plot the graphs- i) VAr Vs p.f
ii) VAr Vs Source current Is
iii) VAr Vs cable loss (Is2 Rs)
Precaution: Put ON and OFF capacitor bank switches
slowly/carefully.
Result & Conclusion:-
Discussion:- Answer the following questions:
1) What is power factor ?
2) What is active power, re-active power, and apparent power? Write
equations of it.
3) What is power triangle?
4) What are the disadvantages of low power factor?
5) Name the apparatus (electrical gadgets) that have poor power factor.
6) Why efficiency of supply system is less with low power factor?
Experiments for First Year Electrical Engg Lab 2014-15
Dept of Electrical Engineering,
Shri Ramdeobaba College of Engineering and Management, Nagpur 440013
INDIA Page 17
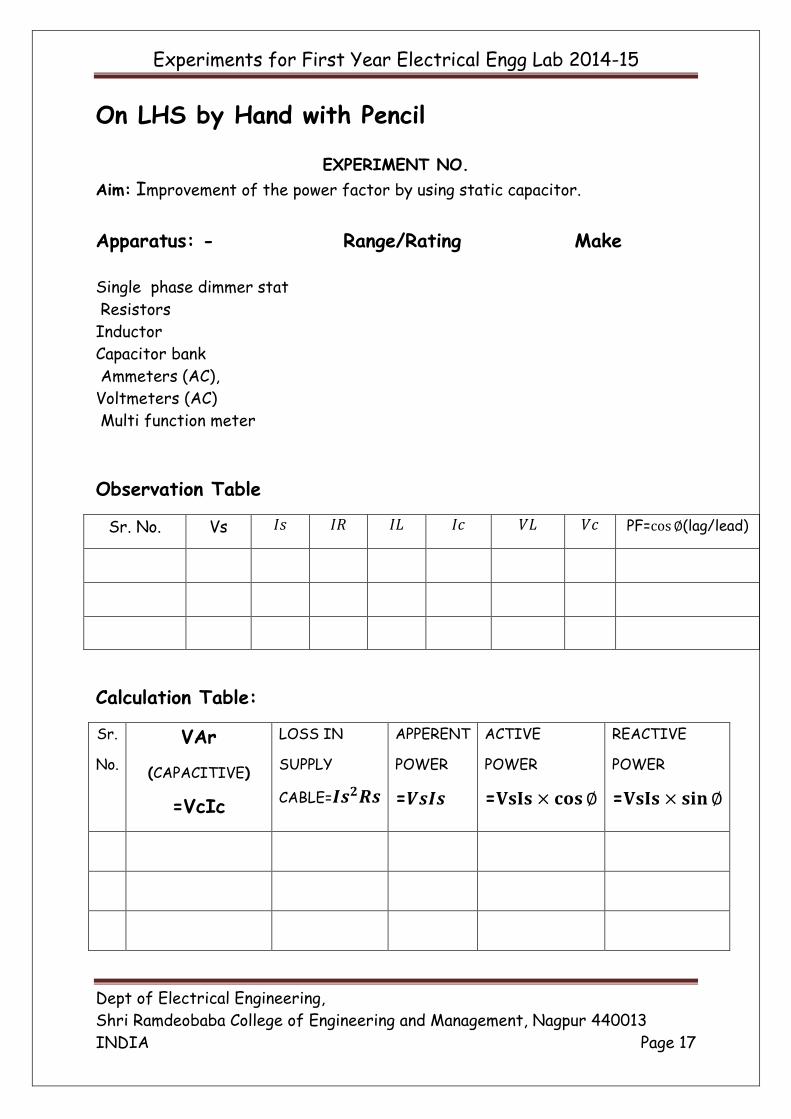
On LHS by Hand with Pencil
EXPERIMENT NO.
Aim: Improvement of the power factor by using static capacitor.
Apparatus: - Range/Rating Make
Single phase dimmer stat
Resistors
Inductor
Capacitor bank
Ammeters (AC),
Voltmeters (AC)
Multi function meter
Observation Table
Sr. No. Vs 𝐼𝑠 𝐼𝑅 𝐼𝐿 𝐼𝑐 𝑉𝐿 𝑉𝑐 PF=cos∅(lag/lead)
Calculation Table:
Sr.
No.
VAr
(CAPACITIVE)
=VcIc
LOSS IN
SUPPLY
CABLE=𝑰𝒔𝟐𝑹𝒔
APPERENT
POWER
=𝑽𝒔𝑰𝒔
ACTIVE
POWER
=𝐕𝐬𝐈𝐬 × 𝐜𝐨𝐬∅
REACTIVE
POWER
=𝐕𝐬𝐈𝐬 × 𝐬𝐢𝐧∅
Experiments for First Year Electrical Engg Lab 2014-15
Dept of Electrical Engineering,
Shri Ramdeobaba College of Engineering and Management, Nagpur 440013
INDIA Page 18
1-phase
230 v
A
A
A
Watt meter
P.f. meter
KWH
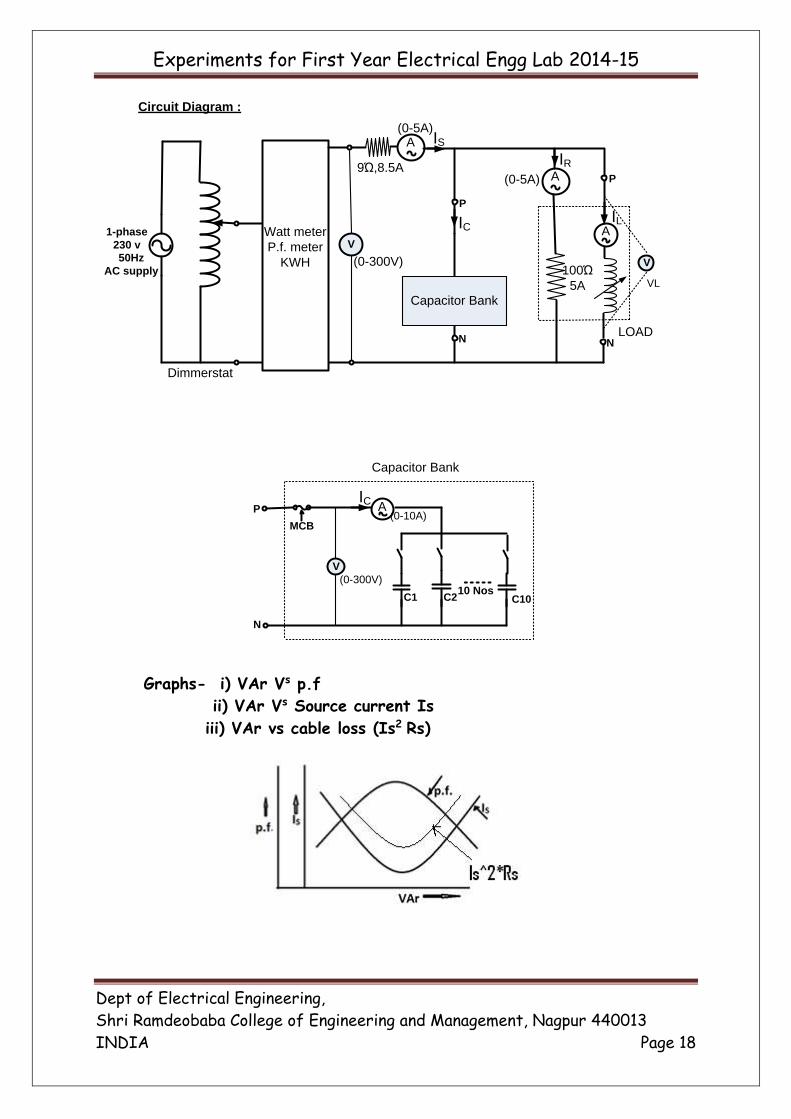
Circuit Diagram :
IS
IC
IR
IL
(0-5A)
(0-5A)
100Ώ
5ACapacitor Bank
9Ώ,8.5A
P
N
P
N
V
(0-300V)
10 Nos
A
V
(0-300V)
(0-10A)P
N
MCB
IC
C1 C2
Capacitor Bank
C10
LOAD
Dimmerstat
50Hz
AC supplyV
VL
Graphs- i) VAr Vs p.f
ii) VAr Vs Source current Is
iii) VAr vs cable loss (Is2 Rs)
Experiments for First Year Electrical Engg Lab 2014-15
Dept of Electrical Engineering,
Shri Ramdeobaba College of Engineering and Management, Nagpur 440013
INDIA Page 19
EXPERIMENT NO.
Aim: To find out the Luminous Efficacy and Polar curve of a Light Source.
Theory:
Candela, Lumen, Lux: the equations Light is measured with different techniques, and therefore there is a handful of related, but different, units of
measurements. This article gives a brief overview of the most widely used measures and presents a few equations for
conversion of one measure into another.
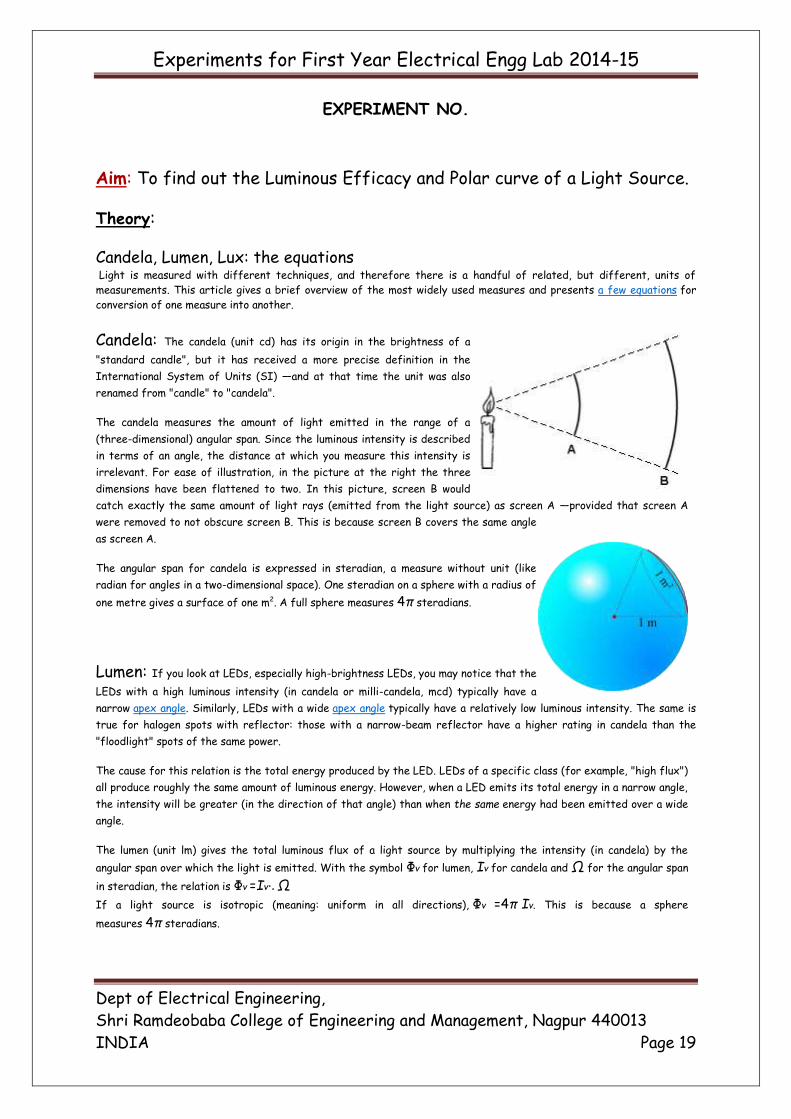
Candela: The candela (unit cd) has its origin in the brightness of a
"standard candle", but it has received a more precise definition in the
International System of Units (SI) —and at that time the unit was also
renamed from "candle" to "candela".
The candela measures the amount of light emitted in the range of a
(three-dimensional) angular span. Since the luminous intensity is described
in terms of an angle, the distance at which you measure this intensity is
irrelevant. For ease of illustration, in the picture at the right the three
dimensions have been flattened to two. In this picture, screen B would
catch exactly the same amount of light rays (emitted from the light source) as screen A —provided that screen A
were removed to not obscure screen B. This is because screen B covers the same angle
as screen A.
The angular span for candela is expressed in steradian, a measure without unit (like
radian for angles in a two-dimensional space). One steradian on a sphere with a radius of
one metre gives a surface of one m2. A full sphere measures 4π steradians.
Lumen: If you look at LEDs, especially high-brightness LEDs, you may notice that the
LEDs with a high luminous intensity (in candela or milli-candela, mcd) typically have a
narrow apex angle. Similarly, LEDs with a wide apex angle typically have a relatively low luminous intensity. The same is
true for halogen spots with reflector: those with a narrow-beam reflector have a higher rating in candela than the
"floodlight" spots of the same power.
The cause for this relation is the total energy produced by the LED. LEDs of a specific class (for example, "high flux")
all produce roughly the same amount of luminous energy. However, when a LED emits its total energy in a narrow angle,
the intensity will be greater (in the direction of that angle) than when the same energy had been emitted over a wide
angle.
The lumen (unit lm) gives the total luminous flux of a light source by multiplying the intensity (in candela) by the
angular span over which the light is emitted. With the symbol Φv for lumen, Iv for candela and Ω for the angular span
in steradian, the relation is Φv =Iv⋅. Ω
If a light source is isotropic (meaning: uniform in all directions), Φv =4π Iv. This is because a sphere
measures 4π steradians.
Experiments for First Year Electrical Engg Lab 2014-15
Dept of Electrical Engineering,
Shri Ramdeobaba College of Engineering and Management, Nagpur 440013
INDIA Page 20
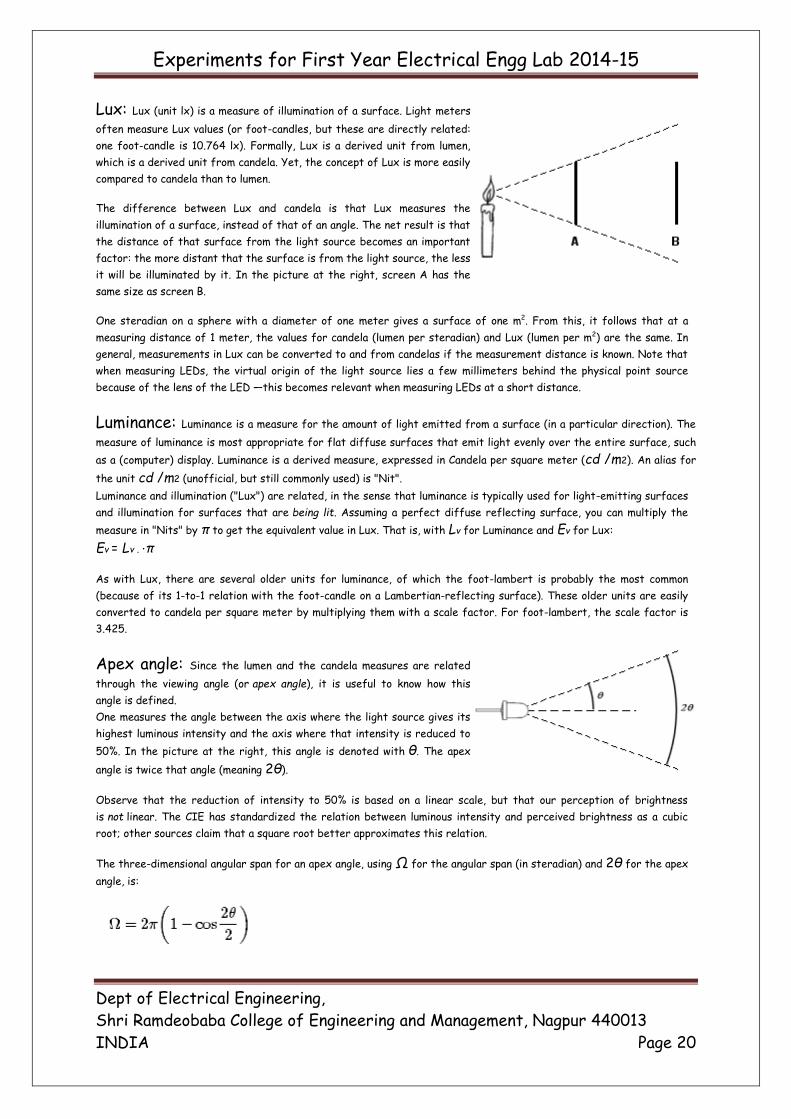
Lux: Lux (unit lx) is a measure of illumination of a surface. Light meters
often measure Lux values (or foot-candles, but these are directly related:
one foot-candle is 10.764 lx). Formally, Lux is a derived unit from lumen,
which is a derived unit from candela. Yet, the concept of Lux is more easily
compared to candela than to lumen.
The difference between Lux and candela is that Lux measures the
illumination of a surface, instead of that of an angle. The net result is that
the distance of that surface from the light source becomes an important
factor: the more distant that the surface is from the light source, the less
it will be illuminated by it. In the picture at the right, screen A has the
same size as screen B.
One steradian on a sphere with a diameter of one meter gives a surface of one m2. From this, it follows that at a
measuring distance of 1 meter, the values for candela (lumen per steradian) and Lux (lumen per m2) are the same. In
general, measurements in Lux can be converted to and from candelas if the measurement distance is known. Note that
when measuring LEDs, the virtual origin of the light source lies a few millimeters behind the physical point source
because of the lens of the LED —this becomes relevant when measuring LEDs at a short distance.
Luminance: Luminance is a measure for the amount of light emitted from a surface (in a particular direction). The
measure of luminance is most appropriate for flat diffuse surfaces that emit light evenly over the entire surface, such
as a (computer) display. Luminance is a derived measure, expressed in Candela per square meter (cd /m2). An alias for
the unit cd /m2 (unofficial, but still commonly used) is "Nit".
Luminance and illumination ("Lux") are related, in the sense that luminance is typically used for light-emitting surfaces
and illumination for surfaces that are being lit. Assuming a perfect diffuse reflecting surface, you can multiply the
measure in "Nits" by π to get the equivalent value in Lux. That is, with Lv for Luminance and Ev for Lux:
Ev = Lv . ⋅π
As with Lux, there are several older units for luminance, of which the foot-lambert is probably the most common
(because of its 1-to-1 relation with the foot-candle on a Lambertian-reflecting surface). These older units are easily
converted to candela per square meter by multiplying them with a scale factor. For foot-lambert, the scale factor is
3.425.
Apex angle: Since the lumen and the candela measures are related
through the viewing angle (or apex angle), it is useful to know how this
angle is defined.
One measures the angle between the axis where the light source gives its
highest luminous intensity and the axis where that intensity is reduced to
50%. In the picture at the right, this angle is denoted with θ. The apex
angle is twice that angle (meaning 2θ).
Observe that the reduction of intensity to 50% is based on a linear scale, but that our perception of brightness
is not linear. The CIE has standardized the relation between luminous intensity and perceived brightness as a cubic
root; other sources claim that a square root better approximates this relation.
The three-dimensional angular span for an apex angle, using Ω for the angular span (in steradian) and 2θ for the apex
angle, is:
Experiments for First Year Electrical Engg Lab 2014-15
Dept of Electrical Engineering,
Shri Ramdeobaba College of Engineering and Management, Nagpur 440013
INDIA Page 21
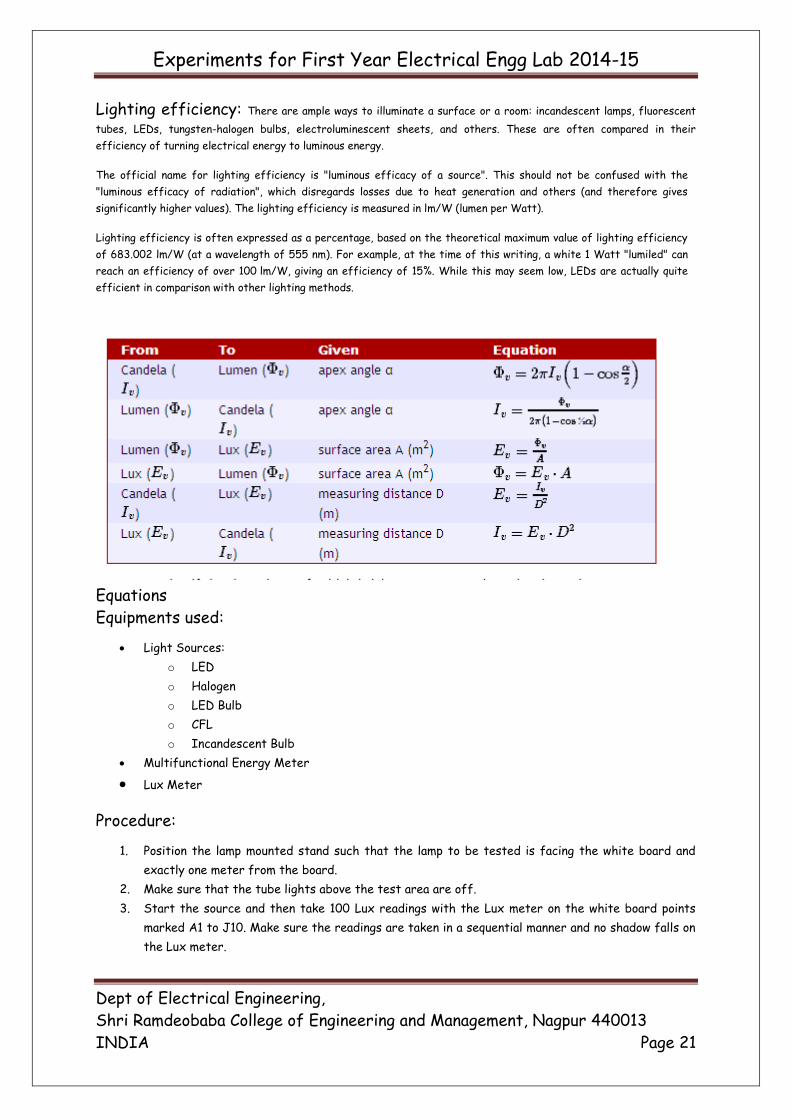
Lighting efficiency: There are ample ways to illuminate a surface or a room: incandescent lamps, fluorescent
tubes, LEDs, tungsten-halogen bulbs, electroluminescent sheets, and others. These are often compared in their
efficiency of turning electrical energy to luminous energy.
The official name for lighting efficiency is "luminous efficacy of a source". This should not be confused with the
"luminous efficacy of radiation", which disregards losses due to heat generation and others (and therefore gives
significantly higher values). The lighting efficiency is measured in lm/W (lumen per Watt).
Lighting efficiency is often expressed as a percentage, based on the theoretical maximum value of lighting efficiency
of 683.002 lm/W (at a wavelength of 555 nm). For example, at the time of this writing, a white 1 Watt "lumiled" can
reach an efficiency of over 100 lm/W, giving an efficiency of 15%. While this may seem low, LEDs are actually quite
efficient in comparison with other lighting methods.
Equations
Equipments used:
Light Sources:
o LED
o Halogen
o LED Bulb
o CFL
o Incandescent Bulb
Multifunctional Energy Meter
Lux Meter
Procedure:
1. Position the lamp mounted stand such that the lamp to be tested is facing the white board and
exactly one meter from the board.
2. Make sure that the tube lights above the test area are off.
3. Start the source and then take 100 Lux readings with the Lux meter on the white board points
marked A1 to J10. Make sure the readings are taken in a sequential manner and no shadow falls on
the Lux meter.
Experiments for First Year Electrical Engg Lab 2014-15
Dept of Electrical Engineering,
Shri Ramdeobaba College of Engineering and Management, Nagpur 440013
INDIA Page 22
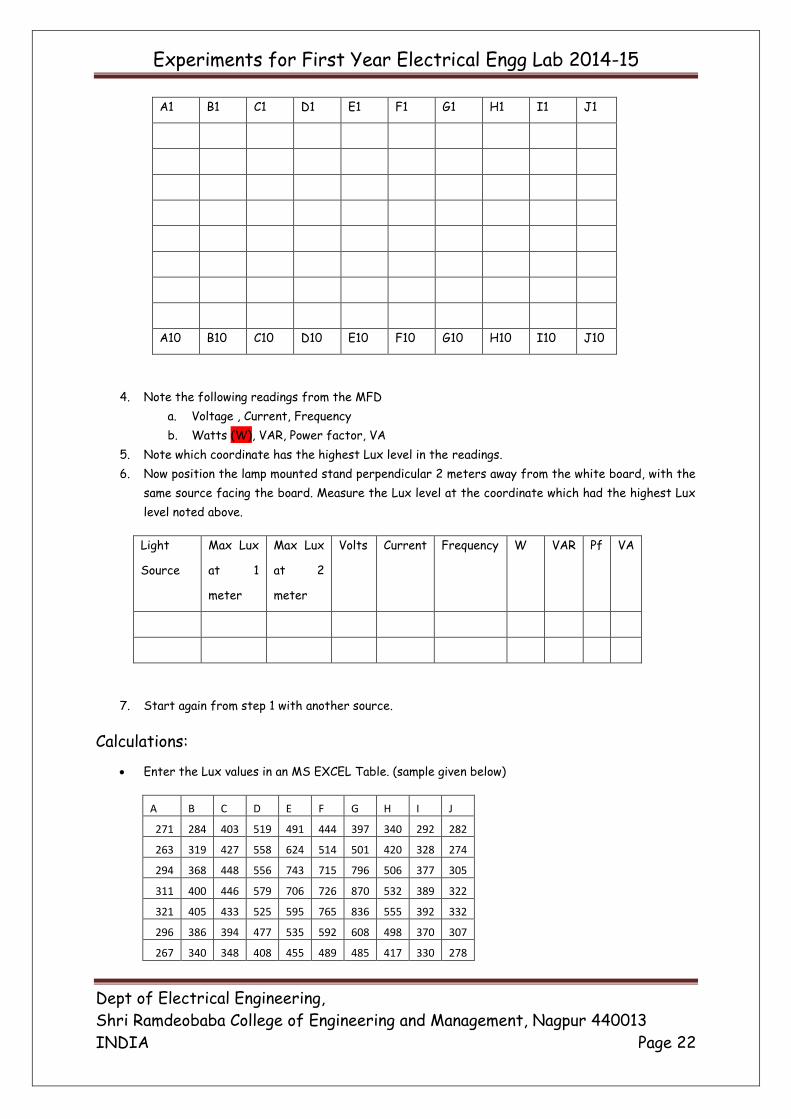
A1 B1 C1 D1 E1 F1 G1 H1 I1 J1
A10 B10 C10 D10 E10 F10 G10 H10 I10 J10
4. Note the following readings from the MFD
a. Voltage , Current, Frequency
b. Watts (W), VAR, Power factor, VA
5. Note which coordinate has the highest Lux level in the readings.
6. Now position the lamp mounted stand perpendicular 2 meters away from the white board, with the
same source facing the board. Measure the Lux level at the coordinate which had the highest Lux
level noted above.
Light
Source
Max Lux
at 1
meter
Max Lux
at 2
meter
Volts Current Frequency W VAR Pf VA
7. Start again from step 1 with another source.
Calculations:
Enter the Lux values in an MS EXCEL Table. (sample given below)
A B C D E F G H I J
271 284 403 519 491 444 397 340 292 282
263 319 427 558 624 514 501 420 328 274
294 368 448 556 743 715 796 506 377 305
311 400 446 579 706 726 870 532 389 322
321 405 433 525 595 765 836 555 392 332
296 386 394 477 535 592 608 498 370 307
267 340 348 408 455 489 485 417 330 278
Experiments for First Year Electrical Engg Lab 2014-15
Dept of Electrical Engineering,
Shri Ramdeobaba College of Engineering and Management, Nagpur 440013
INDIA Page 23
235 287 290 342 365 371 402 351 287 246
200 239 245 275 295 306 321 287 237 213
165 184 222 221 234 244 273 222 196 174
155 171 200 201 210 215 240 201 180 163
Select all cells and find out the average Lux level. (AVG LUX)
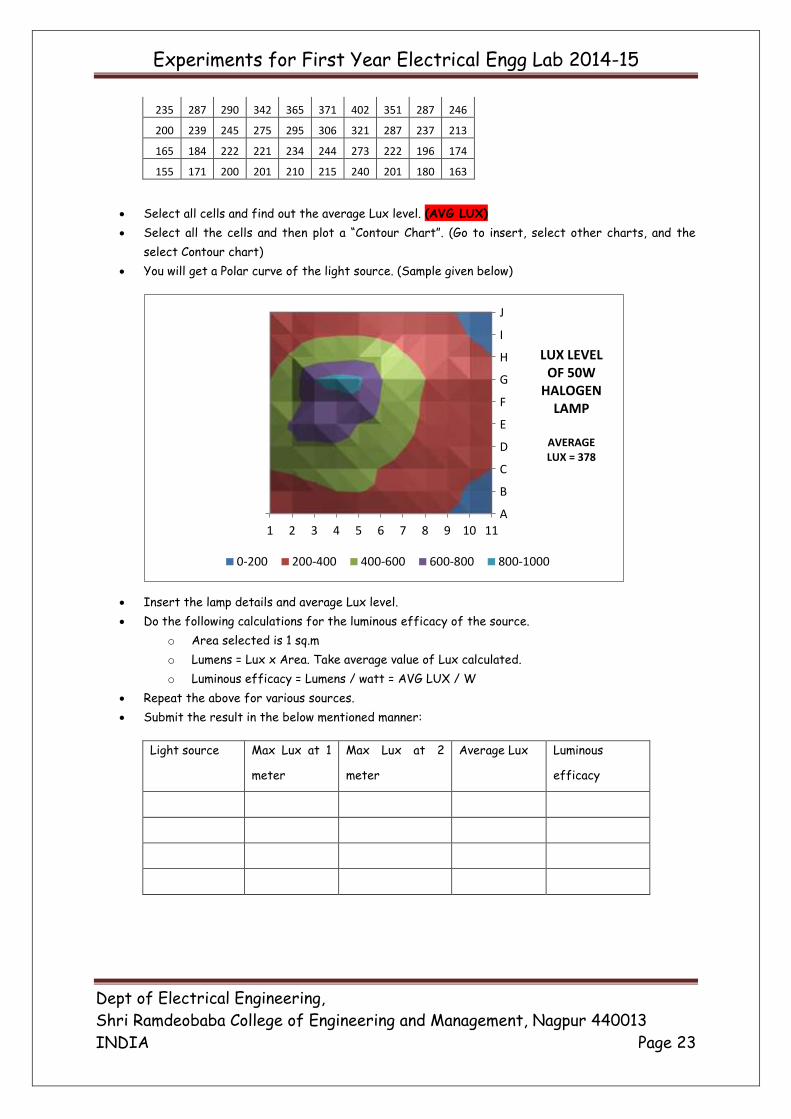
Select all the cells and then plot a “Contour Chart”. (Go to insert, select other charts, and the
select Contour chart)
You will get a Polar curve of the light source. (Sample given below)
Insert the lamp details and average Lux level.
Do the following calculations for the luminous efficacy of the source.
o Area selected is 1 sq.m
o Lumens = Lux x Area. Take average value of Lux calculated.
o Luminous efficacy = Lumens / watt = AVG LUX / W
Repeat the above for various sources.
Submit the result in the below mentioned manner:
Light source Max Lux at 1
meter
Max Lux at 2
meter
Average Lux Luminous
efficacy
A
B
C
D
E
F
G
H
I
J
1 2 3 4 5 6 7 8 9 10 11
0-200 200-400 400-600 600-800 800-1000
LUX LEVEL OF 50W
HALOGEN LAMP
AVERAGE LUX = 378