EXPERIMENTS AND SIMULATIONS OF POST WELD TREATMENT WITH HIGH FREQUENCY NEEDLE … · ·...
22
Advanced Steel Construction Vol. 5, No. 3, pp. 237-258 (2009) 237 EXPERIMENTS AND SIMULATIONS OF POST WELD TREATMENT WITH HIGH FREQUENCY NEEDLE PEENING FOR WELDED JOINTS P. Schaumann and C. Keindorf * Institute for Steel Construction, Leibniz University Hannover Appelstr. 9A, 30167 Hannover, Germany *(Corresponding author: E-mail: [email protected]) Received: 8 October 2007; Revised: 21 January 2008; Accepted: 30 January 2008 ABSTRACT: This paper deals with fatigue tests on welded joints carried out in order to estimate the influence of a post weld treatment method called Ultrasonic Impact Treatment. With this method the fatigue resistance could be increased significantly. Furthermore, tubular joints of tripods were analysed with numerical simulations to judge these welded joints with the hot-spot-concept. The stress concentration factor for the treated weld toe geometry was determined numerically and compared to experimental results. In the next step numerical simulations were carried out for seam butt welds using an arc welding process followed by a process of UIT. The objective of these numerical investigations was to analyse the influence of residual stresses on the fatigue life for welded steel plates with and without post weld treatment. The fatigue life until crack initiation was calculated applying the notch strain approach. Both, experimental and numerical investigations attested a significant increase in fatigue resistance due to the post weld treatment by UIT compared to the as-welded condition. Keywords: Welded joints, post weld treatment, needle peening, fatigue, uit, offshore, wind energy 1. INTRODUCTION For the planned German offshore wind farm Kriegers Flak in the Baltic Sea a fatigue design study was carried out including experimental and numerical investigations for welded joints of a tripod. A tripod is one kind of a supporting structure for wind energy converters as shown in Figure 1. The calculations took into account on Baltic Sea conditions with 25 m water depth and for a 2 MW turbine. The welded joints were designed for a fatigue life of 20 years with numerical simulation based on the hot-spot-concept. Furthermore, experiments were carried out to determine the fatigue resistance for such welded joints. Because of the large dimensions of tripods fatigue tests can not be performed in full scale. Hence, a small representative sector of the joint was tested. 12 specimen (Y-joints) were tested with t c = 90 mm thickness for the chord and t b = 40 mm for the brace welded in an angle of = 60°. The plate thicknesses are comparable with those of tripods. The objective of these tests was to quantify the fatigue resistance for welded joints with thick plates. Additionally, the influence of post weld treatment by Ultrasonic Impact Treatment (UIT) should be investigated. This method introduces compressive stresses and plastic deformations the weld toe, reducing residual stresses and stress concentrations. Because of these effects the fatigue strength increases significantly compared to as welded conditions. Furthermore, different types of tubular joints for offshore structures were investigated with numerical simulations to estimate the fatigue limit state for both conditions, as welded and treated by UIT. The stress concentration factors (SCF) for the treated weld toe geometry were determined numerically using sub-model analysis and compared to experimental results. Finally a comparison between welded and cast iron joints was carried out in a fatigue design study under consideration of UIT-effects. The Hong Kong Institute of Steel Construction www.hkisc.org
Transcript of EXPERIMENTS AND SIMULATIONS OF POST WELD TREATMENT WITH HIGH FREQUENCY NEEDLE … · ·...

Advanced Steel Construction Vol. 5, No. 3, pp. 237-258 (2009) 237
EXPERIMENTS AND SIMULATIONS OF POST WELD TREATMENT WITH HIGH FREQUENCY
NEEDLE PEENING FOR WELDED JOINTS
P. Schaumann and C. Keindorf *
Institute for Steel Construction, Leibniz University Hannover
Appelstr. 9A, 30167 Hannover, Germany *(Corresponding author: E-mail: [email protected])
Received: 8 October 2007; Revised: 21 January 2008; Accepted: 30 January 2008
ABSTRACT: This paper deals with fatigue tests on welded joints carried out in order to estimate the influence of a post weld treatment method called Ultrasonic Impact Treatment. With this method the fatigue resistance could be increased significantly. Furthermore, tubular joints of tripods were analysed with numerical simulations to judge these welded joints with the hot-spot-concept. The stress concentration factor for the treated weld toe geometry was determined numerically and compared to experimental results. In the next step numerical simulations were carried out for seam butt welds using an arc welding process followed by a process of UIT. The objective of these numerical investigations was to analyse the influence of residual stresses on the fatigue life for welded steel plates with and without post weld treatment. The fatigue life until crack initiation was calculated applying the notch strain approach. Both, experimental and numerical investigations attested a significant increase in fatigue resistance due to the post weld treatment by UIT compared to the as-welded condition. Keywords: Welded joints, post weld treatment, needle peening, fatigue, uit, offshore, wind energy
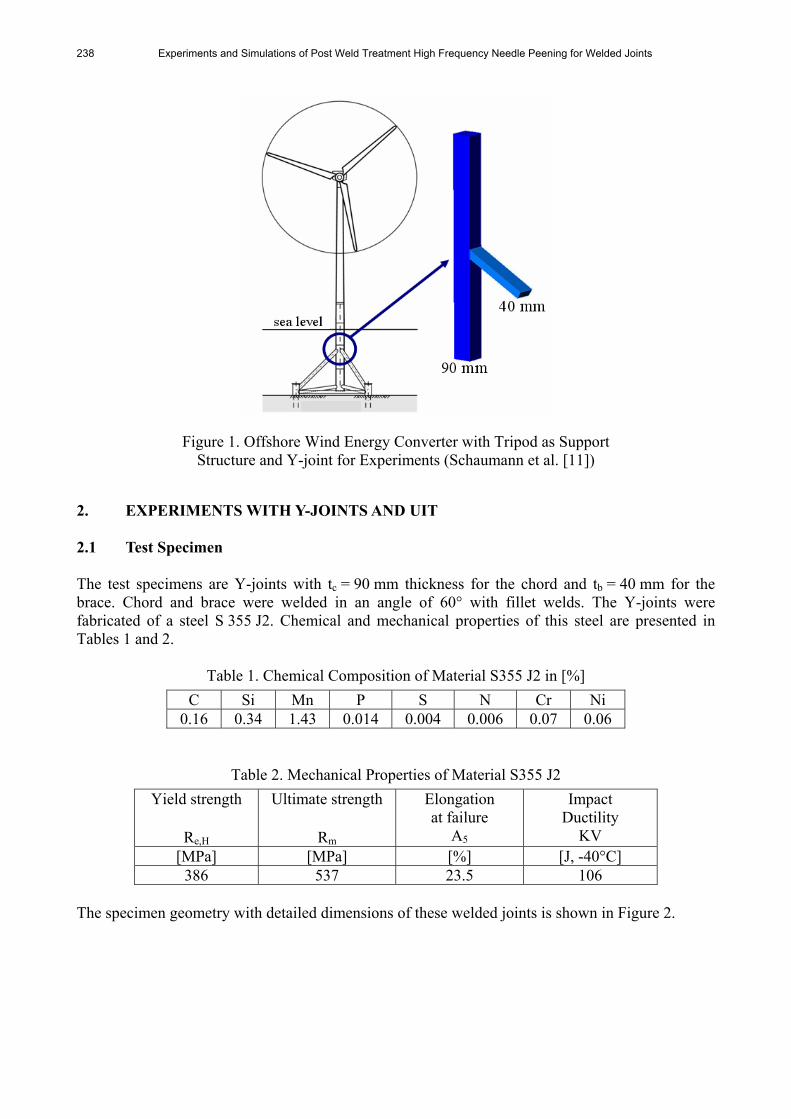
1. INTRODUCTION For the planned German offshore wind farm Kriegers Flak in the Baltic Sea a fatigue design study was carried out including experimental and numerical investigations for welded joints of a tripod. A tripod is one kind of a supporting structure for wind energy converters as shown in Figure 1. The calculations took into account on Baltic Sea conditions with 25 m water depth and for a 2 MW turbine. The welded joints were designed for a fatigue life of 20 years with numerical simulation based on the hot-spot-concept. Furthermore, experiments were carried out to determine the fatigue resistance for such welded joints. Because of the large dimensions of tripods fatigue tests can not be performed in full scale. Hence, a small representative sector of the joint was tested. 12 specimen (Y-joints) were tested with tc = 90 mm thickness for the chord and tb = 40 mm for the brace welded in an angle of = 60°. The plate thicknesses are comparable with those of tripods. The objective of these tests was to quantify the fatigue resistance for welded joints with thick plates. Additionally, the influence of post weld treatment by Ultrasonic Impact Treatment (UIT) should be investigated. This method introduces compressive stresses and plastic deformations the weld toe, reducing residual stresses and stress concentrations. Because of these effects the fatigue strength increases significantly compared to as welded conditions. Furthermore, different types of tubular joints for offshore structures were investigated with numerical simulations to estimate the fatigue limit state for both conditions, as welded and treated by UIT. The stress concentration factors (SCF) for the treated weld toe geometry were determined numerically using sub-model analysis and compared to experimental results. Finally a comparison between welded and cast iron joints was carried out in a fatigue design study under consideration of UIT-effects.
The Hong Kong Institute of Steel Construction www.hkisc.org
238 Experiments and Simulations of Post Weld Treatment High Frequency Needle Peening for Welded Joints
Figure 1. Offshore Wind Energy Converter with Tripod as Support Structure and Y-joint for Experiments (Schaumann et al. [11])
2. EXPERIMENTS WITH Y-JOINTS AND UIT 2.1 Test Specimen The test specimens are Y-joints with tc = 90 mm thickness for the chord and tb = 40 mm for the brace. Chord and brace were welded in an angle of 60° with fillet welds. The Y-joints were fabricated of a steel S 355 J2. Chemical and mechanical properties of this steel are presented in Tables 1 and 2.
Table 1. Chemical Composition of Material S355 J2 in [%]
C Si Mn P S N Cr Ni 0.16 0.34 1.43 0.014 0.004 0.006 0.07 0.06
Table 2. Mechanical Properties of Material S355 J2 Yield strength
Re,H
Ultimate strength
Rm
Elongation at failure
A5
Impact Ductility
KV
[MPa] [MPa] [%] [J, -40°C] 386 537 23.5 106
The specimen geometry with detailed dimensions of these welded joints is shown in Figure 2.
P. Schaumann and C. Keindorf 239
Figure 2. Test Specimen
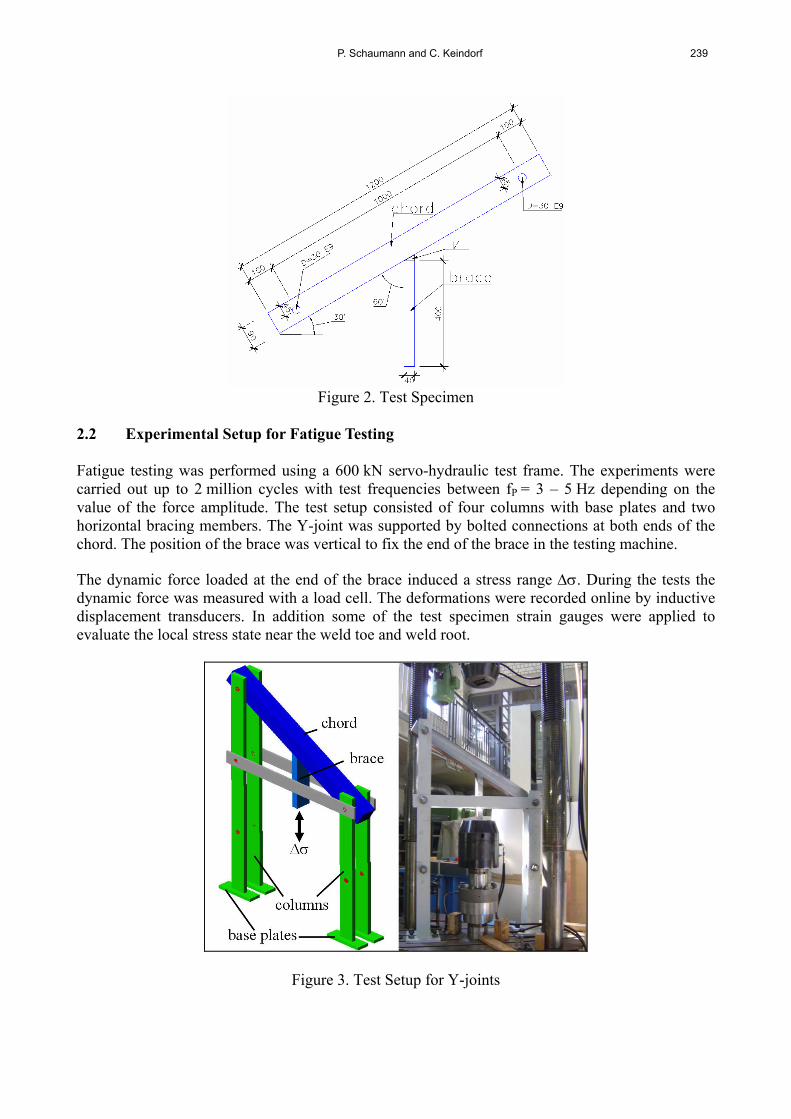
2.2 Experimental Setup for Fatigue Testing Fatigue testing was performed using a 600 kN servo-hydraulic test frame. The experiments were carried out up to 2 million cycles with test frequencies between fP = 3 – 5 Hz depending on the value of the force amplitude. The test setup consisted of four columns with base plates and two horizontal bracing members. The Y-joint was supported by bolted connections at both ends of the chord. The position of the brace was vertical to fix the end of the brace in the testing machine. The dynamic force loaded at the end of the brace induced a stress range . During the tests the dynamic force was measured with a load cell. The deformations were recorded online by inductive displacement transducers. In addition some of the test specimen strain gauges were applied to evaluate the local stress state near the weld toe and weld root.
Figure 3. Test Setup for Y-joints
240 Experiments and Simulations of Post Weld Treatment High Frequency Needle Peening for Welded Joints
2.3 Ultrasonic Impact Treatment (UIT) after welding Due to the plate thickness effect the fatigue resistance has to be reduced according to offshore-guideline (Germanischer Lloyd [1]). For example the reduced fatigue resistance at the chord is given by:
0.25
refc,red c c
c
t0.73
t
(1)
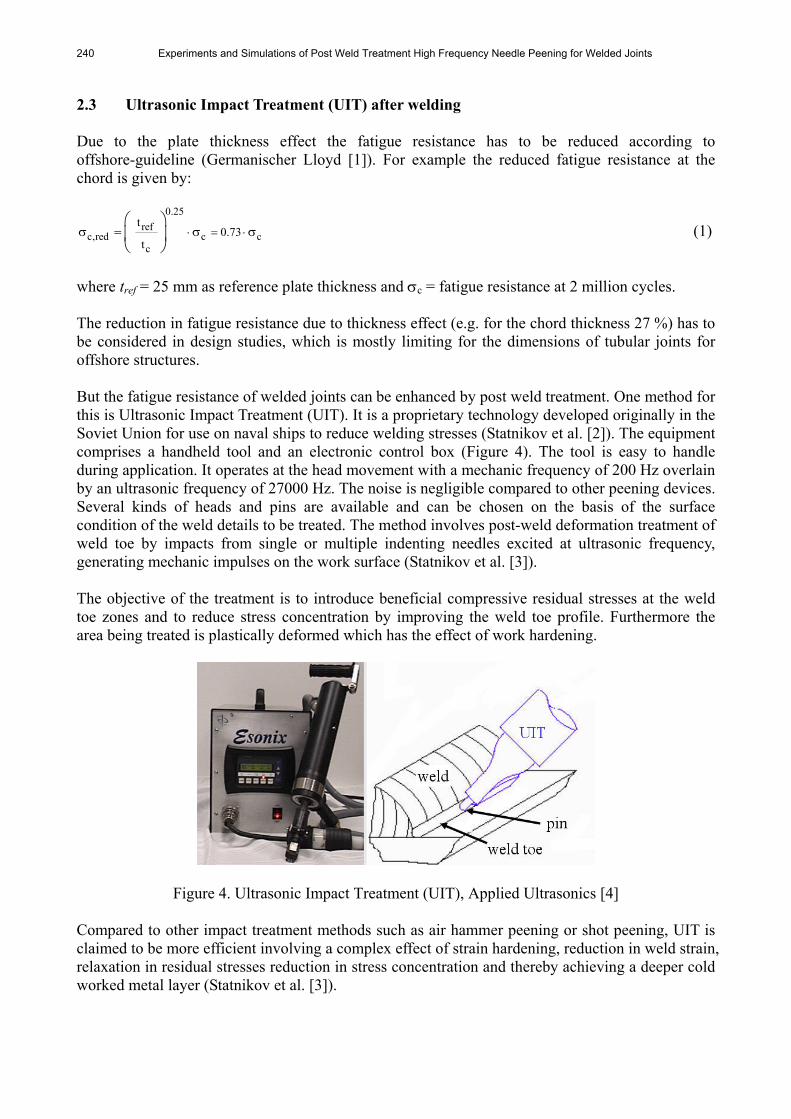
where tref = 25 mm as reference plate thickness and c = fatigue resistance at 2 million cycles. The reduction in fatigue resistance due to thickness effect (e.g. for the chord thickness 27 %) has to be considered in design studies, which is mostly limiting for the dimensions of tubular joints for offshore structures. But the fatigue resistance of welded joints can be enhanced by post weld treatment. One method for this is Ultrasonic Impact Treatment (UIT). It is a proprietary technology developed originally in the Soviet Union for use on naval ships to reduce welding stresses (Statnikov et al. [2]). The equipment comprises a handheld tool and an electronic control box (Figure 4). The tool is easy to handle during application. It operates at the head movement with a mechanic frequency of 200 Hz overlain by an ultrasonic frequency of 27000 Hz. The noise is negligible compared to other peening devices. Several kinds of heads and pins are available and can be chosen on the basis of the surface condition of the weld details to be treated. The method involves post-weld deformation treatment of weld toe by impacts from single or multiple indenting needles excited at ultrasonic frequency, generating mechanic impulses on the work surface (Statnikov et al. [3]). The objective of the treatment is to introduce beneficial compressive residual stresses at the weld toe zones and to reduce stress concentration by improving the weld toe profile. Furthermore the area being treated is plastically deformed which has the effect of work hardening.
Figure 4. Ultrasonic Impact Treatment (UIT), Applied Ultrasonics [4] Compared to other impact treatment methods such as air hammer peening or shot peening, UIT is claimed to be more efficient involving a complex effect of strain hardening, reduction in weld strain, relaxation in residual stresses reduction in stress concentration and thereby achieving a deeper cold worked metal layer (Statnikov et al. [3]).
P. Schaumann and C. Keindorf 241
2.4 Test Program The test program comprises two test series on Y-joints with and without post weld treatment by UIT (Table 3). The first test series without post weld treatment (Y_1 - Y_6) was carried out to get a reference S-N-curve for Y-joints for the as-welded condition. The dynamic loads were recorded as nominal stress ranges n which were varied for the test specimens. The ratio between minimum and maximum stresses was R = min / max = 0.08 – 0.16 depending on the servo-hydraulic system of the testing machine. The second test series (Y_7 - Y_12) have been performed with the same procedure like the first test series but with additional post weld treatment by UIT. The treatment was carried out according to the manufacturer’s procedure document [4]. The indenter consisted of three 3 mm diameter pins, fitted in a single holder. The treatment was carried out in short multiple passes.
Table 3. Test Program Test weld toe n R N Test
series No. [-] [MPa] [-] [·106] Y_1 as welded 28.8 0.13 0.12 Y_2 as welded 25.6 0.08 0.15 Y_3 as welded 15.0 0.15 1.10 Y_4 as welded 19.8 0.13 0.24 Y_5 as welded 10.2 0.16 3.39
1
Y_6 as welded 16.4 0.13 0.45 Y_7 UIT 27.1 0.15 0.82 Y_8 UIT 22.7 0.12 3.75 Y_9 UIT 34.5 0.12 0.16 Y_10 UIT 26.1 0.11 0.75 Y_11 UIT 32.0 0.10 0.18
2
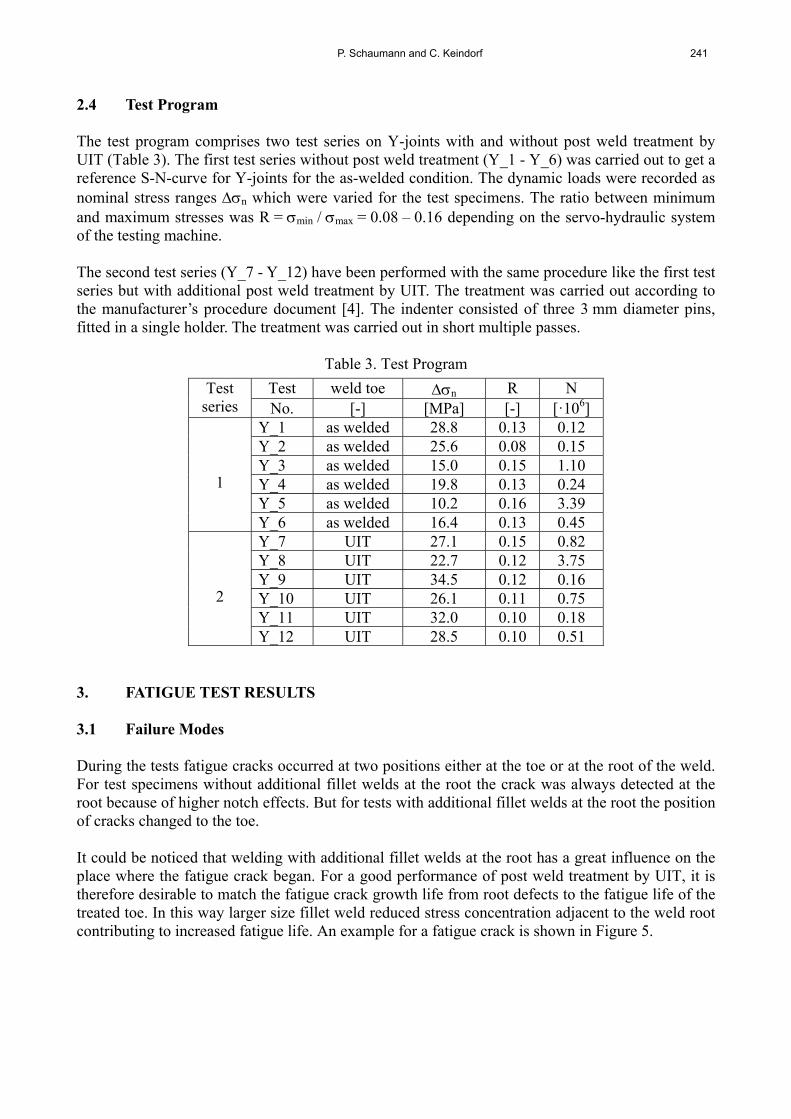
Y_12 UIT 28.5 0.10 0.51 3. FATIGUE TEST RESULTS 3.1 Failure Modes During the tests fatigue cracks occurred at two positions either at the toe or at the root of the weld. For test specimens without additional fillet welds at the root the crack was always detected at the root because of higher notch effects. But for tests with additional fillet welds at the root the position of cracks changed to the toe. It could be noticed that welding with additional fillet welds at the root has a great influence on the place where the fatigue crack began. For a good performance of post weld treatment by UIT, it is therefore desirable to match the fatigue crack growth life from root defects to the fatigue life of the treated toe. In this way larger size fillet weld reduced stress concentration adjacent to the weld root contributing to increased fatigue life. An example for a fatigue crack is shown in Figure 5.
242 Experiments and Simulations of Post Weld Treatment High Frequency Needle Peening for Welded Joints
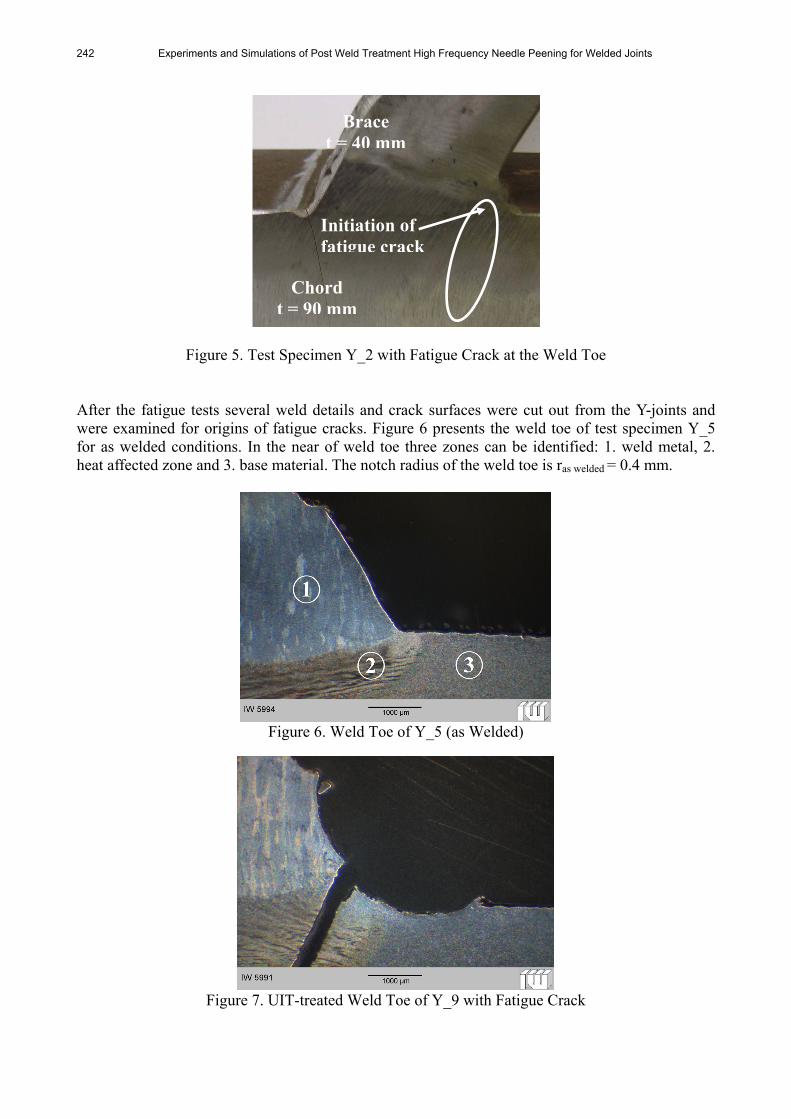
Figure 5. Test Specimen Y_2 with Fatigue Crack at the Weld Toe After the fatigue tests several weld details and crack surfaces were cut out from the Y-joints and were examined for origins of fatigue cracks. Figure 6 presents the weld toe of test specimen Y_5 for as welded conditions. In the near of weld toe three zones can be identified: 1. weld metal, 2. heat affected zone and 3. base material. The notch radius of the weld toe is ras welded = 0.4 mm.
Figure 6. Weld Toe of Y_5 (as Welded)
Figure 7. UIT-treated Weld Toe of Y_9 with Fatigue Crack
Initiation of fatigue crack
Chord t = 90 mm
Brace t = 40 mm
P. Schaumann and C. Keindorf 243
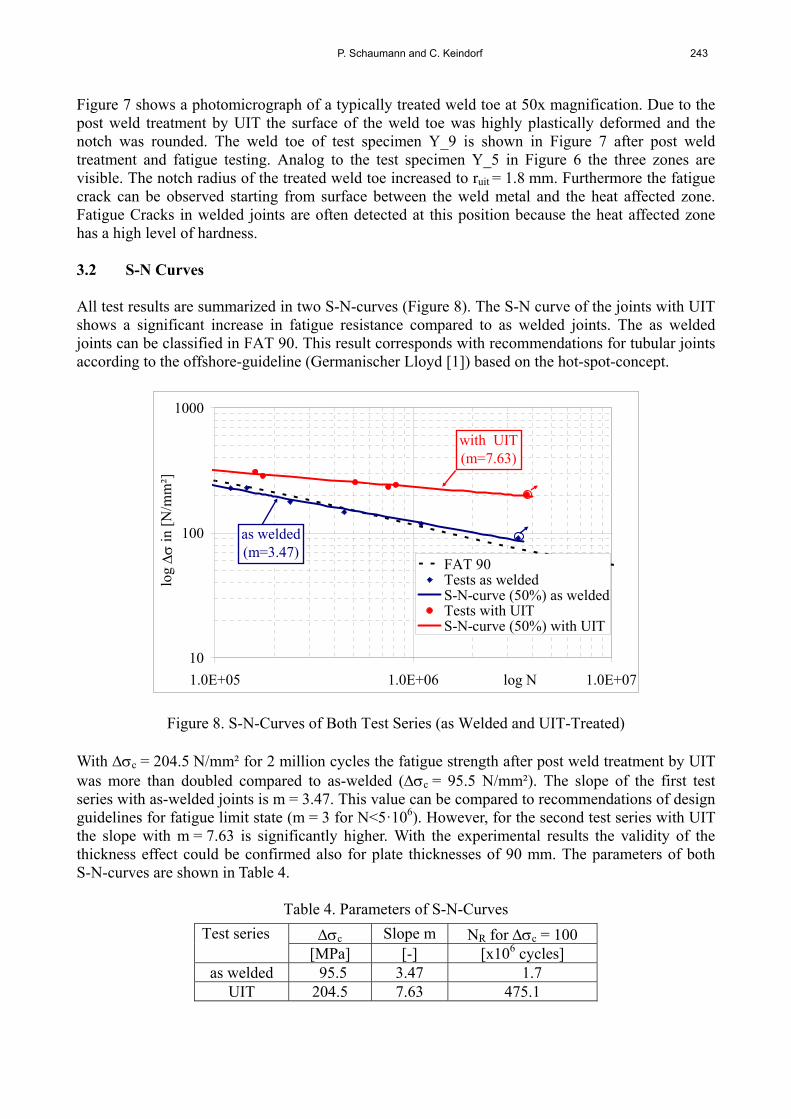
Figure 7 shows a photomicrograph of a typically treated weld toe at 50x magnification. Due to the post weld treatment by UIT the surface of the weld toe was highly plastically deformed and the notch was rounded. The weld toe of test specimen Y_9 is shown in Figure 7 after post weld treatment and fatigue testing. Analog to the test specimen Y_5 in Figure 6 the three zones are visible. The notch radius of the treated weld toe increased to ruit = 1.8 mm. Furthermore the fatigue crack can be observed starting from surface between the weld metal and the heat affected zone. Fatigue Cracks in welded joints are often detected at this position because the heat affected zone has a high level of hardness. 3.2 S-N Curves All test results are summarized in two S-N-curves (Figure 8). The S-N curve of the joints with UIT shows a significant increase in fatigue resistance compared to as welded joints. The as welded joints can be classified in FAT 90. This result corresponds with recommendations for tubular joints according to the offshore-guideline (Germanischer Lloyd [1]) based on the hot-spot-concept.
10
100
1000
1.0E+05 1.0E+06 1.0E+07log N
log
in [
N/m
m²]
FAT 90Tests as weldedS-N-curve (50%) as weldedTests with UITS-N-curve (50%) with UIT
as welded(m=3.47)
with UIT(m=7.63)
Figure 8. S-N-Curves of Both Test Series (as Welded and UIT-Treated) With c = 204.5 N/mm² for 2 million cycles the fatigue strength after post weld treatment by UIT was more than doubled compared to as-welded (c = 95.5 N/mm²). The slope of the first test series with as-welded joints is m = 3.47. This value can be compared to recommendations of design guidelines for fatigue limit state (m = 3 for N<5·106). However, for the second test series with UIT the slope with m = 7.63 is significantly higher. With the experimental results the validity of the thickness effect could be confirmed also for plate thicknesses of 90 mm. The parameters of both S-N-curves are shown in Table 4.
Table 4. Parameters of S-N-Curves
c Slope m NR for c = 100 Test series [MPa] [-] [x106 cycles]
as welded 95.5 3.47 1.7 UIT 204.5 7.63 475.1

244 Experiments and Simulations of Post Weld Treatment High Frequency Needle Peening for Welded Joints
4. NUMERICAL SIMULATIONS OF Y-JOINT At first a 3D-model of the whole test specimen was analyzed using commercially available finite element code ANSYS (Figure 9). This model contained all boundary conditions, but excluded the actual weld notch effects. The weld profile was modeled as a notch having 60° flank angle with a theoretically zero toe radius. With this model the stress concentrations at the weld could be observed using the hot spot concept.
Figure 9. Stress Concentrations at Toe and Root of the Weld
The stress concentration factors (SCF) were determined for the toe and root of the weld with the following equation:
S
N
SCF
(2)
where S = local stress at the hot spot and N = nominal stress at the end of the brace. To determine the hot spot stress two extrapolation points are necessary. The first point is located at the chord surface in a distance of 0.4·tC from the hot spot the second in a distance of 1.0·tC. The calculation is comparable to the calculation for strain concentration factors in case the stresses remain in the linear elastic range. The experimental SCFs at the chord were measured with strain gauges in the near of toe and root of the weld. The SCFs derived with numerical simulations are compared to experimental results. The comparison is presented in Table 5. The experimental and numerical SCFs for weld toe and also for weld root show a very good agreement.
Table 5. Comparison of Strains and SCFs at the Chord method S (0.4 tC) S (1.0 tC) SCF hot spot
[µm/m] [µm/m] [-] FEM 725 632 6.61 weld toe Experiment 707 614 6.46 FEM 598 509 5.53 weld root Experiment 609 524 5.59
Chord t=90mm
Brace t=40mm

P. Schaumann and C. Keindorf 245
Figure 10 shows a curve of the stress path perpendicular to the weld at the chord. The curve was estimated with the FE-model. The stress increases nonlinear in the near of the weld toe. Furthermore the diagram includes all SCF values measured with strain gauges at the chord for the same load level. The test results agree very well with the numerical stress curve. So it can be noticed that the stress concentration due to the local geometry of the Y-joint is comprised correctly in the 3D-model.
0
200
400
600
800
1000
1200
1400
0 20 40 60 80 100 120 140 160 180 200
Distance from the weld toe [mm]
Str
ain
[µm
/m]
FEM DMS 1 (Y_3)
DMS 2 (Y_3) DMS 1 (Y_6)
DMS 2 (Y_6) DMS 3 (Y_6)
DMS 1 (Y_1) DMS 2 (Y_1)
DMS 1 (Y_5) DMS 2 (Y_5)
DMS 3 (Y_5)
Figure 10. Numerical Stress Curve Perpendicular to the Weld
5. COMPARISON BETWEEN WELDED AND CAST JOINTS 5.1 Geometry of Offshore Structure (Tripod) Welded and cast joints for Tripods are analyzed for the Baltic Sea conditions of the planned wind farm Kriegers Flak. The water depth is assumed to 25 m for a 2 MW turbine. The diameter of the central tube (chord) is DC = 4.0 m and for the braces DB = 2.0 m which are connected to the chord in an angle of 45°. The objective of the design study is optimize the thicknesses tC and tB for fatigue resistance.
Figure 11. Geometry of Tripod and Stress Concentration
246 Experiments and Simulations of Post Weld Treatment High Frequency Needle Peening for Welded Joints
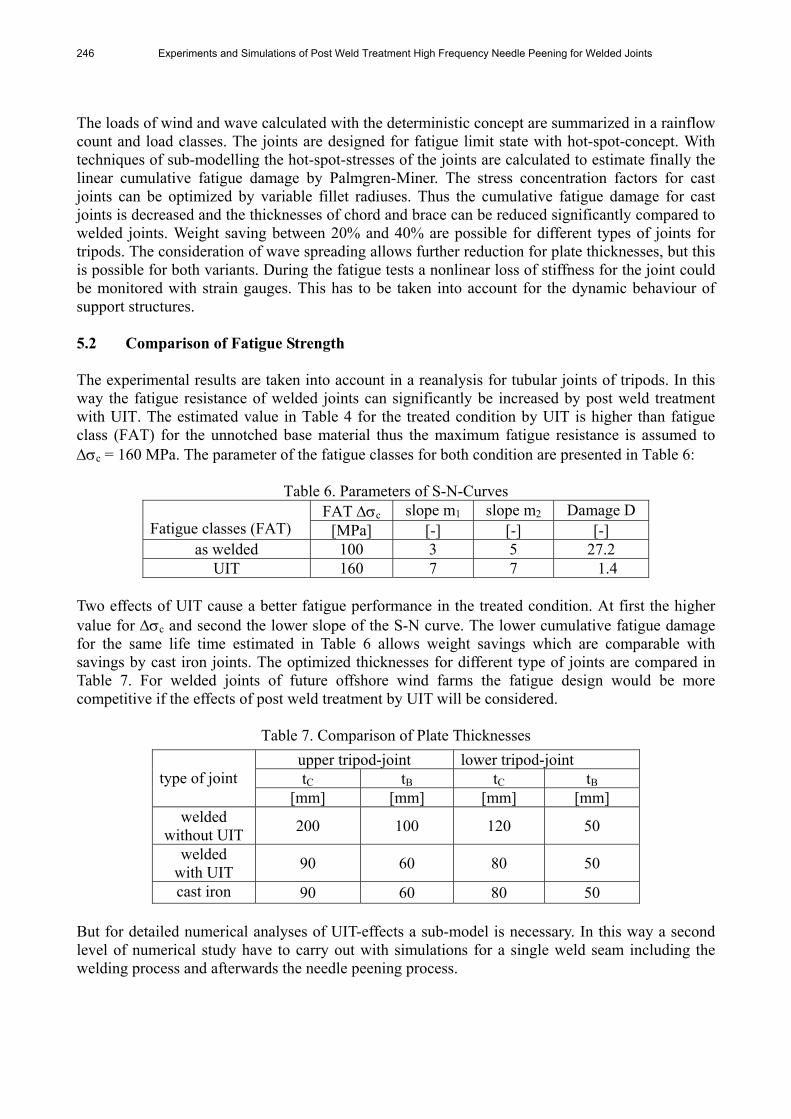
The loads of wind and wave calculated with the deterministic concept are summarized in a rainflow count and load classes. The joints are designed for fatigue limit state with hot-spot-concept. With techniques of sub-modelling the hot-spot-stresses of the joints are calculated to estimate finally the linear cumulative fatigue damage by Palmgren-Miner. The stress concentration factors for cast joints can be optimized by variable fillet radiuses. Thus the cumulative fatigue damage for cast joints is decreased and the thicknesses of chord and brace can be reduced significantly compared to welded joints. Weight saving between 20% and 40% are possible for different types of joints for tripods. The consideration of wave spreading allows further reduction for plate thicknesses, but this is possible for both variants. During the fatigue tests a nonlinear loss of stiffness for the joint could be monitored with strain gauges. This has to be taken into account for the dynamic behaviour of support structures. 5.2 Comparison of Fatigue Strength The experimental results are taken into account in a reanalysis for tubular joints of tripods. In this way the fatigue resistance of welded joints can significantly be increased by post weld treatment with UIT. The estimated value in Table 4 for the treated condition by UIT is higher than fatigue class (FAT) for the unnotched base material thus the maximum fatigue resistance is assumed to c = 160 MPa. The parameter of the fatigue classes for both condition are presented in Table 6:
Table 6. Parameters of S-N-Curves FAT c slope m1 slope m2 Damage D
Fatigue classes (FAT) [MPa] [-] [-] [-] as welded 100 3 5 27.2
UIT 160 7 7 1.4 Two effects of UIT cause a better fatigue performance in the treated condition. At first the higher value for c and second the lower slope of the S-N curve. The lower cumulative fatigue damage for the same life time estimated in Table 6 allows weight savings which are comparable with savings by cast iron joints. The optimized thicknesses for different type of joints are compared in Table 7. For welded joints of future offshore wind farms the fatigue design would be more competitive if the effects of post weld treatment by UIT will be considered.
Table 7. Comparison of Plate Thicknesses
upper tripod-joint lower tripod-joint tC tB tC tB
type of joint
[mm] [mm] [mm] [mm] welded
without UIT200 100 120 50
welded with UIT
90 60 80 50
cast iron 90 60 80 50 But for detailed numerical analyses of UIT-effects a sub-model is necessary. In this way a second level of numerical study have to carry out with simulations for a single weld seam including the welding process and afterwards the needle peening process.
P. Schaumann and C. Keindorf 247
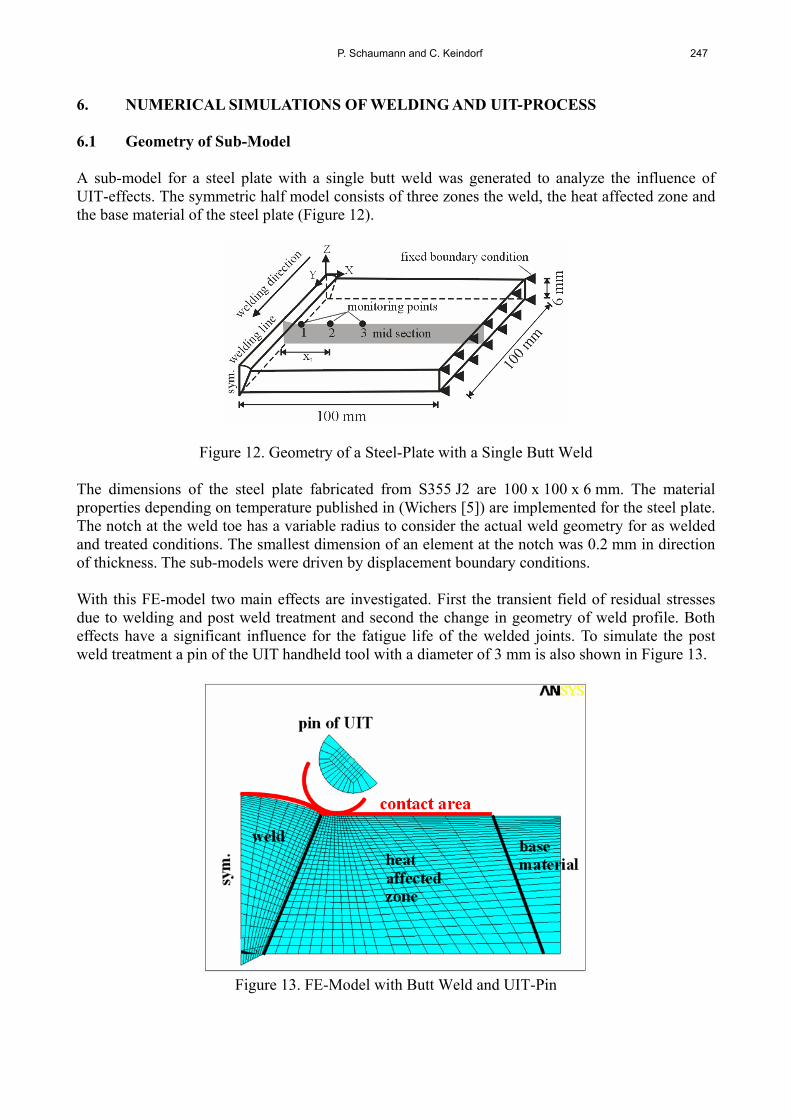
6. NUMERICAL SIMULATIONS OF WELDING AND UIT-PROCESS 6.1 Geometry of Sub-Model A sub-model for a steel plate with a single butt weld was generated to analyze the influence of UIT-effects. The symmetric half model consists of three zones the weld, the heat affected zone and the base material of the steel plate (Figure 12).
Figure 12. Geometry of a Steel-Plate with a Single Butt Weld The dimensions of the steel plate fabricated from S355 J2 are 100 x 100 x 6 mm. The material properties depending on temperature published in (Wichers [5]) are implemented for the steel plate. The notch at the weld toe has a variable radius to consider the actual weld geometry for as welded and treated conditions. The smallest dimension of an element at the notch was 0.2 mm in direction of thickness. The sub-models were driven by displacement boundary conditions. With this FE-model two main effects are investigated. First the transient field of residual stresses due to welding and post weld treatment and second the change in geometry of weld profile. Both effects have a significant influence for the fatigue life of the welded joints. To simulate the post weld treatment a pin of the UIT handheld tool with a diameter of 3 mm is also shown in Figure 13.
Figure 13. FE-Model with Butt Weld and UIT-Pin
248 Experiments and Simulations of Post Weld Treatment High Frequency Needle Peening for Welded Joints
6.2 Thermal Analysis of Welding Process The simulation of the welding process consists of two analyses. At first the transient field of temperature is calculated during arc welding process. After the transient thermal analysis the structural analysis is following to estimate the residual stresses. For the transient thermal analysis a half symmetric steel plate having a length of 100 mm (welding direction), width of 100 mm and thickness of 6 mm is modeled with 3D-thermal elements (Solid70). These elements have eight nodes with a single degree of freedom, temperature, at each node. The butt weld is generated as single pass welding process with a welding speed of vweld = 5 mm/s. The electric input is U = 23.5 V and I = 165 A, and the arc efficiency is assumed to be = 90%. Parametric meshing is used in order to easily track the results along a certain predefined path in any direction. For thermal symmetry the heat flux passing across the surface of symmetry shown in Figure 12 is assumed to be zero, and, for structural symmetry, the translation in the x-direction of the same surface is also zero. It is important to note that the automatically estimated time increment in the analysis drops to a very small value due to the vast difference in the temperatures. This effect can be dramatic for small element size of the weld pool at the fusion surface the parting surface. But the meshing in the weld pool must be fine enough to account for the high temperature gradient calculation. The transient temperature profile during the welding process was analyzed using Goldak’s formulation of the double-ellipsoidal heat source (Goldak [6]). The total heat input Q is evaluated according to electric arc welding with Q U I (3) where = arc efficiency, U = weld voltage and I = current intensity. The heat flux q is applied in the model to calculate the thermal load at a certain time and location within the volume of elements according to Eq. 4.
2
2
2
2
2
2
c
z
b
y
a
x3
maxvol eq)z,y,x(q (4)
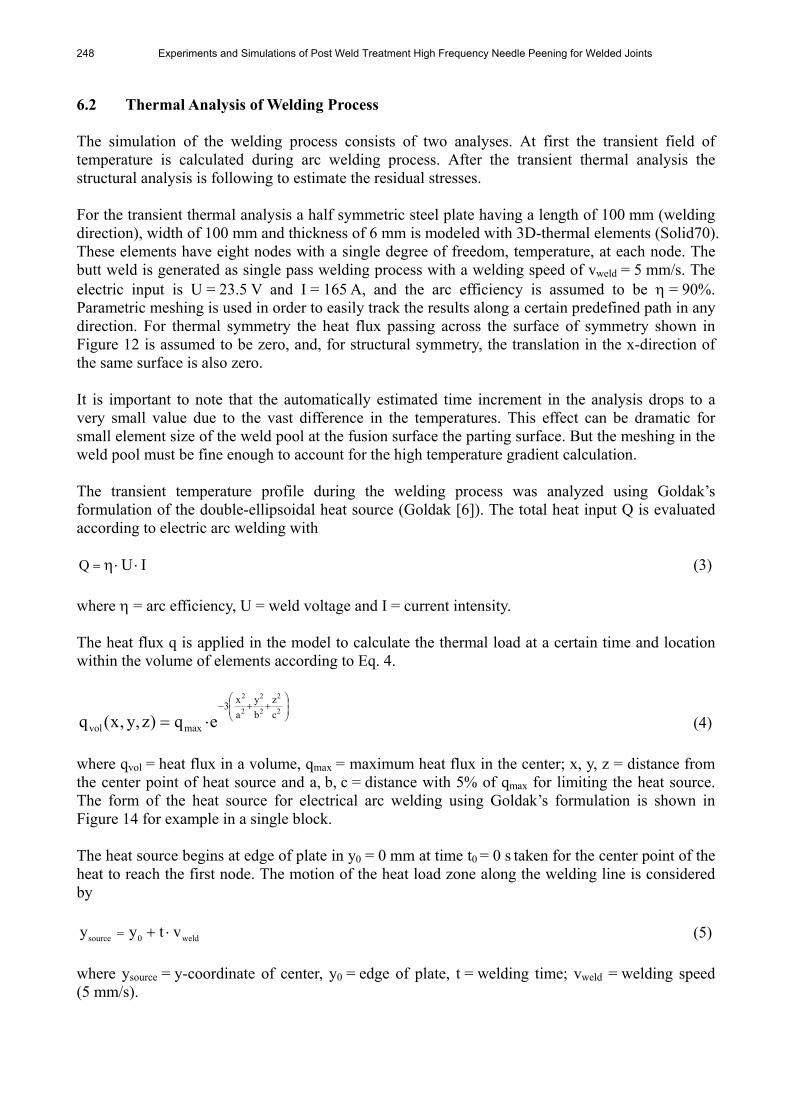
where qvol = heat flux in a volume, qmax = maximum heat flux in the center; x, y, z = distance from the center point of heat source and a, b, c = distance with 5% of qmax for limiting the heat source. The form of the heat source for electrical arc welding using Goldak’s formulation is shown in Figure 14 for example in a single block. The heat source begins at edge of plate in y0 = 0 mm at time t0 = 0 s taken for the center point of the heat to reach the first node. The motion of the heat load zone along the welding line is considered by
source 0 weldy y t v (5)
where ysource = y-coordinate of center, y0 = edge of plate, t = welding time; vweld = welding speed (5 mm/s).
P. Schaumann and C. Keindorf 249
Figure 14. Moving Heat Source for Electrical Arc Welding
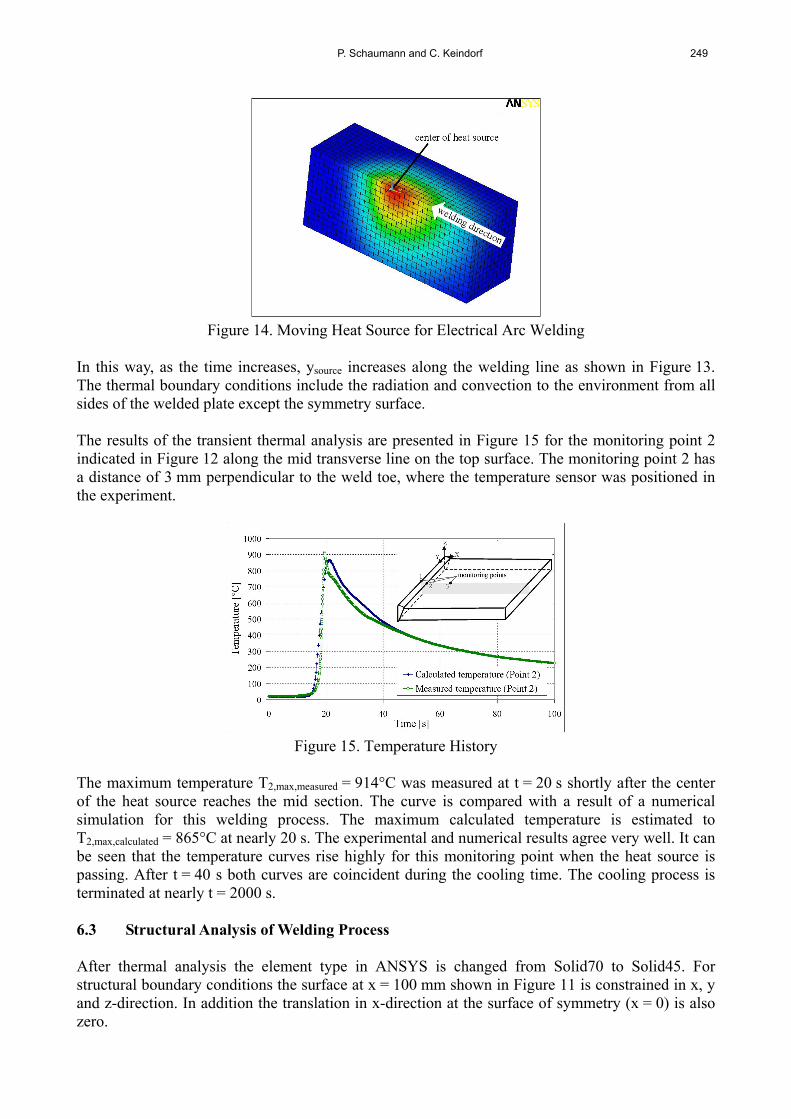
In this way, as the time increases, ysource increases along the welding line as shown in Figure 13. The thermal boundary conditions include the radiation and convection to the environment from all sides of the welded plate except the symmetry surface. The results of the transient thermal analysis are presented in Figure 15 for the monitoring point 2 indicated in Figure 12 along the mid transverse line on the top surface. The monitoring point 2 has a distance of 3 mm perpendicular to the weld toe, where the temperature sensor was positioned in the experiment.
Figure 15. Temperature History
The maximum temperature T2,max,measured = 914°C was measured at t = 20 s shortly after the center of the heat source reaches the mid section. The curve is compared with a result of a numerical simulation for this welding process. The maximum calculated temperature is estimated to T2,max,calculated = 865°C at nearly 20 s. The experimental and numerical results agree very well. It can be seen that the temperature curves rise highly for this monitoring point when the heat source is passing. After t = 40 s both curves are coincident during the cooling time. The cooling process is terminated at nearly t = 2000 s. 6.3 Structural Analysis of Welding Process After thermal analysis the element type in ANSYS is changed from Solid70 to Solid45. For structural boundary conditions the surface at x = 100 mm shown in Figure 11 is constrained in x, y and z-direction. In addition the translation in x-direction at the surface of symmetry (x = 0) is also zero.
250 Experiments and Simulations of Post Weld Treatment High Frequency Needle Peening for Welded Joints
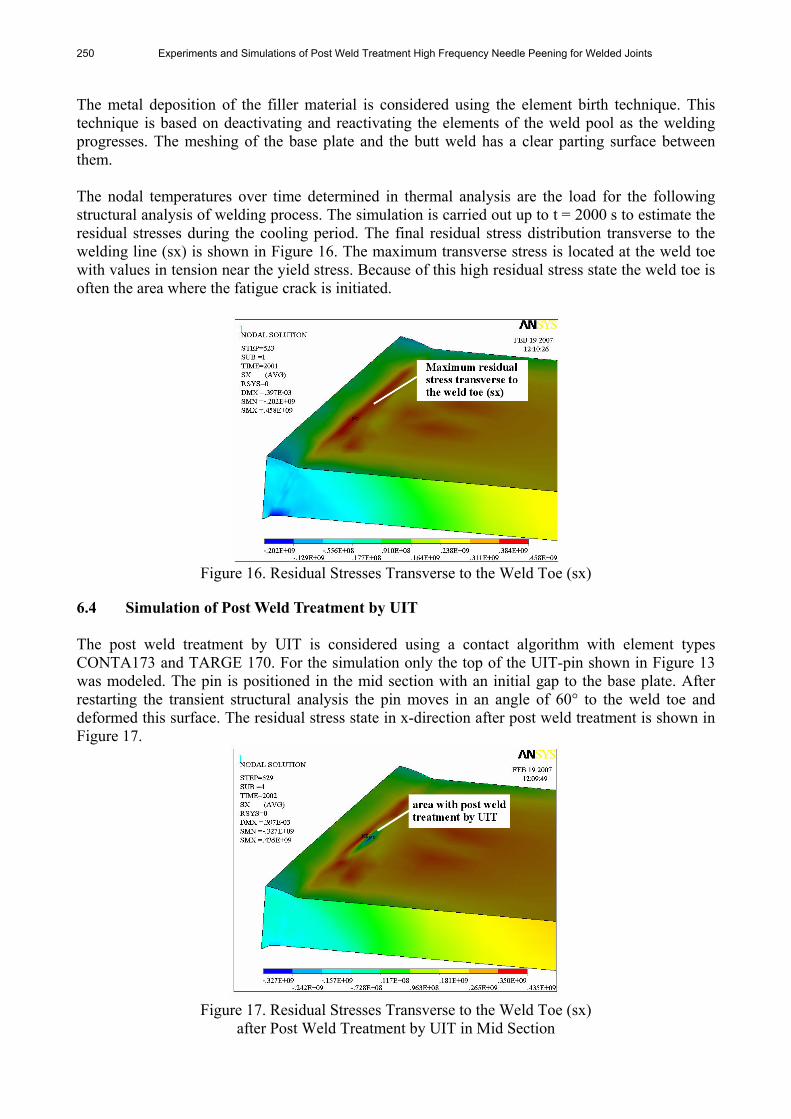
The metal deposition of the filler material is considered using the element birth technique. This technique is based on deactivating and reactivating the elements of the weld pool as the welding progresses. The meshing of the base plate and the butt weld has a clear parting surface between them. The nodal temperatures over time determined in thermal analysis are the load for the following structural analysis of welding process. The simulation is carried out up to t = 2000 s to estimate the residual stresses during the cooling period. The final residual stress distribution transverse to the welding line (sx) is shown in Figure 16. The maximum transverse stress is located at the weld toe with values in tension near the yield stress. Because of this high residual stress state the weld toe is often the area where the fatigue crack is initiated.
Figure 16. Residual Stresses Transverse to the Weld Toe (sx)
6.4 Simulation of Post Weld Treatment by UIT The post weld treatment by UIT is considered using a contact algorithm with element types CONTA173 and TARGE 170. For the simulation only the top of the UIT-pin shown in Figure 13 was modeled. The pin is positioned in the mid section with an initial gap to the base plate. After restarting the transient structural analysis the pin moves in an angle of 60° to the weld toe and deformed this surface. The residual stress state in x-direction after post weld treatment is shown in Figure 17.
Figure 17. Residual Stresses Transverse to the Weld Toe (sx)
after Post Weld Treatment by UIT in Mid Section
P. Schaumann and C. Keindorf 251
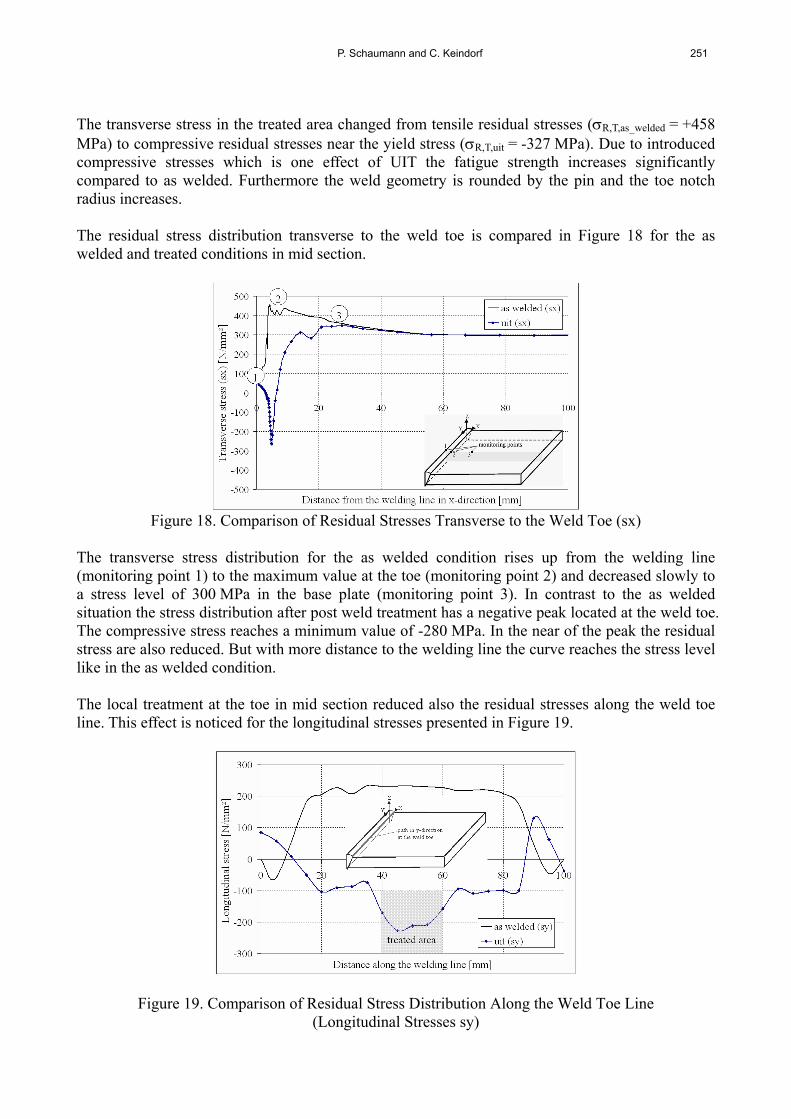
The transverse stress in the treated area changed from tensile residual stresses (R,T,as_welded = +458 MPa) to compressive residual stresses near the yield stress (R,T,uit = -327 MPa). Due to introduced compressive stresses which is one effect of UIT the fatigue strength increases significantly compared to as welded. Furthermore the weld geometry is rounded by the pin and the toe notch radius increases. The residual stress distribution transverse to the weld toe is compared in Figure 18 for the as welded and treated conditions in mid section.
Figure 18. Comparison of Residual Stresses Transverse to the Weld Toe (sx)
The transverse stress distribution for the as welded condition rises up from the welding line (monitoring point 1) to the maximum value at the toe (monitoring point 2) and decreased slowly to a stress level of 300 MPa in the base plate (monitoring point 3). In contrast to the as welded situation the stress distribution after post weld treatment has a negative peak located at the weld toe. The compressive stress reaches a minimum value of -280 MPa. In the near of the peak the residual stress are also reduced. But with more distance to the welding line the curve reaches the stress level like in the as welded condition. The local treatment at the toe in mid section reduced also the residual stresses along the weld toe line. This effect is noticed for the longitudinal stresses presented in Figure 19.
Figure 19. Comparison of Residual Stress Distribution Along the Weld Toe Line (Longitudinal Stresses sy)
252 Experiments and Simulations of Post Weld Treatment High Frequency Needle Peening for Welded Joints
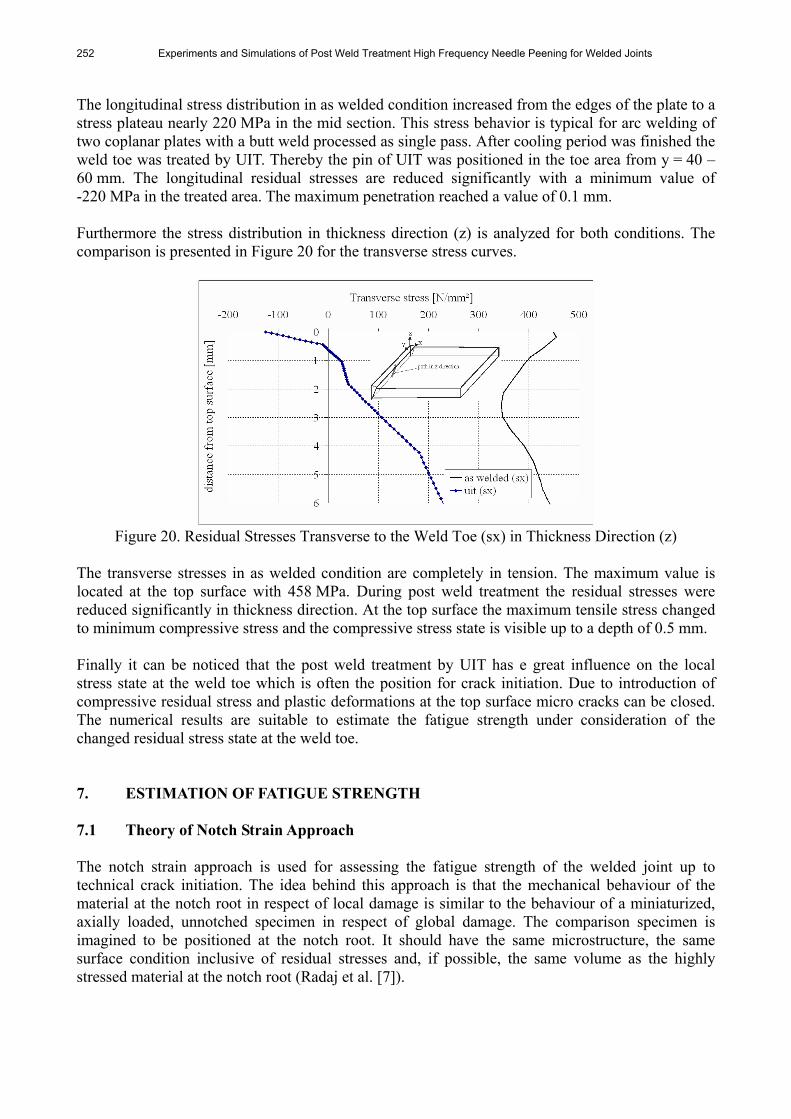
The longitudinal stress distribution in as welded condition increased from the edges of the plate to a stress plateau nearly 220 MPa in the mid section. This stress behavior is typical for arc welding of two coplanar plates with a butt weld processed as single pass. After cooling period was finished the weld toe was treated by UIT. Thereby the pin of UIT was positioned in the toe area from y = 40 – 60 mm. The longitudinal residual stresses are reduced significantly with a minimum value of -220 MPa in the treated area. The maximum penetration reached a value of 0.1 mm. Furthermore the stress distribution in thickness direction (z) is analyzed for both conditions. The comparison is presented in Figure 20 for the transverse stress curves.
Figure 20. Residual Stresses Transverse to the Weld Toe (sx) in Thickness Direction (z)
The transverse stresses in as welded condition are completely in tension. The maximum value is located at the top surface with 458 MPa. During post weld treatment the residual stresses were reduced significantly in thickness direction. At the top surface the maximum tensile stress changed to minimum compressive stress and the compressive stress state is visible up to a depth of 0.5 mm. Finally it can be noticed that the post weld treatment by UIT has e great influence on the local stress state at the weld toe which is often the position for crack initiation. Due to introduction of compressive residual stress and plastic deformations at the top surface micro cracks can be closed. The numerical results are suitable to estimate the fatigue strength under consideration of the changed residual stress state at the weld toe. 7. ESTIMATION OF FATIGUE STRENGTH 7.1 Theory of Notch Strain Approach The notch strain approach is used for assessing the fatigue strength of the welded joint up to technical crack initiation. The idea behind this approach is that the mechanical behaviour of the material at the notch root in respect of local damage is similar to the behaviour of a miniaturized, axially loaded, unnotched specimen in respect of global damage. The comparison specimen is imagined to be positioned at the notch root. It should have the same microstructure, the same surface condition inclusive of residual stresses and, if possible, the same volume as the highly stressed material at the notch root (Radaj et al. [7]).

P. Schaumann and C. Keindorf 253
7.2 Basic Formulae According to Version of Seeger The following equations are basic formulae for the stain notch approach according to the version of Seeger. 7.2.1 Cyclic stress-strain curve At first the cyclic stress-strain curves according to Ramberg and Osgood have to be described by:
'n/1
aapl,ael,aa 'KE
(6)
Where εa = total strain amplitude; εa,el = elastic strain amplitude; εa,pl = plastic strain amplitude; a = stress amplitude; E = elastic modulus; K´ = cyclic strain-hardening coefficient and n´ = cyclic strain-hardening exponent. 7.2.2 Strain S-N curve The strain S-N curve according to Manson and Coffin inclusive of the mean stress effect to Morrow describing technical crack initiation is given by:
Ea a,el a,plb cf m (N N )fN N
´´
E
2 2 (7)
where f´ = fatigue strength coefficient; εf´ = fatigue ductility coefficient; b = fatigue strength exponent; c = fatigue ductility exponent; m = mean stress; N = number of cycles up to crack initiation and NE = number of cycles at the technical endurance limit. 7.2.3 Cyclic material parameters The cyclic material parameters in Eqs. 6 and 7 are presented by (Bäumel and Seeger [8]) for non welded base metals according to the uniform material law, shown in Table 8:
Table 8. Cyclic Material Parameters after Bäumel & Seeger [8] Material parameters basic formulae for steel,
unalloyed and low-alloy S 355 J2
u Rm 510 f´ 1.50·u 765 b -0.087 -0.087 εf´ 0.59 0.59 c -0.58 -0.58 E
b 0.45·u 229.5 εE
b 0.45·u/E + 1.95·10-4· 1.287·10-3 NE 5·105 5·105 K´ 1.65·u 841.5 n´ 0.15 0.15
=1.0 for u/E ≤ 3·10-3 =(1.375-1.25u/E) ≤ 0
for u/E > 3·10-3
1.0

254 Experiments and Simulations of Post Weld Treatment High Frequency Needle Peening for Welded Joints
7.2.4 Hysteresis loop The curve branches of the stress-strain hysteresis loop, rising or dropping from the cusp point, are described according to Masing by:
'n/1
aaa 'K2
2E
(8)
where and ε = stress and strain on the hysteresis curve branch; a = stress amplitude; E = elastic modulus; K´ = cyclic strain-hardening coefficient and n´ = cyclic strain-hardening exponent. 7.2.5 Elastic-plastic state at the notch The stresses and strains at the notch root in the elastic-plastic state, according to Neuber [9] as macrostructural support formulae is given by:
k kn tK
E
2
(9)
where k and εk = maximum notch stress and strain in the elastic plastic state; n = nominal stress; E = elastic modulus; Kt = elastic stress concentration factor. The elastic stress concentration factor Kt for the weld toe geometry was determined numerically for as welded and also for treated condition. The notch radius for as welded is considered according to (Radaj et al. [7]) with r = 1 mm and for the treated toe with r = 1.5 mm. In test series with Y-joints a notch radius of ruit = 1.8 mm was measured, but for idealized the radius for UIT is assumed theoretically to the radius of the pin with rpin = 1.5 mm. The detailed notch geometry is presented in Figure 21 with the corresponding smooth comparison specimen at the notch root.
Figure 21. Geometry of the Butt Weld
In addition to the numerical solution the elastic stress concentration factor Kt can be calculated with the following formulae given in FKM Guideline [10]:
t
r r r
t t t.
K
2
11
0 5 5 1 2
(10)
where Kt = elastic stress concentration factor; r = notch radius and t = thickness of plate.
P. Schaumann and C. Keindorf 255
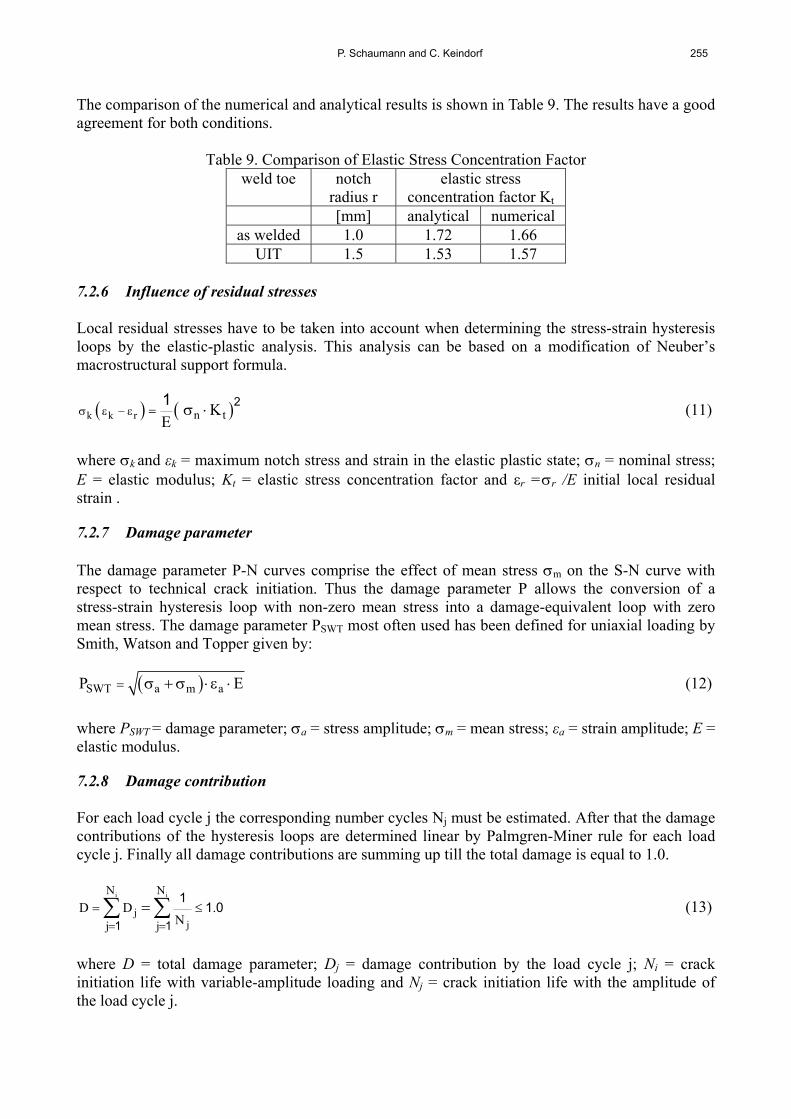
The comparison of the numerical and analytical results is shown in Table 9. The results have a good agreement for both conditions.
Table 9. Comparison of Elastic Stress Concentration Factor weld toe notch
radius r
elastic stress concentration factor Kt
[mm] analytical numericalas welded 1.0 1.72 1.66
UIT 1.5 1.53 1.57 7.2.6 Influence of residual stresses Local residual stresses have to be taken into account when determining the stress-strain hysteresis loops by the elastic-plastic analysis. This analysis can be based on a modification of Neuber’s macrostructural support formula.
k k r n tKE
21 (11)
where k and εk = maximum notch stress and strain in the elastic plastic state; n = nominal stress; E = elastic modulus; Kt = elastic stress concentration factor and εr =r /E initial local residual strain . 7.2.7 Damage parameter The damage parameter P-N curves comprise the effect of mean stress m on the S-N curve with respect to technical crack initiation. Thus the damage parameter P allows the conversion of a stress-strain hysteresis loop with non-zero mean stress into a damage-equivalent loop with zero mean stress. The damage parameter PSWT most often used has been defined for uniaxial loading by Smith, Watson and Topper given by:
SWT a m aP E (12)
where PSWT = damage parameter; a = stress amplitude; m = mean stress; εa = strain amplitude; E = elastic modulus. 7.2.8 Damage contribution For each load cycle j the corresponding number cycles Nj must be estimated. After that the damage contributions of the hysteresis loops are determined linear by Palmgren-Miner rule for each load cycle j. Finally all damage contributions are summing up till the total damage is equal to 1.0.
i i
jj
N N
j j
D D .N
1 1
11 0 (13)
where D = total damage parameter; Dj = damage contribution by the load cycle j; Ni = crack initiation life with variable-amplitude loading and Nj = crack initiation life with the amplitude of the load cycle j.
256 Experiments and Simulations of Post Weld Treatment High Frequency Needle Peening for Welded Joints
0
100
200
300
400
500
600
1.E+00 1.E+02 1.E+04 1.E+06 1.E+08 1.E+10number of cycles N (to crack initiation)
Nom
inal
str
ess
ampl
itud
e
a [N
/mm
²]
with residual stress (as welded)
with residual stress (UIT)
without residual stresses
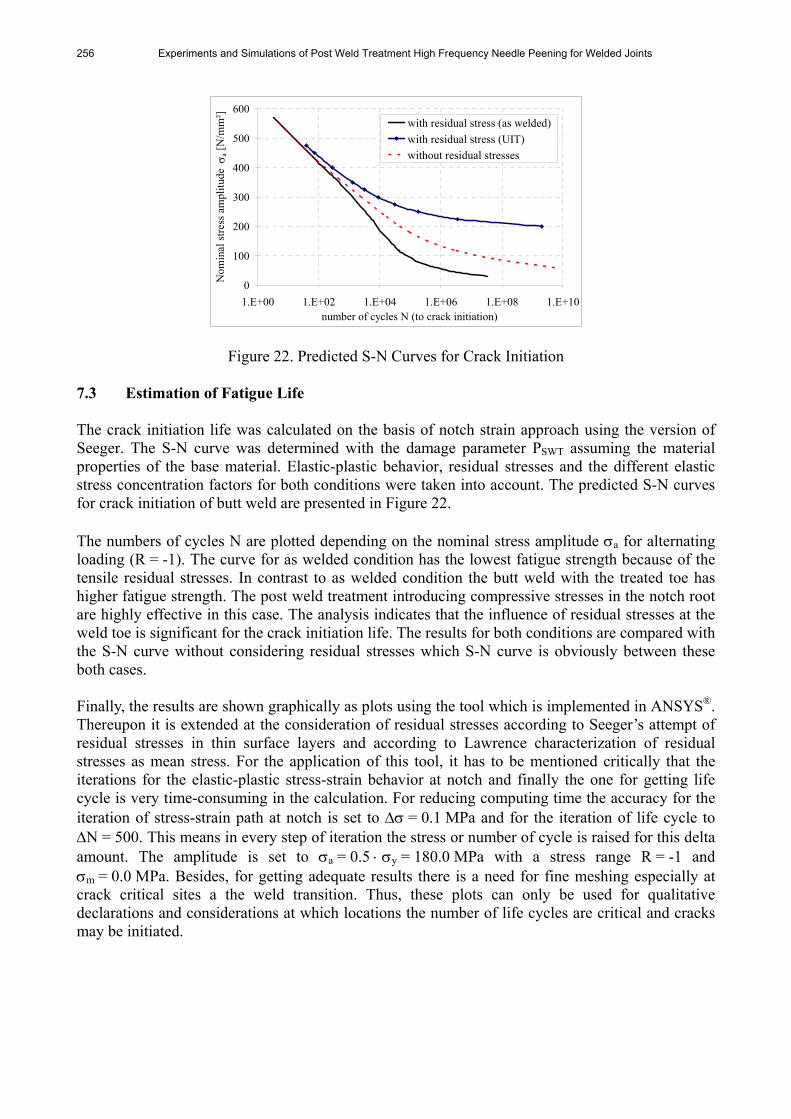
Figure 22. Predicted S-N Curves for Crack Initiation 7.3 Estimation of Fatigue Life The crack initiation life was calculated on the basis of notch strain approach using the version of Seeger. The S-N curve was determined with the damage parameter PSWT assuming the material properties of the base material. Elastic-plastic behavior, residual stresses and the different elastic stress concentration factors for both conditions were taken into account. The predicted S-N curves for crack initiation of butt weld are presented in Figure 22. The numbers of cycles N are plotted depending on the nominal stress amplitude a for alternating loading (R = -1). The curve for as welded condition has the lowest fatigue strength because of the tensile residual stresses. In contrast to as welded condition the butt weld with the treated toe has higher fatigue strength. The post weld treatment introducing compressive stresses in the notch root are highly effective in this case. The analysis indicates that the influence of residual stresses at the weld toe is significant for the crack initiation life. The results for both conditions are compared with the S-N curve without considering residual stresses which S-N curve is obviously between these both cases. Finally, the results are shown graphically as plots using the tool which is implemented in ANSYS®. Thereupon it is extended at the consideration of residual stresses according to Seeger’s attempt of residual stresses in thin surface layers and according to Lawrence characterization of residual stresses as mean stress. For the application of this tool, it has to be mentioned critically that the iterations for the elastic-plastic stress-strain behavior at notch and finally the one for getting life cycle is very time-consuming in the calculation. For reducing computing time the accuracy for the iteration of stress-strain path at notch is set to = 0.1 MPa and for the iteration of life cycle to N = 500. This means in every step of iteration the stress or number of cycle is raised for this delta amount. The amplitude is set to a = 0.5 y = 180.0 MPa with a stress range R = -1 and m = 0.0 MPa. Besides, for getting adequate results there is a need for fine meshing especially at crack critical sites a the weld transition. Thus, these plots can only be used for qualitative declarations and considerations at which locations the number of life cycles are critical and cracks may be initiated.
P. Schaumann and C. Keindorf 257
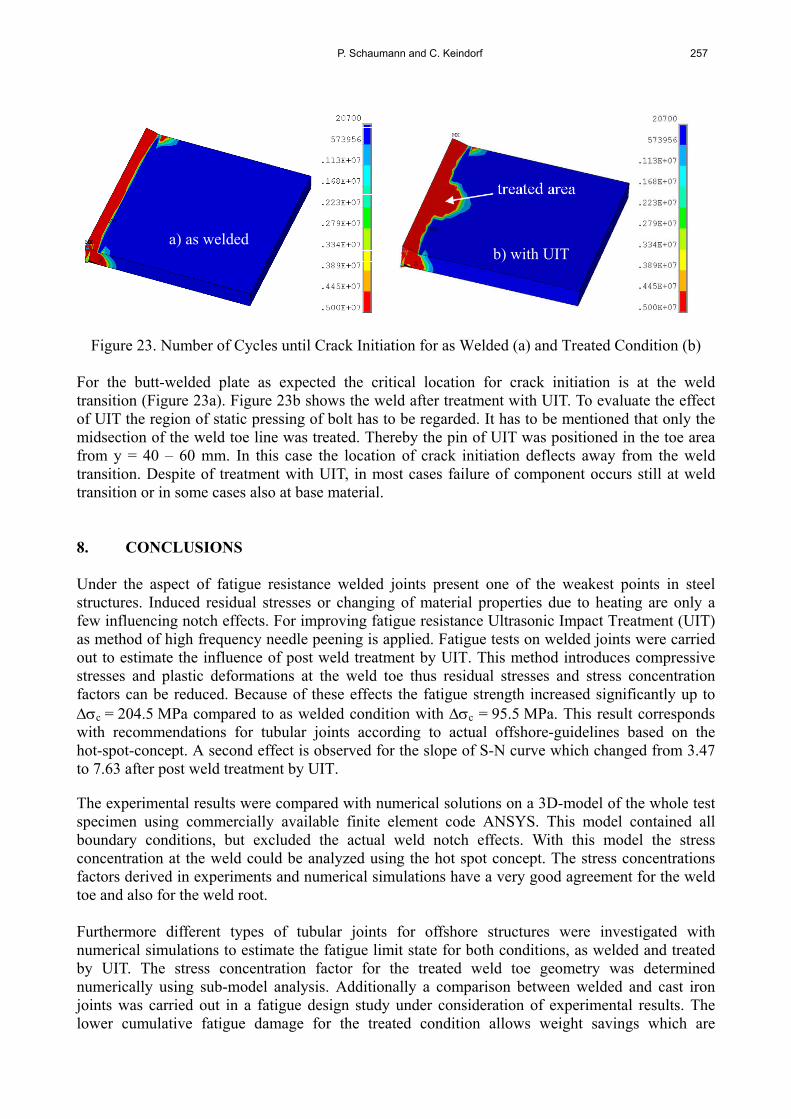
Figure 23. Number of Cycles until Crack Initiation for as Welded (a) and Treated Condition (b) For the butt-welded plate as expected the critical location for crack initiation is at the weld transition (Figure 23a). Figure 23b shows the weld after treatment with UIT. To evaluate the effect of UIT the region of static pressing of bolt has to be regarded. It has to be mentioned that only the midsection of the weld toe line was treated. Thereby the pin of UIT was positioned in the toe area from y = 40 – 60 mm. In this case the location of crack initiation deflects away from the weld transition. Despite of treatment with UIT, in most cases failure of component occurs still at weld transition or in some cases also at base material. 8. CONCLUSIONS Under the aspect of fatigue resistance welded joints present one of the weakest points in steel structures. Induced residual stresses or changing of material properties due to heating are only a few influencing notch effects. For improving fatigue resistance Ultrasonic Impact Treatment (UIT) as method of high frequency needle peening is applied. Fatigue tests on welded joints were carried out to estimate the influence of post weld treatment by UIT. This method introduces compressive stresses and plastic deformations at the weld toe thus residual stresses and stress concentration factors can be reduced. Because of these effects the fatigue strength increased significantly up to c = 204.5 MPa compared to as welded condition with c = 95.5 MPa. This result corresponds with recommendations for tubular joints according to actual offshore-guidelines based on the hot-spot-concept. A second effect is observed for the slope of S-N curve which changed from 3.47 to 7.63 after post weld treatment by UIT. The experimental results were compared with numerical solutions on a 3D-model of the whole test specimen using commercially available finite element code ANSYS. This model contained all boundary conditions, but excluded the actual weld notch effects. With this model the stress concentration at the weld could be analyzed using the hot spot concept. The stress concentrations factors derived in experiments and numerical simulations have a very good agreement for the weld toe and also for the weld root. Furthermore different types of tubular joints for offshore structures were investigated with numerical simulations to estimate the fatigue limit state for both conditions, as welded and treated by UIT. The stress concentration factor for the treated weld toe geometry was determined numerically using sub-model analysis. Additionally a comparison between welded and cast iron joints was carried out in a fatigue design study under consideration of experimental results. The lower cumulative fatigue damage for the treated condition allows weight savings which are
a) as welded b) with UIT
258 Experiments and Simulations of Post Weld Treatment High Frequency Needle Peening for Welded Joints
comparable with savings by cast iron joints. For welded joints of future offshore wind farms the fatigue design would be more competitive if the effects of post weld treatment by UIT will be considered. With a sub-model for a seam butt welded joint numerical simulations are carried out using an arc welding process followed by a process of needle peening, like UIT. The objective of numerical investigations was to analyze the influence of residual stresses at the fatigue life for welded joints with and without post weld treatment. The visualization of fatigue life until technical crack shows that the crack is initiated at the weld toe in as-welded condition. After treatment the weld toe in the midsection by UIT the predicted location of crack initiation moves for the treated area from the weld toe to the heat affected zone. Finally the fatigue life until crack initiation was estimated with notch strain approach. The positive effect of post weld treatment by UIT is significant for the fatigue resistance compared to the as-welded condition. ACKNOWLEDGMENTS The study was conducted at the Institute for Steel Construction of the Leibniz University Hannover, Germany. Special acknowledgement is due to Warnow Design GmbH, Rostock, Germany, the engineering consult which supported the work. The authors will also like to thank Applied Ultrasonics Europe, for supplying the UIT equipment. REFERENCES [1] Germanischer Lloyd, Rules and Regulations IV, Non-marine Technology, Part 2: Offshore
Wind Energy, Hamburg, Germanischer Lloyd Industrial Services, 2004. [2] Statnikov, E.S. et al., “Ultrasonic Impact Tool for Strengthening Welds and Reducing
Residual Stresses”, New Physical Methods of Intensification of Technological Processes, 1977.
[3] Statnikov, E.S. et al., “Applications of Operational Ultrasonic Impact Treatment (UIT) Technologies in Production of Welded Joints”, IIW, Doc. XIII-1668-97, International Institute of Welding, Paris, France, 1997.
[4] Applied Ultrasonics, “Esonics Ultrasonic Impact Treatment: Technical Procedure Document”, Applied Ultrasonics, Birmingham, AL, USA, 2002.
[5] Wichers, M., “Schweißen unter einachsiger, zyklischer Beanspruchung – experimentelle und numerische Untersuchungen”, PhD-thesis, Institute for steel construction, TU Braunschweig, Germany, 2006.
[6] Goldak, J. et al., “A New Finite Element Model for Welding Heat Sources”, Metallurgical Transactions B, 1984, Vol. 15B, pp. 299-305.
[7] Radaj, D., Sonsino, C.M., Fricke, W., “Fatigue Assessment of Welded Joints by Local Approaches”, Second Edition, Woodhead Publishing Limited and CRC Press LLC, 2006.
[8] Bäumel, A., Seeger, T., “Materials Data for Cyclic Loading”, Suppl. 1, Amsterdam, Elsevier Science, 1990.
[9] Neuber, H., “Über die Berücksichtigung der Spannungskonzentration bei Festigkeitsberechnungen, Konstruktion”, 1968, Vol. 20, No. 7, pp. 245-251.
[10] FKM Guideline, Rechnerischer Festigkeitsnachweis für Maschinenbauteile, Germany, 2002.
[11] Schaumann, P., Keindorf, C., “Enhancing Fatigue Strength by Ultrasonic Impact Treatment for Welded Joints of Offshore Structures”, Third International Conference on Steel and Composite Structures (ICSCS07), Manchester, UK, 2007.