Experiments and Computational Modeling of Pulverized-Coal...
113
Experiments and Computational Modeling of Pulverized-Coal Ignition SEMI-ANNUAL Reporting Period Start Date: 04/01/1998 End Date: 09/30/1998 Authors: John C. Chen Samuel Owusu-Ofori" Report Issue Date: 10/31/1998 DE-FG22-96PC96221--05 North Carolina A&T State University Department of Mechanical Engineering 1601 East Market Street Greensboro, NC 27411
Transcript of Experiments and Computational Modeling of Pulverized-Coal...
Experiments and Computational Modeling of Pulverized-Coal Ignition
SEMI-ANNUAL
Reporting Period Start Date: 04/01/1998 End Date: 09/30/1998
Authors:John C. Chen
Samuel Owusu-Ofori"
Report Issue Date: 10/31/1998
DE-FG22-96PC96221--05
North Carolina A&T State UniversityDepartment of Mechanical Engineering
1601 East Market StreetGreensboro, NC 27411

1
Disclaimer
This report was prepared as an account of work sponsored by an agency of the United States
Government. Neither the United States Government nor any agency thereof, nor any of their
employees, makes any warranty, expressed or implied, or assumes any legal liability or responsibility
for the accuracy, completeness, or usefulness of any information, apparatus, product, or process
disclosed, or represents that its use would not infringe privately owned rights. Reference herein to
any specific commercial product, process, or service by trade name, trademark, manufacturer, or
otherwise does not necessarily constitute or imply its endorsement, recommendation, or favoring
by the United States Government or any agency thereof. The views and opinions of authors
expressed herein do not necessarily state or reflect those of the United States Government or any
agency thereof.
2
Abstract
Under typical conditions of pulverized-coal combustion, which is characterized by fine
particles heated at very high rates, there is currently a lack of certainty regarding the ignition
mechanism of bituminous and lower rank coals. It is unclear whether ignition occurs first at the
particle-oxygen interface (heterogeneous ignition) or if it occurs in the gas phase due to ignition of
the devolatilization products (homogeneous ignition). Furthermore, there have been no previous
studies aimed at determining the dependence of the ignition mechanism on variations in
experimental conditions, such as particle size, oxygen concentration, and heating rate. Finally, there
is a need to improve current mathematical models of ignition to realistically and accurately depict
the particle-to-particle variations that exist within a coal sample. Such a model is needed to extract
useful reaction parameters from ignition studies, and to interpret ignition data in a more meaningful
way.
We propose to examine fundamental aspects of coal ignition through (1) experiments to
determine the ignition mechanism of various coals by direct observation, and (2) modeling of the
ignition process to derive rate constants and to provide a more insightful interpretation of data
from ignition experiments.
We propose to use a novel laser-based ignition experiment to achieve our objectives. The
heating source will be a pulsed, carbon-dioxide (CO2) laser in which both the pulse energy and pulse
duration are independently variable, allowing for a wide range of heating rates and particle
temperatures — both of which are decoupled from each other and from the particle size. This
level of control over the experimental conditions is truly novel in ignition and combustion
experiments. Laser-ignition experiments also offer the distinct advantage of easy optical access to
the particles because of the absence of a furnace or radiating walls, and thus permit direct
observation and particle temperature measurement. The ignition mechanism of different coals
under various experimental conditions can therefore be easily determined by direct observation
with high-speed photography. The ignition rate-constants, when the ignition occurs
heterogeneously, and the particle heating rates will both be determined from analyses based on
direct, particle-temperature measurements using two-color pyrometry.
For the modeling portion of this study we will complete the development of the Distributed
Activation Energy Model of Ignition (DAEMI), which simulates the conventional drop-tube
furnace ignition experiment. The DAEMI accounts for particle-to-particle variations in reactivity

3
by having a single preexponential factor and a Gaussian distribution of activation energies among
the particles. Previous results show that the model captures the key experimental observations, and
that adjustments to the model parameters permit a good fit to experimental data. We will complete
the model by (1) examining the effects of other variations in physical parameters on the model, (2)
applying the model to published results in order to extract reaction parameters, and (3) extending
the model for application to laser-based ignition studies, such as our own.
Table of Contents
Disclaimer ...........................................................................................................................................................1
Abstract ...............................................................................................................................................................2
Table of Contents..............................................................................................................................................3
Executive Summary...........................................................................................................................................3
Introduction .......................................................................................................................................................4
Objectives ...........................................................................................................................................................4
Results from This Reporting Period and Discussion...................................................................................5
Personnel........................................................................................................................................................5
Computational Model...................................................................................................................................5
Experiment ....................................................................................................................................................6
Meetings and Conferences ..........................................................................................................................6
Goals for Next Quarter ....................................................................................................................................6
Appendix A ........................................................................................................................................................7
Executive Summary
During the past reporting period, modifications to the DAEMI were completed. The
changes were implemented to examine two aspects of ignition modeling: (1) the effect of varying
the number of particles chosen to interact with the laser, and (2) the size distribution for particle
sizes.
We have also completed making initial measurements of the ignition temperatures of a suite
of coals at three oxygen concentrations, and for three particle size ranges. The reduction of this
data from raw signals to temperatures has begun, and we expect it to be completed during the next
reporting period.
4
Introduction
The ignition of pulverized coal has been the subject of research for nearly 150 years, with the
initial motivation being the avoidance of coal-dust explosions in mines. In more recent times, due
to the world’s increased reliance on coal for power generation and the need to maximize energy-
conversion efficiency, research has shifted to understanding the fundamental mechanism of coal
ignition and measuring its kinetic rates. The importance of ignition to coal-flame stability is obvious
— the more easily a particular coal ignites after injection into a boiler furnace, the better its flame-
stability characteristics. A less obvious ramification of the ignition process is its role in establishing
extended, fuel-rich zones in coal flames which are responsible for the destruction of NOx and its
conversion to benign N2. Certainly, the ignition process is inextricably linked to the formation of
this NOx-reduction zone, and the ignition behavior of coals and coal blends will strongly affect the
ease and extent of formation of this zone. This connection is deserving of further study and its
understanding is the goal toward which we hope to apply the results of this proposed study.
Specifically, we propose to examine fundamental aspects of coal ignition through (1) experiments to
elucidate the ignition behavior of coals, and (2) modeling of the process to derive accurate and
useful rate constants, and to provide a more insightful interpretation of data from ignition
experiments.
Objectives
Our objectives for this project are to:
1. develop a novel experimental facility with extensive optical-diagnostic capabilities to study
coal ignition;
2. determine the ignition mechanism of coals under simulated combustion conditions by
direct observation with high-speed photography;
3. examine the effects of various experimental conditions, including coal rank, particle size,
oxygen concentration and heating rate, on the ignition mechanism; and
4. measure the ignition rate constants of various coals.
5. modify our existing ignition model to examine the effect of particle-size distribution on
the ignition behavior;
6. incorporate, if necessary, a size distribution into the model;
7. apply the model to extract ignition rate constants from previously published data from
conventional experiments;

5
8. modify the model and apply it to our laser-based ignition studies for determination of
ignition rate constants.
Results from This Reporting Period and Discussion
During the past reporting period, we have made excellent progress on model development
for this project. We are nearing completion of two manuscripts for submission and possible
publication. The first, “The Ignition Behavior of Pulverized Coals,” concerns mainly the
experimental measurements that we have obtained, and interprets these measurements in terms of
the model in its current form. The second manuscript, “Modeling the Ignition of Pulverized
Coals,” will focus on the current modifications to the Distributed Activation Energy Model of
Ignition (DAEMI) which we are in the process of implementing, along with some supporting
experimental measurements.
Personnel
The MS-candidate student working on the experiment portion of this project, Ms. Vida
Agyeman, has taken maternity leave as of late September. She has recovered and is back to attend
classes. We expect that she will return to full time work on this project by the end of this calendar
year.
The MS-candidate working on the modeling portion of this project, Ms. Jianping Zheng, has
completed her thesis and will be defending it on November 13, 1998. A portion of her draft thesis,
completed on October 22, 1998, is included as an appendix to this report, and forms the bulk of
the work completed during the past reporting period.
Finally, Professor John Chen, the Project Director for this project, has resigned his position
at North Carolina A&T State University, and is currently an Associate Professor of Mechanical
Engineering at Rowan University, effective August 1998. Professor Chen will continue to consult
on this project, which has been transferred to Dr. Samuel Owusu-Ofori, Professor of Mechanical
Engineering at North Carolina A&T State University.
Computational Model
A portion of Ms. Jianping Zheng’s MS thesis, titled “Modeling the Ignition Behavior of
Pulverized Coals,” is included as Appendix A of this report. The two sections included are Model
Analysis and Results, and Discussion.

6
Experiment
During the past reporting period we have completed the measurement of ignition
temperatures for a suite of four coals (Pittsburgh #8 high-volatile bituminous, Pocahontas low-
volatile bituminous, Wyodak subbituminous, and Pust lignite) at three oxygen concentrations, and
for two or three particle size ranges. The data reduction is currently underway to convert the raw
signal measurements to temperatures. We expect this to be completed during the next reporting
period. The complete set of data will be used as inputs to the modified Distributed Activation
Energy Model of Ignition (DAEMI).
Meetings and Conferences
A paper describing the results contained in this report was prepared and submitted to the
1999 Combustion Institute Joint US National Meeting, to be held in March 1999 in Washington,
DC.
At the Spring 1998 American Chemical Society National Meeting, we presented a paper
describing our research. This paper, co-authored by John Chen, Maurice Richardson, and Jianping
Zheng, won the Richard A. Glenn Award, the Fuel Chemistry Division’s Best Paper Award.
Goals for Next Quarter
During the next reporting period, we will complete the data reduction for the temperature
measurements made during this summer. The data will form the basis for further model
development using the DAEMI.

7
Appendix A
MODEL ANALYSIS AND RESULTS
3.1 Introduction Experiment
3.1.1 Laser Ignition Experiment
The experimental setup consists of a wind tunnel, gas flow system, coal feeder, detector,
laser gate, pulse generators laser and Optical system.
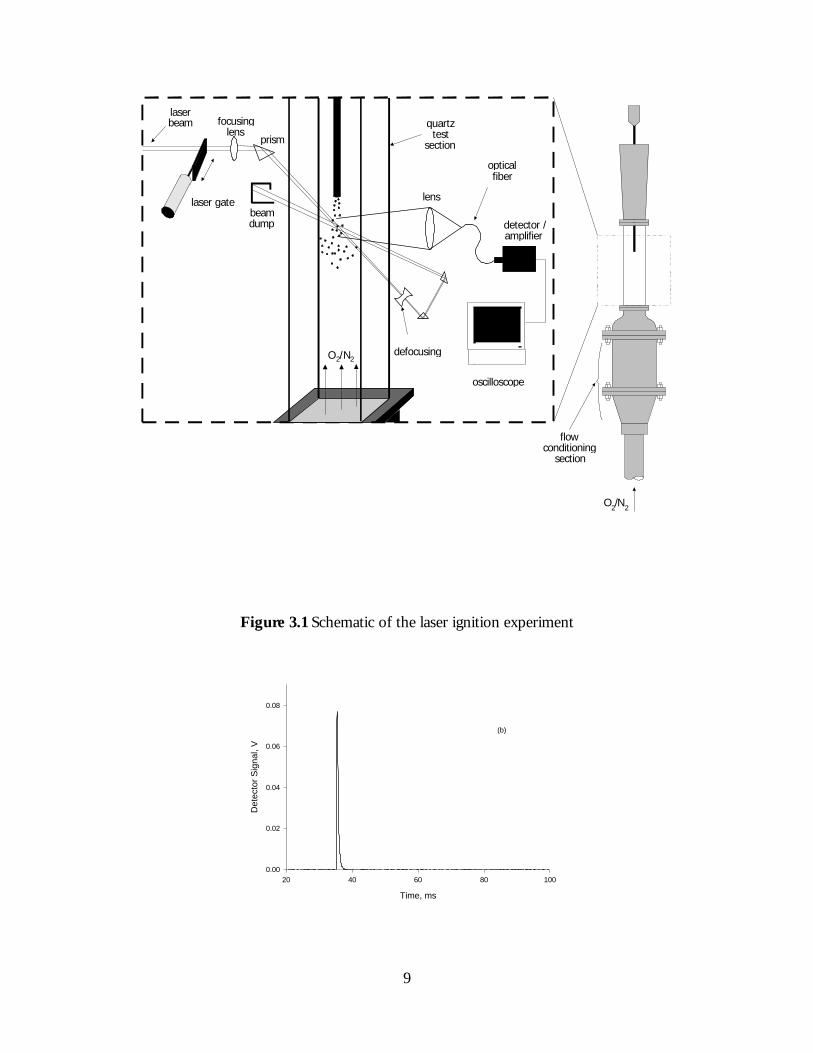
Figure 3.1 shows a schematic of the laser ignition experiment. Sieve-sized coal
particles are dropped batch-wise into a laminar upward-flow wind tunnel with quartz test
section (5cm square cross-section). The gas is not preheated, The gas flow rate was set so
that the particles emerged from the feeder tube, fell approximately 5 cm, then turned and
traveled upward out of the tunnel. This ensured that the particles were moving slowly
downward at the ignition point, chosen to be 2 cm below the feeder-tube exit.
A single pulse from a Nd:YAG laser was focused through the rest section, then
defocused after exiting the test section, and two sides in this manner achieved more spatial
uniformity and allowed for higher energy input than a single laser pass. For nearly every
case, one to three particles were particles were contained in the volume formed by the
two intersecting beams, as determined by previous observation with high-speed video.
The laser operated at 10 Hz and emitted a nearly collimated beam (6 mm diameter)
in the near-infrared (1.06 µm wavelength). The laser pulse duration was 100 µs and the
pulse energy was fixed at 830 mJ per pulse, with pulse-to-pulse energy fluctuations of less
than 3%. The laser pulse energy delivered to the test section was varied by a polarizer
placed outside of the laser head, variation from 150 to 750 mJ was achieved by rotating

8
the polarizer. Increases in the laser pulse energy result in heating of the coal particles to
higher temperatures. At the ignition point the beam diameter normal to its propagation
direction was 3 mm on each pass of the beam. An air-piston-driven laser gate (see Fig. 3.1)
permitted the passage of a single pulse to the test section. The system allowed for control
of the delay time between the firing of feeder and he passage of the laser pulse. Finally,
ignition or non-ignition was determined by examining the signal generated by a high-
speed silicon photodiode connected to a digital oscilloscope. Figure 3.2 presents typical
signal traces from the photodetector for both ignition and non-ignition events. Features of
the trace for the ignition case is similar to that described previously.
Particle temperature was measured by two-wavelength pyrometry. A simple lens
coupled to an optical fiber bundle collected light emitted by the igniting particles. The
output from the fiber bundle is collimated and separated into two beams via a dichroic
filter. Light of wavelengths below 0.75 µm (the dichroic filter’s cut-off wavelength) was
passed through a bandpass interference filtered centered at 0.7 µm with a optical
bandwidth of 40 nm. The remaining light was passed through an interference filter
centered at 0.9 µm with an optical bandwidth of 10 nm. Separate high-speed silicon
photodiodes detected each beam following the optical filters. The pyrometer was
calibrated using a 2-mm diameter blackbody source at 990oC.

9
flowconditioning
section
O2/N2
lens
quartztest
sectionprism
focusinglens
laserbeam
beamdump
O2/N2
detector /amplifier
oscilloscope
opticalfiber
defocusing
laser gate
Figure 3.1 Schematic of the laser ignition experiment
Time, ms
20 40 60 80 100
Det
ecto
r S
igna
l, V
0.00
0.02
0.04
0.06
0.08
(b)

10
60 80 1000.00
Time, ms
60 80 100
Det
ecto
r S
igna
l, V
0.00
0.02
0.04
0.06
0.08
(b)
Figure 3.2 Signal traces from photodetectors showing (a) non-ignition and (b) ignition eventsfor the Pittsburgh #8 bituminous coal. Particle size was 125-158 µm, and oxygenconcentration was 100%. The short-lived spike in both traces result from laserheating of the coal surface and subsequent cooling. Ignition and combustion of thecoals causes the long-lived emission of (b).

11
Figure 3.3 Typical data from a conventional ignition experiment showing the relation between
ignition frequency (or probability) and gas temperature for a bituminous coal.
Data extracted from Ref.4.
Figure 3.4 Typical data from our laser ignition experiment showing the relation between
ignition frequency and laser energy for bituminous coal.
0
20
40
60
80
100
200 250 300 350 400 450
Laser energy (mJ)
Ign
itio
n f
req
uen
cy (
%)
12
Figure 3.5 Distribution of Activation Energy as a Gaussian Distribution
Figure 3.6 Distribution of coal particle size as a Top-Hat Distribution

13
3.1.2 Drop-Tube Experiment by T. F. Wall’s Group [4]
The ignition experiments were carried out using a pulse ignition technique. Metered flows
of O2 and N2 were passed through an electrically heated tubular furnace at a rate of 500ml/min
(s.t.p.). A small quantity of sample was contained in a glass funnel with a capillary stem. By
gently tapping the funnel with an electric vibrator, a pulse of fuel (0.2-0.5mg or 1170 particle for
75-90µm size coal) was dropped into the furnace through a water-cooled probe. A
photomultiplier was used to detect the occurrence of ignition, which was indicated by the visual
flash of an igniting particle. The furnace was maintained at a fixed temperature. Ten to twenty
pulses of fuel were injected, and the number of pulses for which ignition responses were detected
was noted on a chart recorder. Figure 3.3 give typical results of ignition response versus furnace
gas temperature and indicate a temperature range over which the percentage of pulses resulting in
observed ignition flashes increases from 0 to 100.
3.2 Model Formulation
Figure 3.4 show typical data obtained from our ignition experiment conducted by varying
the laser energy while holding oxygen concentration, particle size and type of coal. Fig. 3.4 and
Fig. 3.3 show that ignition frequency increases approximately linearly with plus laser energy or
gas temperature, and these are inconsistent with the heterogeneous ignition theory previously
described. If all particles of a coal sample used in an experiment have the same reactivity, that is
if they are described by a common Arrhenius rate constant as in Eq. (2.7), then the data would
show an ignition frequency of 0% until the critical laser energy corresponding to that at the
critical ignition condition is reached. At any laser energy or gas temperature above critical
ignition condition, the ignition frequency would be 100.

14
One of the reasons why ignition frequency increases gradually with increasing laser energy
or gas temperature is obvious: Within any coal sample, there exists a distribution of reactivity
among the particles. Thus, in the laser ignition experiment, in which a batch of perhaps 4×10⁵
particles of a sample is dropped into the furnace, there is the probability (or frequency) that at
least one particle has a reactivity that meets or exceeds the critical ignition condition set forth in
equations (2.1) and (2.2) as the laser energy is increased. This is the ideal of DAEMI [10]. Of
course, there exist other variations among the particles within a sample, such as particle size and
specific heat. Variation in size alone could account for the observed increase in ignition frequency
with the laser energy pulse (or gas temperature) [1,4,5,8]. It cannot account for other
experimental observation, namely, the variation in the slope of the ignition frequency with oxygen
concentration. A distribution in specific heat would only affect the rate at which a particle attains
its equilibrium temperature, but would not change the value or the reactivity. Perhaps other
variations could cause the observed behavior of ignition frequency. It is our premise that the
distribution in reactivity and particle size dominates all other variations. We propose to add the
distribution of particle size into the DAEMI.
3.3 Simulation Procedure
Fig.3.5 shows the distribution of activation energy versus frequency for a sample for
which E0=58 kJ mol-1 and σ=5.5 kJ mol-1. The intervals of activated energy is 1kJ mol-1 (∆E=1kJ
mol-1).
The Distributed Activated Energy Model of Ignition (DAEMI) simulates our laser ignite
and drop-tube experiment by allowing for the particles within the coal sample to have a
distribution of reactivity (Chapter 2.3). We first calculate the probability of particles for being in
each of the intervals.

15
The distributed of particle size model of ignition assumes that in a small range of particle
size, the distribution of particle size is Top-Hat distribution (Fig 3.6). The interval of particle size
is 1µm (∆Dp=1.0×10⁻⁶m). Particle sizes are grouped into three. These are 106.0 to 125.0µm,
125 to 150µm, 150.0 to 180.0µm respectively.
3.3.1 Base Case
Now, the heat generated by a spherical carbon particle undergoing oxidation on its
external surface is given by the kinetic expression:
−=
p
noc
gen
RT
EAxH
S
Qexp02
(3.1)
Similarly, the heat loss from the surface of a particle at temperature Tp is the sum of losses due to
convection and radiation. Thus, heat loss from the surface is given as:
( )44)( gpbgploss TTSTThSS
Q−+−= εσ (3.2)
For the convection-loss term, we assume that the Nusselt number equals 2, as is appropriate for
very small particles, which leads to pg dkh /2= .
( )44)(2
gpbgpp
gloss TTSTTSd
k
S
Q−+−= εσ (3.3)
At the critical ignition condition, lossgen QQ = , we obtain
( ) ( )
−+−
−=0
44
2
2
lnAxH
TTTTd
k
RTEnoc
gpbgp
p
g
p
εσ
(3.4)
where the required parameters for this equation were calculated as follows:

16
For base case of the model, we assumed that Tp was obtained from the equilibrated
temperature calculations by use of a linear regression to regress Tp as a function of laser energy
(see appendix 1). For example, for 70µm.116µm and 165µm coal particle the temperature are
given as functions of laser energy as [19]
22.3857266.0)116(
+= lasermp ETµ
(3.5)
08.4270707.1)70( += lasermp ET µ (3.6)
57.3675505.0)165( += lasermp ET µ (3.7)
For variable particle size, we use interpalation mathematics method define:
( )( ))116(
)116()70(
61)11670(
6116mp
pmpmpp T
e
edTTT µ
µµ +−××−
−−−= dp<116µm (3.8)
( )( ))116(
)116()165(
61)116165(
6116mp
pmpmpp T
e
edTTT µ
µµ +−××−
−−−= dp>116µm (3.9)
kg the gas thermal conductivity in the boundary layer around a heated particle was given
by a linear fit to the conductivity of air [11].
+×= −
2100.7 5 gp
g
TTk (3.10)
Hc is defined by the equation [16]
2,, '1
1'
1 COCCOCc Hy
Hy
yH
++
+= (3.11)
It is well known that the product of carbon oxidation is both CO and CO2, COCH ,' and 2,' COCH are
the heats of combustion corresponding to the following oxidation reaction [11].

17
kgC
kJHCOOC
kgC
kJHCOOC
COC
COC
790,32';
210,9';2
1
2,22
,2
=→+
=→+(3.12)
Where
−==
pTmolCO
molCOy
3214exp95.59
2
(3.13)
ε, the emissivity of coal particles was taken as 0.8.
n, the reaction order was taken as 1.
χo2 was chosen to be 1.0 corresponding to a 100% oxygen concentration.
For each laser energy, twenty runs were made to obtain ignition-frequency distributions.
3.3.2 laser Ignition Experiment
When we were using this version of DAEMI to fit the laser ignition experiment. The
experiment data of Tp was reading directly from data files (see appendix 3). Then to calculate
average temperature (Tavg) and standard deviation (Tσ), base on Normal Distribution,
N
TT p
avg
∑= (N is the number of Tp) (3.14)
1
)( 2
−
−= ∑
N
TTT avgp
σ (3.15)
to obtain the range of temperature, namely, Tavg-2Tσ < Tp < Tavg+2Tσ, by randomly choosing
particle temperature from the range to obtain critical energy at each condition.
In this experiment, in which a batch with several hundred particles are dropped in to the
test section, and only a few are heated by the laser pulse. There is an increasing probability (or
frequency) as the laser energy is increased that at least one of the heated particles is reactive

18
enough to ignition under the given conditions. For nearly every case, one to three particles are hit
in the test section by two intersecting laser beams. This is determined by observations with high-
speed video. For simulation, thirteen hundred particles are then selected randomly as they feed
into the test section and two particles are further selected randomly from these 1300 to be hit by
the laser pulse, keeping in mind that no particle can be selected twice.
For randomly selected two particles with particle size and activation energy. Substituting
preexponential factor (A0), mean of Gaussian distribution of activation energy (E0), standard
deviation of Gaussian distribution (σ) and reaction order (n) in Eq. (3.4), E can be calculated as
the critical (or threshold) activation energy that a particle may have and still ignite under the given
conditions. The result (E) is compared with the activation energy. If the result (E) is greater than
the activation energy among the particles that were hit, then the particle is considered ignited.
At each set of operating conditions (coal type and size, oxygen concentration, and laser
energy), 20 attempts at ignition are made in order to get the ignition frequency, or probability,
which is the parameter sought from these studies. We compare this simulated ignition frequency
with the experimental results over a range of laser pulse energy.
3.2.3 Drop-Tube Experiment
In simulating the drop-tube ignition experiment, we assumed that 106 particle are in the
initial batch. A batch of 1170 particles of a sample is dropped into the furnace in each simulation
of an experimental run. No particle can be selected more than once. Whether or not ignition
occurs for a run is determined by the particle in the batch of 1170 with the lowest activation
energy.
Now, using Eq. (3.1) and Eq. (3.3) we can obtain the heat generated Qgen and Qloss. In
order to determine the critical ignition temperature of the particle, Tp, and critical activation

19
energy, E, the critical ignition condition, Qgen = Qloss, and p
loss
p
gen
dT
dQ
dT
dQ= are solved
simultaneously. Qgen and Qloss are given in Eqs. (3.1) and (3.3), and lead to the following
derivatives with respect to temperature:
−=
20 exp2
pp
noc
p
gen
RT
E
RT
EAxSH
dT
dQ(3.16)
342
pbp
g
p
loss STSd
k
dT
dQεσ+= (3.17)
Note that the neglection of the Tp dependence in kg introduces a small error in Eq. (3.15).
Following p
loss
p
gen
dT
dQ
dT
dQ= , we set Eq. (3.14) equal to Eq. (3.15) and solve for the
quantity E/RTp:
−
+
=
p
noc
pbpp
g
p
RT
EAxH
TTd
k
RT
E
exp
42
0
4
2
εσ
(3.18)
The denominator is recognized to be Qgen/S Eq. (3.1), which by Qgen = Qloss is also Qloss/S
Eq. (3.2). Thus Eq. (3.16) can be rewritten as:
)()(2
42
44
4
gpbgpp
g
pbpp
g
p TTTTd
k
TTd
k
RT
E
−+−
+
=εσ
εσ
(3.19)
This relation for E/RTp is substituted into the expression Qgen -Qloss = 0 to obtain a
function, F, which is a function of Tp only:

20
( ) ( )( ) ( ) 0
2
2
42
exp
)(
44
44
4
02=−−−−
−+−
−
=
−=
gpbgpp
g
gpbgpp
g
pbpp
g
noc
lossgenp
TTTTd
k
TTTTd
k
TTd
k
AxH
QQTF
εσεσ
εσ(3.20)
The reasonable root of F (Tp) corresponds to the critical ignition temperature of the
particle, and substitution of this value into Eq. (3.19) produces the critical activation energy at the
critical ignition condition.
kg, the gas thermal conductivity in the boundary layer around a heated particle was given
by Eq. (3.10).
χo2 was chosen to be 0.5 corresponding to a 50% oxygen concentration.
ε, the emissivity of coal particle was taken as 0.8.
Hc was defined by the equation from (3.11) to (3.13).
Substituting all the required values in Eq. (3.4), E obtain the result as the critical (or
maximum) activation energy that a particle may have and still ignite under the given conditions.
By randomly choosing each particle with activation energy for a run, then get the particle in the
batch of 1170 with the lowest activation energy. we compared the result (E) with the lowest
activation energy. If the result (E) is greater than the lowest activation energy among the particle
that was heated in a run, The particle was ignited.
3.3 Modeling Results
3.3.1 Results of the Base Case of the Model

21
Figure 3.7 and Fig. 3.8 shows the effect of oxygen concentration and number of particle
(M) on ignition frequency for particle size range of 106-125µm and 150-180µm, respectively. It
can be seen that at each oxygen concentration, ignition frequency increases monotonically over
the range of laser pulse energy. Below this range, the ignition frequency is zero, and above this
range the result is 100% ignition frequency. As the number of particle (M) is increased from 1 to
300, the frequency distribution shifts to lower laser energy values. This behavior is due to the fact
that, within any coal sample, there exists a distribution of reactivity among the particles.
As the oxygen concentration is decreased from 100% to 67%, the frequency distribution
shifts to higher laser energies or equivalently, higher particle temperatures, as expected. This is
consistent with the ignition theory since at decreased oxygen concentration, higher temperatures
are necessary for heat generation by the particles (due to chemical reactions) to exceed heat loss
from the particles and lead to ignition. The shift in distribution can be viewed in two ways: for a
fixed laser pulse energy, a decrease in oxygen concentration leads to a decrease in the ignition
frequency, all else being equal; Second, a decrease in oxygen concentration implies that a higher
laser pulse energy is needed, in order to achieve the same ignition frequency.
Figure 3.9 and Fig. 3.10 show the same effect of Distribution Particle Size in 150-180µm
and average particle size (165µm) on ignition frequency for oxygen concentration of 100% and
67%. Fig.3.11 and Fig.3.12 also show that the same effect of distribution particle size in 106-
125µm and average particle size (115µm) on ignition frequency for 100% and 67% of O2.

23
Figure 3.7 Modeling results showing the effect of M (numbers of particles were ignited at one drop time) and oxygen
concentration on ignition frequency. (a) Solid-line express 67% oxygen concentration (xo2 =67%); (b) Dash-line
express 100% oxygen concentration (xo2 =100%). Particle size is 106-125 µm, and all other parameters are as listed
in Table 3.1.
0
10
20
30
40
50
60
70
80
90
100
0 100 200 300 400 500 600 700 800
Laser energy (mJ)
Ign
itio
n f
req
uen
cy (
%)
M=300, 67% oxygen
M=50, 67% oxygen
M=10, 67% oxygen
M=3, 67% oxygen
M=1, 67% oxygen
M=300, 100% oxygen
M=50, 100% oxygen
M=10, 100% oxygen
M=3, 100% oxygen
M=1, 100% oxygen
Linear (M=300, 67%oxygen)

24
Figure 3.8 Modeling results showing the effect of M (numbers of particles were ignited at one drop time) on ignition
frequency. (a) Solid-line express 67% oxygen concentration (xo2 =67%); (b) Dash-line express 100% oxygen
concentration (xo2 =100%). Particle size is 150-180 µm, and all other parameters are as listed in Table 3.1.
0
10
20
30
40
50
60
70
80
90
100
0 100 200 300 400 500 600 700 800 900 1000
Laser energy (mJ)
Ign
itio
n f
req
uen
cy (
%)
M=300, 67% oxygen
M=50, 67% oxygen
M=10, 67% oxygen
M=3, 67% oxygen
M=1, 67% oxygen
M=300, 100% oxygen
M=50, 100% oxygen
M=10, 100% oxygen
M=3, 100% oxygen
M=1, 100% oxygen
Linear (M=300, 67%oxygen)

25
Table 3.1 Parameters Used in the Base Case of the Model of Laser Ignition
Experiment
Variable Value
E0
A0
σ
n
ε
58 kJ/mol
250 kg/m2s
5.5 KJ/mol
1.0
0.8

27
Figure 3.9 Modeling results showing the effect of average particle size 165µm and the range of particle size 150-180µm in ignition
frequency. Oxygen concentration is 100%. All other parameters are as listed in Table 3.1. (a) Solid-line express particle
size dp=165µm; (b) Dash-line express distribution particle size Dp in 150-180µm.
Particle size: 165 and 150-180 um, oxygen concentration: 100%
0
10
20
30
40
50
60
70
80
90
100
0 100 200 300 400 500 600 700
Laser energy (mJ)
Ign
itio
n f
req
uen
cy (
%) M=3,dp=165um
M=10,dp=165umM=10, dp=150-180 umM=3,dp=150-180 umLinear (M=3,dp=165um)Linear (M=10,dp=165um)Linear (M=10, dp=150-180 um)Linear (M=3,dp=150-180 um)

28
Figure 3.10 Modeling results showing the effect of the average particle size 165µm and the range of particle size150-180 µm onignition frequency. Oxygen concentration is 67%. All other parameters are as listed in Table 3.1. (a) Solid-lineexpress particle size dp=165µm; (b) Dash-line express distribution particle size dp in 150-180µm.
Praticle size:165 and 150-180 (um), Oxygen concentration: 67%
0
10
20
30
40
50
60
70
80
90
100
0 100 200 300 400 500 600 700
laser energy (mJ)
Ign
itio
n f
req
uen
cy (
%) M=10,dp=165um
M=3,dp=165um
M=10,dp=150-180um
M=3,dp=150-180um
Linear (M=10,dp=165um)
Linear (M=3,dp=165um)
Linear (M=10,dp=150-180um)
Linear (M=3,dp=150-180um)

29
Particle size: 116 and 106-125 um, Oxygen concentration: 100%
0
10
20
30
40
50
60
70
80
90
100
0 100 200 300 400 500 600
Laser energy (mJ)
Ign
itio
n f
req
uen
cy (
%) M=3,dp=116um
M=10,dp=106-125um
M=3,dp=106-125um
M=10,dp=116um
Linear (M=3,dp=116um)
Linear (M=10,dp=106-125um)
Linear (M=3,dp=106-125um)
Linear (M=10,dp=116um)

30
Figure 3.11 Modeling results showing the effect of average particle size 116 µm and the range of particle size 106-125µm in ignition
frequency. Oxygen concentration is 100%. All other parameters are as listed in Table 3.1. (a) Solid-line express particle size
dp=116µm; (b) Dash-line express the distribution of particle size dp in 106-125µm.

31
Figure 3.12 Modeling results showing the effect of the average particle size 116 µm and the range of particle size106-125 µm onignition frequency. Oxygen concentration is 67%. All other parameters are as listed in Table 3.1. (a) Solid-line expressparticle size dp=116µm; (b) Dash-line express distribution particle size dp in 106-125µm.
Praticle size : 116 and 106-125um, Oxygen concentration: 67%
0
10
20
30
40
50
60
70
80
90
100
0 100 200 300 400 500 600
Laser energy (mJ)
Ign
itio
n f
req
uen
cy (
%) M=3,dp=116um
M=10,dp=116um
M=3,dp=106-125um
M=10,dp=106-125um
Linear (M=3,dp=116um)
Linear (M=10,dp=116um)
Linear (M=3,dp=106-125um)
Linear (M=10,dp=106-125um)

33
3.3.2 Results of Simulation Laser Ignition Experiment
The simulations for the experiments were performed via a FORTRAN code (Appendix 3).
The code was designed to produce frequency distribution data for a given particle size (diameter,
dp) range, oxygen concentration and, temperature of particle and laser pulse energy. As
discussed earlier, for each run two particles are selected randomly from 1300 particles. The
particle size and activation energy are determined whether or not ignition occurred for the run.
For each type coal, the parameters required as input are the average activation energy (E0),
standard deviation for the Gaussian distribution (σ), and pre-exponential factor (A0).
Figure 3.13-3.15 show the experiment data for the Pittsburgh #8 coal with modeling
results using anther method, that calculate average temperature and standard deviation to obtain
the range of particle temperature at each condition. Figure 3.16-3.17 show the experiment data
for the Pust coal with the modeling results using the range of particle temperature. Figure 3.18
shows the experiment data for the Wyodak coal with the modeling results using the range of
particle temperature. The behavior of the model with respect to changes in each of the
parameters was first observed. The parameters are then modified to obtain a final set of values to
improve the model. The final parameters that fit our laser ignition experimental data of each type
coal are given the following table.
Table 3.2 shows all Pittsburgh#8 coal’s parameters of Figure 3.13-3.15. There are all Pust
coal’s parameters of Figure 3.16-3.17 in Table 3.3. There are all Wyodak coal’s parameters of
Figure 3.18 in Table 3.4.
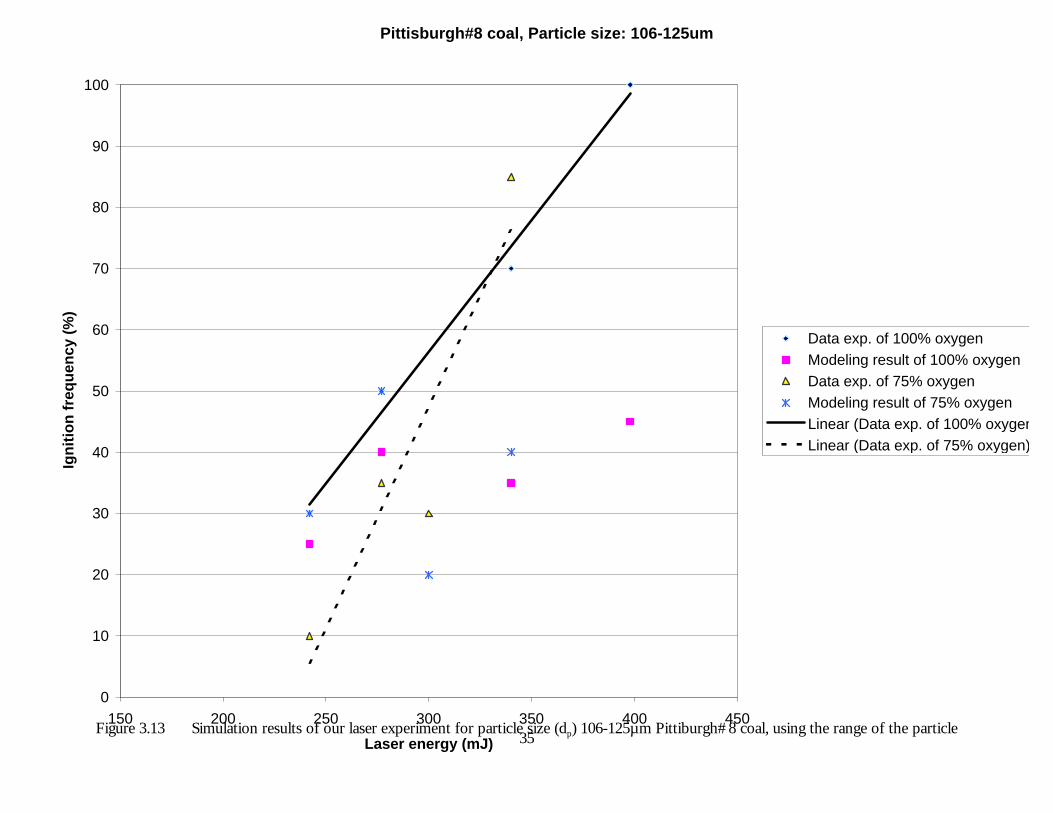
35Figure 3.13 Simulation results of our laser experiment for particle size (dp) 106-125µm Pittiburgh#8 coal, using the range of the particle
Pittisburgh#8 coal, Particle size: 106-125um
0
10
20
30
40
50
60
70
80
90
100
150 200 250 300 350 400 450
Laser energy (mJ)
Ign
itio
n f
req
uen
cy (
%)
Data exp. of 100% oxygenModeling result of 100% oxygenData exp. of 75% oxygenModeling result of 75% oxygenLinear (Data exp. of 100% oxygen)Linear (Data exp. of 75% oxygen)
36
temperatures. All other parameters are as listed in Table 3.2
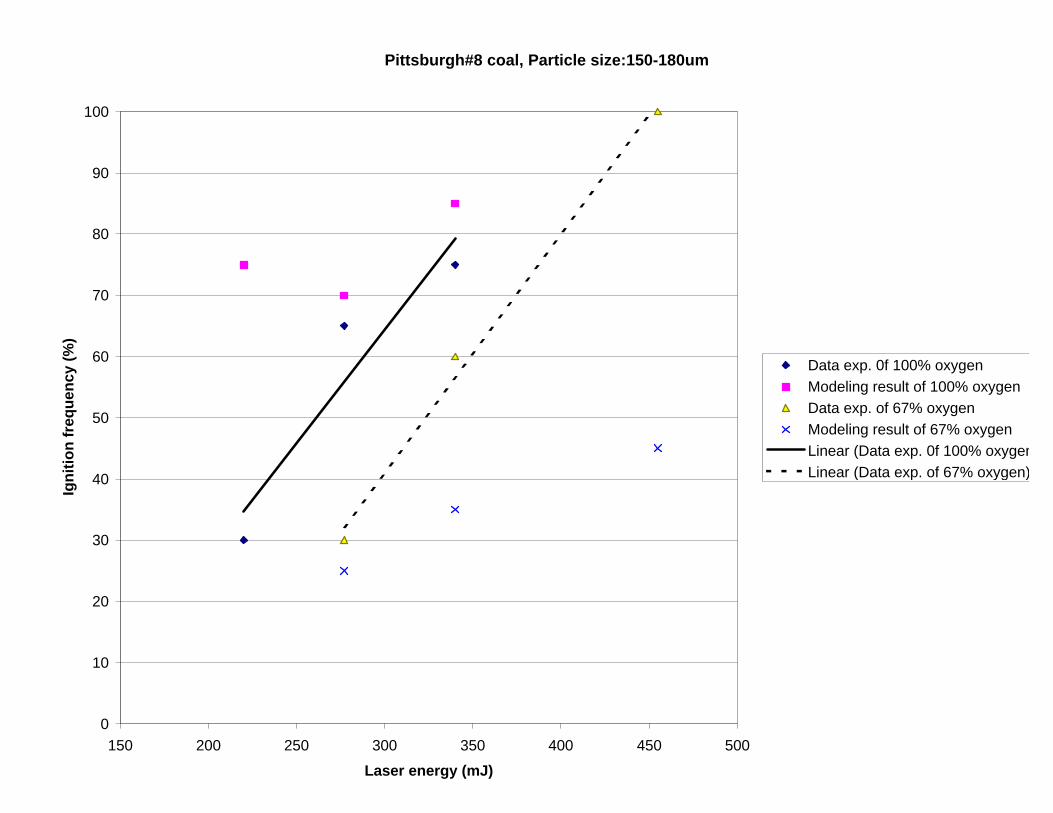
Figure 3.14 Simulation results of our laser experiment for particle size (dp) 150-180µm Pittiburgh#8 coal, using the range of the particle
temperatures. All other parameters are as listed in Table 3.2
Pittsburgh#8 coal, Particle size:150-180um
0
10
20
30
40
50
60
70
80
90
100
150 200 250 300 350 400 450 500
Laser energy (mJ)
Ign
itio
n f
req
uen
cy (
%)
Data exp. 0f 100% oxygenModeling result of 100% oxygenData exp. of 67% oxygenModeling result of 67% oxygenLinear (Data exp. 0f 100% oxygen)Linear (Data exp. of 67% oxygen)

37
Figure 3.15 Simulation results of our laser experiment for particle size (dp) 125-150µm Pittiburgh#8 coal, using the range of the particle
temperatures. All other parameters are as listed in Table 3.2
Pittsburgh#8 coal, Partical size: 125-150um
0
10
20
30
40
50
60
70
80
90
100
150 200 250 300 350 400
Laser energy (mJ)
Ign
itio
n f
req
uen
cy (
%)
Data exp. of 100% oxygen
Modeling result of 100% oxygenData exp. of 75% oxygen
Modeling result of 75% oxygenLinear (Data exp. of 100% oxygen)
Linear (Data exp. of 75% oxygen)

39
Table 3.2 Parameters Simulate Pittsburgh#8 Coal in Laser Ignition Experiment using
the range of measured particle temperature
Variable Value
E0
A0
σ
n
ε
135 kJ/mol
250 kg/m2s
12 KJ/mol
1
0.8

41
Figure 3.16 Simulation results of the laser Experiment for particle size (dp) 106-125 µm Pust coal, using the range of the particle
temperatures. All other parameters are as listed in table 3.3.
pust coal, Particle size: 106-125um
0
10
20
30
40
50
60
70
80
90
0 100 200 300 400 500 600
Laser energy (mJ)
Ign
itio
n f
req
uen
cy (
%)
Data exp. of 67% oxygen
Modeling result of 76% oxygen
Data exp. of 100% oxygen
Modeling result of 100% oxygen
Linear (Data exp. of 67% oxygen)
Linear (Data exp. of 100% oxygen)
42
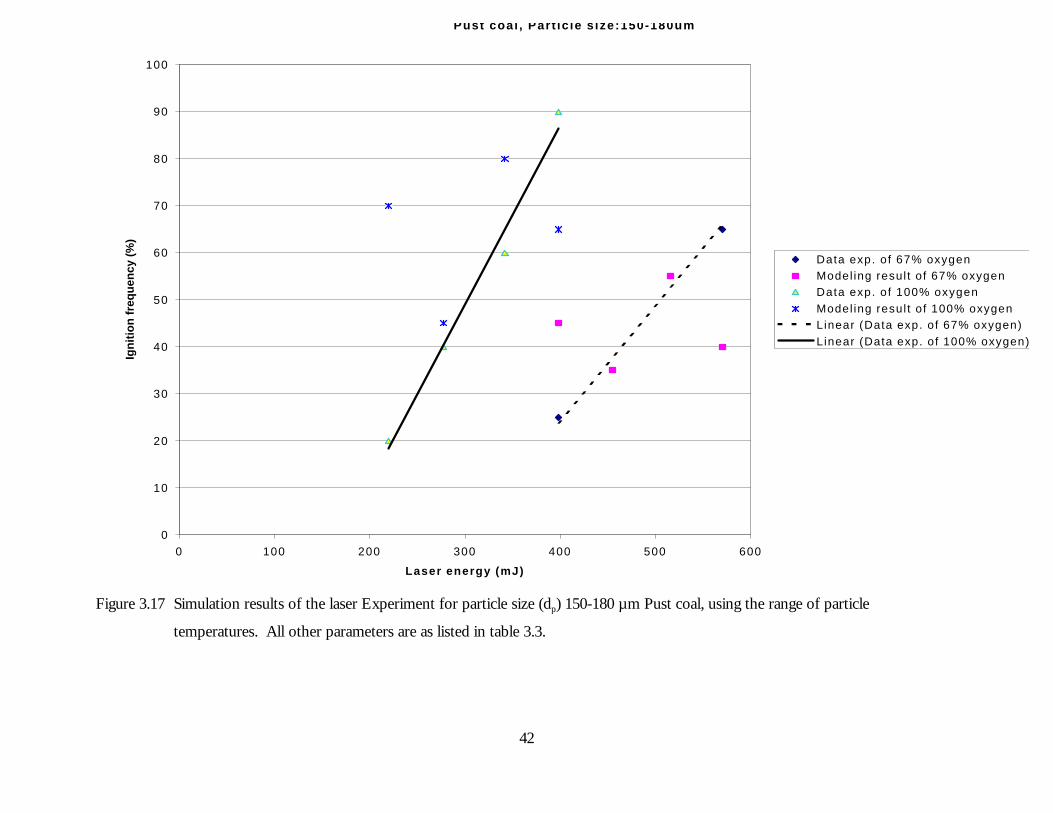
Figure 3.17 Simulation results of the laser Experiment for particle size (dp) 150-180 µm Pust coal, using the range of particle
temperatures. All other parameters are as listed in table 3.3.
Pust coal , Part ic le s ize:150-180um
0
10
20
30
40
50
60
70
80
90
100
0 100 200 300 400 500 600
Laser energy (mJ)
Ign
itio
n f
req
uen
cy (
%)
Data exp. of 67% oxygenModel ing resul t of 67% oxygenData exp. of 100% oxygenModel ing resul t of 100% oxygenLinear (Data exp. of 67% oxygen)Linear (Data exp. of 100% oxygen)

43
Figure3.18 Simulation results of the laser experiment for particle size 150-180µm Wyodak coal, using the range of particle temperatures.
All other parameters are as listed in table 3.4.
W yodak coal, Particle size: 150-180um
0
20
40
60
80
100
120
0 100 200 300 400 500 600
Laser energy (mJ)
Ign
itio
n f
req
uen
cy (
%)
Data exp. of 100% oxygen
Modeling result of 100% oxygen
Data exp. of 67% oxygen
Modeling result of 67% oxygen
Linear (Data exp. of 67% oxygen)
Linear (Data exp. of 100% oxygen)

45
Table 3.3 Parameters Simulate Pust Coal in Laser Ignition Experiment
Variable Value
E0
A0
σ
n
ε
120 (kJ/mol)
200 (kg/m2s)
40 (KJ/mol)
1
0.8
Table 3.4 Parameters Simulate Wyodak Coal in Laser Ignition Experiment
Variable Value
E0
A0
σ
n
ε
115 (kJ/mol)
100 (kg/m2s)
40 (KJ/mol)
1
0.8
3.3.3 Drop-Tube Experiment

46
The required simulations for drop-tube experiments have performed by a FORTRAN code
(Appendix 2). The code was designed to produce frequency distribution data for a given average
particle size (diameter dp) or the maximum diameter (dpmax) and minimum diameter (dpmin) of
particle size range, oxygen concentration and, temperature of gas. The particle with the lowest
activation energy determines whether or not ignition occurred for a run. The parameters required
to be input were average activation energy (E0), standard deviation for the Gaussian distribution
(σ), preexponential factor (A0) and reaction order (n).
Respectively, Figure 3.19-3.20 show the experiment data for coal#1 and coal#2 with the
modeling results using distribution of particle size. There are all parameters of coal#1 and coal#2
for Figure 3.19-3.20 in Table 3.5 and Table 3.6. Figure 3.21-3.22 show the experiment data for
coal#1 and coal#2 with the modeling results by average particle size. These parameters of coal#1
and coal#2 for Figure 3.21-3.22 are listed in Table 3.7 and Table 3.8.

47
Figure3.19 Simulate result of drop-tube experiment [4] for particle size 75-90µm coal #1, using distribution particle size isincorporated into the DAEMI. All other parameters are as listed in Table 3.5.
0
10
20
30
40
50
60
70
80
90
100
600 650 700 750 800 850 900
Laser energy (mJ)
Ign
itio
n f
req
uen
cy (
%) Data exp. of 100% oxygen
Modeling result of 100% oxygenData exp. of 50% oxygen
Modeling result of 50% oxygenData exp. of 21% oxygenModeling result of 21% oxygenData exp. of 10% oxygen
Modeling result of 10% oxygen

48
Figure 3.20 Simulation results of drop-tube experiment [1] for particle size 75-90 µm coal#2, using distribution particle sizeis incorporated into the DAEMI. All other parameters are as listed in Table 3.6.
0
1 0
2 0
3 0
4 0
5 0
6 0
7 0
8 0
9 0
1 0 0
6 0 0 6 5 0 7 0 0 7 5 0 8 0 0 8 5 0 9 0 0
L a s e r e n e r g y ( m J)
Ign
itio
n f
req
uen
cy (
%) D a t a e x p . o f 1 0 0 % o x y g e n
M o d e l i ng resu l t o f 100% o x y g e nD a t a e x p . o f 5 0 % o x y g e nM o d e l ing resu l t o f 50% o x y g e nD a t a e x p . o f 2 1 % o x y g e nM o d e l ing resu l t o f 21% o x y g e nD a t a e x p . o f 1 0 % o x y g e nM o d e l ing resu l t o f 10% o x y g e n

49
Table 3.5 Parameters Simulate cola#1 in Drop-Tube Experiment [4] (Using
distribution of particle size in DAEMI)
Variable Value
E0
A0
σ
n
ε
70.0 (kJ/mol)
300.0 (kg/m2s)
1.0 (KJ/mol)
0.5
0.8
Table 3.6 Parameters Simulate cola#2 in Drop-Tube Experiment [4] (Using
distribution of particle size in DAEMI)
Variable Value
E0
A0
σ
n
ε
71.0 (kJ/mol)
320.0 (kg/m2s)
1.0 (KJ/mol)
0.5
0.8

51
Figure 3.21 Simulation results of drop-tube experiment [4] for particle size 83 µm coal #1. All other parameters are as listed in
Table 3.7.
0
10
20
30
40
50
60
70
80
90
100
600 650 700 750 800 850 900
Laser energy (mJ)
Ign
itio
n f
req
uen
cy (
%) Data exp. of 21% oxygen
Modeling result of 21% oxygen
Data exp. of 10% oxygen
Modeling result of 10% oxygen
Data exp. of 50% oxygen
Modeling result of 50% oxygen
Data exp. of 100% oxygen
Modeling result of 100% oxygen

52
Figure 3.22 Simulation results of drop-tube experiment [4] for particle size 83 µm coal #2. All other parameters are as listed in
Table 3.8
0
10
20
30
40
50
60
70
80
90
1 0 0
6 0 0 6 5 0 7 0 0 7 5 0 8 0 0 8 5 0 9 0 0
Laser energy (m J)
Ign
itio
n f
req
uen
cy (
%) Data exp . o f 100% oxygen
Mode l ing resu l t o f 100% oxygenMode l i ng resu l t o f 50% oxygenDa ta exp . 21% o f oxygenMode l i ng resu l t o f 21% oxygenDa ta exp . o f 10% oxygenMode l i ng resu l t o f 10% oxygenDa ta exp . o f 50% oxygen

53
Table 3.7 Parameters Simulate cola#1 in Drop-Tube Experiment [4], using the
average particle size.
Variable Value
E0
A0
σ
n
ε
92 (kJ/mol)
110 (kg/m2s)
10 (KJ/mol)
0.44
0.8
Table 3.8 Parameters Simulate cola#2 in Drop-Tube Experiment [4], using
average particle size.
Variable Value
E0
A0
σ
n
ε
98.6 (kJ/mol)
111 (kg/m2s)
12 (KJ/mol)
0.37
0.8

54
DISCUSSION OF RESULTS
4.1 Comparison with Drop-Tube Experiment
Either the range of particle size (75-90µm) or the average particle size (83µm) can
be used in the current version of DAEMI. The DAEMI can be fitted to the experimental
data [4] shown in Figures 3.19-3.22. Figures 3.19-22 also shown the almost same effect of
Distribution Particle Size in 75-90 µm and average particle size 83 µm on ignition frequency
for oxygen concentration from 10% to 100%. The small standard deviation, σ (1.0 kJ/mol)
is used to obtain the results from the current version of DAEMI using the distribution of
particle size and the average particle size. The narrow distribution (small standard deviation)
leads to a small energy range since most particles have similar activation energies. This
behavior is due to the fact that a distribution of reactivity exists among the particles. The
particle diameters are randomly selected from the range of particle size to calculate the
critical activation energy. Different particle diameters correspond to the different critical
activation energies. When the different critical activation energy is larger than the activation
energy that a particle has, that particle is considered ignition.
The larger σ (10.0-12.0 kJ/mol) is used to obtain the modeling results from the old
version of DAEMI using the average particle size. Since the subsidiary simulation condition
is that the particle own the lowest activation energy in the batch could be ignited.
According to the experiment phenomenon, it is not always true that only the particle own
the lowest activation energy can be ignited. In Tables 3.7-3.8, these parameters that were
obtain by consider the particle in the batch of 1170 particles could has the lowest activation
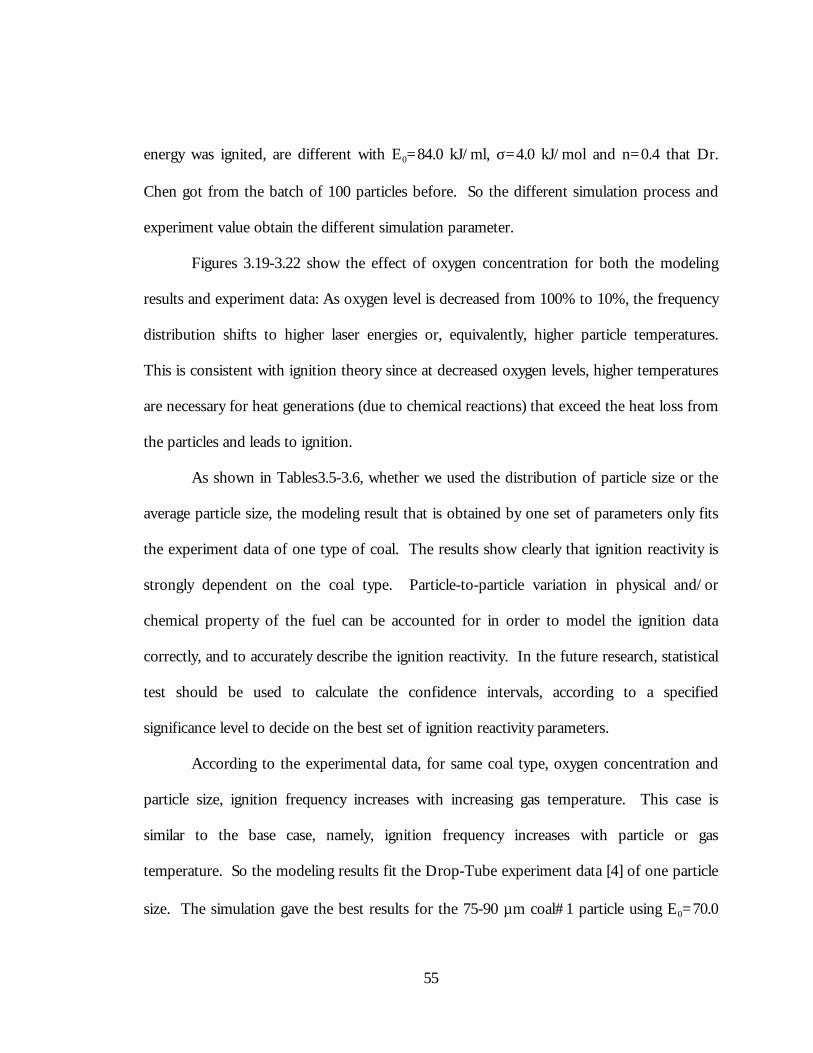
55
energy was ignited, are different with E0=84.0 kJ/ml, σ=4.0 kJ/mol and n=0.4 that Dr.
Chen got from the batch of 100 particles before. So the different simulation process and
experiment value obtain the different simulation parameter.
Figures 3.19-3.22 show the effect of oxygen concentration for both the modeling
results and experiment data: As oxygen level is decreased from 100% to 10%, the frequency
distribution shifts to higher laser energies or, equivalently, higher particle temperatures.
This is consistent with ignition theory since at decreased oxygen levels, higher temperatures
are necessary for heat generations (due to chemical reactions) that exceed the heat loss from
the particles and leads to ignition.
As shown in Tables3.5-3.6, whether we used the distribution of particle size or the
average particle size, the modeling result that is obtained by one set of parameters only fits
the experiment data of one type of coal. The results show clearly that ignition reactivity is
strongly dependent on the coal type. Particle-to-particle variation in physical and/or
chemical property of the fuel can be accounted for in order to model the ignition data
correctly, and to accurately describe the ignition reactivity. In the future research, statistical
test should be used to calculate the confidence intervals, according to a specified
significance level to decide on the best set of ignition reactivity parameters.
According to the experimental data, for same coal type, oxygen concentration and
particle size, ignition frequency increases with increasing gas temperature. This case is
similar to the base case, namely, ignition frequency increases with particle or gas
temperature. So the modeling results fit the Drop-Tube experiment data [4] of one particle
size. The simulation gave the best results for the 75-90 µm coal#1 particle using E0=70.0

56
kJ/mol, σ=1.0 kJ/mol, A0=300 kg/m2s, n=0.5. The model also was found to give the best
fit to the 75-90 µm coal#2 particle for E0=71.0 kJ/mol, σ=1.0 kJ/mol, A0=320 kg/m2s,
n=0.5. It is also found that using n=1.0 difficult to fit to the experiment data [4].
4.2 Comparison with Laser Experiment
For the laser experiment, the DAEMI incorporated the distribution of particle size.
The modeling results and the experimental data are shown in Figures 3.13-3.18. These
figures all show the effect of oxygen concentration for both the modeling results and
experimental data at the same particle size. As the oxygen level is decreased from 100% to
67%, the frequency distribution shifts to higher laser energies, this phenomenon is same as
the Drop-Tube experiment. Using those different experimental techniques, we could
improve the ignition theory.
Figures 3.13-18 and Tables 3.2-3.4 indicate that the model could account for
particle-to-particle variations in reactivity by having a single pre-exponential factor and a
Gaussian distribution of activation energies among the particles within a type coal (a
sample). The simulation gives final result for the Pust coal all over the laser energies
considered, the oxygen concentration and particle size using E0=120.0 kJ/mol, σ=40.0
kJ/mol, A0=200 kg/m2s, n=1.0. The modeling results fit the Wyodak coal all over the laser
energies, the oxygen concentration and the particle size using E0=115.0 kJ/mol, σ=40.0
kJ/mol, A0=100 kg/m2s, n=1.0. The modeling results also fit the Pittsburgh#8 all over the
laser energy, the oxygen concentration and the particle size using E0=135.0 kJ/mol, σ=12.0
kJ/mol, A0=250 kg/m2s, n=1.0.

57
The measured particle temperatures of Pust and Wyodak coal are lower than the
Pittsburgh#8. The simulation result of Pust and Wyodak are better than that of the
Pittsburgh#8. The heat generated by a spherical carbon particle undergoing oxidation on its
external surface, it is determined by the kinetic expression and the oxidant diffusion
expression. At the lower range of particle temperature, the heat is mainly generated by the
kinetic expression; at the higher range of particle temperature, the heat is mainly generated
by the oxidant diffusion expression. In the current version of DAEMI, the generated heat
is considered to be by the kinetic expression. So the simulation result of coal at the lower
particle temperature is better than that at the higher particle temperature.
Figure 4.1 shows the measured particle temperature of the laser experiment.
According to the DAEMI, the ignition frequency increases with increasing laser energy.
The reason could be effect of the distribution of activation energies among the particles
within a sample. When the higher laser energy is used, the ignition could happen between
the higher and lower activation energy levels, so the ignition frequency at higher laser energy
is higher than that at the lower laser energy. For each activation energy, we can calculate the
particle temperature by the ignition theory, the higher range of particle temperature is
obtained by the higher laser energy. But the measured particle temperatures of the laser
experiment are not like this shown in Figure 4.1.
For the base case, Figures 3.9-3.12 also show the same effect of Distribution Particle
Size in 106-125 µm, 150-180 µm and average particle size 116 µm, 165 µm on ignition
frequency for oxygen concentration 67% and 100%.
For the heterogeneous coal ignition, it is well known that the product of carbon
oxidation is both CO and CO2, and the reaction order n is depended on the carbon

58
oxidation. The proportion of the product CO and CO2 could assume is different using the
different ignition experimental mechanism. Since the different particle temperature was
obtained by the different ignition experimental mechanism [3]. So the reaction order n=0.5
obtained from simulating the Drop-Tube experiment, n=1.0 obtained from simulating the
laser ignition experiment.

59
Figure 4.1 Temperature distribution versus laser energy for Pittsburgh#8 coal.
(a) Particle size: 106-125µm, O2: 100%; (b) Particle size: 106-125µm,
O2: 75%; (c) Particle size: 150-180µm, O2: 100%; (d) Particle size:
150-180µm, O2: 67%; (e) Particle size: 125-150µm, O2: 75%; (f)
Particle size: 125-150µm, O2: 100%.
(e)
2000
2100
2200
2300
2400
2500
2600
2700
2800
2900
150 200 250 300 350 400
l aser energy (mJ)
tem
per
atu
re (
K)
(f)
2400
2500
2600
2700
2800
2900
3000
3100
150 200 250 300 350
laser energy (mJ)
Par
ticl
e te
mp
erat
ure
(K
)
( b )
2000
2100
2200
2300
2400
2500
2600
2700
2800
2900
3000
200 250 300 350
l a s e r e n e r g y ( m J )
(a)
1800
2000
2200
2400
2600
2800
150 250 350 450
laser energy
tem
per
atu
re
(c)
2000210022002300240025002600270028002900
150 200 250 300 350
laser energy
tem
per
atu
re
( d )
2200
2250
2300
2350
2400
2450
2500
2550
2600
2650
2700
150 250 350 450 550
l a s e r e n e r g y

1
Disclaimer
This report was prepared as an account of work sponsored by an agency of the United States
Government. Neither the United States Government nor any agency thereof, nor any of their
employees, makes any warranty, expressed or implied, or assumes any legal liability or responsibility
for the accuracy, completeness, or usefulness of any information, apparatus, product, or process
disclosed, or represents that its use would not infringe privately owned rights. Reference herein to
any specific commercial product, process, or service by trade name, trademark, manufacturer, or
otherwise does not necessarily constitute or imply its endorsement, recommendation, or favoring
by the United States Government or any agency thereof. The views and opinions of authors
expressed herein do not necessarily state or reflect those of the United States Government or any
agency thereof.

2
Abstract
Under typical conditions of pulverized-coal combustion, which is characterized by fine
particles heated at very high rates, there is currently a lack of certainty regarding the ignition
mechanism of bituminous and lower rank coals. It is unclear whether ignition occurs first at the
particle-oxygen interface (heterogeneous ignition) or if it occurs in the gas phase due to ignition of
the devolatilization products (homogeneous ignition). Furthermore, there have been no previous
studies aimed at determining the dependence of the ignition mechanism on variations in
experimental conditions, such as particle size, oxygen concentration, and heating rate. Finally, there
is a need to improve current mathematical models of ignition to realistically and accurately depict
the particle-to-particle variations that exist within a coal sample. Such a model is needed to extract
useful reaction parameters from ignition studies, and to interpret ignition data in a more meaningful
way.
We propose to examine fundamental aspects of coal ignition through (1) experiments to
determine the ignition mechanism of various coals by direct observation, and (2) modeling of the
ignition process to derive rate constants and to provide a more insightful interpretation of data
from ignition experiments.
We propose to use a novel laser-based ignition experiment to achieve our objectives. The
heating source will be a pulsed, carbon-dioxide (CO2) laser in which both the pulse energy and pulse
duration are independently variable, allowing for a wide range of heating rates and particle
temperatures — both of which are decoupled from each other and from the particle size. This
level of control over the experimental conditions is truly novel in ignition and combustion
experiments. Laser-ignition experiments also offer the distinct advantage of easy optical access to
the particles because of the absence of a furnace or radiating walls, and thus permit direct
observation and particle temperature measurement. The ignition mechanism of different coals
under various experimental conditions can therefore be easily determined by direct observation
with high-speed photography. The ignition rate-constants, when the ignition occurs
heterogeneously, and the particle heating rates will both be determined from analyses based on
direct, particle-temperature measurements using two-color pyrometry.
For the modeling portion of this study we will complete the development of the Distributed
Activation Energy Model of Ignition (DAEMI), which simulates the conventional drop-tube
furnace ignition experiment. The DAEMI accounts for particle-to-particle variations in reactivity
3
by having a single preexponential factor and a Gaussian distribution of activation energies among
the particles. Previous results show that the model captures the key experimental observations, and
that adjustments to the model parameters permit a good fit to experimental data. We will complete
the model by (1) examining the effects of other variations in physical parameters on the model, (2)
applying the model to published results in order to extract reaction parameters, and (3) extending
the model for application to laser-based ignition studies, such as our own.
Table of Contents
Disclaimer ...........................................................................................................................................................1
Abstract ...............................................................................................................................................................2
Table of Contents..............................................................................................................................................3
Executive Summary...........................................................................................................................................3
Introduction .......................................................................................................................................................4
Objectives ...........................................................................................................................................................4
Results from This Reporting Period and Discussion...................................................................................5
Personnel........................................................................................................................................................5
Computational Model...................................................................................................................................5
Experiment ....................................................................................................................................................6
Meetings and Conferences ..........................................................................................................................6
Goals for Next Quarter ....................................................................................................................................6
Appendix A ........................................................................................................................................................7
Executive Summary
During the past reporting period, modifications to the DAEMI were completed. The
changes were implemented to examine two aspects of ignition modeling: (1) the effect of varying
the number of particles chosen to interact with the laser, and (2) the size distribution for particle
sizes.
We have also completed making initial measurements of the ignition temperatures of a suite
of coals at three oxygen concentrations, and for three particle size ranges. The reduction of this
data from raw signals to temperatures has begun, and we expect it to be completed during the next
reporting period.

4
Introduction
The ignition of pulverized coal has been the subject of research for nearly 150 years, with the
initial motivation being the avoidance of coal-dust explosions in mines. In more recent times, due
to the world’s increased reliance on coal for power generation and the need to maximize energy-
conversion efficiency, research has shifted to understanding the fundamental mechanism of coal
ignition and measuring its kinetic rates. The importance of ignition to coal-flame stability is obvious
— the more easily a particular coal ignites after injection into a boiler furnace, the better its flame-
stability characteristics. A less obvious ramification of the ignition process is its role in establishing
extended, fuel-rich zones in coal flames which are responsible for the destruction of NOx and its
conversion to benign N2. Certainly, the ignition process is inextricably linked to the formation of
this NOx-reduction zone, and the ignition behavior of coals and coal blends will strongly affect the
ease and extent of formation of this zone. This connection is deserving of further study and its
understanding is the goal toward which we hope to apply the results of this proposed study.
Specifically, we propose to examine fundamental aspects of coal ignition through (1) experiments to
elucidate the ignition behavior of coals, and (2) modeling of the process to derive accurate and
useful rate constants, and to provide a more insightful interpretation of data from ignition
experiments.
Objectives
Our objectives for this project are to:
1. develop a novel experimental facility with extensive optical-diagnostic capabilities to study
coal ignition;
2. determine the ignition mechanism of coals under simulated combustion conditions by
direct observation with high-speed photography;
3. examine the effects of various experimental conditions, including coal rank, particle size,
oxygen concentration and heating rate, on the ignition mechanism; and
4. measure the ignition rate constants of various coals.
5. modify our existing ignition model to examine the effect of particle-size distribution on
the ignition behavior;
6. incorporate, if necessary, a size distribution into the model;
7. apply the model to extract ignition rate constants from previously published data from
conventional experiments;
5
8. modify the model and apply it to our laser-based ignition studies for determination of
ignition rate constants.
Results from This Reporting Period and Discussion
During the past reporting period, we have made excellent progress on model development
for this project. We are nearing completion of two manuscripts for submission and possible
publication. The first, “The Ignition Behavior of Pulverized Coals,” concerns mainly the
experimental measurements that we have obtained, and interprets these measurements in terms of
the model in its current form. The second manuscript, “Modeling the Ignition of Pulverized
Coals,” will focus on the current modifications to the Distributed Activation Energy Model of
Ignition (DAEMI) which we are in the process of implementing, along with some supporting
experimental measurements.
Personnel
The MS-candidate student working on the experiment portion of this project, Ms. Vida
Agyeman, has taken maternity leave as of late September. She has recovered and is back to attend
classes. We expect that she will return to full time work on this project by the end of this calendar
year.
The MS-candidate working on the modeling portion of this project, Ms. Jianping Zheng, has
completed her thesis and will be defending it on November 13, 1998. A portion of her draft thesis,
completed on October 22, 1998, is included as an appendix to this report, and forms the bulk of
the work completed during the past reporting period.
Finally, Professor John Chen, the Project Director for this project, has resigned his position
at North Carolina A&T State University, and is currently an Associate Professor of Mechanical
Engineering at Rowan University, effective August 1998. Professor Chen will continue to consult
on this project, which has been transferred to Dr. Samuel Owusu-Ofori, Professor of Mechanical
Engineering at North Carolina A&T State University.
Computational Model
A portion of Ms. Jianping Zheng’s MS thesis, titled “Modeling the Ignition Behavior of
Pulverized Coals,” is included as Appendix A of this report. The two sections included are Model
Analysis and Results, and Discussion.

6
Experiment
During the past reporting period we have completed the measurement of ignition
temperatures for a suite of four coals (Pittsburgh #8 high-volatile bituminous, Pocahontas low-
volatile bituminous, Wyodak subbituminous, and Pust lignite) at three oxygen concentrations, and
for two or three particle size ranges. The data reduction is currently underway to convert the raw
signal measurements to temperatures. We expect this to be completed during the next reporting
period. The complete set of data will be used as inputs to the modified Distributed Activation
Energy Model of Ignition (DAEMI).
Meetings and Conferences
A paper describing the results contained in this report was prepared and submitted to the
1999 Combustion Institute Joint US National Meeting, to be held in March 1999 in Washington,
DC.
At the Spring 1998 American Chemical Society National Meeting, we presented a paper
describing our research. This paper, co-authored by John Chen, Maurice Richardson, and Jianping
Zheng, won the Richard A. Glenn Award, the Fuel Chemistry Division’s Best Paper Award.
Goals for Next Quarter
During the next reporting period, we will complete the data reduction for the temperature
measurements made during this summer. The data will form the basis for further model
development using the DAEMI.

7
Appendix A
MODEL ANALYSIS AND RESULTS
3.1 Introduction Experiment
3.1.1 Laser Ignition Experiment
The experimental setup consists of a wind tunnel, gas flow system, coal feeder, detector,
laser gate, pulse generators laser and Optical system.
Figure 3.1 shows a schematic of the laser ignition experiment. Sieve-sized coal
particles are dropped batch-wise into a laminar upward-flow wind tunnel with quartz test
section (5cm square cross-section). The gas is not preheated, The gas flow rate was set so
that the particles emerged from the feeder tube, fell approximately 5 cm, then turned and
traveled upward out of the tunnel. This ensured that the particles were moving slowly
downward at the ignition point, chosen to be 2 cm below the feeder-tube exit.
A single pulse from a Nd:YAG laser was focused through the rest section, then
defocused after exiting the test section, and two sides in this manner achieved more spatial
uniformity and allowed for higher energy input than a single laser pass. For nearly every
case, one to three particles were particles were contained in the volume formed by the
two intersecting beams, as determined by previous observation with high-speed video.
The laser operated at 10 Hz and emitted a nearly collimated beam (6 mm diameter)
in the near-infrared (1.06 µm wavelength). The laser pulse duration was 100 µs and the
pulse energy was fixed at 830 mJ per pulse, with pulse-to-pulse energy fluctuations of less
than 3%. The laser pulse energy delivered to the test section was varied by a polarizer
placed outside of the laser head, variation from 150 to 750 mJ was achieved by rotating

8
the polarizer. Increases in the laser pulse energy result in heating of the coal particles to
higher temperatures. At the ignition point the beam diameter normal to its propagation
direction was 3 mm on each pass of the beam. An air-piston-driven laser gate (see Fig. 3.1)
permitted the passage of a single pulse to the test section. The system allowed for control
of the delay time between the firing of feeder and he passage of the laser pulse. Finally,
ignition or non-ignition was determined by examining the signal generated by a high-
speed silicon photodiode connected to a digital oscilloscope. Figure 3.2 presents typical
signal traces from the photodetector for both ignition and non-ignition events. Features of
the trace for the ignition case is similar to that described previously.
Particle temperature was measured by two-wavelength pyrometry. A simple lens
coupled to an optical fiber bundle collected light emitted by the igniting particles. The
output from the fiber bundle is collimated and separated into two beams via a dichroic
filter. Light of wavelengths below 0.75 µm (the dichroic filter’s cut-off wavelength) was
passed through a bandpass interference filtered centered at 0.7 µm with a optical
bandwidth of 40 nm. The remaining light was passed through an interference filter
centered at 0.9 µm with an optical bandwidth of 10 nm. Separate high-speed silicon
photodiodes detected each beam following the optical filters. The pyrometer was
calibrated using a 2-mm diameter blackbody source at 990oC.
9
flowconditioning
section
O2/N2
lens
quartztest
sectionprism
focusinglens
laserbeam
beamdump
O2/N2
detector /amplifier
oscilloscope
opticalfiber
defocusing
laser gate
Figure 3.1 Schematic of the laser ignition experiment
Time, ms
20 40 60 80 100
Det
ecto
r S
igna
l, V
0.00
0.02
0.04
0.06
0.08
(b)

10
60 80 1000.00
Time, ms
60 80 100
Det
ecto
r S
igna
l, V
0.00
0.02
0.04
0.06
0.08
(b)
Figure 3.2 Signal traces from photodetectors showing (a) non-ignition and (b) ignition eventsfor the Pittsburgh #8 bituminous coal. Particle size was 125-158 µm, and oxygenconcentration was 100%. The short-lived spike in both traces result from laserheating of the coal surface and subsequent cooling. Ignition and combustion of thecoals causes the long-lived emission of (b).

11
Figure 3.3 Typical data from a conventional ignition experiment showing the relation between
ignition frequency (or probability) and gas temperature for a bituminous coal.
Data extracted from Ref.4.
Figure 3.4 Typical data from our laser ignition experiment showing the relation between
ignition frequency and laser energy for bituminous coal.
0
20
40
60
80
100
200 250 300 350 400 450
Laser energy (mJ)
Ign
itio
n f
req
uen
cy (
%)

12
Figure 3.5 Distribution of Activation Energy as a Gaussian Distribution
Figure 3.6 Distribution of coal particle size as a Top-Hat Distribution

13
3.1.2 Drop-Tube Experiment by T. F. Wall’s Group [4]
The ignition experiments were carried out using a pulse ignition technique. Metered flows
of O2 and N2 were passed through an electrically heated tubular furnace at a rate of 500ml/min
(s.t.p.). A small quantity of sample was contained in a glass funnel with a capillary stem. By
gently tapping the funnel with an electric vibrator, a pulse of fuel (0.2-0.5mg or 1170 particle for
75-90µm size coal) was dropped into the furnace through a water-cooled probe. A
photomultiplier was used to detect the occurrence of ignition, which was indicated by the visual
flash of an igniting particle. The furnace was maintained at a fixed temperature. Ten to twenty
pulses of fuel were injected, and the number of pulses for which ignition responses were detected
was noted on a chart recorder. Figure 3.3 give typical results of ignition response versus furnace
gas temperature and indicate a temperature range over which the percentage of pulses resulting in
observed ignition flashes increases from 0 to 100.
3.2 Model Formulation
Figure 3.4 show typical data obtained from our ignition experiment conducted by varying
the laser energy while holding oxygen concentration, particle size and type of coal. Fig. 3.4 and
Fig. 3.3 show that ignition frequency increases approximately linearly with plus laser energy or
gas temperature, and these are inconsistent with the heterogeneous ignition theory previously
described. If all particles of a coal sample used in an experiment have the same reactivity, that is
if they are described by a common Arrhenius rate constant as in Eq. (2.7), then the data would
show an ignition frequency of 0% until the critical laser energy corresponding to that at the
critical ignition condition is reached. At any laser energy or gas temperature above critical
ignition condition, the ignition frequency would be 100.

14
One of the reasons why ignition frequency increases gradually with increasing laser energy
or gas temperature is obvious: Within any coal sample, there exists a distribution of reactivity
among the particles. Thus, in the laser ignition experiment, in which a batch of perhaps 4×10⁵
particles of a sample is dropped into the furnace, there is the probability (or frequency) that at
least one particle has a reactivity that meets or exceeds the critical ignition condition set forth in
equations (2.1) and (2.2) as the laser energy is increased. This is the ideal of DAEMI [10]. Of
course, there exist other variations among the particles within a sample, such as particle size and
specific heat. Variation in size alone could account for the observed increase in ignition frequency
with the laser energy pulse (or gas temperature) [1,4,5,8]. It cannot account for other
experimental observation, namely, the variation in the slope of the ignition frequency with oxygen
concentration. A distribution in specific heat would only affect the rate at which a particle attains
its equilibrium temperature, but would not change the value or the reactivity. Perhaps other
variations could cause the observed behavior of ignition frequency. It is our premise that the
distribution in reactivity and particle size dominates all other variations. We propose to add the
distribution of particle size into the DAEMI.
3.3 Simulation Procedure
Fig.3.5 shows the distribution of activation energy versus frequency for a sample for
which E0=58 kJ mol-1 and σ=5.5 kJ mol-1. The intervals of activated energy is 1kJ mol-1 (∆E=1kJ
mol-1).
The Distributed Activated Energy Model of Ignition (DAEMI) simulates our laser ignite
and drop-tube experiment by allowing for the particles within the coal sample to have a
distribution of reactivity (Chapter 2.3). We first calculate the probability of particles for being in
each of the intervals.

15
The distributed of particle size model of ignition assumes that in a small range of particle
size, the distribution of particle size is Top-Hat distribution (Fig 3.6). The interval of particle size
is 1µm (∆Dp=1.0×10⁻⁶m). Particle sizes are grouped into three. These are 106.0 to 125.0µm,
125 to 150µm, 150.0 to 180.0µm respectively.
3.3.1 Base Case
Now, the heat generated by a spherical carbon particle undergoing oxidation on its
external surface is given by the kinetic expression:
−=
p
noc
gen
RT
EAxH
S
Qexp02
(3.1)
Similarly, the heat loss from the surface of a particle at temperature Tp is the sum of losses due to
convection and radiation. Thus, heat loss from the surface is given as:
( )44)( gpbgploss TTSTThSS
Q−+−= εσ (3.2)
For the convection-loss term, we assume that the Nusselt number equals 2, as is appropriate for
very small particles, which leads to pg dkh /2= .
( )44)(2
gpbgpp
gloss TTSTTSd
k
S
Q−+−= εσ (3.3)
At the critical ignition condition, lossgen QQ = , we obtain
( ) ( )
−+−
−=0
44
2
2
lnAxH
TTTTd
k
RTEnoc
gpbgp
p
g
p
εσ
(3.4)
where the required parameters for this equation were calculated as follows:

16
For base case of the model, we assumed that Tp was obtained from the equilibrated
temperature calculations by use of a linear regression to regress Tp as a function of laser energy
(see appendix 1). For example, for 70µm.116µm and 165µm coal particle the temperature are
given as functions of laser energy as [19]
22.3857266.0)116(
+= lasermp ETµ
(3.5)
08.4270707.1)70( += lasermp ET µ (3.6)
57.3675505.0)165( += lasermp ET µ (3.7)
For variable particle size, we use interpalation mathematics method define:
( )( ))116(
)116()70(
61)11670(
6116mp
pmpmpp T
e
edTTT µ
µµ +−××−
−−−= dp<116µm (3.8)
( )( ))116(
)116()165(
61)116165(
6116mp
pmpmpp T
e
edTTT µ
µµ +−××−
−−−= dp>116µm (3.9)
kg the gas thermal conductivity in the boundary layer around a heated particle was given
by a linear fit to the conductivity of air [11].
+×= −
2100.7 5 gp
g
TTk (3.10)
Hc is defined by the equation [16]
2,, '1
1'
1 COCCOCc Hy
Hy
yH
++
+= (3.11)
It is well known that the product of carbon oxidation is both CO and CO2, COCH ,' and 2,' COCH are
the heats of combustion corresponding to the following oxidation reaction [11].

17
kgC
kJHCOOC
kgC
kJHCOOC
COC
COC
790,32';
210,9';2
1
2,22
,2
=→+
=→+(3.12)
Where
−==
pTmolCO
molCOy
3214exp95.59
2
(3.13)
ε, the emissivity of coal particles was taken as 0.8.
n, the reaction order was taken as 1.
χo2 was chosen to be 1.0 corresponding to a 100% oxygen concentration.
For each laser energy, twenty runs were made to obtain ignition-frequency distributions.
3.3.2 laser Ignition Experiment
When we were using this version of DAEMI to fit the laser ignition experiment. The
experiment data of Tp was reading directly from data files (see appendix 3). Then to calculate
average temperature (Tavg) and standard deviation (Tσ), base on Normal Distribution,
N
TT p
avg
∑= (N is the number of Tp) (3.14)
1
)( 2
−
−= ∑
N
TTT avgp
σ (3.15)
to obtain the range of temperature, namely, Tavg-2Tσ < Tp < Tavg+2Tσ, by randomly choosing
particle temperature from the range to obtain critical energy at each condition.
In this experiment, in which a batch with several hundred particles are dropped in to the
test section, and only a few are heated by the laser pulse. There is an increasing probability (or
frequency) as the laser energy is increased that at least one of the heated particles is reactive

18
enough to ignition under the given conditions. For nearly every case, one to three particles are hit
in the test section by two intersecting laser beams. This is determined by observations with high-
speed video. For simulation, thirteen hundred particles are then selected randomly as they feed
into the test section and two particles are further selected randomly from these 1300 to be hit by
the laser pulse, keeping in mind that no particle can be selected twice.
For randomly selected two particles with particle size and activation energy. Substituting
preexponential factor (A0), mean of Gaussian distribution of activation energy (E0), standard
deviation of Gaussian distribution (σ) and reaction order (n) in Eq. (3.4), E can be calculated as
the critical (or threshold) activation energy that a particle may have and still ignite under the given
conditions. The result (E) is compared with the activation energy. If the result (E) is greater than
the activation energy among the particles that were hit, then the particle is considered ignited.
At each set of operating conditions (coal type and size, oxygen concentration, and laser
energy), 20 attempts at ignition are made in order to get the ignition frequency, or probability,
which is the parameter sought from these studies. We compare this simulated ignition frequency
with the experimental results over a range of laser pulse energy.
3.2.3 Drop-Tube Experiment
In simulating the drop-tube ignition experiment, we assumed that 106 particle are in the
initial batch. A batch of 1170 particles of a sample is dropped into the furnace in each simulation
of an experimental run. No particle can be selected more than once. Whether or not ignition
occurs for a run is determined by the particle in the batch of 1170 with the lowest activation
energy.
Now, using Eq. (3.1) and Eq. (3.3) we can obtain the heat generated Qgen and Qloss. In
order to determine the critical ignition temperature of the particle, Tp, and critical activation
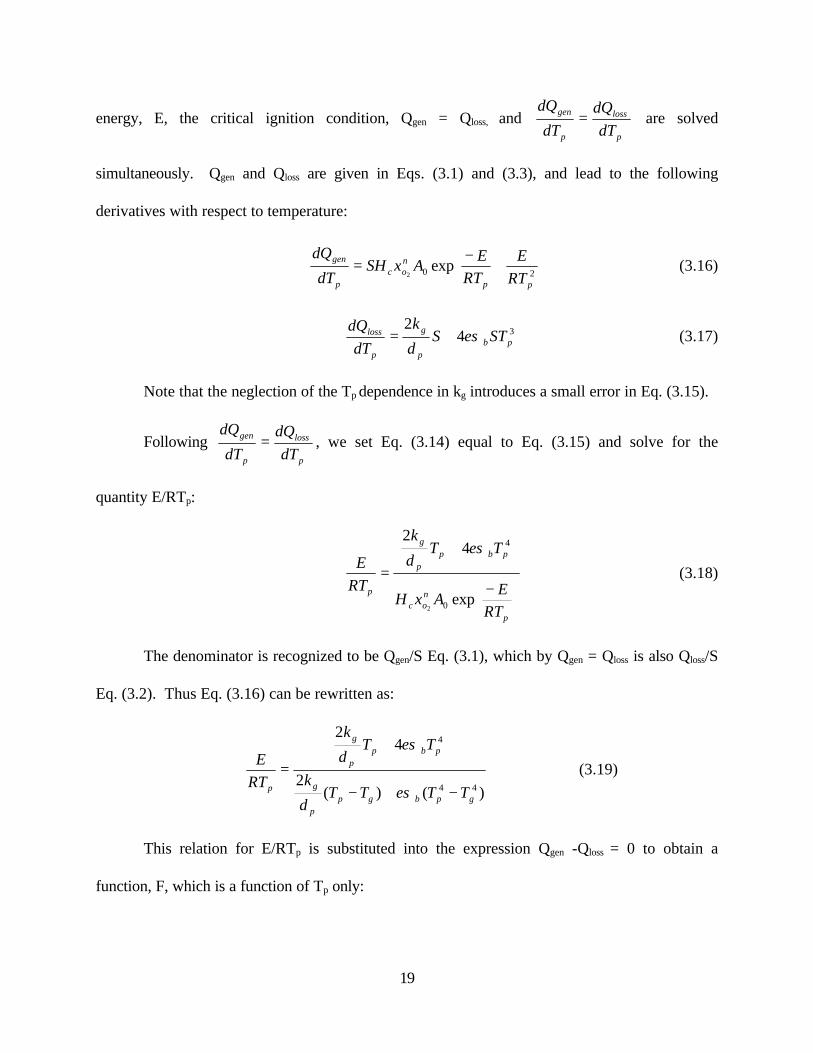
19
energy, E, the critical ignition condition, Qgen = Qloss, and p
loss
p
gen
dT
dQ
dT
dQ= are solved
simultaneously. Qgen and Qloss are given in Eqs. (3.1) and (3.3), and lead to the following
derivatives with respect to temperature:
−=
20 exp2
pp
noc
p
gen
RT
E
RT
EAxSH
dT
dQ(3.16)
342
pbp
g
p
loss STSd
k
dT
dQεσ+= (3.17)
Note that the neglection of the Tp dependence in kg introduces a small error in Eq. (3.15).
Following p
loss
p
gen
dT
dQ
dT
dQ= , we set Eq. (3.14) equal to Eq. (3.15) and solve for the
quantity E/RTp:
−
+
=
p
noc
pbpp
g
p
RT
EAxH
TTd
k
RT
E
exp
42
0
4
2
εσ
(3.18)
The denominator is recognized to be Qgen/S Eq. (3.1), which by Qgen = Qloss is also Qloss/S
Eq. (3.2). Thus Eq. (3.16) can be rewritten as:
)()(2
42
44
4
gpbgpp
g
pbpp
g
p TTTTd
k
TTd
k
RT
E
−+−
+
=εσ
εσ
(3.19)
This relation for E/RTp is substituted into the expression Qgen -Qloss = 0 to obtain a
function, F, which is a function of Tp only:

20
( ) ( )( ) ( ) 0
2
2
42
exp
)(
44
44
4
02=−−−−
−+−
−
=
−=
gpbgpp
g
gpbgpp
g
pbpp
g
noc
lossgenp
TTTTd
k
TTTTd
k
TTd
k
AxH
QQTF
εσεσ
εσ(3.20)
The reasonable root of F (Tp) corresponds to the critical ignition temperature of the
particle, and substitution of this value into Eq. (3.19) produces the critical activation energy at the
critical ignition condition.
kg, the gas thermal conductivity in the boundary layer around a heated particle was given
by Eq. (3.10).
χo2 was chosen to be 0.5 corresponding to a 50% oxygen concentration.
ε, the emissivity of coal particle was taken as 0.8.
Hc was defined by the equation from (3.11) to (3.13).
Substituting all the required values in Eq. (3.4), E obtain the result as the critical (or
maximum) activation energy that a particle may have and still ignite under the given conditions.
By randomly choosing each particle with activation energy for a run, then get the particle in the
batch of 1170 with the lowest activation energy. we compared the result (E) with the lowest
activation energy. If the result (E) is greater than the lowest activation energy among the particle
that was heated in a run, The particle was ignited.
3.3 Modeling Results
3.3.1 Results of the Base Case of the Model

21
Figure 3.7 and Fig. 3.8 shows the effect of oxygen concentration and number of particle
(M) on ignition frequency for particle size range of 106-125µm and 150-180µm, respectively. It
can be seen that at each oxygen concentration, ignition frequency increases monotonically over
the range of laser pulse energy. Below this range, the ignition frequency is zero, and above this
range the result is 100% ignition frequency. As the number of particle (M) is increased from 1 to
300, the frequency distribution shifts to lower laser energy values. This behavior is due to the fact
that, within any coal sample, there exists a distribution of reactivity among the particles.
As the oxygen concentration is decreased from 100% to 67%, the frequency distribution
shifts to higher laser energies or equivalently, higher particle temperatures, as expected. This is
consistent with the ignition theory since at decreased oxygen concentration, higher temperatures
are necessary for heat generation by the particles (due to chemical reactions) to exceed heat loss
from the particles and lead to ignition. The shift in distribution can be viewed in two ways: for a
fixed laser pulse energy, a decrease in oxygen concentration leads to a decrease in the ignition
frequency, all else being equal; Second, a decrease in oxygen concentration implies that a higher
laser pulse energy is needed, in order to achieve the same ignition frequency.
Figure 3.9 and Fig. 3.10 show the same effect of Distribution Particle Size in 150-180µm
and average particle size (165µm) on ignition frequency for oxygen concentration of 100% and
67%. Fig.3.11 and Fig.3.12 also show that the same effect of distribution particle size in 106-
125µm and average particle size (115µm) on ignition frequency for 100% and 67% of O2.


23
Figure 3.7 Modeling results showing the effect of M (numbers of particles were ignited at one drop time) and oxygen
concentration on ignition frequency. (a) Solid-line express 67% oxygen concentration (xo2 =67%); (b) Dash-line
express 100% oxygen concentration (xo2 =100%). Particle size is 106-125 µm, and all other parameters are as listed
in Table 3.1.
0
10
20
30
40
50
60
70
80
90
100
0 100 200 300 400 500 600 700 800
Laser energy (mJ)
Ign
itio
n f
req
uen
cy (
%)
M=300, 67% oxygen
M=50, 67% oxygen
M=10, 67% oxygen
M=3, 67% oxygen
M=1, 67% oxygen
M=300, 100% oxygen
M=50, 100% oxygen
M=10, 100% oxygen
M=3, 100% oxygen
M=1, 100% oxygen
Linear (M=300, 67%oxygen)

24
Figure 3.8 Modeling results showing the effect of M (numbers of particles were ignited at one drop time) on ignition
frequency. (a) Solid-line express 67% oxygen concentration (xo2 =67%); (b) Dash-line express 100% oxygen
concentration (xo2 =100%). Particle size is 150-180 µm, and all other parameters are as listed in Table 3.1.
0
10
20
30
40
50
60
70
80
90
100
0 100 200 300 400 500 600 700 800 900 1000
Laser energy (mJ)
Ign
itio
n f
req
uen
cy (
%)
M=300, 67% oxygen
M=50, 67% oxygen
M=10, 67% oxygen
M=3, 67% oxygen
M=1, 67% oxygen
M=300, 100% oxygen
M=50, 100% oxygen
M=10, 100% oxygen
M=3, 100% oxygen
M=1, 100% oxygen
Linear (M=300, 67%oxygen)

25
Table 3.1 Parameters Used in the Base Case of the Model of Laser Ignition
Experiment
Variable Value
E0
A0
σ
n
ε
58 kJ/mol
250 kg/m2s
5.5 KJ/mol
1.0
0.8


27
Figure 3.9 Modeling results showing the effect of average particle size 165µm and the range of particle size 150-180µm in ignition
frequency. Oxygen concentration is 100%. All other parameters are as listed in Table 3.1. (a) Solid-line express particle
size dp=165µm; (b) Dash-line express distribution particle size Dp in 150-180µm.
Particle size: 165 and 150-180 um, oxygen concentration: 100%
0
10
20
30
40
50
60
70
80
90
100
0 100 200 300 400 500 600 700
Laser energy (mJ)
Ign
itio
n f
req
uen
cy (
%) M=3,dp=165um
M=10,dp=165umM=10, dp=150-180 umM=3,dp=150-180 umLinear (M=3,dp=165um)Linear (M=10,dp=165um)Linear (M=10, dp=150-180 um)Linear (M=3,dp=150-180 um)

28
Figure 3.10 Modeling results showing the effect of the average particle size 165µm and the range of particle size150-180 µm onignition frequency. Oxygen concentration is 67%. All other parameters are as listed in Table 3.1. (a) Solid-lineexpress particle size dp=165µm; (b) Dash-line express distribution particle size dp in 150-180µm.
Praticle size:165 and 150-180 (um), Oxygen concentration: 67%
0
10
20
30
40
50
60
70
80
90
100
0 100 200 300 400 500 600 700
laser energy (mJ)
Ign
itio
n f
req
uen
cy (
%) M=10,dp=165um
M=3,dp=165um
M=10,dp=150-180um
M=3,dp=150-180um
Linear (M=10,dp=165um)
Linear (M=3,dp=165um)
Linear (M=10,dp=150-180um)
Linear (M=3,dp=150-180um)

29
Particle size: 116 and 106-125 um, Oxygen concentration: 100%
0
10
20
30
40
50
60
70
80
90
100
0 100 200 300 400 500 600
Laser energy (mJ)
Ign
itio
n f
req
uen
cy (
%) M=3,dp=116um
M=10,dp=106-125um
M=3,dp=106-125um
M=10,dp=116um
Linear (M=3,dp=116um)
Linear (M=10,dp=106-125um)
Linear (M=3,dp=106-125um)
Linear (M=10,dp=116um)

30
Figure 3.11 Modeling results showing the effect of average particle size 116 µm and the range of particle size 106-125µm in ignition
frequency. Oxygen concentration is 100%. All other parameters are as listed in Table 3.1. (a) Solid-line express particle size
dp=116µm; (b) Dash-line express the distribution of particle size dp in 106-125µm.

31
Figure 3.12 Modeling results showing the effect of the average particle size 116 µm and the range of particle size106-125 µm onignition frequency. Oxygen concentration is 67%. All other parameters are as listed in Table 3.1. (a) Solid-line expressparticle size dp=116µm; (b) Dash-line express distribution particle size dp in 106-125µm.
Praticle size : 116 and 106-125um, Oxygen concentration: 67%
0
10
20
30
40
50
60
70
80
90
100
0 100 200 300 400 500 600
Laser energy (mJ)
Ign
itio
n f
req
uen
cy (
%) M=3,dp=116um
M=10,dp=116um
M=3,dp=106-125um
M=10,dp=106-125um
Linear (M=3,dp=116um)
Linear (M=10,dp=116um)
Linear (M=3,dp=106-125um)
Linear (M=10,dp=106-125um)


33
3.3.2 Results of Simulation Laser Ignition Experiment
The simulations for the experiments were performed via a FORTRAN code (Appendix 3).
The code was designed to produce frequency distribution data for a given particle size (diameter,
dp) range, oxygen concentration and, temperature of particle and laser pulse energy. As
discussed earlier, for each run two particles are selected randomly from 1300 particles. The
particle size and activation energy are determined whether or not ignition occurred for the run.
For each type coal, the parameters required as input are the average activation energy (E0),
standard deviation for the Gaussian distribution (σ), and pre-exponential factor (A0).
Figure 3.13-3.15 show the experiment data for the Pittsburgh #8 coal with modeling
results using anther method, that calculate average temperature and standard deviation to obtain
the range of particle temperature at each condition. Figure 3.16-3.17 show the experiment data
for the Pust coal with the modeling results using the range of particle temperature. Figure 3.18
shows the experiment data for the Wyodak coal with the modeling results using the range of
particle temperature. The behavior of the model with respect to changes in each of the
parameters was first observed. The parameters are then modified to obtain a final set of values to
improve the model. The final parameters that fit our laser ignition experimental data of each type
coal are given the following table.
Table 3.2 shows all Pittsburgh#8 coal’s parameters of Figure 3.13-3.15. There are all Pust
coal’s parameters of Figure 3.16-3.17 in Table 3.3. There are all Wyodak coal’s parameters of
Figure 3.18 in Table 3.4.


35Figure 3.13 Simulation results of our laser experiment for particle size (dp) 106-125µm Pittiburgh#8 coal, using the range of the particle
Pittisburgh#8 coal, Particle size: 106-125um
0
10
20
30
40
50
60
70
80
90
100
150 200 250 300 350 400 450
Laser energy (mJ)
Ign
itio
n f
req
uen
cy (
%)
Data exp. of 100% oxygenModeling result of 100% oxygenData exp. of 75% oxygenModeling result of 75% oxygenLinear (Data exp. of 100% oxygen)Linear (Data exp. of 75% oxygen)

36
temperatures. All other parameters are as listed in Table 3.2
Figure 3.14 Simulation results of our laser experiment for particle size (dp) 150-180µm Pittiburgh#8 coal, using the range of the particle
temperatures. All other parameters are as listed in Table 3.2
Pittsburgh#8 coal, Particle size:150-180um
0
10
20
30
40
50
60
70
80
90
100
150 200 250 300 350 400 450 500
Laser energy (mJ)
Ign
itio
n f
req
uen
cy (
%)
Data exp. 0f 100% oxygenModeling result of 100% oxygenData exp. of 67% oxygenModeling result of 67% oxygenLinear (Data exp. 0f 100% oxygen)Linear (Data exp. of 67% oxygen)

37
Figure 3.15 Simulation results of our laser experiment for particle size (dp) 125-150µm Pittiburgh#8 coal, using the range of the particle
temperatures. All other parameters are as listed in Table 3.2
Pittsburgh#8 coal, Partical size: 125-150um
0
10
20
30
40
50
60
70
80
90
100
150 200 250 300 350 400
Laser energy (mJ)
Ign
itio
n f
req
uen
cy (
%)
Data exp. of 100% oxygen
Modeling result of 100% oxygenData exp. of 75% oxygen
Modeling result of 75% oxygenLinear (Data exp. of 100% oxygen)
Linear (Data exp. of 75% oxygen)

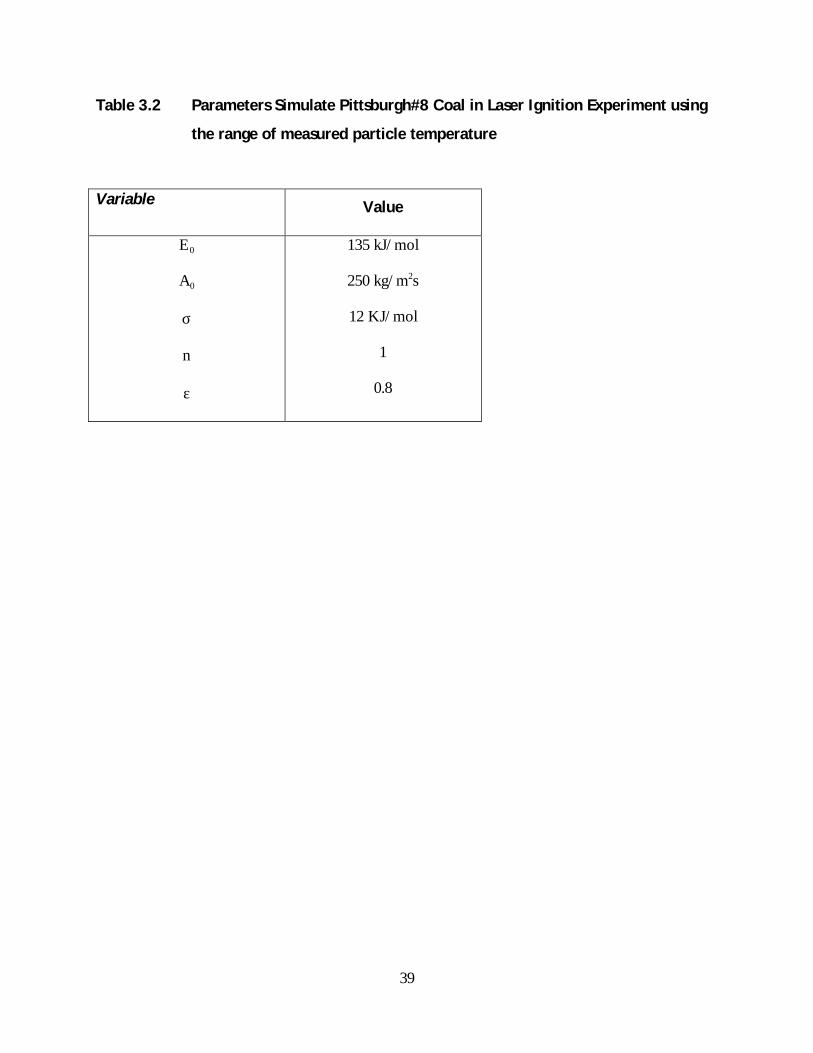
39
Table 3.2 Parameters Simulate Pittsburgh#8 Coal in Laser Ignition Experiment using
the range of measured particle temperature
Variable Value
E0
A0
σ
n
ε
135 kJ/mol
250 kg/m2s
12 KJ/mol
1
0.8


41
Figure 3.16 Simulation results of the laser Experiment for particle size (dp) 106-125 µm Pust coal, using the range of the particle
temperatures. All other parameters are as listed in table 3.3.
pust coal, Particle size: 106-125um
0
10
20
30
40
50
60
70
80
90
0 100 200 300 400 500 600
Laser energy (mJ)
Ign
itio
n f
req
uen
cy (
%)
Data exp. of 67% oxygen
Modeling result of 76% oxygen
Data exp. of 100% oxygen
Modeling result of 100% oxygen
Linear (Data exp. of 67% oxygen)
Linear (Data exp. of 100% oxygen)

42
Figure 3.17 Simulation results of the laser Experiment for particle size (dp) 150-180 µm Pust coal, using the range of particle
temperatures. All other parameters are as listed in table 3.3.
Pust coal , Part ic le s ize:150-180um
0
10
20
30
40
50
60
70
80
90
100
0 100 200 300 400 500 600
Laser energy (mJ)
Ign
itio
n f
req
uen
cy (
%)
Data exp. of 67% oxygenModel ing resul t of 67% oxygenData exp. of 100% oxygenModel ing resul t of 100% oxygenLinear (Data exp. of 67% oxygen)Linear (Data exp. of 100% oxygen)

43
Figure3.18 Simulation results of the laser experiment for particle size 150-180µm Wyodak coal, using the range of particle temperatures.
All other parameters are as listed in table 3.4.
W yodak coal, Particle size: 150-180um
0
20
40
60
80
100
120
0 100 200 300 400 500 600
Laser energy (mJ)
Ign
itio
n f
req
uen
cy (
%)
Data exp. of 100% oxygen
Modeling result of 100% oxygen
Data exp. of 67% oxygen
Modeling result of 67% oxygen
Linear (Data exp. of 67% oxygen)
Linear (Data exp. of 100% oxygen)

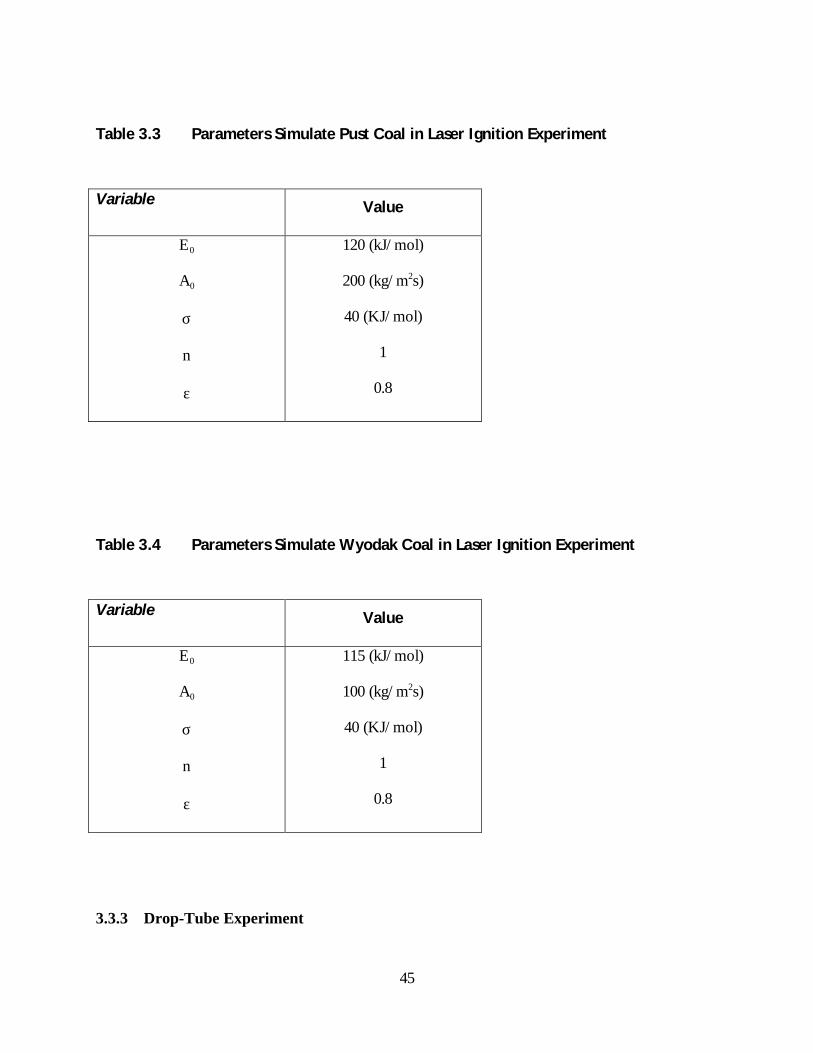
45
Table 3.3 Parameters Simulate Pust Coal in Laser Ignition Experiment
Variable Value
E0
A0
σ
n
ε
120 (kJ/mol)
200 (kg/m2s)
40 (KJ/mol)
1
0.8
Table 3.4 Parameters Simulate Wyodak Coal in Laser Ignition Experiment
Variable Value
E0
A0
σ
n
ε
115 (kJ/mol)
100 (kg/m2s)
40 (KJ/mol)
1
0.8
3.3.3 Drop-Tube Experiment

46
The required simulations for drop-tube experiments have performed by a FORTRAN code
(Appendix 2). The code was designed to produce frequency distribution data for a given average
particle size (diameter dp) or the maximum diameter (dpmax) and minimum diameter (dpmin) of
particle size range, oxygen concentration and, temperature of gas. The particle with the lowest
activation energy determines whether or not ignition occurred for a run. The parameters required
to be input were average activation energy (E0), standard deviation for the Gaussian distribution
(σ), preexponential factor (A0) and reaction order (n).
Respectively, Figure 3.19-3.20 show the experiment data for coal#1 and coal#2 with the
modeling results using distribution of particle size. There are all parameters of coal#1 and coal#2
for Figure 3.19-3.20 in Table 3.5 and Table 3.6. Figure 3.21-3.22 show the experiment data for
coal#1 and coal#2 with the modeling results by average particle size. These parameters of coal#1
and coal#2 for Figure 3.21-3.22 are listed in Table 3.7 and Table 3.8.

47
Figure3.19 Simulate result of drop-tube experiment [4] for particle size 75-90µm coal #1, using distribution particle size isincorporated into the DAEMI. All other parameters are as listed in Table 3.5.
0
10
20
30
40
50
60
70
80
90
100
600 650 700 750 800 850 900
Laser energy (mJ)
Ign
itio
n f
req
uen
cy (
%) Data exp. of 100% oxygen
Modeling result of 100% oxygenData exp. of 50% oxygen
Modeling result of 50% oxygenData exp. of 21% oxygenModeling result of 21% oxygenData exp. of 10% oxygen
Modeling result of 10% oxygen
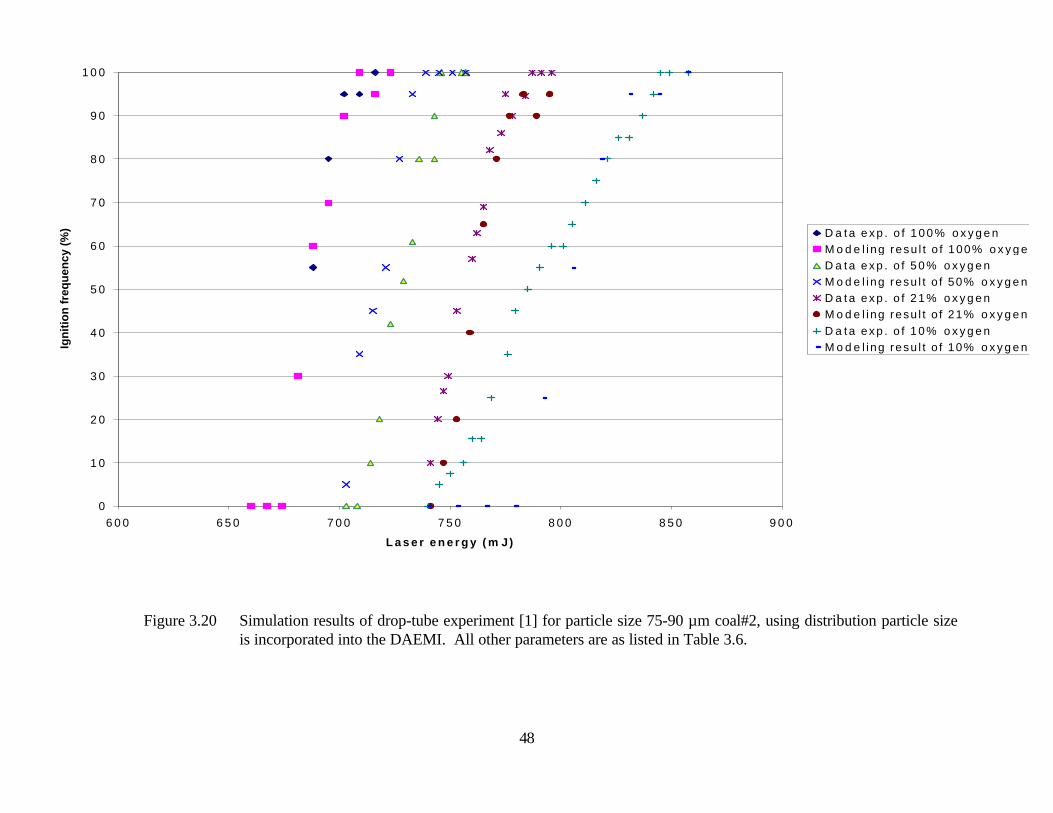
48
Figure 3.20 Simulation results of drop-tube experiment [1] for particle size 75-90 µm coal#2, using distribution particle sizeis incorporated into the DAEMI. All other parameters are as listed in Table 3.6.
0
1 0
2 0
3 0
4 0
5 0
6 0
7 0
8 0
9 0
1 0 0
6 0 0 6 5 0 7 0 0 7 5 0 8 0 0 8 5 0 9 0 0
L a s e r e n e r g y ( m J)
Ign
itio
n f
req
uen
cy (
%) D a t a e x p . o f 1 0 0 % o x y g e n
M o d e l i ng resu l t o f 100% o x y g e nD a t a e x p . o f 5 0 % o x y g e nM o d e l ing resu l t o f 50% o x y g e nD a t a e x p . o f 2 1 % o x y g e nM o d e l ing resu l t o f 21% o x y g e nD a t a e x p . o f 1 0 % o x y g e nM o d e l ing resu l t o f 10% o x y g e n

49
Table 3.5 Parameters Simulate cola#1 in Drop-Tube Experiment [4] (Using
distribution of particle size in DAEMI)
Variable Value
E0
A0
σ
n
ε
70.0 (kJ/mol)
300.0 (kg/m2s)
1.0 (KJ/mol)
0.5
0.8
Table 3.6 Parameters Simulate cola#2 in Drop-Tube Experiment [4] (Using
distribution of particle size in DAEMI)
Variable Value
E0
A0
σ
n
ε
71.0 (kJ/mol)
320.0 (kg/m2s)
1.0 (KJ/mol)
0.5
0.8


51
Figure 3.21 Simulation results of drop-tube experiment [4] for particle size 83 µm coal #1. All other parameters are as listed in
Table 3.7.
0
10
20
30
40
50
60
70
80
90
100
600 650 700 750 800 850 900
Laser energy (mJ)
Ign
itio
n f
req
uen
cy (
%) Data exp. of 21% oxygen
Modeling result of 21% oxygen
Data exp. of 10% oxygen
Modeling result of 10% oxygen
Data exp. of 50% oxygen
Modeling result of 50% oxygen
Data exp. of 100% oxygen
Modeling result of 100% oxygen

52
Figure 3.22 Simulation results of drop-tube experiment [4] for particle size 83 µm coal #2. All other parameters are as listed in
Table 3.8
0
10
20
30
40
50
60
70
80
90
1 0 0
6 0 0 6 5 0 7 0 0 7 5 0 8 0 0 8 5 0 9 0 0
Laser energy (m J)
Ign
itio
n f
req
uen
cy (
%) Data exp . o f 100% oxygen
Mode l ing resu l t o f 100% oxygenMode l i ng resu l t o f 50% oxygenDa ta exp . 21% o f oxygenMode l i ng resu l t o f 21% oxygenDa ta exp . o f 10% oxygenMode l i ng resu l t o f 10% oxygenDa ta exp . o f 50% oxygen

53
Table 3.7 Parameters Simulate cola#1 in Drop-Tube Experiment [4], using the
average particle size.
Variable Value
E0
A0
σ
n
ε
92 (kJ/mol)
110 (kg/m2s)
10 (KJ/mol)
0.44
0.8
Table 3.8 Parameters Simulate cola#2 in Drop-Tube Experiment [4], using
average particle size.
Variable Value
E0
A0
σ
n
ε
98.6 (kJ/mol)
111 (kg/m2s)
12 (KJ/mol)
0.37
0.8
54
DISCUSSION OF RESULTS
4.1 Comparison with Drop-Tube Experiment
Either the range of particle size (75-90µm) or the average particle size (83µm) can
be used in the current version of DAEMI. The DAEMI can be fitted to the experimental
data [4] shown in Figures 3.19-3.22. Figures 3.19-22 also shown the almost same effect of
Distribution Particle Size in 75-90 µm and average particle size 83 µm on ignition frequency
for oxygen concentration from 10% to 100%. The small standard deviation, σ (1.0 kJ/mol)
is used to obtain the results from the current version of DAEMI using the distribution of
particle size and the average particle size. The narrow distribution (small standard deviation)
leads to a small energy range since most particles have similar activation energies. This
behavior is due to the fact that a distribution of reactivity exists among the particles. The
particle diameters are randomly selected from the range of particle size to calculate the
critical activation energy. Different particle diameters correspond to the different critical
activation energies. When the different critical activation energy is larger than the activation
energy that a particle has, that particle is considered ignition.
The larger σ (10.0-12.0 kJ/mol) is used to obtain the modeling results from the old
version of DAEMI using the average particle size. Since the subsidiary simulation condition
is that the particle own the lowest activation energy in the batch could be ignited.
According to the experiment phenomenon, it is not always true that only the particle own
the lowest activation energy can be ignited. In Tables 3.7-3.8, these parameters that were
obtain by consider the particle in the batch of 1170 particles could has the lowest activation

55
energy was ignited, are different with E0=84.0 kJ/ml, σ=4.0 kJ/mol and n=0.4 that Dr.
Chen got from the batch of 100 particles before. So the different simulation process and
experiment value obtain the different simulation parameter.
Figures 3.19-3.22 show the effect of oxygen concentration for both the modeling
results and experiment data: As oxygen level is decreased from 100% to 10%, the frequency
distribution shifts to higher laser energies or, equivalently, higher particle temperatures.
This is consistent with ignition theory since at decreased oxygen levels, higher temperatures
are necessary for heat generations (due to chemical reactions) that exceed the heat loss from
the particles and leads to ignition.
As shown in Tables3.5-3.6, whether we used the distribution of particle size or the
average particle size, the modeling result that is obtained by one set of parameters only fits
the experiment data of one type of coal. The results show clearly that ignition reactivity is
strongly dependent on the coal type. Particle-to-particle variation in physical and/or
chemical property of the fuel can be accounted for in order to model the ignition data
correctly, and to accurately describe the ignition reactivity. In the future research, statistical
test should be used to calculate the confidence intervals, according to a specified
significance level to decide on the best set of ignition reactivity parameters.
According to the experimental data, for same coal type, oxygen concentration and
particle size, ignition frequency increases with increasing gas temperature. This case is
similar to the base case, namely, ignition frequency increases with particle or gas
temperature. So the modeling results fit the Drop-Tube experiment data [4] of one particle
size. The simulation gave the best results for the 75-90 µm coal#1 particle using E0=70.0

56
kJ/mol, σ=1.0 kJ/mol, A0=300 kg/m2s, n=0.5. The model also was found to give the best
fit to the 75-90 µm coal#2 particle for E0=71.0 kJ/mol, σ=1.0 kJ/mol, A0=320 kg/m2s,
n=0.5. It is also found that using n=1.0 difficult to fit to the experiment data [4].
4.2 Comparison with Laser Experiment
For the laser experiment, the DAEMI incorporated the distribution of particle size.
The modeling results and the experimental data are shown in Figures 3.13-3.18. These
figures all show the effect of oxygen concentration for both the modeling results and
experimental data at the same particle size. As the oxygen level is decreased from 100% to
67%, the frequency distribution shifts to higher laser energies, this phenomenon is same as
the Drop-Tube experiment. Using those different experimental techniques, we could
improve the ignition theory.
Figures 3.13-18 and Tables 3.2-3.4 indicate that the model could account for
particle-to-particle variations in reactivity by having a single pre-exponential factor and a
Gaussian distribution of activation energies among the particles within a type coal (a
sample). The simulation gives final result for the Pust coal all over the laser energies
considered, the oxygen concentration and particle size using E0=120.0 kJ/mol, σ=40.0
kJ/mol, A0=200 kg/m2s, n=1.0. The modeling results fit the Wyodak coal all over the laser
energies, the oxygen concentration and the particle size using E0=115.0 kJ/mol, σ=40.0
kJ/mol, A0=100 kg/m2s, n=1.0. The modeling results also fit the Pittsburgh#8 all over the
laser energy, the oxygen concentration and the particle size using E0=135.0 kJ/mol, σ=12.0
kJ/mol, A0=250 kg/m2s, n=1.0.

57
The measured particle temperatures of Pust and Wyodak coal are lower than the
Pittsburgh#8. The simulation result of Pust and Wyodak are better than that of the
Pittsburgh#8. The heat generated by a spherical carbon particle undergoing oxidation on its
external surface, it is determined by the kinetic expression and the oxidant diffusion
expression. At the lower range of particle temperature, the heat is mainly generated by the
kinetic expression; at the higher range of particle temperature, the heat is mainly generated
by the oxidant diffusion expression. In the current version of DAEMI, the generated heat
is considered to be by the kinetic expression. So the simulation result of coal at the lower
particle temperature is better than that at the higher particle temperature.
Figure 4.1 shows the measured particle temperature of the laser experiment.
According to the DAEMI, the ignition frequency increases with increasing laser energy.
The reason could be effect of the distribution of activation energies among the particles
within a sample. When the higher laser energy is used, the ignition could happen between
the higher and lower activation energy levels, so the ignition frequency at higher laser energy
is higher than that at the lower laser energy. For each activation energy, we can calculate the
particle temperature by the ignition theory, the higher range of particle temperature is
obtained by the higher laser energy. But the measured particle temperatures of the laser
experiment are not like this shown in Figure 4.1.
For the base case, Figures 3.9-3.12 also show the same effect of Distribution Particle
Size in 106-125 µm, 150-180 µm and average particle size 116 µm, 165 µm on ignition
frequency for oxygen concentration 67% and 100%.
For the heterogeneous coal ignition, it is well known that the product of carbon
oxidation is both CO and CO2, and the reaction order n is depended on the carbon

58
oxidation. The proportion of the product CO and CO2 could assume is different using the
different ignition experimental mechanism. Since the different particle temperature was
obtained by the different ignition experimental mechanism [3]. So the reaction order n=0.5
obtained from simulating the Drop-Tube experiment, n=1.0 obtained from simulating the
laser ignition experiment.

59
Figure 4.1 Temperature distribution versus laser energy for Pittsburgh#8 coal.
(a) Particle size: 106-125µm, O2: 100%; (b) Particle size: 106-125µm,
O2: 75%; (c) Particle size: 150-180µm, O2: 100%; (d) Particle size:
150-180µm, O2: 67%; (e) Particle size: 125-150µm, O2: 75%; (f)
Particle size: 125-150µm, O2: 100%.
(e)
2000
2100
2200
2300
2400
2500
2600
2700
2800
2900
150 200 250 300 350 400
l aser energy (mJ)
tem
per
atu
re (
K)
(f)
2400
2500
2600
2700
2800
2900
3000
3100
150 200 250 300 350
laser energy (mJ)
Par
ticl
e te
mp
erat
ure
(K
)
( b )
2000
2100
2200
2300
2400
2500
2600
2700
2800
2900
3000
200 250 300 350
l a s e r e n e r g y ( m J )
(a)
1800
2000
2200
2400
2600
2800
150 250 350 450
laser energy
tem
per
atu
re
(c)
2000210022002300240025002600270028002900
150 200 250 300 350
laser energy
tem
per
atu
re
( d )
2200
2250
2300
2350
2400
2450
2500
2550
2600
2650
2700
150 250 350 450 550
l a s e r e n e r g y


61