Experimental Study to Evaluate Smoke Stratification and ... · a SwRI, 6220 Culebra Road, San...
12
Experimental Study to Evaluate Smoke Stratification and Layer Height in Highly Ventilated Compartments Jason Huczek a , Marc Janssens a , Kentaro Onaka b , Stephen Turner c a SwRI, 6220 Culebra Road, San Antonio, TX 78238, USA b TEPCO, 1 Chome-1-2 Uchisaiwaicho, Chiyoda, Tokyo 100-0011, Japan c Leidos, Inc., 301 Laboratory Road, Oak Ridge, TN 37830, USA ABSTRACT Southwest Research Institute (SwRI) recently conducted a research program focused on the effect of mechanical ventilation on smoke layer height for two geometric configurations (corridor and tee) and two fire sources. The primary objective of the research was to define performance metrics related to smoke layer height for relevant fire scenarios in order to specify a smoke extraction system suitable for a specific configuration in a building. A test enclosure was constructed, which consisted of a first floor that was 3 m wide, 10-m long and 3-m tall, and a second floor that was 3-m wide, 4-m long and 4-m tall. The first and second floor compartments were connected by a single hatch measuring 1 × 1-m. Mechanical exhaust was connected to the second floor compartment and exhaust flow rates between 0 and 1.11 m 3 /s were evaluated in the tests. Thermocouple trees, each outfitted with seven thermocouples at various elevations, were positioned at three locations in the test enclosure. The smoke layer height was calculated based on the vertical temperature measurements at the three locations. It was also estimated based on video documentation of visibility of an array of exit signs at the same nominal locations. These measurements are discussed and compared in detail in this paper. INTRODUCTION To meet the fire safety requirements in an industrial corridor-like structure, the building owner had to ensure that, in the event of a fire, the smoke layer will not descend below 1.5 m above the floor. To comply with this requirement, the building owner decided to provide mechanical ventilation through a ceiling hatch at one end of the structure and use Fire Dynamics Simulator (FDS) to determine the extraction rate that would be needed to meet the performance-based requirement. The FDS validation guide [1] indicates that, on average, the model slightly over-predicts the smoke layer depth (layer depth = ceiling height minus layer height) by only 3% (bias δ ≈ 1.03), with an uncertainty of ± 5% (relative standard deviation σ ≈ 0.05). However, these estimates are based for a large part on a comparison between model predictions and layer height measurements in naturally vented compartments. Moreover, the flow rates in the mechanically vented experiments were relatively low (1 – 10 air changes per hour). The building owner therefore decided to conduct a series of fourteen full-scale experiments to expand the validation range of the model to include high ventilation rates (15 – 29 air changes per hour).
Transcript of Experimental Study to Evaluate Smoke Stratification and ... · a SwRI, 6220 Culebra Road, San...

Experimental Study to Evaluate Smoke Stratification and Layer Height in
Highly Ventilated Compartments
Jason Huczek
a, Marc Janssens
a, Kentaro Onaka
b, Stephen Turner
c
a SwRI, 6220 Culebra Road, San Antonio, TX 78238, USA
b TEPCO, 1 Chome-1-2 Uchisaiwaicho, Chiyoda, Tokyo 100-0011, Japan
c Leidos, Inc., 301 Laboratory Road, Oak Ridge, TN 37830, USA
ABSTRACT
Southwest Research Institute (SwRI) recently conducted a research program focused on the
effect of mechanical ventilation on smoke layer height for two geometric configurations
(corridor and tee) and two fire sources. The primary objective of the research was to define
performance metrics related to smoke layer height for relevant fire scenarios in order to specify a
smoke extraction system suitable for a specific configuration in a building.
A test enclosure was constructed, which consisted of a first floor that was 3 m wide, 10-m long
and 3-m tall, and a second floor that was 3-m wide, 4-m long and 4-m tall. The first and second
floor compartments were connected by a single hatch measuring 1 × 1-m. Mechanical exhaust
was connected to the second floor compartment and exhaust flow rates between 0 and 1.11 m3/s
were evaluated in the tests. Thermocouple trees, each outfitted with seven thermocouples at
various elevations, were positioned at three locations in the test enclosure. The smoke layer
height was calculated based on the vertical temperature measurements at the three locations. It
was also estimated based on video documentation of visibility of an array of exit signs at the
same nominal locations. These measurements are discussed and compared in detail in this paper.
INTRODUCTION
To meet the fire safety requirements in an industrial corridor-like structure, the building owner
had to ensure that, in the event of a fire, the smoke layer will not descend below 1.5 m above the
floor. To comply with this requirement, the building owner decided to provide mechanical
ventilation through a ceiling hatch at one end of the structure and use Fire Dynamics Simulator
(FDS) to determine the extraction rate that would be needed to meet the performance-based
requirement.
The FDS validation guide [1] indicates that, on average, the model slightly over-predicts the
smoke layer depth (layer depth = ceiling height minus layer height) by only 3% (bias δ ≈ 1.03),
with an uncertainty of ± 5% (relative standard deviation σ�� ≈ 0.05).
However, these estimates are based for a large part on a comparison between model predictions
and layer height measurements in naturally vented compartments. Moreover, the flow rates in
the mechanically vented experiments were relatively low (1 – 10 air changes per hour). The
building owner therefore decided to conduct a series of fourteen full-scale experiments to expand
the validation range of the model to include high ventilation rates (15 – 29 air changes per hour).
FULL-SCALE EXPERIMENTAL DESIGN
Fire Source Development
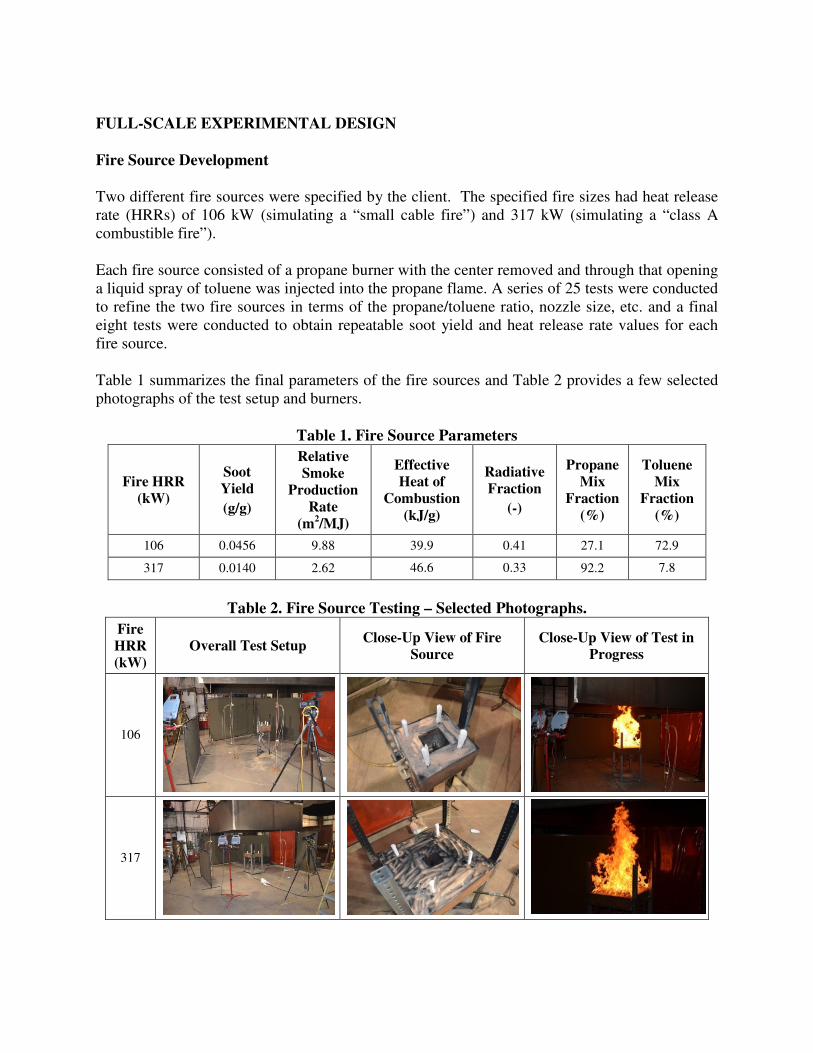
Two different fire sources were specified by the client. The specified fire sizes had heat release
rate (HRRs) of 106 kW (simulating a “small cable fire”) and 317 kW (simulating a “class A
combustible fire”).
Each fire source consisted of a propane burner with the center removed and through that opening
a liquid spray of toluene was injected into the propane flame. A series of 25 tests were conducted
to refine the two fire sources in terms of the propane/toluene ratio, nozzle size, etc. and a final
eight tests were conducted to obtain repeatable soot yield and heat release rate values for each
fire source.
Table 1 summarizes the final parameters of the fire sources and Table 2 provides a few selected
photographs of the test setup and burners.
Table 1. Fire Source Parameters
Fire HRR
(kW)
Soot
Yield
(g/g)
Relative
Smoke
Production
Rate
(m2/MJ)
Effective
Heat of
Combustion
(kJ/g)
Radiative
Fraction
(-)
Propane
Mix
Fraction
(%)
Toluene
Mix
Fraction
(%)
106 0.0456 9.88 39.9 0.41 27.1 72.9
317 0.0140 2.62 46.6 0.33 92.2 7.8
Table 2. Fire Source Testing – Selected Photographs.
Fire
HRR
(kW)
Overall Test Setup Close-Up View of Fire
Source
Close-Up View of Test in
Progress
106
317

For the 106-kW fire source, the spray nozzle used to discharge toluene was a Hago, 2.00 GPH,
80º, Hollow Cone. The discharge pressure was 9.6 bar and the mass flow rate was 1.91 g/s. For
the 317-kW fire source, the spray nozzle used to discharge toluene was a Monarch, 0.65 GPH,
90º, Hollow Cone. The discharge pressure was 8.6 bar and the mass flow rate was 0.55 g/s.
For the 106-kW fire source, the propane mass flow rate was 0.71 g/s and the heat release rate
was 33 kW. For the 317-kW fire source, the propane mass flow rate was 6.46 g/s and the heat
release rate was 300 kW.
A more detailed discussion of the ignition source characterization can be found in [2].
Experimental Configuration
The experiments were performed in two configurations, referred to as “corridor” and “tee” and
shown in Figures 1 and 2, respectively.
Figure 1. Corridor Configuration

Figure 2. Tee Configuration
Instrumentation
Three measurement stations were positioned downstream from the fire source location. At each
station, there was a thermocouple tree (Type K, 20 AWG wire) and two sets of exits signs
(illuminated and non-illuminated) at two heights, which were viewed by cameras through glass
windows. The cameras were set up to view the exit signs as well as the length of the corridor(s).
The camera locations are depicted in Figure 3.
In the hatch corridor, two types of optical density measurements were taken. A set of seven
commercial beam detectors (System Sensor Model 1224S) and four laser detectors (Edmund
Optics components) were installed to measure optical density, and to a lesser extent, smoke layer
height, in each experiment. The layout of each thermocouple tree as well as the beam and laser
detectors is depicted in Figure 4.
Figure 3. Camera Port Locations (Plan View)

Figure 4. Instrumentation Layout (Elevation View)
The lasers were transmitted across the nominal 10 meters of the hatch corridor and the intensity
was measured with a photodiode receiver that converts intensity to voltage.
The laser sources are red in color and have a wavelength of 635 nm ± 5 nm. The photodiode
receivers are 5-mm diameter Si photodiode detectors with an operating wavelength of 0.1 –
1.1 µm and responsivity of 0.5 × 10⁸ / 10
7 Volts/Watt (depending on gain position).
An in-situ, end-to-end calibration of the laser detector system was completed and the results are
shown in Figure 5. The transmittance was measured after placing neutral density filters ranging
from 0.5 to 3.0 OD at each laser beam height. The percent error between average measurements
and neutral density filters is provided in the table and ranges from approximately 4 to 14%, but is
very low over the range of interest for the compartment test measurements.
Figure 5. Calibration of Laser Detector System in Hatch Corridor (10-m Pathlength)

Compartment Test Matrix
Table 3 provides the details of the compartment test matrix.
Table 3. Compartment Test Matrix
Test ID HRR
(kW) Configuration
Flow
m3/s (ACH*)
Discussion
Preliminary Tests
1 106 Corridor 0.56 (15) Initial Tests to checkout
instrumentation 2 317 Corridor 0.56 (15)
S-1 106 Corridor 0-0.83
(0-22)
0 m3/s,0.28 m
3/s, 0.56 m
3/s,
0.83 m3/s, 7-10 minutes each
S-2 106 Corridor 0.83 (22)
0.56 (15)
Picked two flows from S-1, 15
minutes each
S-3 317 Corridor 0.56-1.11
(15-29)
0.56 m3/s, 0.83 m
3/s, 1.11 m
3/s,
10 minutes each
S-4 317 Corridor 1.11 (29)
0.83 (22)
Pick two flows from S-3, 15
minutes each
Final Tests
FS-1 106 Corridor
0.83 (22)
0.56 (15)
Cable fires, 106 kW
Corridor and Tee
Ventilation based on S-2, two
flows, 15 minutes each
FS-2 106 Corridor
FS-3 106 Corridor
FS-4 106 Tee
FS-5 106 Tee
FS-6 106 Tee
FS-7 317 Tee 1.11 (29)
0.83 (22)
Class A fires, 317 kW, Tee
Ventilation based on S-4, two
flows, 15 minutes each
FS-8 317 Tee
FS-9 317 Tee
FS-10 106 Tee 0.83 (22)
0.56 (15) Rerun of FS-6
*ACH=air changes per hour, based on total volume of test structure
FULL-SCALE TEST RESULTS
Table 4 provides a summary of the results for a few of the final tests (FS-1, FS-4, and FS7),
including temperatures and optical densities measured at 12.5 minutes after flow is set for each
test. Tables 5-7 provide selected graphical results for test FS-1, FS-4 and FS7, respectively.

Table 4. Summary of Selected Final Test Results (FS-1, FS-4 and FS-7).
Test
ID
Flow
m3/s
(ACH)
Amb.
Temp.
(̊C)
Tree Temp, 2.7m
(̊C)
Duct
Temp
Optical Density at
height in meters
Tr 1 Tr 2 Tr 3 ̊C 2.3 1.9 1.5 1.1
FS-1 0.83 (22)
20.2 29.2 63.0 114.7 49.3 1.97 1.07 0.3 1.22
0.56 (15) 68.6 84.2 128.5 58.3 3.40 1.76 1.23 1.57
FS-4 0.83 (22)
21.6 33.4 77.1 104.4 57.9 1.87 0.98 0.73 0.50
0.56 (15) 76.4 97.7 124.8 69.3 2.14 1.21 1.02 0.85
FS-7 1.11 (29)
14.9 139.6 164.4 208.5 126.9 1.38 0.50 0.56 0.32
0.83 (22) 171.6 207.1 252.3 144.9 1.66 0.72 0.60 0.39
ACH=Air Changes per Hour, Amb=Ambient, Temp=Temperature, Tr=Tree
Table 5. Test FS-1 Results
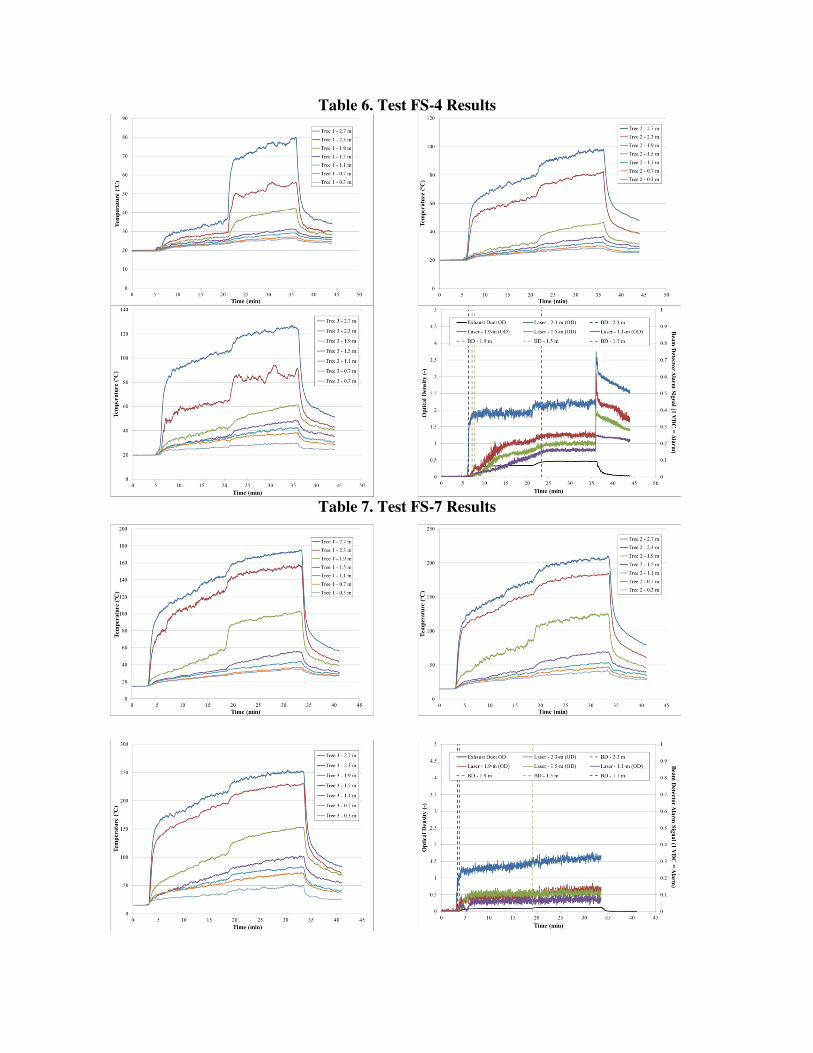
Table 6. Test FS-4 Results
Table 7. Test FS-7 Results

A few general test observations can be made from the data. At higher ventilation rates, a clear
layer was observed in both corridors. At lower ventilation rates, a clear layer was observed in
the fire corridor, but mixing was observed in the hatch corridor.
At lower ventilation rates, multiple layers of smoke were observed: an area of darker smoke at
the top above approximately 2-2.5 m, a layer of lighter smoke with a depth of approximately 0.5-
1 m, and a clear layer below that elevation. This was consistently observed for all the tests.
The measured optical densities for the simulated cable fires were higher than for the simulated
class A combustible fires, as expected due to the higher soot yield for the former. The upper
layer gas temperature for the simulated cable fires were lower than for the simulated class A
fires, as expected due to the higher HRR for the latter.
Test Photograph Arrays and Exit Sign Comparisons
Still images from the cameras used during testing were collected for comparison to the FDS
visualizations in Smokeview. Figure 6 shows an example of this type of photograph array for
FS-1. Table 8 provides a comparison between FS-1 and FDS calculations for the same scenario
and Tables 9-10 provide comparison images between the FS-1 and FS-4 experiments and FDS
output. The details of the FDS modeling for this project are discussed in [3].
Figure 6. FS-1 Photo Array (Top: 0.83 m
3/s, Bottom: 0.56 m
3/s).

Table 8. FS-1 Visibility and FDS Results for Exit Sign Position No. 3
Parameter Test Series
FS1
FDS Result
(S2, FS1-FS3)
Estimated Smoke Layer Height (m) at 0.83 m3/s 2.0 1.6
Estimated Smoke Layer Height (m) at 0.56 m3/s 1.9 1.4
2.3-m Illuminated Exit Sign Visible at 0.83 m3/s? Yes OD = 0.505 1/m
2.3-m Reflective Exit Sign Visible at 0.83 m3/s? No OD = 0.505 1/m
2.3-m Illuminated Exit Sign Visible at 0.56 m3/s? No OD = 0.402 1/m
2.3-m Reflective Exit Sign Visible at 0.56 m3/s? No OD = 0.402 1/m
1.5-m Illuminated Exit Sign Visible at 0.83 m3/s? Yes OD = 0.023 1/m
1.5-m Reflective Exit Sign Visible at 0.83 m3/s? Yes OD = 0.023 1/m
1.5-m Illuminated Exit Sign Visible at 0.56 m3/s? Yes OD = 0.082 1/m
1.5-m Reflective Exit Sign Visible at 0.56 m3/s? Yes OD = 0.082 1/m
Table 9. FS-1 and FS-4 Visibility and FDS Results for Exit Sign Position No. 3
Test
ID
Test Result FDS Calculation
0.83 m3/s
FS-1
FS-4

Table 10. FS-1 and FS-4 Visibility and FDS Results for Exit Sign Position No. 3
Test
ID
Test Result FDS Calculation
0.56 m3/s
FS-1
FS-4
Comparison of Observed Smoke Layer Heights and FDS Calculations
Figure 7 shows an example of layer height comparisons between experiments and FDS for both
configurations and one of the fire sources. The first 900 seconds of each graph corresponds to an
exhaust rate of 0.83 m3/s and the second 900 seconds of each graph corresponds to an exhaust
rate of 0.56 m3/s.
Figure 7. Selected Smoke Layer Comparison Results.

CONCLUSIONS
The main conclusions from this research are as follows:
• The agreement between observed layer heights and calculated layer heights is better in
the fire compartment, than in the adjoining compartments, which are closer to the
mechanical exhaust extraction point. The mechanical exhaust introduces significant
mixing between the layers, which greatly impairs the ability to use the thermocouple tree
data to estimate the layer height close to the extraction point.
• The mixing effects appear to be more significant for the corridor configuration than the
tee configuration. This is likely due to the closer proximity to the exhaust hatch of the
fire in the tee configuration, as compared to the corridor configuration.
• The smoke layer height based on visual observations is generally and often significantly
higher than the HGL height determined from vertical temperature profile data.
ACKNOWLEDGEMENT
The authors would like to express their gratitude to TEPCO for the financial support that made
the work described in this paper possible.
REFERENCES
1. McGrattan, Kevin, et. al., “Fire Dynamics Simulator Technical Reference Guide Volume 3:
Validation”, NIST Publication 1018, National Institute of Standards and Technology,
September 30, 2014.
2. Huczek, J., et al., “Full-Scale Fire Tests to Obtain Optical Density Data for Validation of
Compartment Fire Models,” Interflam 2016, London, England, July 4-6, 2016.
3. Janssens, M., et al., “Use of FDS to Comply with Performance-Based Requirements Based
on Smoke Layer Height,” 11th
Conference on Performance-Based Codes and Fire Safety
Design Methods, Warsaw, Poland, May 23-25, 2016.