Experimental Study of Water Vapor Adsorption on Geothermal ... · Experimental Study of Water Vapor...
50
SGP- TR- 148 Experimental Study of Water Vapor Adsorption on Geothermal Reservoir Rocks Shubo Shang, Roland N. Home and Henry J. Ramey, Jr. May 1994 Financial support was provided through the Stanford Geothermal Program under Department of Energy Grant No. DE-FG07-90IDI2934, and by the Department of Petroleum Engineering, Stanford University Stanford Geothermal Program Interdisciplinary Research in Engineering and Earth Sciences STANFORD UNIVERSITY Stanford, California
Transcript of Experimental Study of Water Vapor Adsorption on Geothermal ... · Experimental Study of Water Vapor...

SGP-TR-148
Experimental Study of Water Vapor Adsorption on Geothermal
Reservoir Rocks Shubo Shang, Roland N. Home
and Henry J. Ramey, Jr.
May 1994
Financial support was provided through the Stanford Geothermal Program under Department of Energy
Grant No. DE-FG07-90IDI2934, and by the Department of Petroleum Engineering,
Stanford University
Stanford Geothermal Program Interdisciplinary Research in Engineering and Earth Sciences STANFORD UNIVERSITY Stanford, California
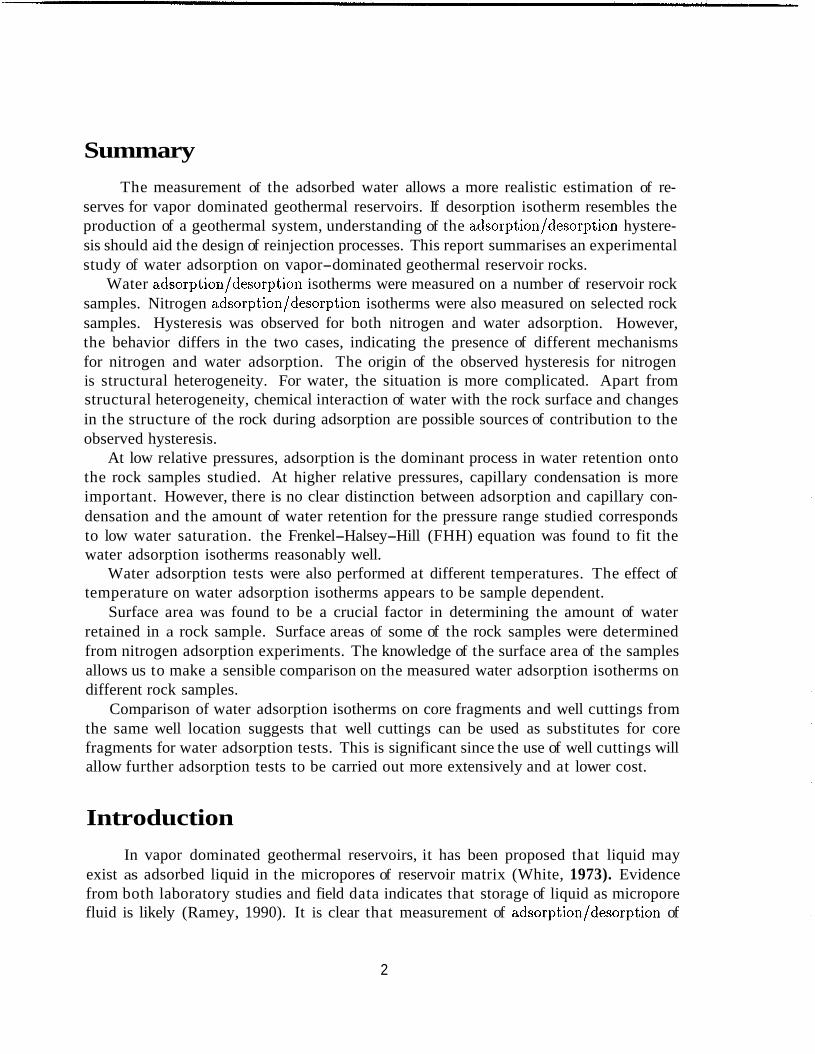
Summary The measurement of the adsorbed water allows a more realistic estimation of re-
serves for vapor dominated geothermal reservoirs. If desorption isotherm resembles the production of a geothermal system, understanding of the adsorption/desorption hystere- sis should aid the design of reinjection processes. This report summarises an experimental study of water adsorption on vapor-dominated geothermal reservoir rocks.
Water adsorption/desorption isotherms were measured on a number of reservoir rock samples. Nitrogen adsorption/desorption isotherms were also measured on selected rock samples. Hysteresis was observed for both nitrogen and water adsorption. However, the behavior differs in the two cases, indicating the presence of different mechanisms for nitrogen and water adsorption. The origin of the observed hysteresis for nitrogen is structural heterogeneity. For water, the situation is more complicated. Apart from structural heterogeneity, chemical interaction of water with the rock surface and changes in the structure of the rock during adsorption are possible sources of contribution to the observed hysteresis.
At low relative pressures, adsorption is the dominant process in water retention onto the rock samples studied. At higher relative pressures, capillary condensation is more important. However, there is no clear distinction between adsorption and capillary con- densation and the amount of water retention for the pressure range studied corresponds to low water saturation. the Frenkel-Halsey-Hill (FHH) equation was found to fit the water adsorption isotherms reasonably well.
Water adsorption tests were also performed at different temperatures. The effect of temperature on water adsorption isotherms appears to be sample dependent.
Surface area was found to be a crucial factor in determining the amount of water retained in a rock sample. Surface areas of some of the rock samples were determined from nitrogen adsorption experiments. The knowledge of the surface area of the samples allows us to make a sensible comparison on the measured water adsorption isotherms on different rock samples.
Comparison of water adsorption isotherms on core fragments and well cuttings from the same well location suggests that well cuttings can be used as substitutes for core fragments for water adsorption tests. This is significant since the use of well cuttings will allow further adsorption tests to be carried out more extensively and at lower cost.
Introduction In vapor dominated geothermal reservoirs, it has been proposed that liquid may
exist as adsorbed liquid in the micropores of reservoir matrix (White, 1973). Evidence from both laboratory studies and field data indicates that storage of liquid as micropore fluid is likely (Ramey, 1990). It is clear that measurement of adsorption/desorption of
2

water vapor on geothermal reservoir rocks is a crucial step in determining whether ad- sorption is the storage mechanism for these systems. If so, a better reserve estimation could be obtained based on the measured adsorption isotherms and their appropriate extrapolation. Since the desorption of water vapor from the adsorbed rock surface re- sembles the production of vapor dominated geothermal reservoirs, understanding of the adsorption/desorption phenomena provides insight into the production and ultimately will aid the planning of reinjection processes.
Water vapor desorption was regarded as a simple and reliable technique in core anal- ysis by Melrose (1988). In a comprehensive study to determine capillary pressure data in the low-saturation region, Melrose (1991) compared results obtained using different techniques, and concluded that water vapor desorption methods gave capillary pressure data in good agreement with those obtained using the centrifuge and the porous plate methods. It should be pointed out, however, that the relative pressure range (0.9 to 0.99) used in Melrose work is high in comparison to common adsorption studies. Reservoir re- lated water adsorption studies is limited, particularly at high temperatures. A review of the literature on water adsorption and some fundamental issues of physical adsorption was given in the paper in Appendix I.
There was a need to improve the apparatus for water adsorption test at high tempera- tures and collect adsorption data on a variety of reservoir rock samples. It was appealing to automate the adsorption experiments in the interest of both spare the operator for other tasks and in reducing experimental error. Harr (1991) performed preliminary in- vestigations on the use of an automated sorptometer from Porous Materials, Inc. (PMI) for high temperature water adsorption measurements. To our knowledge, this is one of the first commercial sorptometer built for high temperature water adsorption tests. Con- siderable time was spent to investigate various problems associated with the sorptometer during the course of this project.
In this report, we summarise the experimental work carried out in our laboratory in the past two years. This includes the testing and modification of a commercial sorp- tometer, measurements of water adsorption isotherms on a variety of reservoir rocks, and the measurement of surface area of some of the rock samples studied using nitrogen adsorption. Portions of the results were prepared for publication and they are appended to the report.
Apparatus and Procedures
PMI Sorptometer The principle of the adsorption/desorption measurement is the same as a BET type
of experiment. The Porous Material Inc. (PMI) sorptometer uses volumetric method and measures pressure difference before and after adsorption. A detailed description of the sorptometer is given in Appendix I. During normal operation, the operator only
3

needs to load the sample and program the test conditions. The rest of the procedures are controlled by a computer.
Experimental Procedure Due to the limitation of the size of the sample holder connections, rock samples had
to be broken into granulars with equivalent diameters less than 8 mm. This should not impose any problem since the only change caused by breaking the core is surface area and the change is likely to be small. Breaking the material was found to have negligible effect on the amount of water adsorbed (Harr, 1991). On the other hand, using small size samples reduces diffusional time and the time required for adsorption/desorption equilibrium.
Knowing the complexity of the adsorption process, it is important to ensure that the rock surface has the same condition prior to each adsorption test. This was achieved by heating new samples at 180°C under vacuum overnight and heating the sample at temperatures higher than the test temperature under vacuum for 2 to 4 hours between different tests. Upon adsorption, water vapor is added incrementally to the system from a steam reservoir kept in the high temperature chamber. Time was allowed for the system to reach equilibrium. Desorption commences at the end of the adsorption test. In this case, water vapor is gradually pumped away until the adsorbed water is completely desorbed.
Modifications and Limitations of the Sorptometer During the process of bringing the sorptometer into a fully operational state, dif-
ferent versions of computer programs were tested. The hardware problem we found with the PMI sorptometer was a difficulty in reaching pressures higher than 40 psia with an instrument temperature of 150°C (the corresponding saturation pressure of water is 69 psia). Two different tests were performed to investigate this problem. With nitrogen, we could pressure the system to 70 psia without any problem. This suggests that the instru- ment temperature is different from that read on the temperature controller. A further test by inserting the thermocouples into different parts of the high temperature chamber confirmed that the heat distribution in the upper part of the sorptometer is not uniform. Steam generated from the water reservoir condenses at the cold spots. This finding ex- plained why we could not reach the desired pressure, and also exposed a problem for us since the system is compact and was difficult to work on. The heating system consists of an electrical heater and a blower fan. However, the original fan never functioned due to the mechanical failure caused by elevated temperature. We tried different fan-heater arrangements with various degree of success. Eventually, we settled for a combination of three flexible cable heaters and two fans. We also installed a ball bearing to balance the position of the blower fans. This appears to work well except that the bearing needs to
4

be replaced every three months. According to the manufacturer's specifications, the applicable adsorption tempera-
tures of the sorptometer is -196°C (77K-liguid nitrogen) to 300°C. We decide to run nitrogen adsorption test at 77K to determine the surface areas of our rock samples. The tests failed for two reasons. First of all, the maximum amount of sample can be used for the test is small (ca. 20 grams) due to the size of sample holder and chamber, secondly, it was difficult to maintain a constant liquid nitrogen level. Both factors are important since reservoir rocks typically have small surface area. Krypton adsorption at 77K was also tried without success. Consequently, we concluded that the sorptometer as it is not suitable for surface area measurement of reservoir rocks.
Another limitation of the PMI sorptometer is very high temperature. Although the claimed working temperature is -196°C to 300"C, the maximum safe operating temper- ature for the valves in the high temperature chamber is about 19O"C, and the maximum temperature for the water vessel is about 180°C. This means that the absolute maxi- mum temperature is not higher than 180°C. We have not attempted to use temperatures higher than 140°C for water adsorption test. This is partly due to the heating problem. Although we achieved a better temperature control with the new heater-fan system, the temperature distribution in the upper part of the sorptometer is still not uniform. This means that the instrument temperature needs to be higher than the actual adsorption test temperature. We also had a number of leaks in the system. To avoid mechanical failure, we decided not to risk too high a temperature.
Surface Area Analyzer The surface area of the rock samples were measured using nitrogen adsorption at
77K. The measurements were carried out using a surface area analyzer, Gemini 2370 on loan from Micromeritics. The Gemini 2370 uses a flow-gas technique in which nitrogen flows into both the sample and the balance tubes at the same time. The only difference between the two tubes is the presence of the sample in one of them. The delivery rate of nitrogen into the sample tube is controlled by the rate at which the sample can adsorb nitrogen onto the surface. The rate of flow into the balance tube is controlled to give the same pressure. The quantity adsorbed at a given pressure is measured by pressure difference in the two vessels connected to the two tubes. The BET equation was used to fit the adsorption data to give surface area.
Results and Discussion
Nitrogen Adsorption and Surface Area We wanted to run nitrogen adsorption tests on the rock samples for two reasons.
First of all, nitrogen adsorption tests provide information on surface area, and secondly,
5

5
I - Adsorption ...... * ..... Desorption
there is the possibility that we might be able to obtain pore sizes and size distribution from nitrogen adsorption/desorption isotherms. As discussed previously, such a task could not be performed on our sorptometer. We therefore decided to send selected samples to an outside laboratory and Micromeritics, Georgia, provided the service we needed. We first sent three samples, Berea sandstone, Geysers well NEGU-17 sample and a sample from Montiverdi#2, Italy. We were told that the surface area of the Montiverdi#2 sample was too low to be measured using nitrogen adsorption. The results for Berea sandstone and the Geysers well NEGU-17 sample are summarised in Appendix I. We subsequently sent two more samples for analysis, one from Calpine Co.’s well MLM-3 rock and the other from well Prati State 12, both from The Geysers. The measured adsorption/desorption isotherms for the two samples are shown in Figures 1 and 2.
These plots show the amount of nitrogen adsorbed in mg/g rock over a relative pres- sure ranging from 0 to 1. Both isotherms fit Type I11 of the Brunauer classification. Both samples exhibit adsorption/desorption hysteresis. It is interesting to note that the hysteresis loop changes rapidly between a relative pressure range from 0.45 to 0.55. This occurs for both samples. This kind of observation was reported for nitrogen adsorption at 77K on other materials and was regarded as characteristic of nitrogen at that par- ticular temperature (Gregg & Sing 1982). The presence of hysteresis suggests that the rock samples are heterogeneous in structure and that capillary condensation takes place at certain relative pressures. Network effect is another possible reason for the observed hysteresis. Discussion of this effect is beyond the scope of this study, and is available in published literature (Mason, 1982, 1988; Seaton, 1991).
6

I -t- Adsorption Desorption ...... * .....
E- l
0.0 0.2 0.4 0.6 0.8 1 .o Relative pressure
Figure 2: Nitrogen Isotherms on Well PS12 Sample 1
In principle, the application of the Kelvin equation to the measured nitrogen ad- sorption/desorption isotherms should yield pore size distribution of the porous material. However, it is difficult to obtain meaningful information for reservoir rocks due to their low porosity and highly irregular, heterogenerous structure.
Surface area is an important parameter in determining the amount of water adsorption on reservoir rocks (Shang et al. 1994). However, and it would be very expensive to have all our samples measured in the outside laboratory. We decided to look into purchasing a commercial surface area analyser. During this process, Micromeritics loaned their Gemini 2370 surface area analyser to us for trial, and we were able to run a number of tests during a period a two weeks. Summaries of the surface area data for a number of rock samples, both core fragments and well cuttings, are presented in Tables 1 and 2.
The data shown in Table 1 were obtained on well cuttings samples of well Prati State 12, The Geysers. Examination of the data reveals the heterogeneous nature of reservoir rocks. These rock typically have low surface area, however, vary with location. As we will see later, surface area is an important piece of information when we try to compare water adsorption isotherms on different rock samples.
Adsorption on Core Fragments Measurement of water adsorption isotherms on a variety of rock samples was the major objective of this project. During this study, we used a temperature range of 80 to 130°C. Water adsorption/desorption isotherms were measured on Berea sandstone, Geysers well
7
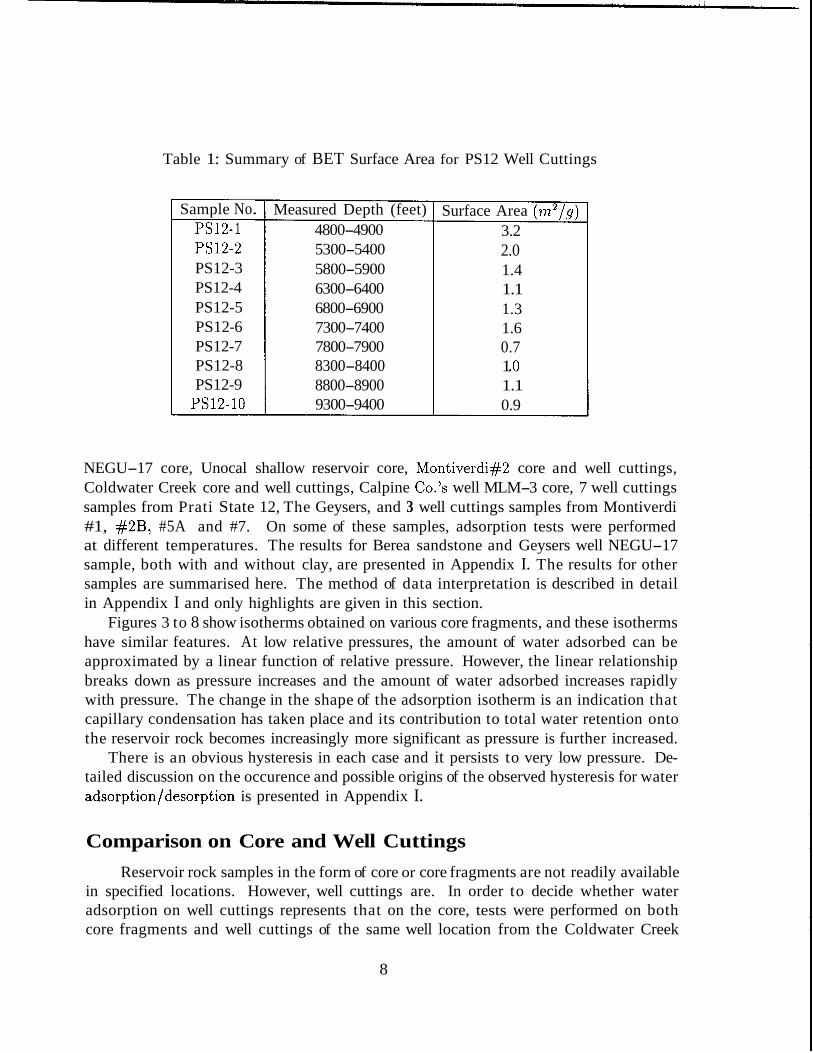
Table 1: Summary of BET Surface Area for PS12 Well Cuttings
Sample No. PS12-1 PS12-2 PS12-3 PS12-4 PS12-5 PS12-6 PS12-7 PS12-8 PS12-9
PS12-10
Measured Depth (feet) 4800-4900 5300-5400 5800-5900 6300-6400 6800-6900 7300-7400 7800-7900 8300-8400 8800-8900 9300-9400
Surface Area ( r n 2 / g ) 3.2 2.0 1.4 1.1 1.3 1.6 0.7 1 .o 1.1 0.9
NEGU-17 core, Unocal shallow reservoir core, Montiverdi#2 core and well cuttings, Coldwater Creek core and well cuttings, Calpine Co.’s well MLM-3 core, 7 well cuttings samples from Prati State 12, The Geysers, and 3 well cuttings samples from Montiverdi #1, #2B, #5A and #7. On some of these samples, adsorption tests were performed at different temperatures. The results for Berea sandstone and Geysers well NEGU-17 sample, both with and without clay, are presented in Appendix I. The results for other samples are summarised here. The method of data interpretation is described in detail in Appendix I and only highlights are given in this section.
Figures 3 to 8 show isotherms obtained on various core fragments, and these isotherms have similar features. At low relative pressures, the amount of water adsorbed can be approximated by a linear function of relative pressure. However, the linear relationship breaks down as pressure increases and the amount of water adsorbed increases rapidly with pressure. The change in the shape of the adsorption isotherm is an indication that capillary condensation has taken place and its contribution to total water retention onto the reservoir rock becomes increasingly more significant as pressure is further increased.
There is an obvious hysteresis in each case and it persists to very low pressure. De- tailed discussion on the occurence and possible origins of the observed hysteresis for water adsorption/desorption is presented in Appendix I.
Comparison on Core and Well Cuttings Reservoir rock samples in the form of core or core fragments are not readily available
in specified locations. However, well cuttings are. In order to decide whether water adsorption on well cuttings represents that on the core, tests were performed on both core fragments and well cuttings of the same well location from the Coldwater Creek
8

100 - Adsorption 120% ..... * ..... Desorption 1 2OoC
0.0 0.2 0.4 0.6 0.8 1 .o Relative pressure
Figure 3: Isotherms on on Calpine Co.’s Well MLM-3 Sample
0.0 0.2 0.4 0.6 0.8 1 .o Relative pressure
Figure 4: Isotherms on Calpine Co.’s Well MLM--3 Sample
9

0.0 0.2 0.4 0.6 0.8 1 .o Relative pressure
Figure 5: Isotherms on Geysers Shallow Reservoir Core
1.2
Y 0 P
E .E 0.8
s
3 0
cn al s ' 0.4
2 U c 3 z a
0.0
T=100 C ---A T=120 C t--. T=140C
....... * .......
0.0 0.2 0.4 0.6 0.8 1 .o Relative pressure
Figure 6: Comparison of Adsorption Isotherms on Montiverdi #2 sample
10

0.0 0.2 0.4 0.6 0.8 1 .o Relative pressure
Figure 7: Adsorption Isotherms on Coldwater Creek Core
Adsorption 1 OO°C - -+ - Desorption 100°C - - + - - Adsorption 1 2OoC
0.0 0.2 0.4 0.6 0.8 1 .o Relative pressure
Figure 8: Adsorption Isotherms on Coldwater Creek Well Cuttings
11

Table 2: Summary of BET Surface Area
Sample ID Geysers NEGU-17
Coldwater Creek Core Coldwater Creek Well Cuttings
Prati 29 ST1 Calpine Co.’s MLM3
Montiverdi 1 Montiverdi 2
Montiverdi 2B Montiverdi 5A Montiverdi 7
Surface Area m2/g 0.3 1.4 1.7
0.27 1.1 0.8 0.2 1.3 8.2 1.4
steamfield. Initial tests showed substantially more adsorption on the well cuttings than that on the core fragments. It was found that the presence of some foreign material (tentatively identified as clays from the drilling process) was the source of contribution to the higher adsorption on the well cuttings. Due to their distinguishing color, these foreign particles were easily removed. Figure 9 shows a comparison of the two adsorption isotherms obtained at 12OOC. Considering experimental error, the agreement between the two data sets is acceptable. Thus, we concluded that it will be acceptable to use well cuttings from different parts of the Geysers for systematic water adsorption tests.
Adsorption Capacity and Surface Area The first systematic water adsorption tests using well cuttings samples was per-
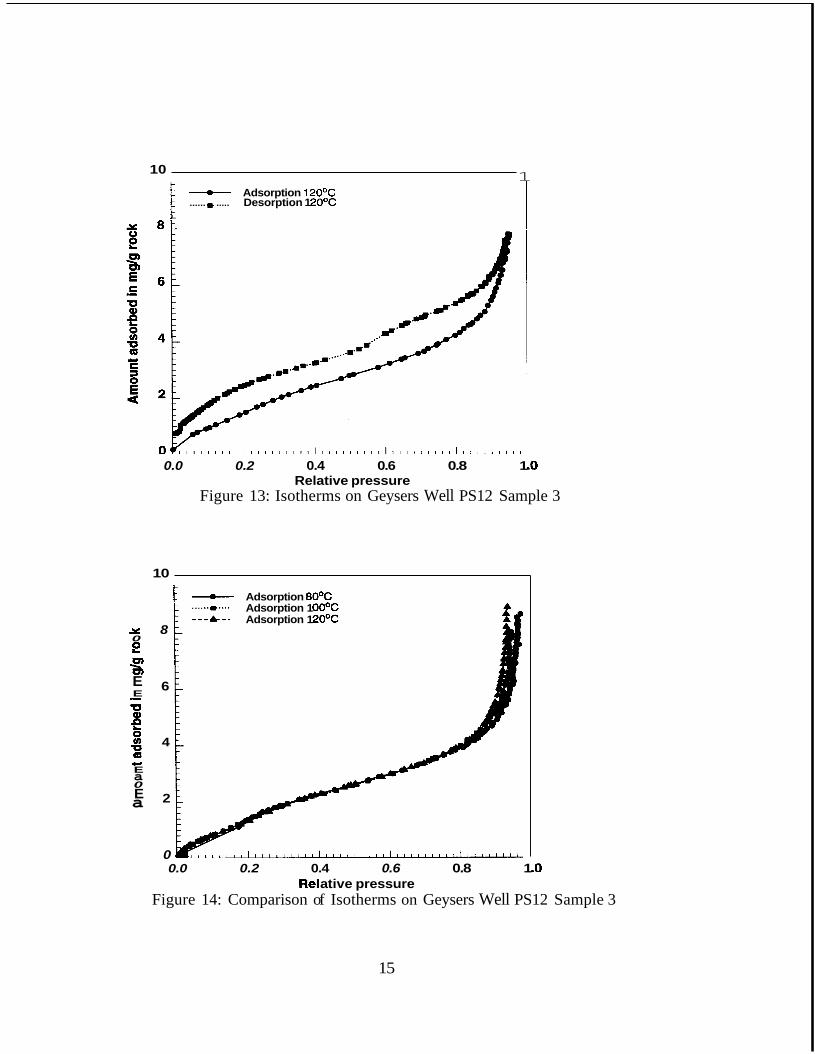
formed on seven samples from well Prati State 12, the Geysers. These well cuttings are composites of 100 feet intervals from different depth of the well. Samples 1 to 10 repre- sent an increase in depth from 4800 feet to 9400 feet. Figures 10 to 21 show the results of these tests. Similar features to those observed on core fragments exist on well cuttings samples.
Figure 22 shows a comparison of water adsorption isotherms obtained on seven Prati State 12 well cuttings at 120°C. The depth and the measured surface area of these samples are shown in Table 1. For all the samples studied, adsorption dominates the process of water retention for relative pressures up to about 0.8. As pressure is further increased, capillary condensation becomes more important. At a given pressure, the amount of water adsorbed varied considerably among the seven samples. The variation appears to be random with respect to depth. However, it does depend on the surface area of the samples. Knowing the surface area of the samples, we can express the amount
12

A s z 4 E
ii
s
' s 2
Y
m U Q
c c
E CI E 3
a
0
- Core Fragments ....... * ....... Well Cuttings
0.0 0.2 0.4 0.6 0.8 1.0 Relative pressure
Figure 9: Comparison of Adsorption Isotherms on Core and Well Cuttings
r n - Adsorption 8OoC Adsorption 1 OO°C
0.0 0.2 0.4 0.6 0.8 1 .o Relative pressure
Figure 10: Adsorption Isotherms on Geysers Well PS12 Sample 1
13

I - Adsorption80°C * Adsorption 1 OOOC
Adsorption 1 2OoC - - + - Adsorption 13OOC
...... ..... 6 1 ---&--
4 1
2:
0 I ' ' l l l l l l l l l ' ' ' l l ' , , I l l l ' " l l l l ' ' l l , ~ , , ,
0.0 0.2 0.4 0.6 0.8 1 .o Relative pressure
Figure 11: Adsorption Isotherms on Geysers Well PS12 Sample 2
I - Adsorption 100°C ...... * ..... Desorption 1 OO°C
0.0 0.2 0.4 0.6 0.8 1 .o Relative pressure
Figure 12: Isotherms on Geysers Well PS12 Sample 3
14
1 10
Y 0 e
E s l?! E
U -
5: U RI
E
0
c,
a E a
- Adsorption 120°C ...... * ..... Desorption 1 2OoC
L
8 1
0.0 0.2 0.4 0.6 0.8 1 .o Relative pressure
Figure 13: Isotherms on Geysers Well PS12 Sample 3
10 - Adsorption 8OoC Adsorption 1 OO°C Adsorption 1 2OoC
8
6
4
2
0 0.0 0.2 0.4 0.6 0.8 1 .o
Re1 at ive pressure Figure 14: Comparison of Isotherms on Geysers Well PS12 Sample 3
15

6
3 0 e E s4
C
U Q)
.- e 5: u 2 U m c 3 E a
0
- - Adsorption 100°C * AdsorDtion 1 2OoC ...... .....
Y 0 e E s 4
z
E
U .-
5: U e c 3 C
4
0.0 0.2 0.4 0.6 0.8 1 .o Relative pressure
Figure 15: Comparison of Isotherms on Geysers Well PS12 Sample 4
- Adsorption 100°C ...... * ..... Desorption 1 OOOC '"E 8
0.0 0.2 0.4 0.6 0.8 1 .o Relative pressure
Figure 16: Isotherms on Geysers Well PS12 Sample 6
16

10
I - Adsorption 13OoC ...... .....
- Adsorption 12OOC ...... * ..... Desorption 1 2OoC
0.0 0.2 0.4 0.6 0.8 1 .o Relative pressure
Figure 17: Isotherms on Geysers Well PS12 Sample 6
17

10
x 8
E 0
s 4
r € 6 .- U
0
U a E
a 4
a c
U E 2
0
E - Adsorption 100°C ...... * ..... Adsorption 1 2OoC Adsorption 1 3OoC
0.0 0.2 0.4 0.6 0.8 1 .o Relative pressure
Figure 19: Comparison of Isotherms on Geysers Well € 3 1 2 Sample 6
-
- - Adsorption 100°C
Adsorption 1 3OoC ...... ..... Adsorption 1 2OoC .. *
0.0 0.2 0.4 0.6 0.8 1 .o Relative pressure
Figure 20: Comparison of Isotherms on Geysers Well PS12 Sample 7
18

6
4
2
0 0.0 0.2 0.4 0.6 0.8 1 .o
Relative pressure Figure 21: Comparison of Isotherms on Well PS12 Sample 10
adsorbed as weight per unit surface. Figure 23 shows the comparison of the isotherms on the basis of unit surface. If physical adsorption is the only process occuring, the isotherms should fall onto the same curve. This is not the case, however, particularly at high relative pressures when capillary condensation contributes substantially to the total water retention. This supports our previous conclusion that the surface area of a rock sample is a primary factor in determining its water adsorption capacity and capillary condensation is a dominant process in water retention at high relative pressures.
A second set of tests was performed on well cuttings samples from Montiverdi wells. Figure 24 shows a comparison of the adsorption isotherms measured at 120°C. Clearly, the sample from Montiverdi 5 exhibits a much higher adsorption capacity compared to other samples. This is because Montiverdi 5 sample possess an unusually high surface area (8.2 rn2/g) for reservoir rocks. Comparison of the isotherms based on unit surface area is shown in Figure 25.
Effect of Temperature on Water Adsorption The effect of temperature on water adsorption isotherms appears to be sample dependent. In general, the effect is small at low relative pressures, and becomes more appreciable at high relative pressures.
One possible explanation for the observed temperature effect is chemical interaction of water with the rock surface. Secondly, the presence of salts may cause the observed phenomena. Salts have long been considered to cause vapor pressure lowering in vapor
19

...... .....
-+- PS12-4 --+-- PS12-6
0.0 0.2 0.4 0.6 0.8 1 .o Relative pressure
Figure 22: Comparison of Isotherms on Geysers Well IPS12 Samples
12 - - PS12-1 * PS12-2
---A-- PS12-3 -+- PS12-4 --+-- PS12-6
Q .-.- PS12-7
...... .....
8 -.-. E I m- Ps12-10 E
Q) n i %
0.2 0.4 0.6 0.8 1 .o Relative pressure
Figure 23: Comparison of Isotherms for PS12 Samples Based on Surface Area
20

n
3oL Y
B b
0.0 0.2 0.4 0.6 0.8 1 .o Relative pressure
Figure 24: Comparison of Isotherms for Montiverdi Samples
- - Adsorption Monteverdi 1
- ---&-- Adsorption Monteverdi 5 - -t - Adsorption Monteverdi 7
...... * ..... Adsorption Monteverdi 28
10 - - Adsorption Monteverdi 1
---&--. Adsorption Monteverdi 5 - +- - ...... * ..... Adsorption Monteverdi 28
Adsorption Monteverdi 7
4L
0.0 0.2 0.4 0.6 0.8 1 .o Relative pressure
Figure 25: Comparison of Isotherms for Montiverdi Samples Based on Surface Area
21

dominated geothermal systems. We believe it is reasonable to assume that if there are minerals present in the rock they will dissolve in the adsorbed liquid and have their appropriate effects on the system. It should be noticed that since the solubility of salts increases with temperature, so should the effects on vapor pressure. This may in turn influence the amount of water retained at different temperatures, particularly at high relative pressures.
Water Adsorption and Saturation The amount of adsorption at any given temperature and pressure can be converted to saturation according to the following equation,
where 4 is the porosity of the rock, pT and pw are the densities of the rock and the adsorbed phase. The major uncertainty in calculating saturation from adsorption data is porosity, which is difficult to measure accurately. For this reason, all adsorption isotherms are presented on weight basis rather than saturation. An example of converting the amount adsorbed into saturation is presented in Appendix I.
It was shown that adsorption at low relative pressure accounts for low saturation. However, the presence of the adsorbed water film reduces the size of the pores so that capillary condensation occurs at lower relative pressures than it would otherwise. At higher relative pressures, saturation increases quicker with pressure due to the occurrence of capillary condensation. Further increase in relative pressure will undoubtedly results in a more dramatic increase in saturation. However, it becomes increasingly more difficult to control the pressure with our sorptometer when very small increments in pressure are required. Perhaps other solutions should be sought after to determine the saturation values for relative pressures beyond 0.95. Techniques for capillary pressure measurement are possible candidates for this purpose.
Conclusions An automated sorptometer was tested and modified to measure water adsorption
isotherms on vapor-dominated geothermal reservoir rocks. Water adsorption/desorption tests were carried out on a number of reservoir rock samples including both core frag- ments and well cuttings. Surface areas of the rock samples were measured using nitrogen adsorption at 77K. The following conclusions can be reached from our study:
0 At low relative pressure, adsorption is the dominant process in retaining water onto the reservoir rocks. The presence of the adsorbed water promotes capillary
22

condensation, which becomes increasingly more important as relatively pressure goes up.
0 The amount of water adsorption depends on the type of geologic media and surface area is a crucial factor in determining the quantity adsorbed.
0 Water adsorption/desorption hysteresis exists on the rock samples investigated. While rock heterogenity and capillary condensation are the commonly recognized source of hysteresis, chemical interaction also contributes to the hysteresis partic- ularly at low pressures.
0 Temperature influences the amount of water adsorbed, and the effect was found to be sample dependent.
0 It has been shown that well cuttings can be used as substitutes for core samples for water adsorption studies.
0 Adsorption isotherms on different samples compare well for relative pressures below 0.8 when the comparison is based on unit surface area. The deviation at high relative pressures is due to the presence of capillary condensation. It is, thus, logical to suggest that surface area and porosity comprise the essential parameters in determining the capacity of a reservoir rock for water retention.
Acknowledgments The authors acknowledge the financial support from US Department of Energy,
Geothermal Division, Contract Number DGFG07-9OID12934. We thank Mr. Paul Pettit for help with the equipment.
References See references in Appendix I.
Shang, S.B., Horne, R.N. and Ramey, H.J., Measurement of Surface Area and Water Adsorption Capacity of the Geysers Rocks, 19th Workshop Geothermal Reservoir Engineering, January 18-20, 1994, St anford.
23

Appendix I This appendix contains the paper submitted to Geothermics.
24

Water Vapor Adsorption Geothermal Reservoir Rocks on
Shubo Shang, Roland N. Horne and Henry J. Ramey Jr. Petroleum Engineering Department Stanford University, CA 94305-2220
Abstract
The measurement of the amount of water retained in geothermal reservoir rocks allows a more realistic estimation of reserves for vapor-dominated geothermal reser- voirs. If the measured desorption isotherm resembles the production characteristics of a geothermal system, understanding of the adsorption/desorption hysteresis will aid the design of reinjection processes.
Adsorption/desorption isotherms of both nitrogen and water vapor on Berea sandstone and a rock sample from The Geysers well NEGU-17 were measured. Water vapor adsorption was measured at temperatures of 80,100, 120 and 13OOC. Some measurements were also conducted in the presence of added clay. Hysteresis was observed for both nitrogen and water adsorption. However, the behaviors differ in the two cases, indicating the presence of different mechanisms for nitrogen and water adsorption. The cause of the observed hysteresis for nitrogen is structural heterogeneity. For water, the situation is more complicated. Apart from structural heterogeneity, chemical interaction of water with the rock surface and changes in the structure of the rock during adsorption are possible sources of contribution to the observed hysteresis. Surface area of the two rock samples was determined from nitrogen adsorption isotherms. The Frenkel-Halsay-Hill (FHH) equation was found to fit the water adsorption isotherms reasonably well.
At low relative pressures, adsorption is the dominant process in water retention in the rock samples studied. At higher relative pressures, capillary condensation is more important. However, there is no clear distinction between adsorption and capillary condensation and the amount of water retention for the pressure range studied corresponds to low water saturation.
1

Introduction
In vapor-dominated geothermal reservoirs, it has been proposed that liquid might exist as adsorbed liquid in the micropores of the reservoir matrix (White, 1973). Evidence from both laboratory studies and field data indicated that storage of liquid as micropore fluid is likely (Ramey, 1990). Measurement of adsorption/desorption of water vapor on geothermal reservoir rocks is a crucial step in determining whether adsorption is the storage mechanism for these systems. If so, a better reserve estimation could be obtained based on the measured adsorption isotherms and their appropriate extrapolation. Since the desorption of water vapor from the rock surface resembles the production process of vapor dominated geothermal reservoirs, understanding of the adsorption/desorption phenomena provides insight into the production and ultimately will aid the planning of reinjection processes.
In this paper, we report measurements of water adsorption/desorption isotherms mea- sured for Berea sandstone and a rock sample from The Geysers geothermal well NEGU-17 using an automated sorptometer. Nitrogen adsorption/desorption isotherms of the two rock samples were also measured. Before discussing in detail the experimental results, a brief review of literature on adsorption studies and a summary of the characteristics of physical adsorption processes are given and the common isotherm equations are re- viewed. A description of the sorptometer and the experimental procedures will follow. Experimental results are presented and discussed, followed by the conclusions from this study.
Literature Review
Literature on water adsorption largely concerns pure adsorbents, with carbon and silica being the most common (Dubinin, 1980, Stoeckli, et al., 1983). Metal oxides have also been used for water adsorption studies (Gregg & Sing, 1982). The majority of these studies are associated with either understanding the fundamental mechanisms of water adsorption (Gregg & Sing, 1982, Furlong, et al. 1986, Stoeckli & Huguenin, 1992) or the characterization of porous material (Everett, 1988, Sing, 1991, Willems, et al., 1988). Another important aspect of water adsorption studies is related to soil science, and Parker has reviewed this aspect of the subject (Parker, 1986). A common feature of these studies is that the adsorption tests were all made at low temperatures (0 to 25°C) so that the
2

difficulty in maintaining high temperature and high pressure could be avoided. Water vapor desorption was regarded as a simple and reliable technique in core anal-
ysis by Melrose (1988). In a comprehensive study to determine capillary pressure data in the low-saturation region, Melrose (1991) compared results obtained using different techniques, and concluded that water vapor desorption methods yield capillary pressure data in good agreement with those obtained using the centrifuge and the porous plate methods. It should be pointed out, however, that the relative pressure range (0.9 to 0.99) used in Melrose’s work is high in comparison to other adsorption studies. The corresponding liquid saturation range is from 3 to 10% for the Berea sandstones studied. For low porosity geothermal rocks, the level of water saturation due to adsorption is probably higher than that for high porosity sandstones. However, the saturation level caused by adsorption should still be much less than 100%.
Reservoir related water adsorption studies have been limited, particularly at high temperatures. Hsieh (1980) constructed a BET type of apparatus for high temperature adsorption measurements. He conducted a number of adsorption measurements on Berea sandstone and unconsolidated silica sand. It was concluded that the characteristic ad- sorption curves for consolidated cores are temperature invariant and that adsorbed water may be an important source of steam in vapor-dominated geothermal reservoirs (Hsieh & Ramey, 1983). Luetkehans (1988) continued Hsieh’s work by improving the appara- tus. Measurements of water adsorption isotherms were made on Berea sandstone, cores from The Geysers, California, and from Larderello, Italy. However, the true magnitude of the amount adsorbed was in question due to difficulties in establishing equilibrium. In addition, the long equilibrium time required made the leakage of high temperature valves a significant factor in causing experimental error. Laboratory studies of water adsorption in porous media were also conducted by Herkelrath and his coworkers in asso- ciation with their work on steam flow in porous media (Herkelrath et al., 1983) and the disposal of nuclear waste (Herkelrath & O’Neal, 1985). They reported a higher level of adsorption, but otherwise findings similar to those of Hsieh and Ramey (1983). A 1’ inear isotherm appeared to fit data on Topopah Spring welded tuff up to a relative pressure of 0.9 (Herkelrath & O’Neal, 1985). The problem of leakage during the long equilibrium time was also identified.
Clearly, there was a need to improve on the apparatus for water adsorption tests at high temperatures. It was appealing to automate the adsorption experiments in the interest of both sparing the operator for other tasks and in reducing experimental error.
3

Harr (1991) performed preliminary investigations on the use of an automated sorptometer from Porous Materials, Inc. (PMI) for high temperature water adsorption measurements. To our knowledge, this is the first commercial sorptometer built for high temperature adsorption test. Considerable time was spent to investigate various problems associated with the sorptometer both by Harr (1991) and in the present study.
Fundamentals of Physical Adsorption
Physical adsorption is caused mainly by Van der Waals attractive forces, including the dispersion force. In addition, there will be electrostatic forces if either the adsorbent or the adsorbate is polar in nature. The process is similar to condensation of vapor molecules onto a liquid phase of the same composition. The major characteristics of physical adsorption can be summarised as follows (Satterfield, 1980, Ruthven, 1984):
0 Physical adsorption is an exothermic process so the amount of gas physically ad- sorbed at constant pressure always decreases monotonically as temperature is in- creased. The average heat of physical adsorption for the formation of a monolayer usually exceeds that of liquefaction, but seldom by more than a factor of about 2.
0 Physical adsorption requires no activation energy and therefore can occur nearly as fast as molecules strike a surface. The process is reversible and equilibrium is established very rapidly unless diffusion through a fine porous structure limits the process.
0 Adsorption/desorption hysteresis is caused by geometric effects in that the specific curvature in contact with the vapor at a specified relative pressure (pip") as vapor pressure is increased is different from that as the vapor pressure is decreased.
Adsorption on solid surfaces is a complicated phenomenon. Knowledge of the char- acteristics of the process is helpful in understanding experimental observations.
Adsorption Isotherms
An adsorption isotherm describes the equilibrium relationship between the partial pressure of the adsorbate and the amount adsorbed at constant temperature. The shape of the isotherm may vary substantially depending upon the nature of the adsorbent
4
I
IV V IV
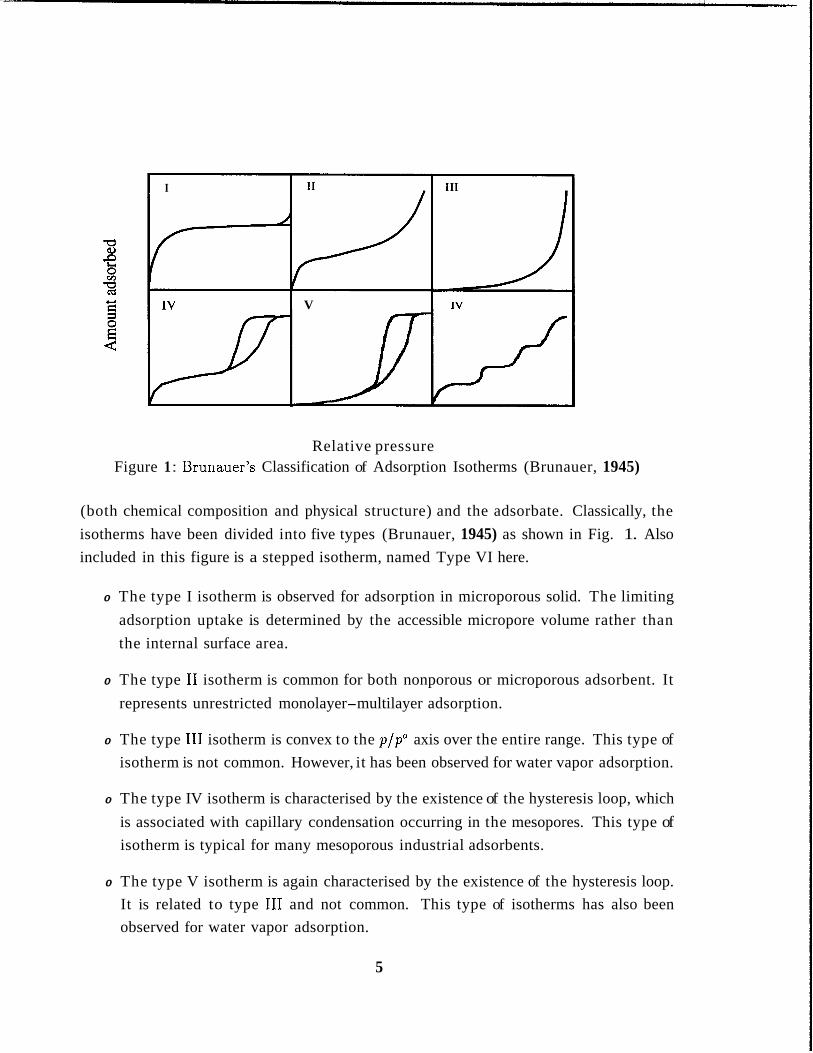
Relative pressure Figure 1 : Brunauer's Classification of Adsorption Isotherms (Brunauer, 1945)
(both chemical composition and physical structure) and the adsorbate. Classically, the isotherms have been divided into five types (Brunauer, 1945) as shown in Fig. 1. Also included in this figure is a stepped isotherm, named Type VI here.
0 The type I isotherm is observed for adsorption in microporous solid. The limiting adsorption uptake is determined by the accessible micropore volume rather than the internal surface area.
0 The type I1 isotherm is common for both nonporous or microporous adsorbent. It represents unrestricted monolayer-multilayer adsorption.
0 The type I11 isotherm is convex to the p /p" axis over the entire range. This type of isotherm is not common. However, it has been observed for water vapor adsorption.
0 The type IV isotherm is characterised by the existence of the hysteresis loop, which is associated with capillary condensation occurring in the mesopores. This type of isotherm is typical for many mesoporous industrial adsorbents.
0 The type V isotherm is again characterised by the existence of the hysteresis loop. It is related to type I11 and not common. This type of isotherms has also been observed for water vapor adsorption.
5

0 The type VI isotherm, also called the stepped isotherm, only occurs on ideal ad- sorbent.
Due to the hydrogen bonding propensity of the water molecule, water adsorption exhibits special behavior (Gregg & Sing, 1982). Chemical interaction with the solid surface is more likely to occur, especially at high temperatures. In general, types I11 and V isotherms are observed for water adsorption (Gregg & Sing, 1982). As shown in this paper, the adsorption isotherms of water on geothermal reservoir rocks measured in our laboratory follow a type I11 isotherm. Chemical interaction is believed to contribute, at least partially, to the large amount of hysteresis observed in this study.
Isotherm Equations
In order to model the measured isotherms, a number of isotherm equations have been developed over the years (Ruthven, 1984, Adamson, 1990). The following is a brief summary of those commonly used.
0 Linear isotherm-Henry's Law q = K p
where q is the amount adsorbed, p is the pressure of the adsorbate, and I( is Henry's law constant. The Henry's law isotherm applies for adsorption on uniform surfaces at sufficiently low pressures such that all molecules are isolated from their nearest neighbors.
0 Langmuir isotherm
where 8 is fractional surface coverage, qm is the amount adsorbed at monolayer cov- erage, and K is the adsorption equilibrium constant. Strictly speaking, the Lang- muir isotherm applies only to monolayer adsorption on uniform surfaces (Adamson, 1990). However, it has been successfully used to describe adsorption in microporous solids (Type I isotherm, Gregg & Sing, 1982).
6
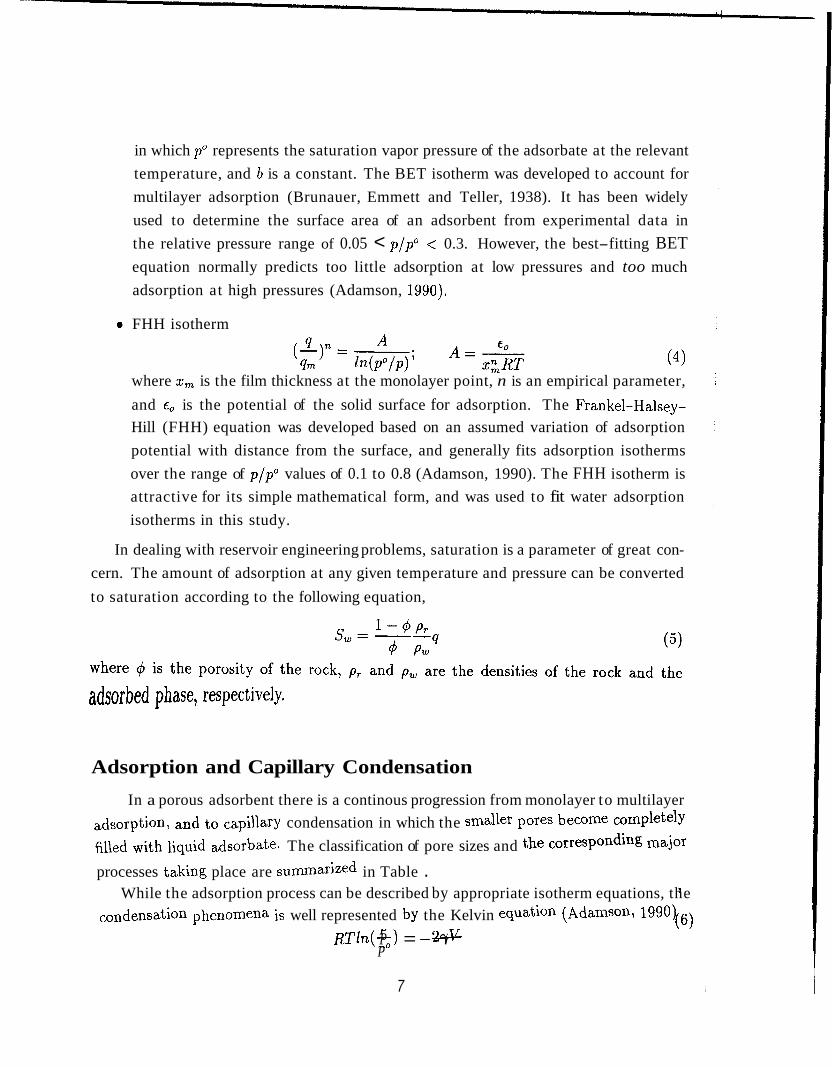
in which p" represents the saturation vapor pressure of the adsorbate at the relevant temperature, and b is a constant. The BET isotherm was developed to account for multilayer adsorption (Brunauer, Emmett and Teller, 1938). It has been widely used to determine the surface area of an adsorbent from experimental data in the relative pressure range of 0.05 < p/p" < 0.3. However, the best-fitting BET equation normally predicts too little adsorption at low pressures and too much adsorption at high pressures (Adamson, 1990).
0 FHH isotherm
where x m is the film thickness at the monolayer point, n is an empirical parameter, and is the potential of the solid surface for adsorption. The Frankel-Halsey- Hill (FHH) equation was developed based on an assumed variation of adsorption potential with distance from the surface, and generally fits adsorption isotherms over the range of p/p" values of 0.1 to 0.8 (Adamson, 1990). The FHH isotherm is attractive for its simple mathematical form, and was used to fit water adsorption isotherms in this study.
In dealing with reservoir engineering problems, saturation is a parameter of great con- cern. The amount of adsorption at any given temperature and pressure can be converted to saturation according to the following equation,
Adsorption and Capillary Condensation
In a porous adsorbent there is a continous progression from monolayer to multilayer adsorption, and to capillary condensation in which the smaller pores become ComPletelY filled with liquid adsorbate. The classification of pore sizes and the CorresPonding major
processes taking place are summarized in Table . While the adsorption process can be described by appropriate isotherm equations, the
condensation phenomena is well represented by the Kelvin equation (Adamson, 1990) RTln(--) P = -- 27v r
(6)
P
7

Table 1: IUPAC Classification of Pores (Everett, 1972)
Pore width Major processes occuring Micropore Less than 20 8, Monolayer adsorption and volume filling Mesopore Macropore Larger than 500 8, Multilayer adsorption
Between 20 and 500 8, Multilayer adsorption and capillary condensation
where y is the interfacial tension between liquid and its vapor, V the molar volume of the liquid adsorbate, and r the effective radius of the pore. It should be noticed that the geometric radius of a pore is the sum of the Kelvin radius (the effective radius in the Kelvin equation) and the thickness of the adsorbed layer at the surface of the pore. The generally recognized validity of the Kelvin equation is in the range of mesopore size (pore radius between 10 to 250 A). However, adsorption in micropores (radius not exceeding 10 A) cannot be readily treated as a capillary condensation phenomena. What happens physically is that as multilayer adsorption develops, the micropores become filled by the meeting of the adsorbed film from opposing walls. A characteristic feature of micropore adsorption is high uptake of adsorbent at low relative pressure due to the presence of strong force fields.
The application of the Kelvin equation to describe capillary condensation requires knowledge of pore size or pore size distribution of the porous material. It is difficult, if not impossible, to determine the pore size distribution of geothermal reservoir rocks due to the very low porosity. In this study, we are primarily concerned with adsorption in the pressure range used in our experiments (relative pressures up to 0.95). At high relative pressures, capillary condensation becomes increasingly import ant as indicated by the sharp vertical increase in the isotherm. This occurs at relative pressures around 0.8 for most of the samples tested. The process goes through a transition before capillary condensation dominates. To model the adsorption isotherms properly, a model combining an isotherm equation with the Kelvin equation should serve the purpose. For simplicity and due to the lack of pore size distribution data, only the multilayer adsorption isotherm equation (FHH), is used to fit the measured isotherms.
8

Vacuum Pump I
Temperature -n
Sample Holder
Key: N for needle valves V for solenoid valves P for pressure gauge Pv for vacuum gauge
Figure 2: A Schematic of the PMI Sorptometer
Apparatus and Procedures
A schematic of the sorptometer used in this study is shown in Fig. 2. It consists of three parts: (1) a set of valves and pressure transducers kept in a high temperature chamber to avoid water condensation, (2) a sample chamber for loading and unloading the samples, and (3) the electronics for automatic control. The sample chamber has a separate heating system so that the samples can be heated at temperatures higher than the test temperature. During normal operation, the operator only needs to load the sample and the rest of the procedures are accomplished under computer control.
The principle of the adsorption/desorption measurement is the same as a BET type experiment. The quantities measured are the pressures of water vapor in the sys- tem before and after adsorption/desorption. System volumes are predetermined by ex- panding nitrogen gas and measuring the corresponding pressures. The quantities ad- sorbed/desorbed were calculated from mass balance.
Due to the limitation of the sample holder size, rock samples had to be broken into
9

granulars with equivalent diameters less than 8 mm. This should not impose any problem since the only change caused by breaking the core is surface area and the change is likely to be small. It was found to have negligible effect on the amount of water adsorbed (Harr, 1991). On the other hand, using small size samples reduces diffusional time and the time required for adsorption/desorption equilibrium. New samples were all heated at 180°C under vacuum overnight to get rid of any surface residuals before running the adsorption test. Upon adsorption, water vapor is added incrementally to the system from a steam reservoir kept in the high temperature chamber. Sufficient time was allowed for the system to reach equilibrium. Desorption commences at the end of the adsorption test. In this case, water vapor is gradually pumped away until the adsorbed water is completely desorbed. Knowing the complexity of the adsorption process, it is important to ensure that the rock surface has the same condition prior to each adsorption test. This was achieved by heating the sample at a temperature 50°C higher than the test temperature under vacuum for 2 to 4 hours. Reproducible isotherms were obtained after this pretreatment.
Results and Discussion
Nitrogen Adsorption
Figs 3 and 4 show the adsorption/desorption isotherms of nitrogen measured at liquid nitrogen temperature (77K) on Berea sandstone and a sample from The Geysers geothermal well NEGU-17. These plots show the amount of nitrogen adsorbed in mg/g rock at a range of relative pressures. Both isotherms fit type I11 of the Brunauer classifi- cation. They resemble closely those reported by Melrose (1991) on Berea sandstone and producing-reservoir sandstone. Both samples exhibit adsorption/desorption hysteresis. It is interesting to note that the hysteresis loop ends at a relative pressure of around 0.45 in both cases although The Geysers rock has smaller amount of hysteresis than Berea sandstone. This kind of observation was reported for nitrogen adsorption at 77K on other materials and was regarded as characteristic of nitrogen at that particular temperature (Gregg & Sing 1982). The presence of hysteresis suggests that the rock samples are heterogeneous in structure and that capillary condensation takes place at certain rela- tive pressures. A network effect is another possible reason for the observed hysteresis. Discussion of this effect is beyond the scope of this study, and is available in published
10
4
A - Adsorption II
E Y 3 1
e $
s * 1
Desorption ....... * ....... s U Q
U m
m 2 c .- c 0
3
.c
E 1 1
a .... _... E
- -
0 . . . . . . . . . . . . . . . . . . . . . . . . . . . . . . . . . . . . . .
- -
0.0 0.2 0.4 0.6 0.8 1 .o Relative pressure
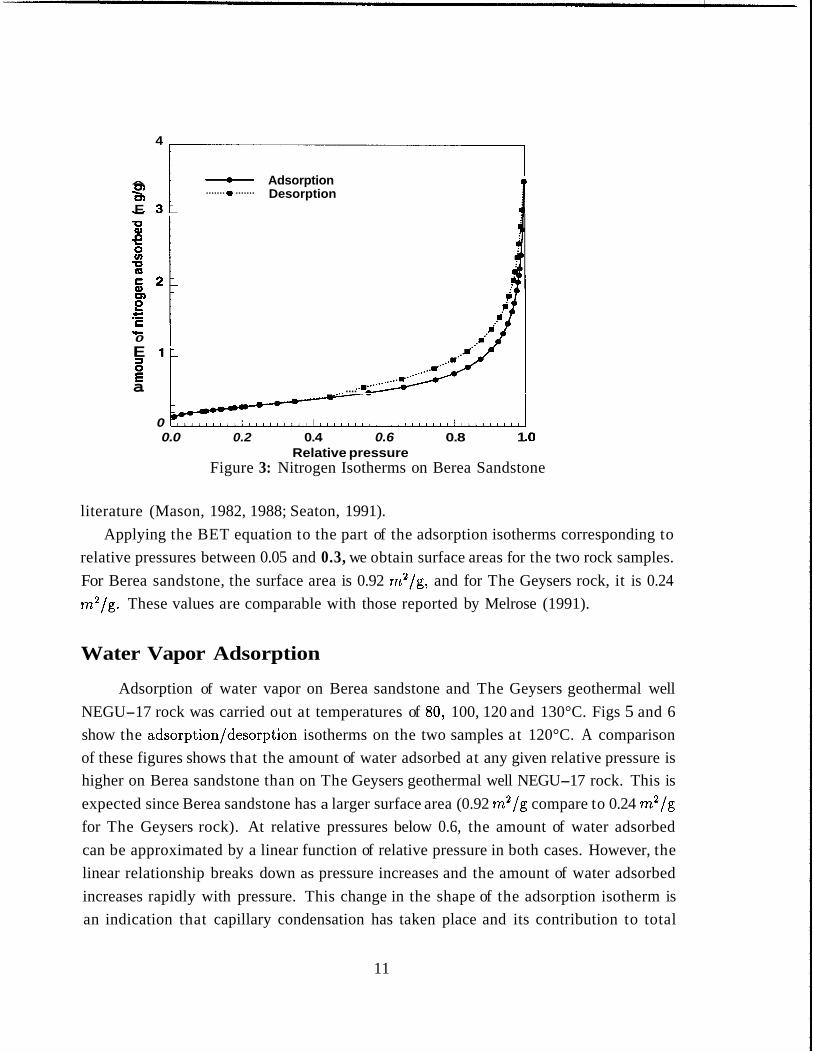
Figure 3: Nitrogen Isotherms on Berea Sandstone
literature (Mason, 1982, 1988; Seaton, 1991). Applying the BET equation to the part of the adsorption isotherms corresponding to
relative pressures between 0.05 and 0.3, we obtain surface areas for the two rock samples. For Berea sandstone, the surface area is 0.92 m2/g, and for The Geysers rock, it is 0.24 m2/g. These values are comparable with those reported by Melrose (1991).
Water Vapor Adsorption
Adsorption of water vapor on Berea sandstone and The Geysers geothermal well NEGU-17 rock was carried out at temperatures of 80, 100, 120 and 130°C. Figs 5 and 6 show the adsorption/desorption isotherms on the two samples at 120°C. A comparison of these figures shows that the amount of water adsorbed at any given relative pressure is higher on Berea sandstone than on The Geysers geothermal well NEGU-17 rock. This is expected since Berea sandstone has a larger surface area (0.92 m2/g compare to 0.24 m2/g for The Geysers rock). At relative pressures below 0.6, the amount of water adsorbed can be approximated by a linear function of relative pressure in both cases. However, the linear relationship breaks down as pressure increases and the amount of water adsorbed increases rapidly with pressure. This change in the shape of the adsorption isotherm is an indication that capillary condensation has taken place and its contribution to total
11
c al m E C .- E r 0
2-o i 1.5
1 .o
0.5
0.0 0.0 0.2 0.4 0.6 0.8 1 .o
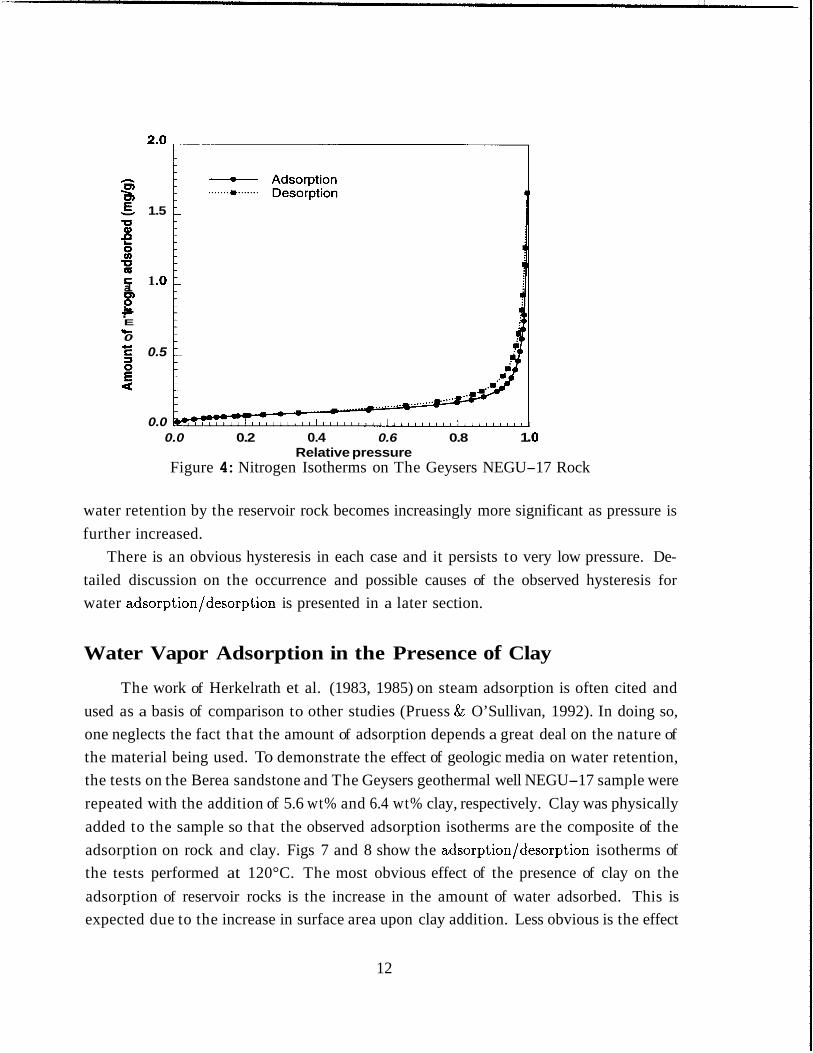
Relative pressure Figure 4: Nitrogen Isotherms on The Geysers NEGU-17 Rock
water retention by the reservoir rock becomes increasingly more significant as pressure is further increased.
There is an obvious hysteresis in each case and it persists to very low pressure. De- tailed discussion on the occurrence and possible causes of the observed hysteresis for water adsorption/desorption is presented in a later section.
Water Vapor Adsorption in the Presence of Clay
The work of Herkelrath et al. (1983, 1985) on steam adsorption is often cited and used as a basis of comparison to other studies (Pruess & O’Sullivan, 1992). In doing so, one neglects the fact that the amount of adsorption depends a great deal on the nature of the material being used. To demonstrate the effect of geologic media on water retention, the tests on the Berea sandstone and The Geysers geothermal well NEGU-17 sample were repeated with the addition of 5.6 wt% and 6.4 wt% clay, respectively. Clay was physically added to the sample so that the observed adsorption isotherms are the composite of the adsorption on rock and clay. Figs 7 and 8 show the adsorption/desorption isotherms of the tests performed at 120°C. The most obvious effect of the presence of clay on the adsorption of reservoir rocks is the increase in the amount of water adsorbed. This is expected due to the increase in surface area upon clay addition. Less obvious is the effect
12

3.
- - Adsorption ...... * ..... Desorption
0.0 0.2 0.4 0.6 0.8 1 .o Relative pressure
Figure 5: Water Isotherms on Berea Sandstone at 120°C
1 .o
0.5
0.0 0.0 0.2 0.4 0.6 0.8 1 .o
Relative pressure Figure 6: Water Isotherms on The Geysers Rock at 120°C
13

6
A
k
z s
E v
3 4
cn U 0
%
6 2
c
C c 3
U
0 0.0 0.2 0.4 0.6 0.8 1 .o
Relative pressure Figure 7: Isotherms on Berea Sandstone with Clay Addition at 120°C
of clay on hysteresis, particularly at relative pressures below 0.6. The results of these tests explain the significant differences in the amounts of water retention measured by Herkelrath et al. (1983) and those measured in our laboratory (Hsieh & Ramey, 1983, Shang et al. 1993), since Herkelrath et al. used consolidated sand with silt (26 wt%) and clay (7 wt%) while the other studies used sand, sandstone or reservoir rocks only.
Hysteresis and Capillary Condensation
In a porous material, adsorption and capillary condensation are two closely related processes, i.e. they both cause the vapor to condense onto the solid. They are related in such a way that adsorption provides a precursor for capillary condensation. The physical processes of adsorption in porous materials can be divided into three steps: (1) submonolayer adsorption, (2) multilayer adsorption with transition to (3) capillary condensation. The pressure range at which the transition from multilayer adsorption to capillary condensation occurs depends on the structure of the material. If the material is microporous, the pore space will be filled up (commonly termed as volume filling) before multilayer adsorption is developed. In larger pores, multilayers of adsorbed water form as pressure increases. At a certain pressure, capillary condensation commences in the small pores. As the pressure is progressively increased, wider and wider pores are filled
14

5
I - Adsorption Desorption ...... * .....
i-I c E 2
0 0.0 0.2 0.4 0.6 0.8 1 .o
Relative pressure Figure 8: Isotherms on Geysers Rock with Clay Addition at 120°C
while multilayer adsorption is simultaneously taking place. In reservoir rocks, there exist pores of different sizes and shapes and it is difficult to determine the pressure at which capillary condensation begins to take place.
hysteresis. As mentioned previously, the presence of nitrogen adsorption hysteresis indi- cates the heterogeneous nature of the rock samples and the presence of capillary conden- sation. Since the hysteresis loops all close at a relative pressure of about 0.45, chemical effect can be excluded. However, for water adsorption, such effect cannot be ignored. Weak chemisorption of water onto cement pastes at room temperature was reported by Willems et al. (1988). Chemisorption, which is not completely reversible, results in hysteresis. Since chemisorption requires activation energy, the extent to which such pro- cess occurs increases with temperature. At the temperatures employed in this study, chemical interaction of water molecules with the rock surface is inevitably present. In principle, chemical interaction is restricted to the monolayer. However, in reality, the chemisorbed fraction induces interaction in subsequent layers. The very high polarity of water molecules and the tendency for hydrogen bonding makes it easier to form big clusters. As a consequence, physical adsorption of water is enhanced. This implies that desorption of water from the surface may not be as easy as adsorption onto the surface, so adsorption/desorption hysteresis exists and persists to very low pressure. Capillary
The measured adsorption/desorption isotherms, with and without clay addition, showed
15

condensation, as indicated by the rapid changes in the shape of the adsorption isotherms at relative pressures beyond 0.8, and structural heterogenity certainly contribute to the observed hysteresis.
Effect of Temperature on Water Adsorption
Figs 9 and 10 show comparisons of water adsorption isotherms at different tempera- tures for Berea sandstone and The Geysers geothermal well NEGU-17 core respectively. Temperature appears to have similar influence on the two rock samples. At low rela- tive pressure, changes in the amount of water adsorbed with temperature is small. As relative pressure increases, the effect of temperature on water adsorption becomes more appreciable.
As explained in the previous section on adsorption/desorption hysteresis, chemical interaction of water molecules with the rock surface is very likely present under the conditions used in our experiments. Due to the energy requirement of the chemical interaction, the extent to which it occurs increases with increase in temperature. As a consequent, the total amount of water retention in the rocks increases. Another possible source of contribution to the observed temperature effect is the possible presence of salts in the rock. Salinity has long been considered as a possible cause of vapor pressure lowering in vapor dominated geothermal systems. We believe it is reasonable to assume that if there are minerals present in the rock they will dissolve in the adsorbed liquid and have their appropriate effects on the system. It should be noticed that the solubilities of salts increase with temperature, and so should their effects on vapor pressure. This may in turn influence the amount of water retained at different temperatures, particularly at high relative pressures.
Isotherm Fitting Using FHH Equation
The Frankel-Halsey-Hill (FHH) equation (Eqn.4) can be simplified into a two pa- rameters correlation for the purpose of fitting adsorption isotherms as follows,
where n is the empirical constant and B is a lumped parameter. This correlation was used to fit the measured adsorption isotherms for Berea sandstone and The Geysers well NEGU-17 rock at 120°C. The parameter values obtained from the linear regression are
16

3. - T=80°C + ...... .....
T = 100°C ;t * T = 12OOC A ---&-- I -+- T=130°C I
Y ? f
0.0 0.2 0.4 0.6 0.8 1 .o Relative pressure
Figure 9: Comparison of Adsorption Isotherms on Berea Sandstone
1.5 - T=80°C * T = 100°C
---A T = 12OOC +--. T=130°C
....... ....... n s 1 l - O 1 E
8
Za E 's 0.5 1 a
Y
u) U Q
Q U
U E
E a 0.0
0.0 0.2 0.4 0.6 0.8 1 .o Relative pressure
Figure 10: Comparison of Adsorption Isotherms on Geysers Rock
17

1 - Experiment FHH Equation ....... * .......
Y
=
= i
U 0 )
g g 2 cn U
c 0
0
c 0
B .c
c
3 1 E a
0
L
0.0 0.2 0.4 0.6 0.8 1 .o Relative pressure
Figure 11: Measured and Fitted Adsorption Isotherms on Berea Sandstone
n=1.4, B=2.6 for Berea sandstone, and n=l . l , B=0.09 for The Geysers rock, respec- tively. Figs 11 and 12 show the measured and fitted isotherms for the two rock samples respectively. As shown in the plots, the overall fit for both cases are reasonably good.
Water Adsorption and Saturation
The amount of adsorption at any given temperature and pressure can be converted to saturation using Eqn.5. Fig. 13 shows the saturation-pressure relation of the adsorption isotherm displayed in Fig. 6. The saturation levels were calculated from the amount of water adsorbed using a rock density of 2.7 g/cm3 and the bulk water density of 0.943 9/c7n3. The major uncertainty is porosity, which is difficult to measure accurately for very low porosity rocks. Gunderson (1991) conducted a series of porosity measurement for The Geysers graywacke and reported porosity values in the range of 1.1 to 5.6% for core samples from the Geyser geothermal well NEGU-17. The measured porosity was found to be core size dependent, with bigger cores yielding higher porosity. The variations in porosity with sample size suggest the presence of a heterogenerous distribution of small fractures in the cores. A porosity of 0.6% was determined from nitrogen adsorption isotherm for core fragments from well NEGU-17, in reasonable agreement with those reported by Gunderson (1991). Since the samples used in our experiments are small
18

h s E
e 5:
?c L
v
1.0
U m c
b 0.5 c E 3
a
0.0
- Experiment
J FHH Equation ....... * ....... i
0.0 0.2 0.4 0.6 0.8 1 .o Relative pressure
Figure 12: Measured and Fitted Adsorption Isotherms on Geysers Rock
grannulars, porosity values should be low and close to the true matrix porosities. The value of 0.6% was used in our calculation.
The saturation-pressure curve shows clearly that adsorption accounts for low satura- tion, roughly 20% at a relative pressure of 0.8 if capillary condensation, unlikely being significant, is ignored. At low levels of water saturation, the water exists in the pore space as surface water, forming a thin film on the surface of the rock. However, the presence of the adsorbed water film reduces the effective size of the pores so that capillary condensa- tion occurs at lower relative pressures than it would otherwise. The fact that there is no appreciable capillary condensation at relative pressures below 0.85 suggests that the frac- tion of pores with diameters less than 100 A(see Appendix A) is small. This is in broad agreement with the analysis from nitrogen adsorption data. As shown in Fig. 13, with a change of relative pressure from 0.88 to 0.93, water saturation went from 28% to 6l%, indicating that capillary condensation is a dominant process at these pressures. Further increase in pressure will undoubtedly result in a more dramatic increase in saturation. However, it becomes increasingly difficult to control the pressure with our sorptometer when very small increments in pressure are required. Perhaps other solutions should be sought to determine the saturation values for relative pressures beyond 0.95.
19
100
- T=120°C
i 0.0 0.2 0.4 0.6 0.8 1.0
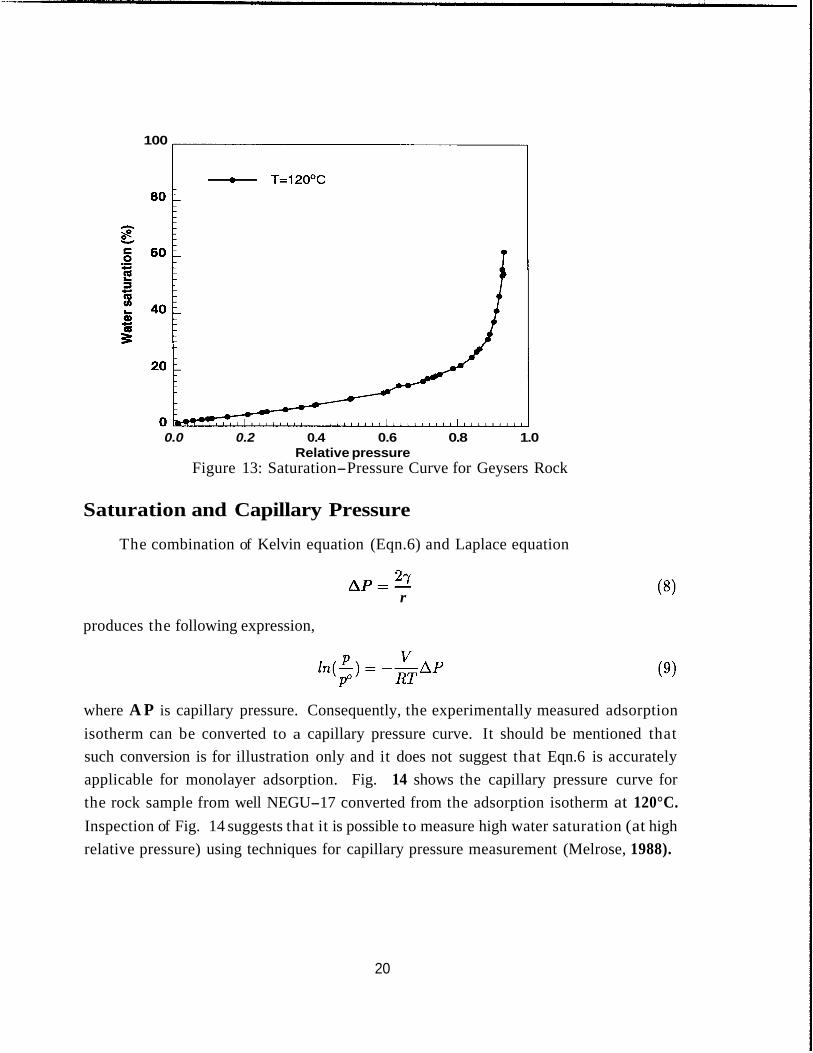
Relative pressure Figure 13: Saturation-Pressure Curve for Geysers Rock
Saturation and Capillary Pressure
The combination of Kelvin equation (Eqn.6) and Laplace equation
27 A P = - r
produces the following expression,
where A P is capillary pressure. Consequently, the experimentally measured adsorption isotherm can be converted to a capillary pressure curve. It should be mentioned that such conversion is for illustration only and it does not suggest that Eqn.6 is accurately applicable for monolayer adsorption. Fig. 14 shows the capillary pressure curve for the rock sample from well NEGU-17 converted from the adsorption isotherm at 120°C. Inspection of Fig. 14 suggests that it is possible to measure high water saturation (at high relative pressure) using techniques for capillary pressure measurement (Melrose, 1988).
20

t 3000
n
0 E C
Y 5 2000 u) E 2 (II - - .- B 1000 0
0 0 20 40 60 80 100
Saturation (YO) Figure 14: Capillary Pressure Curve for Geysers Rock
Conclusions
Adsorption is important in vapor-dominated geothermal reservoirs, not only in itself but also in inducing capillary condensation. It is logical to suggest that the system is adsorption dominated at lower relative pressures, and changes to capillary condensation dominated as the relative pressure approach unity. Both adsorption and capillarity cause vapor pressure lowering.
Hysteresis exists for both nitrogen and water adsorption/desorption on Berea sand- stone and The Geysers geothermal well NEGU-17 rock. While capillary condensation and rock heterogenity are the cause of hysteresis for nitrogen, chemical interaction con- tributes to the considerable hysteresis for water adsorption.
The amount of adsorption depends on the type of geologic medium and the surface area of the media is a crucial factor in determining the quantity adsorbed. The amount of adsorption is also affected by temperature in such a way that for a given relative pressure the amount adsorbed increases as temperature increases.
It has been shown that the FHH equation in its empirical form fits the measured adsorption isotherms reasonably well. The analysis of the measured data indicates that the amount of water adsorbed corresponds to low water saturation. Accurate measure- ment of water retention at relative pressures beyond 0.95 is difficult to achieve with our
21

sorptometer, but it is possible that techniques used for capillary pressure measurement may prove useful.
Acknowledgments
The authors acknowledge the financial support from US Department of Energy, Geothermal Division, Contract Number DE-FG07-90ID12934. We thank Mr. Paul Pettit for help in the face of hardware problems.
Appendix A
The effective pore radius at which capillary condensation takes place is calculated from the Kelvin equation,
However, the actual pore radius must be larger than the effective one due to the presence of the adsorbed film at the surface having thickness t . So the critical radius of the pore is
r, = r k + t (11)
The value of t as a function of p /p" has been estimated using nitrogen adsorption, and the values of t were found to be essentially independent of the chemical nature of the adsorbent for most systems at coverages greater than a monolayer (Satterfield, 1980). Taking the values o f t from Gregg & Sing (1982) for nitrogen, and the appropriate V and y values for water at 120"C, the radius of pore at different values of p / p " are estimated and summarised in Table .
Nomenclat ure
A B b K = adsorption equilibrium constant n
= empirical parameter in FHH equation = lumped parameter in simplified FHH equation = constant in BET equation
= emperical parameter in FHH equation
22

Table 2: Values of Pore Radius at Different p / p "
P T
Pw
0.5 9.3 5.9 15.2 0.6 12.6 6.5 19.1 0.7 18.0 7.4 25.4 0.8 28.8 8.6 37.4 0.9 61.0 12.7 73.8
= pressure = saturation pressure = amount adsorbed [mg/g] = amount adsorbed at monolayer coverage [rng/g] = gas constant = critical pore radius [A] = Kelvin pore radium [A] = water saturation = temperature [ K ] = thickness of adsorbed film [A] = molar volume [m3/moZ] = interfacial tension [ N / m ] = potential of the solid surface for adsorption = fractional surface coverage = density of rock [g/cm3] = density of water [g/cm3]
References
Adamson, A.W. (1990) Physical Chemistry of Surfaces, Wiley.
Baily, A., Cadenhead, D.A., Davis, D.H., Everett, D.H. and Miles, A.J. (1971) Low Pressure Hysteresis in the Adsorption of Organic Vapors by Porous Carbons. Trans.
23

Faraday SOC. 67, pp. 231-243.
Brunauer, S. (1945) The Adsorption of Gases and VaporsVol. 1, Princeton University Press, Princeton, NJ.
Brunauer, S., Emmett, P.H. and Teller, E. (1938) Adsorption of Gases in Multimolec- ular Layers. J. Am. Chem. SOC. 60, pp. 309-319.
Carrott, P.J.M., Kenny, M.B., Roberts, R.A., Sing, K.S.W. and Theocharis, C.R. (1991) The Adsorption of Water Vapor by Microporous Solids. Characterisation of Porous Solids 11, F. Rodriguez-Reinoso et al. (Editors), pp.685-692. Elsevier Science Publishers.
Dubinin, M.M. (1980) Water Vapor Adsorption and the Microporous Structures of Carbonaceous Adsorbents. Carbon, 18, pp. 355-364.
Everett, D.H. (1972) IUPAC Manual of Symbols and Terminology for Physicochemical Quantities and Units, Appendix 11, Part I. Pure 6 Appl. Chem. 31, pp. 584-594.
Everett, D.H. (1988) Pore Systems and Their Characteristics. Characterisation of Porous Solids, K.K. Unger et al. (Editors), pp.9-22. Elsevier Science Publishers.
Furlong, D.N., Sing, K.S.W. and Parfitt, G.D. (1986) Adsorption of Water Vapor on Rutile and Silica-Coated Rutile. Adsorptin Sci. 6 Tech. 3, pp. 25-32.
Gregg, S.J. and Sing, K.S.W. (1982) Adsorption, Surface Area and Porosity, Academic Press.
Gunderson, R.P. (1991) Porosity of Reservoir Graywacke at The Geysers. Geothermal Research Council, Monograph on The Geysers Geothermal Field, Special Report NO. 17, pp. 89-93.
Halsey, G.D., Jr. (1951) A New Multilayer Isotherm Equation with Reference to Surface Area. J. Am. Chem. SOC. 73, pp. 2693-2696.
Halsey, G.D., Jr. (1952) On Multilayer Adsorption. J. Am. Chem. SOC. 74, pp. 1082-1083.
Harr, M.S. (1991) Laboratory Measurement of Sorption in Porous Media, MS report, Stanford University.
24

Herkelrath, W.N., Moench, A.F. and O’Neal 11, C.F. (1983) Laboratory Investigation of Steam Flow in a Porous Medium. Water Resource Research, 19(4), pp. 931-937.
Herkelrath, W.N. and O’Neal 11, C.F (1985) Water Vapor Adsorption in Low-Permeability Rocks. International Association of Hydrogeologists, (ed.) Memories Vol. XVII, Part I, pp. 248-253.
Hsieh, Chih-Hang (1980) Vapor Pressure Lowering in Porous Media, PhD Thesis, Stanford University.
Hsieh, Chih-Hang and Ramey, H.J., Jr. (1983) Vapor-Pressure Lowering in Geother- mal Systems. SPEJ, 23(1), pp. 157-167.
Leutkehans, J. (1988) A Laboratory Investigation of Steam Adsorption in Geothermal Reservoir Rocks, MS report, Stanford University.
Mason, G. (1982) The Effect of Pore Space Connectivity on the Hysteresis of Capillary Condensation/Desorption Isotherms. J. Colloid Interface Sci. 88, pp. 36-46.
Mason, G. (1988) Porous Materials and Percolation Theory. Characterisation of Porous Solids, K.U. Unger et al. (Editors), pp. 323-332. Elsevier Science Publish- ers.
Melrose, J.C. (1988) Use of Water-Vapor Desorption Data in the Determination of Capillary Pressures at Low Water saturations. SPE Reservoir Engineering, pp. 91 3-1 8.
Melrose, J.C., Dixon, J.R. and Mallinson, J.E. (1991) Comparison of Different Tech- niques for Obtaining Capillary Pressure Data in the Low-Saturation Region. paper SPE 22690, presented at the 66th SPE Annual Technical Conference and Ezhibi- tion, Dallas, TX.
Parker, J.C. (1986) Hydrostatics of Water in Porous Media. Soil Physical Chemistry, D.L. Sparks (Editor). CRC Press.
Pruess, K. and O’Sullivan, M. (1992) Effects of Capillarity and Vapor Adsorption in the Depletion of Vapor-Dominated Geothermal Reservoirs. Proc. 17th Workshop on Geothermal Reservoir Eng., Stanford University.
25
Ramey, H.J., Jr. (1990) Adsorption in Vapor-Dominated Systems. Geothermal Pro- gram Review VUI, San Francisco, CA.
Ruthven, D.M. (1984) Principles of Adsorption and Adsorption Processes, New York, Wiley.
Satterfield, C.N. (1980) Heterogeneous Catalysis in Practice, McGraw-Hill Book Com-
pany.
Seaton, N.A. (1991) Determination of the Connectivity of Porous Solids from Nitrogen Sorption Measurements. Chem. Eng. Sci. 46(8), pp. 1895-1909.
Simonot-Grange, M.H., Elm’chaouri, A., Nafis, M., Dufresne, P, Raatz, F. and Joly J.F. (1991) Study of the Pore Network of Dealuminated Faujasites by Water Va- por Adsorption. Characterisation of Porous Solids 11, F. Rodriguez-Reinoso et al. (Editors), pp. 567-574. Elsevier Science Publishers.
Sing, K.S.W. (1991) Characterisation of Porous Solids: An Introductory Survey. Char- acterisation of Porous Solids 11, F. Rodriguez-Reinoso et al. (Editors), pp. 1-10. Elsevier Science Publishers.
Stoeckli, F.H. and Huguenin, D. (1992) Water Adsorption in Active Carbon Charac- terized by Adsorption and Immersion Techniques. J. Chem. SOC. Faraday Trans. 88(5), pp. 737-740.
Stoeckli, H.F., Kraehenbuehl, F. and Morel, D. (1983) The Adsorption of Water by Active Carbons in Relation to the Enthalpy of Emmersion. Carbon, 21(6), pp. 589-591.
Willems, H.H., Massen, C.H., Hardon, J.J., Poulis, J.A. and Robens, E. (1988) In- vestigation of the Micro-structure of Hardened Cement Pastes. Characterisation of Porous Solids, K.K. Unger et at. (Editors), pp. 581-588. Elsevier Science Publishers.
White, D.E. (1973) Characteristics of Geothermal Resources. Kruger and Otte (Editors) Ch.4, p. 69. Stanford Press.
Geothermal Energy,
26