
Experimental study of UTM-LST generic half model transport ...
8
Experimental study of UTM-LST generic half model transport aircraft M I Ujang, S Mat*, K Perumal and M N Mohd. Nasir Faculty of Mechanical Engineering, Universiti Teknologi Malaysia, Malaysia. *[email protected] Abstract. This paper presents the experimental results from the investigation carried out at the UTM Low Speed wind tunnel facility (UTM-LST) on a half model generic transport aircraft at several configurations of primary control surfaces (flap, aileron and elevator). The objective is to measure the aerodynamic forces and moments due to the configuration changes. The study is carried out at two different speeds of 26.1 m/s and 43.1 m/s at corresponding Reynolds number of 1 x 10 6 and 2 x 10 6 , respectively. Angle of attack of the model is varied between -2 o to 20 o . For the flaps, the deflection applied is 0 o , 5 o and 10 o . Meanwhile, for aileron and elevator, the deflection applied is between -10 o and 10 o . The results show the differences in aerodynamic characteristics of the aircraft at different control surfaces configurations. The results obtained indicate that a laminar separation bubble developed on the surface of the wing at lower angles of attack and show that the separation process is delayed when the Reynolds number is increased. 1. Introduction Semi-span aircraft model consists of only half of the complete wing or tail of an aircraft. As an aircraft is a symmetric vehicle, investigation using a semi span half model is acceptable since the effect will be similar on the other side of the wing during straight and level longitudinal flight conditions. In general, most wind tunnel testing research requires that the correct flight conditions is simulated and the most accurate data is obtained. These issues are important in order to develop the accurate performance characteristics, especially at low-speed flight conditions such as takeoff, approach and landing that are usually encountered by subsonic transport aircraft. Typically, the Reynolds numbers achievable at the speed appropriate for takeoff and approach conditions in the available testing facilities are below the desired full-scale Reynolds number [1-3]. The need to extend Reynolds number testing capabilities up to full-scale conditions can be satisfied with the development of a semi-span testing capability. A semi-span model testing offers few advantages over full span testing. By fabricating a semi-span model, a larger and more detailed design can be used. Due to the larger model size provided by semi- span testing, not only is the desired increased Reynolds number testing capability is produced, but the larger model size also improves data quality due to improved model strength, stiffness and overall fidelity. Constructing only half the model yields further benefits in terms of reduced model's cost. The complex high-lift systems and controls will only need to be produced for one wing. Another advantage of semi-span testing is that it only requires simple mounting on the balance and turntable. One of the disadvantages of semi-span testing is the wind tunnel's wall interference effects due to the model size. In this study, the model is fabricated and mounted on a splitter plate, which is offset from the tunnel AEROTECH VI - Innovation in Aerospace Engineering and Technology IOP Publishing IOP Conf. Series: Materials Science and Engineering 152 (2016) 012007 doi:10.1088/1757-899X/152/1/012007 Content from this work may be used under the terms of the Creative Commons Attribution 3.0 licence. Any further distribution of this work must maintain attribution to the author(s) and the title of the work, journal citation and DOI. Published under licence by IOP Publishing Ltd 1
Transcript of Experimental study of UTM-LST generic half model transport ...

Experimental study of UTM-LST generic half model
transport aircraft
M I Ujang, S Mat*, K Perumal and M N Mohd. Nasir
Faculty of Mechanical Engineering, Universiti Teknologi Malaysia, Malaysia.
Abstract. This paper presents the experimental results from the investigation carried
out at the UTM Low Speed wind tunnel facility (UTM-LST) on a half model generic
transport aircraft at several configurations of primary control surfaces (flap, aileron
and elevator). The objective is to measure the aerodynamic forces and moments due to
the configuration changes. The study is carried out at two different speeds of 26.1 m/s
and 43.1 m/s at corresponding Reynolds number of 1 x 10⁶ and 2 x 10⁶, respectively.
Angle of attack of the model is varied between -2o to 20o. For the flaps, the deflection
applied is 0o, 5o and 10o. Meanwhile, for aileron and elevator, the deflection applied is
between -10o and 10o. The results show the differences in aerodynamic characteristics
of the aircraft at different control surfaces configurations. The results obtained indicate
that a laminar separation bubble developed on the surface of the wing at lower angles
of attack and show that the separation process is delayed when the Reynolds number is
increased.
1. Introduction
Semi-span aircraft model consists of only half of the complete wing or tail of an aircraft. As an aircraft
is a symmetric vehicle, investigation using a semi span half model is acceptable since the effect will be
similar on the other side of the wing during straight and level longitudinal flight conditions. In general,
most wind tunnel testing research requires that the correct flight conditions is simulated and the most
accurate data is obtained. These issues are important in order to develop the accurate performance
characteristics, especially at low-speed flight conditions such as takeoff, approach and landing that are
usually encountered by subsonic transport aircraft. Typically, the Reynolds numbers achievable at the
speed appropriate for takeoff and approach conditions in the available testing facilities are below the
desired full-scale Reynolds number [1-3]. The need to extend Reynolds number testing capabilities up
to full-scale conditions can be satisfied with the development of a semi-span testing capability.
A semi-span model testing offers few advantages over full span testing. By fabricating a semi-span
model, a larger and more detailed design can be used. Due to the larger model size provided by semi-
span testing, not only is the desired increased Reynolds number testing capability is produced, but the
larger model size also improves data quality due to improved model strength, stiffness and overall
fidelity. Constructing only half the model yields further benefits in terms of reduced model's cost. The
complex high-lift systems and controls will only need to be produced for one wing. Another advantage
of semi-span testing is that it only requires simple mounting on the balance and turntable. One of the
disadvantages of semi-span testing is the wind tunnel's wall interference effects due to the model size.
In this study, the model is fabricated and mounted on a splitter plate, which is offset from the tunnel
AEROTECH VI - Innovation in Aerospace Engineering and Technology IOP PublishingIOP Conf. Series: Materials Science and Engineering 152 (2016) 012007 doi:10.1088/1757-899X/152/1/012007
Content from this work may be used under the terms of the Creative Commons Attribution 3.0 licence. Any further distributionof this work must maintain attribution to the author(s) and the title of the work, journal citation and DOI.
Published under licence by IOP Publishing Ltd 1
wall, such that it is outside the wall's boundary layer. The height of the model is also increased to
avoid the boundary layer effect [1-3]. One of the main advantages of the half model is because it has a
large wing area. Therefore, the flow visualization experiments can be carried out more effectively. A
generic half model transport aircraft has been built in Universiti Teknologi Malaysia (UTM). The
main objective of this project is to investigate the effect of Reynolds number on the performance of
the aircraft when the control surface is changed.
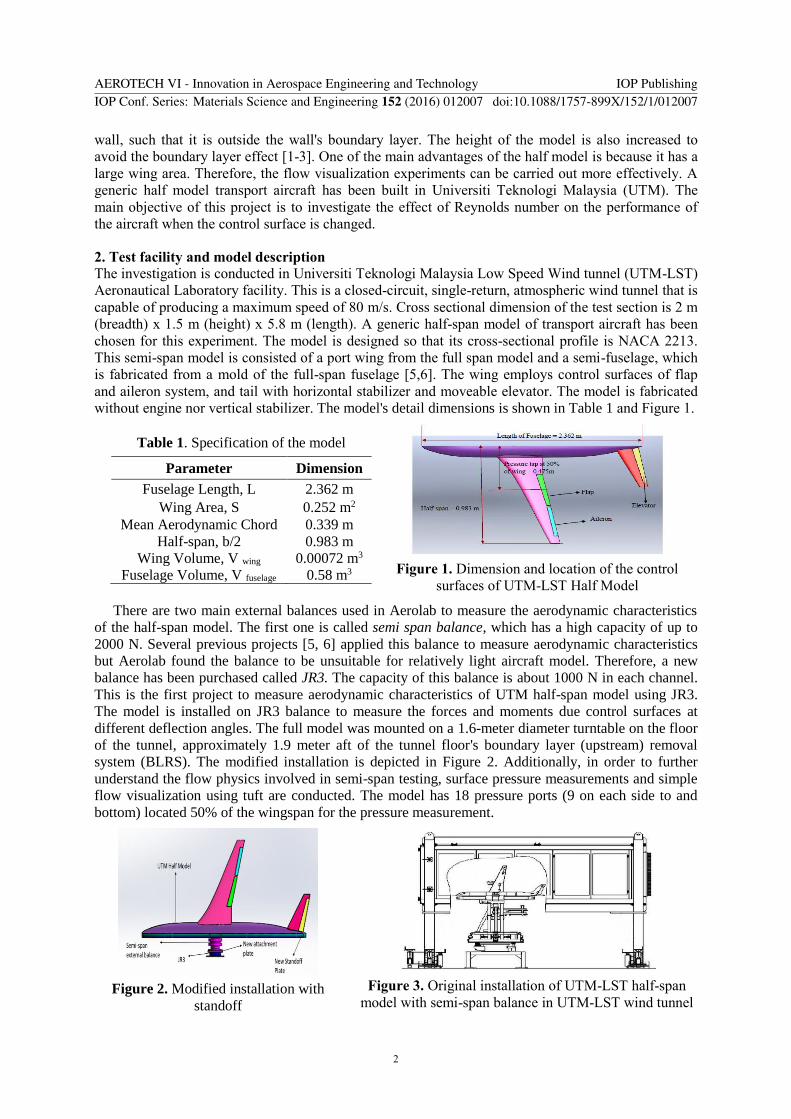
2. Test facility and model description
The investigation is conducted in Universiti Teknologi Malaysia Low Speed Wind tunnel (UTM-LST)
Aeronautical Laboratory facility. This is a closed-circuit, single-return, atmospheric wind tunnel that is
capable of producing a maximum speed of 80 m/s. Cross sectional dimension of the test section is 2 m
(breadth) x 1.5 m (height) x 5.8 m (length). A generic half-span model of transport aircraft has been
chosen for this experiment. The model is designed so that its cross-sectional profile is NACA 2213.
This semi-span model is consisted of a port wing from the full span model and a semi-fuselage, which
is fabricated from a mold of the full-span fuselage [5,6]. The wing employs control surfaces of flap
and aileron system, and tail with horizontal stabilizer and moveable elevator. The model is fabricated
without engine nor vertical stabilizer. The model's detail dimensions is shown in Table 1 and Figure 1.
Table 1. Specification of the model
Parameter Dimension
Fuselage Length, L 2.362 m
Wing Area, S 0.252 m2
Mean Aerodynamic Chord 0.339 m
Half-span, b/2 0.983 m
Wing Volume, V wing 0.00072 m3
Fuselage Volume, V fuselage 0.58 m3
Figure 1. Dimension and location of the control
surfaces of UTM-LST Half Model
There are two main external balances used in Aerolab to measure the aerodynamic characteristics
of the half-span model. The first one is called semi span balance, which has a high capacity of up to
2000 N. Several previous projects [5, 6] applied this balance to measure aerodynamic characteristics
but Aerolab found the balance to be unsuitable for relatively light aircraft model. Therefore, a new
balance has been purchased called JR3. The capacity of this balance is about 1000 N in each channel.
This is the first project to measure aerodynamic characteristics of UTM half-span model using JR3.
The model is installed on JR3 balance to measure the forces and moments due control surfaces at
different deflection angles. The full model was mounted on a 1.6-meter diameter turntable on the floor
of the tunnel, approximately 1.9 meter aft of the tunnel floor's boundary layer (upstream) removal
system (BLRS). The modified installation is depicted in Figure 2. Additionally, in order to further
understand the flow physics involved in semi-span testing, surface pressure measurements and simple
flow visualization using tuft are conducted. The model has 18 pressure ports (9 on each side to and
bottom) located 50% of the wingspan for the pressure measurement.
Figure 2. Modified installation with
standoff
Figure 3. Original installation of UTM-LST half-span
model with semi-span balance in UTM-LST wind tunnel
AEROTECH VI - Innovation in Aerospace Engineering and Technology IOP PublishingIOP Conf. Series: Materials Science and Engineering 152 (2016) 012007 doi:10.1088/1757-899X/152/1/012007
2

A standard wall correction as discussed in [7] is applied in this project. The wall correction consists
of solid blockage and wake blockage. Solid blockage occurs due to the presence of the model inside
the section, which creates velocity increase across the model. Calculation of the solid blockage is done
using the simple equation for solid-blockage correction for two dimensional case as in Equation 1 [7].
(1)
where K1 is a spanning configuration factor which is value of 0.52 for a model spanning across the
tunnel height or in vertical direction. The model volume is 0.00073 m3 and c is the tunnel parameters.
Meanwhile, the wake blockage correction is also done in two dimensional case, using the simplified
equations as in Equation 2, Equation 3 and Equation 4.
(2)
(3)
(4)
where Cdu is the uncorrected drag coefficient from the balance reading while h is the wind tunnel
height, which is 1.5 meter. The total blockage factor for this model is about 12% at the angle of attack
of α = 23o.
3. Wind tunnel testing
The installation of the UTM-LST half-span model in the test section is shown in Figure 4. The wind
tunnel experiment is conducted in the UTM Low Speed Tunnel at Universiti Teknologi Malaysia's
Aeronautics Laboratory with cross sectional 2.0m width x 1.5m height. The model was tested at 26.1
m/s and 43.1 m/s that corresponds to 0.5 x 10⁶ and 1.0 x 10⁶ Reynolds number based on the mean
aerodynamic chord, respectively. The model has an overall length of 2.362 m and the wing area of
0.252 m2. During the experiment, angle of attacks were varied from -2° to 20°. The experiments are
conducted in two phases: first, the model with no control surfaces deflection is tested and then the
model with several control surfaces deflection is tested. Three measurements techniques are employed
on the model, surface pressure measurement and steady balance data. In the final stage, threaded tuft
flow visualization method is employed on the model at angle of attack varies from -2° to 20°.
a) α = 8o b) α = 0o
Figure 4. The installation of half-span model in UTM-LST
AEROTECH VI - Innovation in Aerospace Engineering and Technology IOP PublishingIOP Conf. Series: Materials Science and Engineering 152 (2016) 012007 doi:10.1088/1757-899X/152/1/012007
3

4. Results
4.1. Steady balance data
Figure 5, Figure 6 and Figure 7 show the results obtained from JR3 balance experiments. Blockage
correction factor of 13% has been taken into consideration in the calculation. Lift coefficient in Figure
5 shows that the change of the Reynolds number has no impact on the results of the flap, aileron and
stabilizer. The lift coefficient often increases once the angle of flap, aileron and stabilizer is increased.
The results obtained show that stalling angle for this aircraft is at about α = 8°. However, increasing
the stabilizer angle can give an impact on lift (see Figure 5(iii)). The characteristics of drag and
pitching moment are shown in Figure 6 and Figure 7, respectively. Similar trend is observed for the
drag and pitching moment coefficients. In all cases, δF is the angle of flap deflection, δAe is the aileron
angle while δSt is the stabilizer angle.
a) RMac = 0.5 x 10⁶
b) RMac = 1.0 x 10⁶
(i) Effect of flap deflections on CL
a) RMac = 0.5 x 10⁶
(b) RMac = 1.0 x 10⁶
(ii) Effect of aileron deflections on CL
(a) RMac = 0.5 x 10⁶
(b) RMac = 1.0 x 10⁶
(iii) Effect of stabilizer deflections on CL
Figure 5. The effects of control surfaces on CL
AEROTECH VI - Innovation in Aerospace Engineering and Technology IOP PublishingIOP Conf. Series: Materials Science and Engineering 152 (2016) 012007 doi:10.1088/1757-899X/152/1/012007
4

(a) RMac = 0.5 x 10⁶
(b) RMac = 1.0 x 10⁶
(i) Effect of flap deflections on CD
(a) RMac = 0.5 x 10⁶
(b) RMac = 1.0 x 10⁶
(ii) Effect of flap Aileron on CD
(a) RMac = 0.5 x 10⁶
(b) RMac = 1.0 x 10⁶
(iii) Effect of flap Stabilizer on CD
Figure 6. The effects of control surfaces on CD
(a) RMac = 0.5 x 10⁶
(b) RMac = 1.0 x 10⁶
Figure 7. CM at Different Flap deflection
AEROTECH VI - Innovation in Aerospace Engineering and Technology IOP PublishingIOP Conf. Series: Materials Science and Engineering 152 (2016) 012007 doi:10.1088/1757-899X/152/1/012007
5

4.2. Surface pressure measurements data
Sample data of surface pressure measurement at an angle of attack of 0o, 40 and 80 are shown in Figure
8. The data obtained shows that only the flap is affecting the flow separation compared to aileron and
stabilizer. Therefore, only data involving flap is discussed here. Figure 8(i) shows the distribution of
pressure at α =0o. The diagram shows that the flow attaches to the wing on the entire wing. For both
Reynolds number, it can be observed that the lift increases if the flap angle is increased. At Reynolds
number 1 x 10⁶, it can be noticed that the laminar separation bubble might develop at 15% to 25% of
the wing if the flap is set at 10o. Laminar separation bubble can be predicted to occur on the wing if
gradient of Cp against x/c is zero. From Figure 8(i) at the Reynolds number of 1 x 10⁶, it may develops
from x/c = 15 – 25 % of the wing.
(a) RMac = 0.5 x 10⁶
(b) RMac = 1.0 x 10⁶
(i) Pressure coefficient at α = 00
(a) RMac = 0.5 x 10⁶
(b) RMac = 1.0 x 10⁶
(ii) Pressure coefficient at α = 40
(a) RMac = 0.5 x 10⁶
(b) RMac = 1.0 x 10⁶
(iii) Pressure coefficient at α = 80
Figure 8. Surface pressure measurement data at α = 00, 80 and 100
Laminar bubble separation
AEROTECH VI - Innovation in Aerospace Engineering and Technology IOP PublishingIOP Conf. Series: Materials Science and Engineering 152 (2016) 012007 doi:10.1088/1757-899X/152/1/012007
6

When the angle of attack is increased to α = 40, not much of a difference can be observed compared
to the result obtained for α = 00. The airflow is still attached to the wing to the wing surface. Laminar
separation bubble might develop at position 8% of the wing at Reynolds number of 0.5 x 10⁶. There is
a significant difference when the angle of attack is increased to α = 80. Figure 8(iii) indicates that the
flow separation has developed on the wings. At Reynolds number of 0.5 x 10⁶, it can be observed that
the increase in flap angle has promoted the flow separation. At higher Reynolds number of 1 x 10⁶ (see
Figure 8(iii)), it can be observed that the flow separation has been delayed. The attached flow still
exist in front of the wing and this indicates that the increase of Reynolds number has delayed the
process of separation. When Reynolds number is increased, this means that the viscosity of the airflow
has also increased. The airflow becomes more turbulent in this situation. Stronger ability of turbulent
boundary layer to sustain the adverse pressure gradient has delayed the separation process [8].
4.3. Thread flow visualization results
This section discussed the thread flow visualization that has been carried out on the model. During the
experiment, a camera was placed on the roof of the UTM test section. Images of the flow separation
were recorded for every five seconds. This process is done for all specified angles of attack. Sample
images of surface flow visualization using thread performed on the clean wing configuration is shown
in Figure 10. This experiment was performed at angles of attack between -2o to 20o and the Reynolds
number of 0.5 x 10⁶. In Figure 9(a), it can be seen that the thread is fully attached to the surface of the
wing. It shows in this position that the airflow is attached to the wing surface and separation is not
observed. When the angle of attack is increased to α = 5o, the airflow in the leading edge is attached to
the wing surface to a certain chordwise position. In the trailing edge region, it can be observed that the
flow separation begins to develop. Increasing the angle of attack further causes the separation point to
move forward as shown in Figure 9(c). Finally, at α = 5o, the entire wing is covered by the flow
separation (see Figure 9(d)).
(a) The flow separation at α=0° (b) The flow separation at α=5°
(c) The flow separation at α=8° (d) The flow separation at α=15°
Figure 9. Thread tuft flow study at Reynolds number of 0.5 x 10⁶
The thread is attached to the wing surface
Flow separation region
AEROTECH VI - Innovation in Aerospace Engineering and Technology IOP PublishingIOP Conf. Series: Materials Science and Engineering 152 (2016) 012007 doi:10.1088/1757-899X/152/1/012007
7

5. Conclusion
This experiment is conducted with the aim of providing a detailed explanation on the aerodynamic
characteristics of half-span model of transport aircraft at certain control surface deflections. In this
experiment, three measurement techniques have been carried out on the aircraft model, i.e. balance
measurement, surface pressure measurement and flow measurement visualization. It is deduced that
when flaps are deflected at larger angle, the flow is still attached and the lift increases with increasing
angle of attack. This paper discusses in detail the effect of control surfaces on lift, drag and moment.
The results obtained also show that the airflow is sensitive to Reynolds number. It is found that the
separation process is delayed if the Reynolds number is increased.
Acknowledgements
This research is funded by research grant from Ministry of Higher Education and Universiti Teknologi
Malaysia (UTM Research University Grant Q.J130000.2524.12H06). It should be noted that the data
presented, the statement made and views expressed are solely the responsibility of the author.
References
[1] Yokokawa Y, Murayama M, Uchida H and Tanaka K 2010 AIAA Aerospace Science Meeting
[2] Gatlin G M and McGheet R J 1997 Journal of Aircraft 34 500-5
[3] Milholen W E, Chokani N and McGhee R J 1996 Journal of Aircraft 33 115-22
[4] Mansor S 2008 Low Speed Wind Tunnel Universiti Teknologi Malaysia
[5] Ishak I S, Mat S, Mat Lazim T and Awang M Z 2003 International Conference on Mechanical
Engineering
[6] Sunthrasakaran R 2015 Journal of Aeronautical Science and Engineering 1
[7] Pope A and Rae W 1984 Low-speed wind tunnel testing (New York: Wiley)
[8] Mat S 2010 The Analysis of Flow on Round-Edged Delta Wings PhD Thesis University of
Glasgow
AEROTECH VI - Innovation in Aerospace Engineering and Technology IOP PublishingIOP Conf. Series: Materials Science and Engineering 152 (2016) 012007 doi:10.1088/1757-899X/152/1/012007
8


![[c Pi Lst 0001 Rev.0]c Pi Lst 0001_0(Line List)](https://static.fdocuments.us/doc/165x107/577c86d21a28abe054c2b5ae/c-pi-lst-0001-rev0c-pi-lst-00010line-list.jpg)
