EXPERIMENTAL STUDY OF HYDROGEN PURGE EFFECTS … · EXPERIMENTAL STUDY OF HYDROGEN PURGE EFFECTS ON...
25
EXPERIMENTAL STUDY OF HYDROGEN PURGE EFFECTS ON PERFORMANCE AND EFFICIENCY OF AN OPEN-CATHODE PEM FUEL CELL SYSTEM Stephan Strahl, Attila Husar * , Jordi Riera Institut de Robotica i Informatica Industrial (CSIC-UPC), Parc Tecnologic de Barcelona, C/Llorens i Artigas 4-6, 08028 Barcelona, Spain ABSTRACT: The performance and efficiency of an open-cathode PEM fuel cell system in dead-ended anode (DEA) configuration and hydrogen purges is analyzed in this work. Excess water and crossed-over nitrogen in the anode decrease the hydrogen concentration at the catalyst surface, which in turn causes performance losses. Purging the anode with hydrogen removes water and nitrogen and thus recovers the performance. However, this means wasting hydrogen and decreasing overall system efficiency. Gas chromatography was used to detect and quantify the accumulated nitrogen in the anode during DEA operation. The experiments show that the major performance limitation in the studied system is related to water instead of nitrogen. Moreover, oxygen was detected in the anode exhaust gas after long purge intervals, which is an indicator for corrosion of the cathode carbon support structure. Experimental observations revealed that the need for a hydrogen purge strongly depends on the operating conditions and the state-of-health of the fuel cell. It is shown that flooding on the anode and drying of the cathode catalyst layer may occur simultaneously during purged operation. Therefore, purge decisions must be evaluated online, depending on the operating conditions. Keywords: PEMFC, Open-cathode, Hydrogen purge, EIS, Gas chromatography, Efficiency 1. INTRODUCTION Water management in Proton Exchange Membrane (PEM) Fuel Cells is a crucial issue. On the one hand, water is needed to maintain good proton conductivity and therefore has to be kept in the membrane. On the other hand, too much liquid water in the Catalyst Layers (CL) reduces the electrochemically active surface area and if present in the pores of the Gas Diffusion Layers (GDL) it hinders the reactant gases to diffuse to the catalyst surface. * Corresponding author. Tel.: +34 93 4015754; Fax: +34 93 4015750. E-mail address: [email protected]
Transcript of EXPERIMENTAL STUDY OF HYDROGEN PURGE EFFECTS … · EXPERIMENTAL STUDY OF HYDROGEN PURGE EFFECTS ON...

EXPERIMENTAL STUDY OF HYDROGEN PURGE EFFECTS ON PERFORMANCE
AND EFFICIENCY OF AN OPEN-CATHODE PEM FUEL CELL SYSTEM
Stephan Strahl, Attila Husar*, Jordi Riera
Institut de Robotica i Informatica Industrial (CSIC-UPC), Parc Tecnologic de Barcelona, C/Llorens i Artigas 4-6, 08028
Barcelona, Spain
ABSTRACT: The performance and efficiency of an open-cathode PEM fuel cell system in dead-ended anode
(DEA) configuration and hydrogen purges is analyzed in this work. Excess water and crossed-over nitrogen in the
anode decrease the hydrogen concentration at the catalyst surface, which in turn causes performance losses.
Purging the anode with hydrogen removes water and nitrogen and thus recovers the performance. However, this
means wasting hydrogen and decreasing overall system efficiency. Gas chromatography was used to detect and
quantify the accumulated nitrogen in the anode during DEA operation. The experiments show that the major
performance limitation in the studied system is related to water instead of nitrogen. Moreover, oxygen was
detected in the anode exhaust gas after long purge intervals, which is an indicator for corrosion of the cathode
carbon support structure. Experimental observations revealed that the need for a hydrogen purge strongly
depends on the operating conditions and the state-of-health of the fuel cell. It is shown that flooding on the anode
and drying of the cathode catalyst layer may occur simultaneously during purged operation. Therefore, purge
decisions must be evaluated online, depending on the operating conditions.
Keywords: PEMFC, Open-cathode, Hydrogen purge, EIS, Gas chromatography, Efficiency
1. INTRODUCTION
Water management in Proton Exchange Membrane (PEM) Fuel Cells is a crucial issue. On the one hand, water
is needed to maintain good proton conductivity and therefore has to be kept in the membrane. On the other hand,
too much liquid water in the Catalyst Layers (CL) reduces the electrochemically active surface area and if present
in the pores of the Gas Diffusion Layers (GDL) it hinders the reactant gases to diffuse to the catalyst surface.
* Corresponding author. Tel.: +34 93 4015754; Fax: +34 93 4015750. E-mail address: [email protected]
Thus, both effects reduce the performance of the system. The goal is to maintain an almost uniform distribution in
the Membrane Electrode Assembly (MEA) by keeping a balance between the two conflicting requirements. To
control water transport within a fuel cell system and thereby optimize the MEA hydration at any point of
operation, proper dynamic water management strategies have to be developed. This has been analyzed recently by
Hussaini and Wang [1].
Today most PEM fuel cell systems work either with a Dead-Ended Anode (DEA), which is fed by dry
hydrogen at a regulated inlet pressure or a flow-through (FT) configuration. A DEA system provides savings in
costs, volume and weight compared to a FT system, as it does not require a hydrogen recirculation loop with the
specific auxiliary components, such as a pump, water separator and humidifier. The water back diffusion through
the membrane in the anode during DEA operation leads to a certain degree of self-humidification. Thus, the anode
may be fed by dry hydrogen.
However, there are some major problems involved in the DEA operation. Water accumulation in the anode CL
and GDL can significantly reduce the performance, as stated above Nitrogen permeation from the cathode through
the membrane and accumulation in the anode leads to a similar decrease in performance, as recently investigated
by Siegel et al. [2]. Thus, the anode has to be purged regularly in order to remove accumulated water and nitrogen.
Improper control of the purge can lead to hydrogen starvation along the channel due to the accumulation of water
and nitrogen, which in turn could increase the carbon corrosion rate significantly [3].
However, purging with hydrogen means wasting energy and thus decreasing the overall system efficiency. In
order to minimize the waste of hydrogen, the need for a purge has to be evaluated online, depending on the actual
operating conditions. Feeding the purged hydrogen back into the fuel supply line does not solve the efficiency
problem due to the extra power consumption of a necessary hydrogen pump. Moreover, purging is still required in
order to prevent nitrogen accumulation in the recirculation loop.
Recently several articles were published that describe experimental and modeling work on DEA single cells
[2,3,4]. In the work of Siegel et al. [2] the effect of nitrogen blanketing is studied in detail, which was extended
later by Chen et al. [4] to account for liquid water transport and accumulation. In the work of Chen et al. [3] DEA
operation effects on carbon corrosion due to hydrogen depletion along the channel are highlighted.
This work contributes to the literature with a thorough experimental analysis of performance losses during
DEA operation of a 20-cell, open-cathode PEM fuel cell stack for the purpose to optimize purge strategies.
Possible degradation effects due to improper purge intervals are proved experimentally. Moreover, a comparison
to a FT system in terms of system efficiency is provided.

2. EXPERIMENTS
2.1 Open-cathode PEM fuel cell system
The system under observation in this work is the commercially available 100 W, 20 cell PEM fuel cell stack
H-100 from Horizon Fuel Cells Technologies. This open-cathode system with an active area of 22.5 cm2 is self-
humidified and air-cooled. It includes a cooling fan directly attached to the fuel cell housing, which removes heat
from the stack by forced convection and at the same time provides oxygen to the cathode. The anode inlet is
supplied with dry hydrogen and the outlet features a normally-closed electromagnetic valve for dead-ended
operation and purging. A manual forward pressure regulator maintains the anode inlet pressure to about 0.4 bar.
This system by default operates in a constant purge period mode (10 s), which has to be optimized, as explained in
section 1.
Due to the open-cathode nature of the system, the cathode is always exposed to relatively dry ambient air,
which demands for a system design that keeps water in the MEA and also achieves fast humidification. Therefore,
the bipolar plate on the anode side does not feature flow channels but an interdigitated flow field, which is
integrated directly into the GDL. Moreover, both anode and cathode provide micro-porous layers (MPL) between
GDL and CL. Thus, DEA operation leads to fast accumulation of water in the anode. However, the related
negative effects of liquid water accumulation result in a decreasing performance. The anode and cathode flow
field geometry of the studied stack as well as the structure of the diffusion layers have been discussed in more
detail in the work of Strahl et al. [5].
2.2 Electrochemical Impedance Spectroscopy (EIS)
In order to relate the performance loss during DEA operation to activation, mass transport and ohmic losses,
EIS were carried out before, during and after DEA operation. At the beginning of the test the stack was dry, as it
has not been operated for about 3 months. Thus, it had to be humidified by operation with humidified reactants.
During initial flow-through operation it was switched from dry hydrogen to humidified hydrogen at 30ºC dew
point at a fuel cell temperature of 33 ºC and a current density of 0.04 Acm-2. EIS from 10 kHz to 1 Hz were
performed before and after the anode humidification in order to study to effect of humidification on Ohmic and
Faradaic resistance. EIS are carried out using the Agilent 35670A Dynamic Signal Analyzer in conjunction with
the electronic load TDI RBL488. Vaisala HMM211 humidity sensors measure the anode and cathode inlet and
outlet dew point temperatures.

Once high and low frequency resistance reached steady-state values EIS experiments during DEA operation
were initiated without changing the operating conditions. The drawback of EIS is that the data are only
representative if performed at stable operating points and constant operating conditions. Thus, low current
densities were chosen (0.04 and 0.09 Acm-2) and the time for one “fast” EIS from 10 kHz to 10 Hz was optimized
to about 20 s. At these current densities the stack voltage drop from the beginning to the end of such a “fast”
spectroscopy was only a few millivolts, which was considered to be negligible and therefore the EIS data are
valid.
2.3 Analysis of DEA Operation Effects on Performance
The cell configuration explained in section 2.1 promotes the hypothesis that liquid water accumulation in this
system occurs much faster than the accumulation of nitrogen in the anode. One reason is, that the diffusivity of
water vapor through Nafion is three orders of magnitude higher than the diffusivity of nitrogen [5,6]. In order to
detect and quantify the nitrogen accumulation in the anode gas chromatography (GC) experiments were
performed. The GC data were analyzed in relation with the electrical data collected during the experiment.
An Inficon 3000 Mirco GC gas chromatograph was used to measure the hydrogen, nitrogen, and oxygen
content of gas samples taken from purges during DEA operation at different current densities. Argon was used as
the carrier gas at a flow rate of 20ml/min and a thermal conductivity detector determined the gas composition. The
sampling time of the chromatograph was set to 60 s to ensure proper detection of nitrogen, which has a retention
time of about 40s.
The stack was fed with dry hydrogen. The exhaust gas of 10 purges at the selected current densities was
collected in gas sampling bags and analyzed afterwards in the chromatograph. The purge interval was kept
constant at 60 s. The purge duration was set to 100ms in order to refill the entire anode volume of 6ml with fresh
hydrogen.
Since the system does not feature any additional heaters, the constant stack temperature of 45ºC was chosen,
because it is the maximum temperature reached at the lowest test current density of 0.09 Acm-2. The ambient
conditions were maintained constant at 25 ºC and 35 % RH via an environmental chamber. These conditions were
the most common ambient conditions to which the stack was exposed in the air-conditioned laboratory before the
testing. Performance tests with the specified stack at different ambient conditions have been discussed in a
previous publication of the authors [7]. However, since the focus in this study is the hydrogen purge strategy
without adding any other parts to the system (heaters, coolers, humidifiers) the most common operation conditions
were chosen.

LabVIEW data acquisition software was used in conjunction with the National Instruments Analog Input
Module for Fuel Cells NI-9206 to measure the stack voltage and each single cell voltage. The stack current is
measured with a Chauvin Arnoux E3N current clamp.
2.4 Analysis of Purge Effects During DEA Operation and Different Operation Conditions
To analyze the effects of purges on system performance, the anode was purged periodically with a purge
interval was 30 s and a purge duration of 100 ms. In that configuration the single cell and stack voltage responses
to changes in stack current, temperature and cathode inlet flow rate were studied. As in the previous experiment,
dry hydrogen was fed into the anode.
2.5 Evaluation of Flooding Detection Method
The capability of detecting anode flooding via monitoring of the anode inlet pressure during purges was
analyzed. In order to evaluate this hypothesis, the anode inlet pressure transients during purges at dry and wet
conditions were compared. The stack was flooded by operation at high current densities, wet ambient conditions
and long purge intervals. The ambient conditions were controlled to 10 ºC and 95 %RH by the environmental
chamber. The anode was supplied with dry hydrogen. The applied current density was 0.2 Acm-2. The purge
interval was set to 60 s with a purge duration of 500 ms. The pressure sensor MPX5100 from Freescale
Semiconductor is integrated into the hydrogen supply line to monitor the anode inlet pressure.
2.6 Emulation of a Hydrogen Recirculation System
In order to compare the purged system to a recirculation system in terms of efficiency, the DEA experiment
(section 2.3) was carried out in FT mode with humidified hydrogen at the current densities 0.13, 0.18 and 0.27
Acm-2. Both system designs achieve performance improvement via anode humidification, although in a different
way. Since the experimental setup does not feature a recirculation pump, the anode humidification via a
recirculation loop was emulated by the use of a Cellkraft P-10 humidifier. The entering hydrogen was humidified
to a dew point temperature of 25 ºC, at a constant flow rate of 2 SLPM and a fuel cell temperature of 45 ºC. These
conditions are realistic in a well-designed recirculation system that maintains the gas temperature in the
recirculation loop above the ambient temperature by proper system insulation.
2.7 Oxygen Permeation Through the Membrane

In DEA systems oxygen permeation and its presence in the anode plays a crucial role in terms of degradation
[3]. During DEA operation the anode may suffer from locally fuel-depleted regions, which promotes the
accumulation of permeated oxygen, while in a flow-through mode with sufficient hydrogen, this oxygen would be
instantaneously reduced to water.
In order to quantify the amount of oxygen that accumulates in the anode during DEA operation, gas samples
collected during purges were analyzed for traces of oxygen by means of gas chromatography, as explained in
section 2.3. The exhaust gas of 10 purges of 100 ms was collected in gas sampling bags at a current density of
0.09 Acm-2. The test was carried out at various purge intervals from 60 to 300 s. Low current densities were
chosen in order to maximize the time between purges before reaching the minimum cell voltages due to hydrogen
starvation. The obtained data provide important information for degradation rate estimation as a function of the
purge strategy.
3. RESULTS AND DISCUSSION
3.1. Effects of Humidification and DEA Operation on Stack Impedance Spectra
As explained in section 2.2, the stack was initially dry and had to be humidified. The impedance spectra before
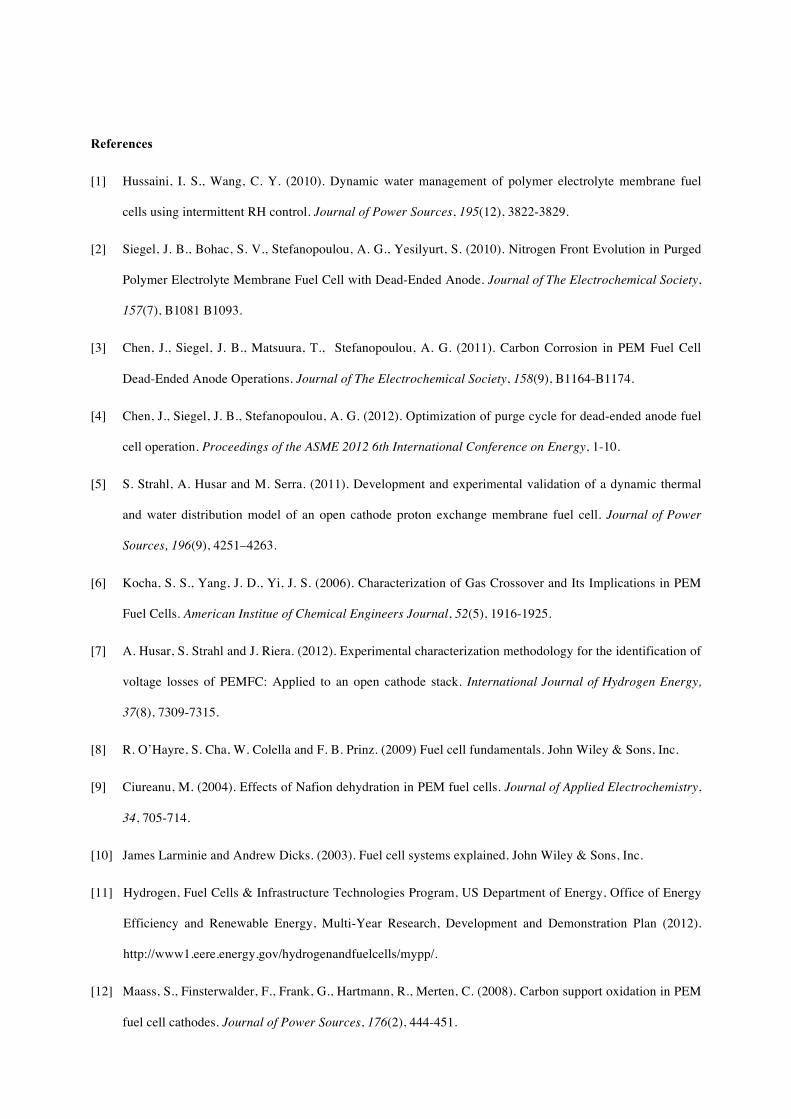
and after humidification are shown in Figure 1. The high frequency resistance (RHF) represents the sum of the
membrane resistances of the 20 cells in the stack [8]. Figure 1 shows a decrease of RHF from 0.3 to 0.2 Ω within
the first 10 min of running on humidified gas due to the very dry initial membrane states. Moreover, the low
frequency resistance (RLF) decreases as well from 2.5 to 2 Ω. The difference between RHF and RLF is the so-called
Faradaic resistance (Rf), which gives information about the reaction kinetics of the electrochemical interface [8].
As depicted in Figure 1, Rf decreases significantly during humidification, which is a result of improving activation
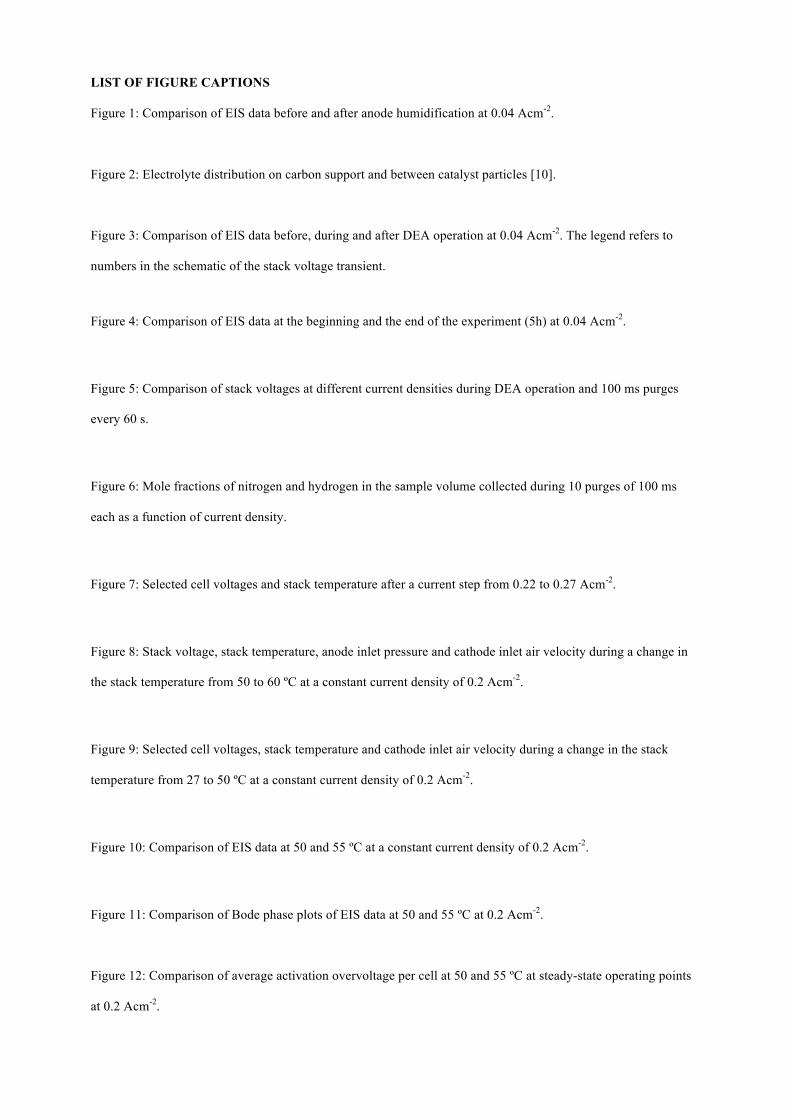
polarization due to higher water content in the anode and cathode catalyst layer [9]. The electrolyte material in the
catalyst layer requires the presence of water for the H+ ions to reach the so-called three-phase-contacts between
reactant gas, electrolyte, and electrode catalyst [10], as shown in Figure 2.
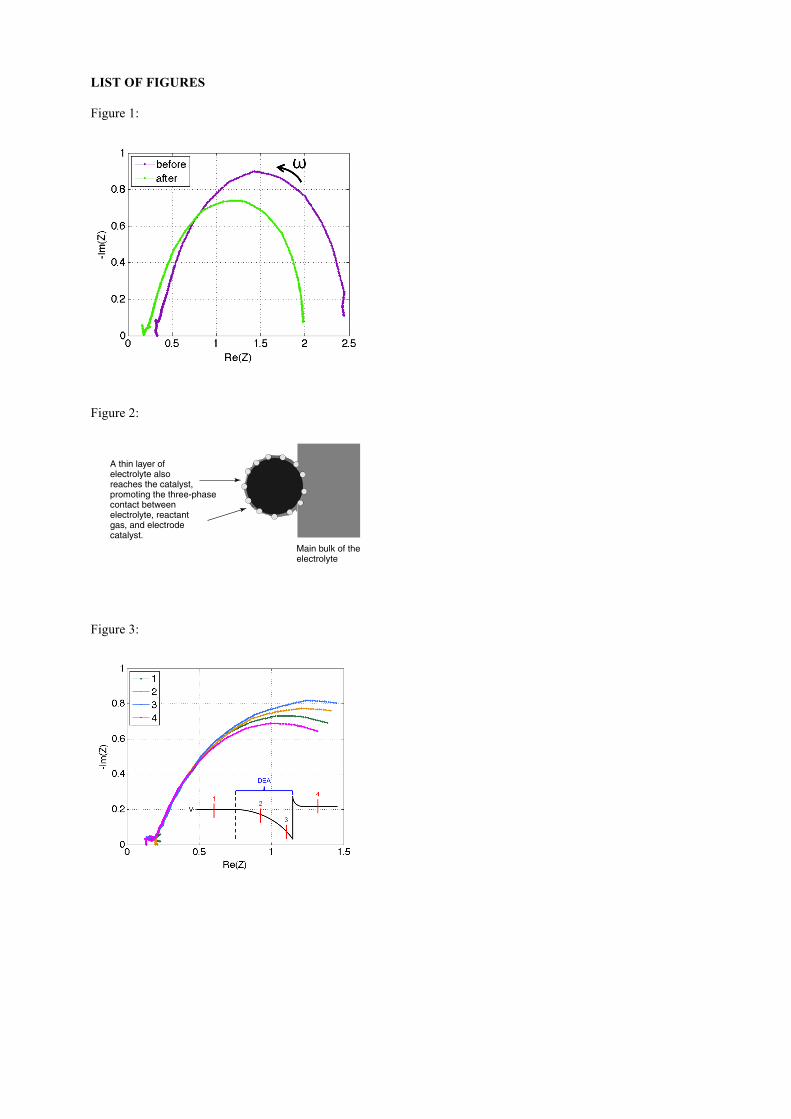
After reaching a steady-state for RHF and RLF the DEA experiments were initiated. The Nyquist plots of the
“fast” EIS (from 10 kHz to 10 Hz) at 0.04 Acm-2 are shown in Figure 3. The plots show that RLF increases
significantly once the anode outlet valve is closed due to accumulation of water whereas RHF remains constant.
This means that the membrane is well humidified but the excess water in the anode increases the mass transport
resistance. The EIS data recorded right after opening the outlet valve (curve 4) show an even better performance
in terms of RLF than at the beginning of the test (curve 1). This is the result of the improved state of humidification
of the cathode catalyst layer due to water diffusion from anode to cathode during DEA operation.

The experiment at different current densities required about 5 hours. The comparison of the Nyquist plots at
the beginning and the end of the experiment, as depicted in Figure 4, shows that after 5 hours of dead-ended and
purged operation the overall stack performance improved significantly. The major part of the improvement in RHF
from 0.3 to 0.18 Ω was obtained only by running the stack on humidified hydrogen for about 10 min at the
beginning. However, even though RHF has not been changing anymore afterwards, the system was still not
optimally humidified, as indicated by the following decrease in RLF from 2.5 to 1.6 Ω throughout the experiment.
So the majority of the performance improvement by proper water management in this stack is not related to the
membrane but rather to an optimal humidification of the catalyst layers.
3.2. Effects of Water and Nitrogen Accumulation During DEA Operation
The experiment explained in section 2.3 was carried out at current densities from 0.09 to 0.27 Acm-2. The
resulting stack voltage transients during the purged operation are shown in Figure 5. The voltage decay between
purges strongly depends on the current. While at 0.27 Acm-2 to voltage drops about 0.8 V, at 0.09 Acm-2 the
voltage drop during 60 s of DEA operation is negligible.
Figure 6 shows the results of the gas chromatography at the different current densities. The measurement
points at a current density of zero refer to a sample volume of pure H2 that just passed the stack after purging it
with a constant hydrogen flow for about 5 min. The detected N2 mole fraction of less than 1 % may result from
residual N2 that was still present in the tubing or the porous media. The maximum mole fraction of N2 that has
been reached within 60 s is about 10 %. This concentration of N2 in the anode by itself is not responsible for the
monitored voltage drop at 0.27 Acm-2 after 60 s, compared to the published literature. In the work of Siegel et al.
[2], for instance, N2 mole fractions up to 0.7 are demonstrated at a comparable voltage drop and similar current
densities, however at much longer purge intervals. Moreover, the voltage drop depicted in Figure 5 changes
significantly by reducing the current density from 0.27 to 0.18 Acm-2 while the N2 mole fraction stays almost
constant. The decrease in N2 mole fraction at lower current densities is related to the drying of the membrane. As
shown in the work of Kocha et al. [6], the permeability of nitrogen through the PEM can change more than one
order of magnitude from a dry to a wet membrane, since the permeability of nitrogen through water is higher than
through the polymer.
This analysis shows that the open-cathode design of the system under study results in a less important effect of
nitrogen blanketing, because the voltage drops faster than expected, if caused by 10 % of N2 in the anode. Instead,
the formation and accumulation of liquid water is the limiting factor for DEA operation. Moreover, the voltage
drop is not a cathode-related phenomenon but can be attributed to the reduction of active sites in the anode. This is
indicated by the instantaneous voltage jump in Figure 5 once the outlet valve is opened. The pressure driven flow
through the anode manifold and porous media during only 100 ms removes water and nitrogen. Thus, blocked
pores and active sites are cleared, which results in a complete recovery of the stack voltage.
For a successful application of DEA fuel cell systems the voltage drop during DEA operation has to be
minimized to an acceptable limit, which is related to the overall system efficiency and performance. Thus, anode
purges have to be performed with operating conditions dependent purge rates. The effects of periodic purges
during DEA operation on performance, efficiency and durability are explained in the following sections.
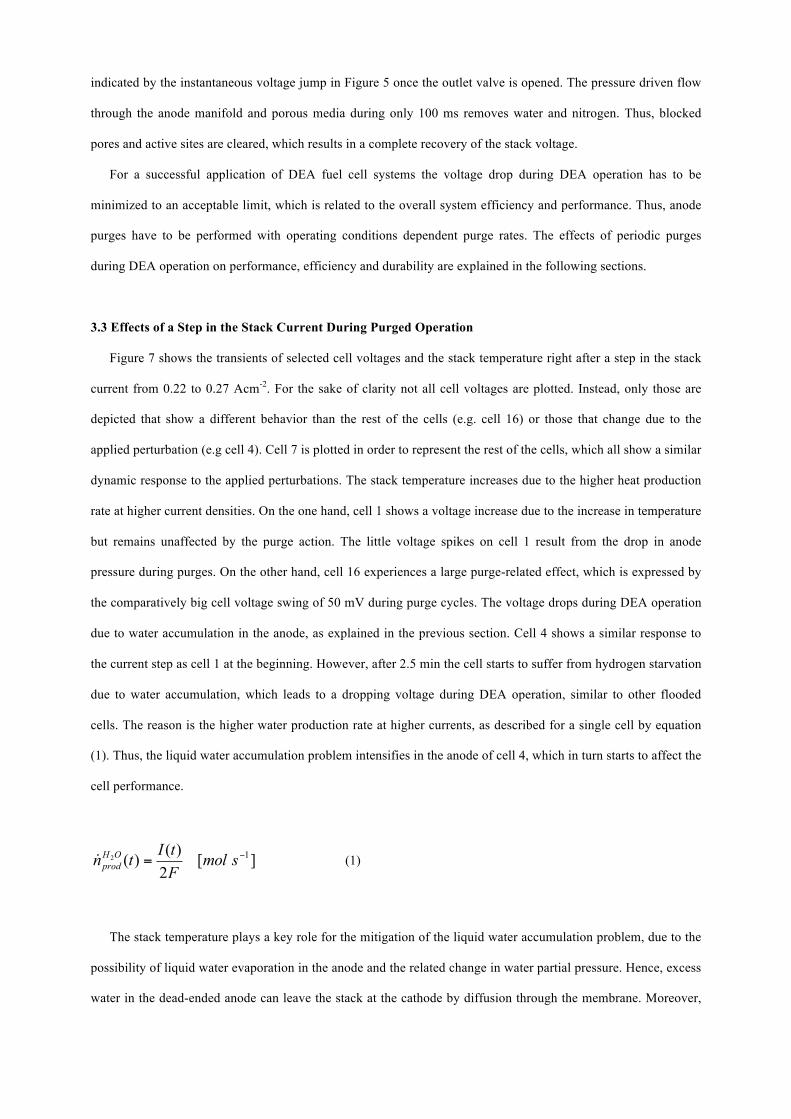
3.3 Effects of a Step in the Stack Current During Purged Operation
Figure 7 shows the transients of selected cell voltages and the stack temperature right after a step in the stack
current from 0.22 to 0.27 Acm-2. For the sake of clarity not all cell voltages are plotted. Instead, only those are
depicted that show a different behavior than the rest of the cells (e.g. cell 16) or those that change due to the
applied perturbation (e.g cell 4). Cell 7 is plotted in order to represent the rest of the cells, which all show a similar
dynamic response to the applied perturbations. The stack temperature increases due to the higher heat production
rate at higher current densities. On the one hand, cell 1 shows a voltage increase due to the increase in temperature
but remains unaffected by the purge action. The little voltage spikes on cell 1 result from the drop in anode
pressure during purges. On the other hand, cell 16 experiences a large purge-related effect, which is expressed by
the comparatively big cell voltage swing of 50 mV during purge cycles. The voltage drops during DEA operation
due to water accumulation in the anode, as explained in the previous section. Cell 4 shows a similar response to
the current step as cell 1 at the beginning. However, after 2.5 min the cell starts to suffer from hydrogen starvation
due to water accumulation, which leads to a dropping voltage during DEA operation, similar to other flooded
cells. The reason is the higher water production rate at higher currents, as described for a single cell by equation
(1). Thus, the liquid water accumulation problem intensifies in the anode of cell 4, which in turn starts to affect the
cell performance.
][2)()( 12 −= smolFtItn OH
prod (1)
The stack temperature plays a key role for the mitigation of the liquid water accumulation problem, due to the
possibility of liquid water evaporation in the anode and the related change in water partial pressure. Hence, excess
water in the dead-ended anode can leave the stack at the cathode by diffusion through the membrane. Moreover,
this diffusive water flux humidifies the cathode catalyst layer, which is explained in section 3. An optimal
temperature control strategy thus has to consider water accumulation related effects in order to achieve a high
system performance. Therefore the effects of temperature during DEA operation have been investigated.
3.4 Effects of Temperature and Flow Rate During Purged Operation
As explained in section 2.1 the stack temperature is controlled by a PID controller that actuates the cathode
fan. Hence, for analyzing temperature-related effects, the fan flow rate was varied during the experiment. The
current density was kept constant at 0.2 Acm-2. Figure 8 shows the responses of stack voltage, stack temperature,
anode inlet pressure and cathode inlet air velocity after a change in the set point of the temperature controller from
50 to 60 ºC. While the temperature is starting to increase, an initial stack voltage increase of 0.2 V can be
observed. This voltage gain is the sum of several temperature and flow rate related effects, such as improving
reaction kinetics, excess water evaporation in the anode, diffusion towards the cathode and less water removal
from the cathode catalyst layer. However, after 2 min the voltage starts to drop while temperature is still
increasing. The stack voltage drops 0.7 V in only 6min due to cathode catalyst drying which now predominates
the positive temperature-related effects, as explained above.
Following the manufacturer’s guidelines, the limiting stack temperature is 60 ºC. Therefore the test was
repeated at a lower end temperature. Figure 9 shows selected cell voltages, stack temperature and the cathode inlet
air velocity during the change in the temperature set point from ambient to 50 ºC. The performance improvement
due to the rising temperature, as explained above, can be observed in the cell voltages. Moreover, cell 16 and 7
show a decreasing DEA related voltage swing and thus a diminishing sensitivity to DEA operation due to water
evaporation in the anode. However, as in the previous experiment the cathode drying-related performance loss
predominates the overall voltage trend. Thus, anode flooding and cathode catalyst drying are both present at the
same time. After dropping the temperature from 50 to 45 ºC in order to counteract the cathode catalyst drying, the
cell voltages stabilize again. Positive effects of the temperature increase are that the anode flooding-related
performance losses in cell 16 diminished significantly and the effects on the voltage of cell 7 vanished completely
compared to the beginning of the test. This shows the possibility of reaching a performance optimized equilibrium
point by intelligent temperature control.
Cathode surges were performed towards the end of the test in order to check the sensitivity to the cathode fan
flow rate. The temporarily resulting voltage spikes due to an increase of cathode stoichiometry during the surge,
are preponderated by the water removal effect of the surges. This negative effect is indicated by the change in the
voltage slope of cell 1, which shifts from an increasing to a decreasing voltage transient, once the cathode surges
appear.
In order to eliminate any flow rate related effects, the same experiment was repeated using an external heater
for raising the stack temperature from 50 to 55 ºC and keeping the cathode inlet air velocity constant at 0.2 ms-1.
The result is a similar stack voltage drop as in the previous experiment of about 0.8 V, which leads to the
conclusion that the performance loss is only dependent on temperature and not the on cathode air flow rate. The
reason is that even the minimum cathode flow rate guarantees a stoichiometry of about 20.
EIS were performed at both temperatures and the resulting Nyquist plots are shown in Figure 10. The
comparison shows not only an increase in RHF due to membrane drying, but also a more severe increase in RLF.
Similar results were obtained by Ciureanu [9] after interruption in cathode humidification.
Analyzing the Bode diagram shows that the phase angle hardly changes despite the increase in RLF, as shown
in Figure 11. This indicates a reduction in the number of available active sites as a result of the dehydration of the
electrolyte present in the cathode catalyst layer. On the contrary, a change in the dielectric properties of the double
layer capacity would change the phase angle [9].
The loss of active sites is reflected in the increase in activation losses. This has been demonstrated
experimentally by applying the voltage loss dissection method presented in the work of Husar et al. [7], which
combines fast current sweeps and EIS data. The fast current sweeps provide low current density performance loss
information at any steady-state operating point without changing the operating conditions. Figure 12 shows the
increasing average activation overvoltage per cell due to the change in temperature.
Finally, all these observations have to be incorporated in an optimal purge and temperature control strategy. A
trade-off between maximum power, stability and system efficiency is necessary when the question for the need of
a purge has to be evaluated. Deciding on an appropriate strategy must consider fuel cell and ambient operating
conditions. Evaluation tools that use additional sensor information other than voltage and current may be helpful.
3.5 Anode Flooding Detection
If a purge is needed or not depends on how much water has been accumulated in the anode and on the
tolerated voltage drop. As explained in the previous sections, the voltage drop may be very different depending on
the operating conditions. However, flooding detection in the anode may include other indicators in order to create
redundancy and also clarity in the case of uncertainty. With the experiment described in section 2.5 the suitability
of the anode inlet pressure as such an indicator was evaluated. The measured anode inlet pressure curves during
purges at dry (blue) and flooded (red) operating conditions are compared in Figure 13.
An interesting curve characteristic is the maximum pressure difference during a purge, which is defined as the
difference between the highest and the lowest point of the curve. It can be seen that this pressure difference
decreases with cell flooding compared to dry conditions because water in the pores of the GDL impedes hydrogen
transport through the anode. Thus, the low-pressure part of the curve increases due to the interdigitated flow field
configuration on the anode. Therefore the anode inlet pressure can be used for online flooding detection.
If a controlled pressure regulator would be used, the anode inlet pressure could be increased by a small
amount within the allowed operating range of 0.4 to 0.6 bar in order to push the extra water out. However, this
would not only increase the cost and complexity of the system but as well the amount of hydrogen wasted during
a purge.
Figure 13 also shows the average cell voltage during a purge. The anode purge prevents the stack from
flooding and thus improves performance, as depicted by the increasing voltage during a purge at flooded
conditions. However, at dry conditions the voltage actually decreases during a purge due to the lower partial
pressure of hydrogen and returns to its previous value afterwards. Thus, hydrogen and energy is wasted, which
shows the importance of a proper purge strategy in order to improve the system efficiency.
3.6 Performance and Efficiency
DEA operation allows for a simpler system design compared to a hydrogen recirculation system. However,
there is a trade-off in system efficiency, which includes the energy waste due to hydrogen loss during a purge on
the one hand, and the power consumption of a recirculation pump on the other hand.
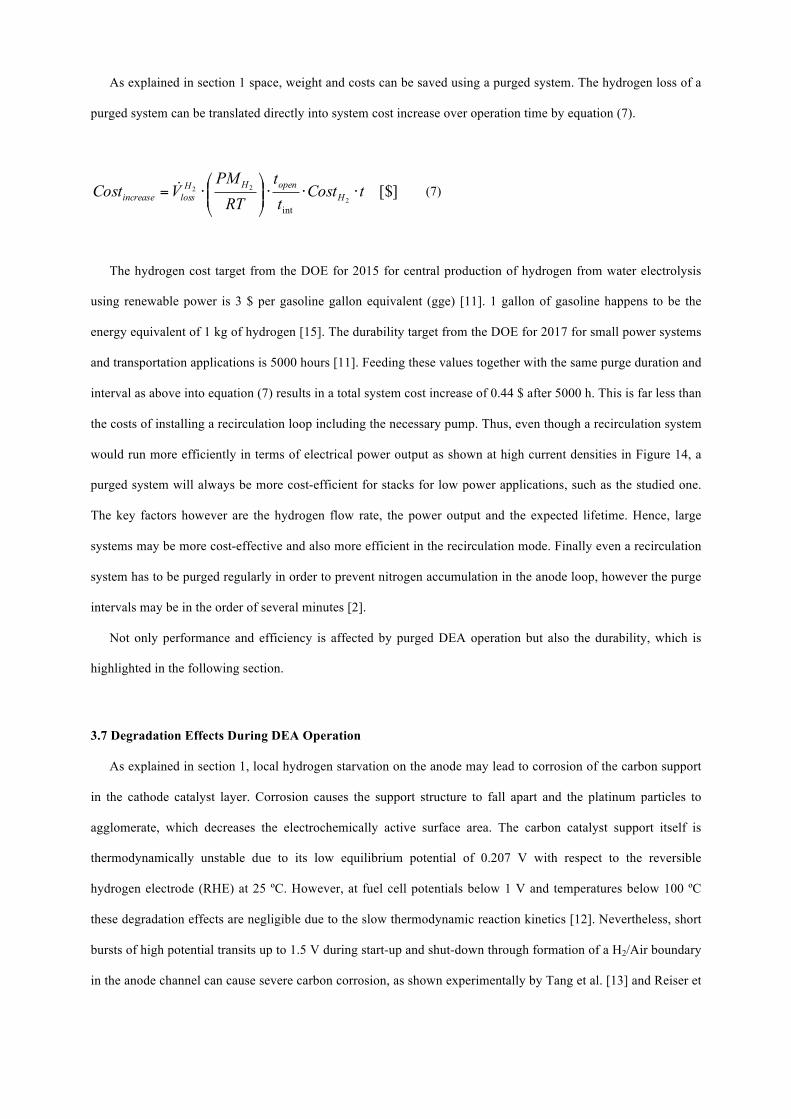
The assigned power loss of periodic hydrogen purges can be calculated with Gibbs free energy referred to
hydrogen’s lower heating value )(TGLHVΔ , which is the amount of energy that can be converted into electricity
at a temperature T and the formation of water vapor.
][)(int
22 Wtt
RTPVTGP openH
lossLHVHloss ⋅⎟
⎠
⎞⎜⎝
⎛⋅⋅Δ= (2)
In equation (2) opent is the purge duration and intt is the purge interval. The volumetric flow rate of hydrogen
loss during a purge is equal to the difference of the flow-through configuration flow rate )(2 tV HFT and the
hydrogen consumption flow rate )(2 tV Hcons . The latter is a function of current, as described by equation (3).
Equation (4) calculates the average volumetric flow rate of the hydrogen loss.

][2)()( 12 −⋅= slPRT
FtItV H
cons (3)
( ) ][)()(1 1
0
222 −∫ −= sldttVtVt
Vopent
Hcons
HFT
open
Hloss
(4)
Thus, the total system power of a purged system and a recirculation system can be calculated by the equations
(5) and (6), respectively. The power consumption of a recirculation pump elpumpP is in the order of 3 to 5 W for a
flow rate of 2 SLPM, as for example the 4002 Series Diaphragm Pump of Gardner Denver Thomas. The stack
power of the purged system elpurgeFCP , was calculated by using average stack voltages due to the decaying voltage
during DEA operation. elrecycleFCP , resulted directly from the humidifier experiment, as described above.
][2, WPPP H
losselpurgeFC
totpurge −= (5)
][, WPPP elpump
elrecycleFC
totrecycle −= (6)
Figure 14 shows the obtained total system power output at different current densities of both the recirculation
system with a 3 W pump and the purged system with a purge interval of 60 s and a purge duration of 100 ms. At
the three different operating points elrecycleFCP , was always slightly higher as el
purgeFCP , due to higher stoichiometry
and more uniform humidification. However, the comparison shows that the total system efficiency of both
systems is similar, which means that the applied purge strategy is comparable to the use of a 3 W pump in a
hydrogen recirculation loop.
At high current densities the purged system loses power due to the big voltage drop, as shown in Figure 5. At
this operating point the stack suffers from the accumulation of excess water in the anode. However, at moderate
current densities at which the stack creates less water, optimal humidification is reached in the purged system.
This improves the voltage and leads to higher efficiencies compared to the recirculation system. Considering that
the purge duration and interval in these experiments are not optimized supports the hypothesis that a purged
system is capable of reaching higher system efficiencies than a recirculation system.
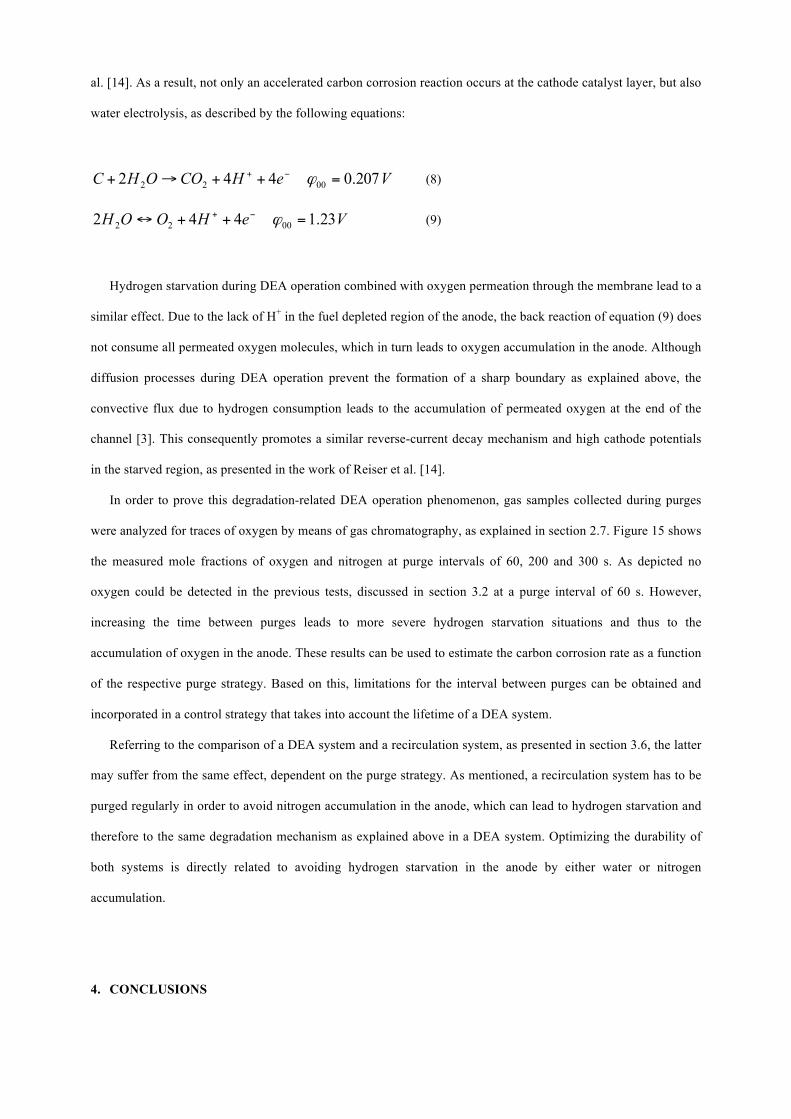
As explained in section 1 space, weight and costs can be saved using a purged system. The hydrogen loss of a
purged system can be translated directly into system cost increase over operation time by equation (7).
[$]2
22
int
tCosttt
RTPM
VCost HopenHH
lossincrease ⋅⋅⋅⎟⎟⎠
⎞⎜⎜⎝
⎛⋅= (7)
The hydrogen cost target from the DOE for 2015 for central production of hydrogen from water electrolysis
using renewable power is 3 $ per gasoline gallon equivalent (gge) [11]. 1 gallon of gasoline happens to be the
energy equivalent of 1 kg of hydrogen [15]. The durability target from the DOE for 2017 for small power systems
and transportation applications is 5000 hours [11]. Feeding these values together with the same purge duration and
interval as above into equation (7) results in a total system cost increase of 0.44 $ after 5000 h. This is far less than
the costs of installing a recirculation loop including the necessary pump. Thus, even though a recirculation system
would run more efficiently in terms of electrical power output as shown at high current densities in Figure 14, a
purged system will always be more cost-efficient for stacks for low power applications, such as the studied one.
The key factors however are the hydrogen flow rate, the power output and the expected lifetime. Hence, large
systems may be more cost-effective and also more efficient in the recirculation mode. Finally even a recirculation
system has to be purged regularly in order to prevent nitrogen accumulation in the anode loop, however the purge
intervals may be in the order of several minutes [2].
Not only performance and efficiency is affected by purged DEA operation but also the durability, which is
highlighted in the following section.
3.7 Degradation Effects During DEA Operation
As explained in section 1, local hydrogen starvation on the anode may lead to corrosion of the carbon support
in the cathode catalyst layer. Corrosion causes the support structure to fall apart and the platinum particles to
agglomerate, which decreases the electrochemically active surface area. The carbon catalyst support itself is
thermodynamically unstable due to its low equilibrium potential of 0.207 V with respect to the reversible
hydrogen electrode (RHE) at 25 ºC. However, at fuel cell potentials below 1 V and temperatures below 100 ºC
these degradation effects are negligible due to the slow thermodynamic reaction kinetics [12]. Nevertheless, short
bursts of high potential transits up to 1.5 V during start-up and shut-down through formation of a H2/Air boundary
in the anode channel can cause severe carbon corrosion, as shown experimentally by Tang et al. [13] and Reiser et
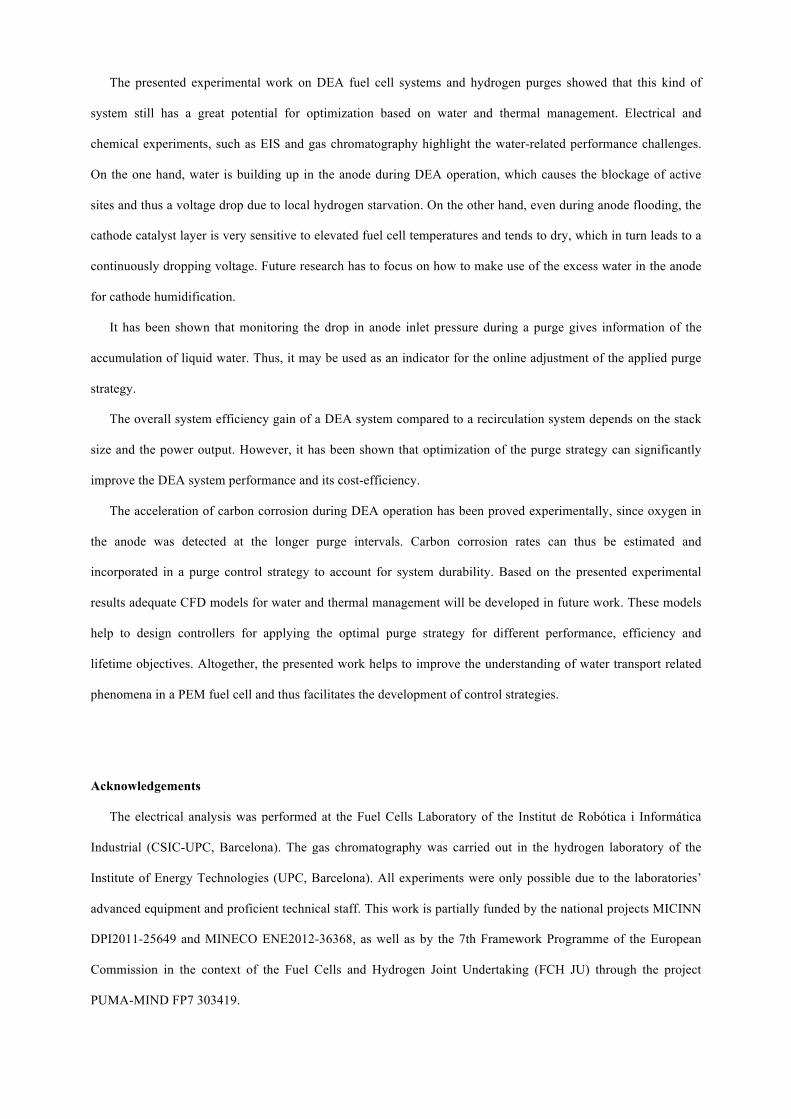
al. [14]. As a result, not only an accelerated carbon corrosion reaction occurs at the cathode catalyst layer, but also
water electrolysis, as described by the following equations:
VeHCOOHC 207.0442 0022 =++→+ −+ ϕ (8)
VeHOOH 23.1442 0022 =++↔ −+ ϕ (9)
Hydrogen starvation during DEA operation combined with oxygen permeation through the membrane lead to a
similar effect. Due to the lack of H+ in the fuel depleted region of the anode, the back reaction of equation (9) does
not consume all permeated oxygen molecules, which in turn leads to oxygen accumulation in the anode. Although
diffusion processes during DEA operation prevent the formation of a sharp boundary as explained above, the
convective flux due to hydrogen consumption leads to the accumulation of permeated oxygen at the end of the
channel [3]. This consequently promotes a similar reverse-current decay mechanism and high cathode potentials
in the starved region, as presented in the work of Reiser et al. [14].
In order to prove this degradation-related DEA operation phenomenon, gas samples collected during purges
were analyzed for traces of oxygen by means of gas chromatography, as explained in section 2.7. Figure 15 shows
the measured mole fractions of oxygen and nitrogen at purge intervals of 60, 200 and 300 s. As depicted no
oxygen could be detected in the previous tests, discussed in section 3.2 at a purge interval of 60 s. However,
increasing the time between purges leads to more severe hydrogen starvation situations and thus to the
accumulation of oxygen in the anode. These results can be used to estimate the carbon corrosion rate as a function
of the respective purge strategy. Based on this, limitations for the interval between purges can be obtained and
incorporated in a control strategy that takes into account the lifetime of a DEA system.
Referring to the comparison of a DEA system and a recirculation system, as presented in section 3.6, the latter
may suffer from the same effect, dependent on the purge strategy. As mentioned, a recirculation system has to be
purged regularly in order to avoid nitrogen accumulation in the anode, which can lead to hydrogen starvation and
therefore to the same degradation mechanism as explained above in a DEA system. Optimizing the durability of
both systems is directly related to avoiding hydrogen starvation in the anode by either water or nitrogen
accumulation.
4. CONCLUSIONS
The presented experimental work on DEA fuel cell systems and hydrogen purges showed that this kind of
system still has a great potential for optimization based on water and thermal management. Electrical and
chemical experiments, such as EIS and gas chromatography highlight the water-related performance challenges.
On the one hand, water is building up in the anode during DEA operation, which causes the blockage of active
sites and thus a voltage drop due to local hydrogen starvation. On the other hand, even during anode flooding, the
cathode catalyst layer is very sensitive to elevated fuel cell temperatures and tends to dry, which in turn leads to a
continuously dropping voltage. Future research has to focus on how to make use of the excess water in the anode
for cathode humidification.
It has been shown that monitoring the drop in anode inlet pressure during a purge gives information of the
accumulation of liquid water. Thus, it may be used as an indicator for the online adjustment of the applied purge
strategy.
The overall system efficiency gain of a DEA system compared to a recirculation system depends on the stack
size and the power output. However, it has been shown that optimization of the purge strategy can significantly
improve the DEA system performance and its cost-efficiency.
The acceleration of carbon corrosion during DEA operation has been proved experimentally, since oxygen in
the anode was detected at the longer purge intervals. Carbon corrosion rates can thus be estimated and
incorporated in a purge control strategy to account for system durability. Based on the presented experimental
results adequate CFD models for water and thermal management will be developed in future work. These models
help to design controllers for applying the optimal purge strategy for different performance, efficiency and
lifetime objectives. Altogether, the presented work helps to improve the understanding of water transport related
phenomena in a PEM fuel cell and thus facilitates the development of control strategies.
Acknowledgements
The electrical analysis was performed at the Fuel Cells Laboratory of the Institut de Robótica i Informática
Industrial (CSIC-UPC, Barcelona). The gas chromatography was carried out in the hydrogen laboratory of the
Institute of Energy Technologies (UPC, Barcelona). All experiments were only possible due to the laboratories’
advanced equipment and proficient technical staff. This work is partially funded by the national projects MICINN
DPI2011-25649 and MINECO ENE2012-36368, as well as by the 7th Framework Programme of the European
Commission in the context of the Fuel Cells and Hydrogen Joint Undertaking (FCH JU) through the project
PUMA-MIND FP7 303419.
References
[1] Hussaini, I. S., Wang, C. Y. (2010). Dynamic water management of polymer electrolyte membrane fuel
cells using intermittent RH control. Journal of Power Sources, 195(12), 3822-3829.
[2] Siegel, J. B., Bohac, S. V., Stefanopoulou, A. G., Yesilyurt, S. (2010). Nitrogen Front Evolution in Purged
Polymer Electrolyte Membrane Fuel Cell with Dead-Ended Anode. Journal of The Electrochemical Society,
157(7), B1081 B1093.
[3] Chen, J., Siegel, J. B., Matsuura, T., Stefanopoulou, A. G. (2011). Carbon Corrosion in PEM Fuel Cell
Dead-Ended Anode Operations. Journal of The Electrochemical Society, 158(9), B1164-B1174.
[4] Chen, J., Siegel, J. B., Stefanopoulou, A. G. (2012). Optimization of purge cycle for dead-ended anode fuel
cell operation. Proceedings of the ASME 2012 6th International Conference on Energy, 1-10.
[5] S. Strahl, A. Husar and M. Serra. (2011). Development and experimental validation of a dynamic thermal
and water distribution model of an open cathode proton exchange membrane fuel cell. Journal of Power
Sources, 196(9), 4251–4263.
[6] Kocha, S. S., Yang, J. D., Yi, J. S. (2006). Characterization of Gas Crossover and Its Implications in PEM
Fuel Cells. American Institue of Chemical Engineers Journal, 52(5), 1916-1925.
[7] A. Husar, S. Strahl and J. Riera. (2012). Experimental characterization methodology for the identification of
voltage losses of PEMFC: Applied to an open cathode stack. International Journal of Hydrogen Energy,
37(8), 7309-7315.
[8] R. O’Hayre, S. Cha, W. Colella and F. B. Prinz. (2009) Fuel cell fundamentals. John Wiley & Sons, Inc.
[9] Ciureanu, M. (2004). Effects of Nafion dehydration in PEM fuel cells. Journal of Applied Electrochemistry,
34, 705-714.
[10] James Larminie and Andrew Dicks. (2003). Fuel cell systems explained. John Wiley & Sons, Inc.
[11] Hydrogen, Fuel Cells & Infrastructure Technologies Program, US Department of Energy, Office of Energy
Efficiency and Renewable Energy, Multi-Year Research, Development and ���Demonstration Plan (2012).
http://www1.eere.energy.gov/hydrogenandfuelcells/mypp/.
[12] Maass, S., Finsterwalder, F., Frank, G., Hartmann, R., Merten, C. (2008). Carbon support oxidation in PEM
fuel cell cathodes. Journal of Power Sources, 176(2), 444-451.

[13] Tang, H., Qi, Z., Ramani, M., Elter, J. F. (2006). PEM fuel cell cathode carbon corrosion due to the
formation of air/fuel boundary at the anode. Journal of Power Sources, 158(2), 1306-1312.
[14] Reiser, C. A., Bregoli, L., Patterson, T. W., Yi, J. S., Yang, J. D., Perry, M. L., Jarvi, T. D. (2005). A
reverse-current decay mechanism for fuel cells. Electrochemical and Solid-State Letters, 8(6), A273-A276.
[15] F. Barbir, PEM Fuel Cells: Theory and Practice, Elsevier Academic Press, 2005.
LIST OF FIGURE CAPTIONS
Figure 1: Comparison of EIS data before and after anode humidification at 0.04 Acm-2.
Figure 2: Electrolyte distribution on carbon support and between catalyst particles [10].
Figure 3: Comparison of EIS data before, during and after DEA operation at 0.04 Acm-2. The legend refers to
numbers in the schematic of the stack voltage transient.
Figure 4: Comparison of EIS data at the beginning and the end of the experiment (5h) at 0.04 Acm-2.
Figure 5: Comparison of stack voltages at different current densities during DEA operation and 100 ms purges
every 60 s.
Figure 6: Mole fractions of nitrogen and hydrogen in the sample volume collected during 10 purges of 100 ms
each as a function of current density.
Figure 7: Selected cell voltages and stack temperature after a current step from 0.22 to 0.27 Acm-2.
Figure 8: Stack voltage, stack temperature, anode inlet pressure and cathode inlet air velocity during a change in
the stack temperature from 50 to 60 ºC at a constant current density of 0.2 Acm-2.
Figure 9: Selected cell voltages, stack temperature and cathode inlet air velocity during a change in the stack
temperature from 27 to 50 ºC at a constant current density of 0.2 Acm-2.
Figure 10: Comparison of EIS data at 50 and 55 ºC at a constant current density of 0.2 Acm-2.
Figure 11: Comparison of Bode phase plots of EIS data at 50 and 55 ºC at 0.2 Acm-2.
Figure 12: Comparison of average activation overvoltage per cell at 50 and 55 ºC at steady-state operating points
at 0.2 Acm-2.

Figure 13: Anode inlet pressure during purges at 0.2 Acm-2 (5A), flooded and dry operating conditions.
Figure 14: Comparison between a recirculation system and a purged system in terms of total system power output
at different current densities.
Figure 15: Mole fractions of oxygen and nitrogen in the sample volume collected during 10 purges of 100 ms each
at different purge intervals and a current density of 0.09 Acm-2.
LIST OF FIGURES
Figure 1:
Figure 2:
Figure 3:
74 Fuel Cell Systems Explained
Figure 4.7 Simplified and idealised structure of a PEM fuel cell electrode.
Main bulk of theelectrolyte
A thin layer ofelectrolyte alsoreaches the catalyst,promoting the three-phasecontact betweenelectrolyte, reactantgas, and electrodecatalyst.
Figure 4.8 Enlargement of part of Figure 4.7, showing that the electrolyte reaches out to thecatalyst particles.
compare the performance of cells using these three materials under different levels ofcompression. Carbon cloths are thicker, and so will absorb a little more water, and alsosimplify mechanical assembly, since they will fill small gaps and irregularities in bipolarplate manufacture and assembly. On the other hand, they will slightly expand out intothe gas diffusion channels on the bipolar plates, which may be significant if these havebeen made very shallow, as will be the case in a very thin design. In the case of the verylow power small PEMFCs to be discussed in Sections 4.4 and 4.5, even thicker materials
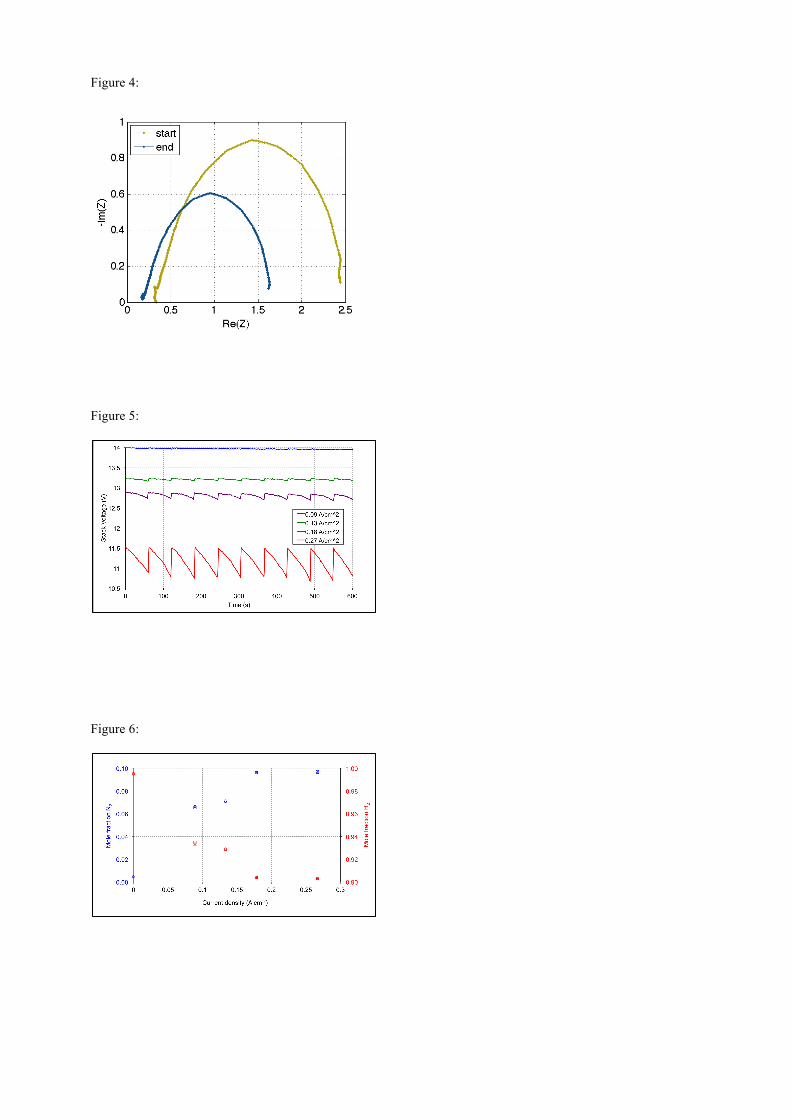
Figure 4:
Figure 5:
Figure 6:
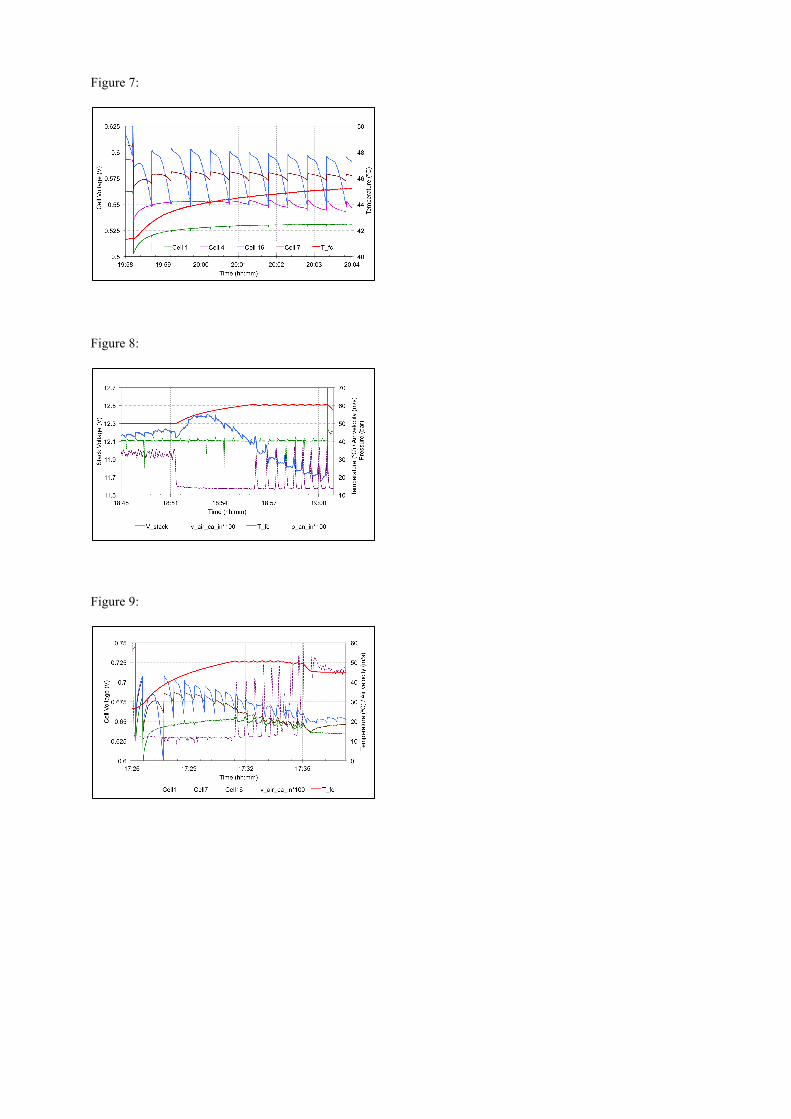
Figure 7:
Figure 8:
Figure 9:

Figure 10:
Figure 11:

Figure 12:
Figure 13:
Figure 14:
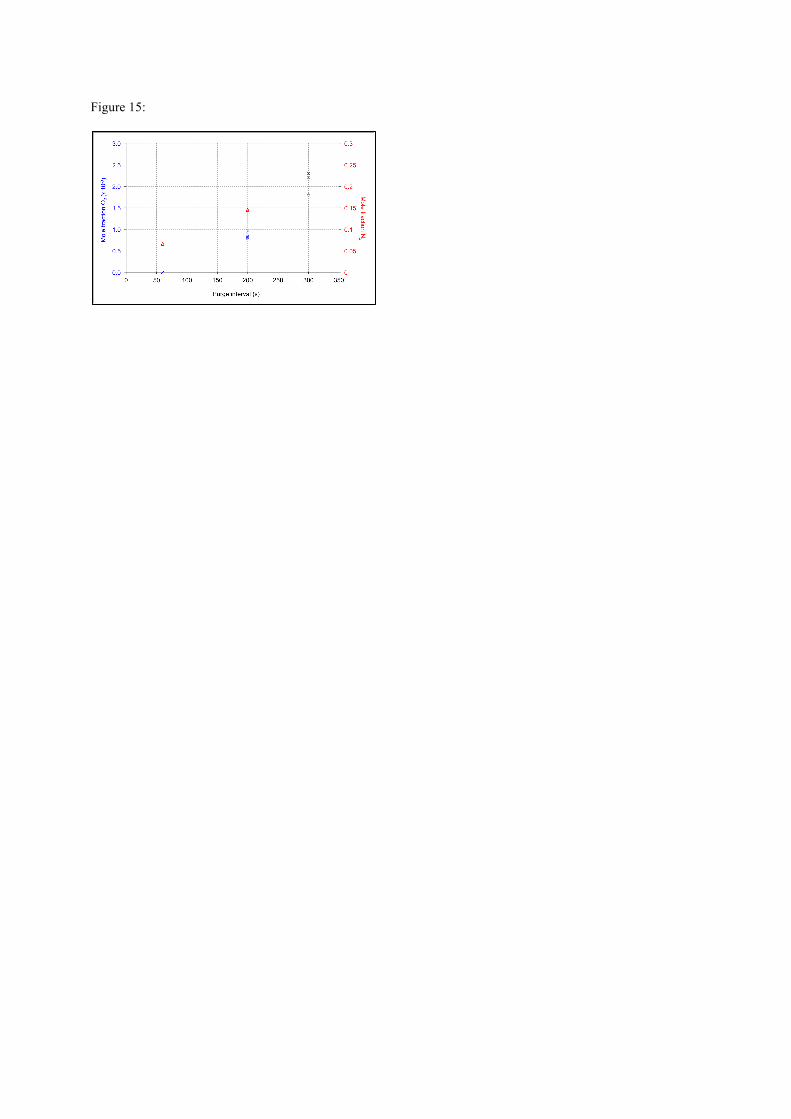
Figure 15: