EXPERIMENTAL STUDY OF FLOW CHARACTERISTICS OVER …
12
JOURNAL OF SCIECNCE TECHNOLOGY AND EDUCATION 9 (2), JUNE, 2021 ISSN: 2277-0011; Journal homepage: www.atbuftejoste.com *Corresponding author: Tanimu, B. [email protected] Department of Water Resources and Environmental Engineering, Ahmadu Bello University, Zaria. © 2021 Faculty of Technology Education, ATBU Bauchi. All rights reserved 246 Experimental Study of Flow Characteristics Over Single Step Broad Crested Weir Bashir Tanimu 1* , Aliyu Bamaiyi Usman 1 , Al-Amin Danladi Bello 1 , Surajo Abubakar Wada 2 , Khalid Sulaiman 1 1 Department of Water Resources and Environmental Engineering, 2 Department of Civil Engineering, Faculty of Engineering, Ahmadu Bello University, Zaria. ABSTRACT Weirs are hydraulic structures built across channels to raise the depth of water across irrigation channels and also to vary the channels flow characteristics making it easier to measure discharge rate of flow. This study analyzed the parameters that have effect on the steps and its shape to influence the flow characteristics such as coefficient of discharge, height, velocity etc. An empirical relations for discharge coefficient ( ) and flow rate due to these changes were derived. The results showed that the weir model with = 0.167 produce a higher compared with other weir models of different configuration of constant round nose radius. At the end of the analysis, two model equations were obtained, the first model was used to estimate the flow rate over the weir models, the second was to estimate the in terms of ratios of weir height ( ) and round nose radius ( ).The model results obtained can be used to design a prototype weirs of desired coefficient of discharge. INTRODUCTION Weirs can be defined as an overflow strucures used in irrigation canal, river etc for measuring flow, diversion of flow and also in conrol of discharge sometimes. They are designed for free flow conditions and usually placed at right angle to the flow direction. A normal linear weir is used commonly in irrigation canal and also for diversion purpose which raises the water level upstream (Egnew, 2011). More over, weirs can also be used in make rivers more navigable and prevention of flooding (Sunderland, 2014). According to Sharp (2014), there are mainly two types of weirs based on their function and appearance. Sharp crested weirs and broad crested. Sharp crested weirs are mainly applied in measuring discharge in small water bodies and canal and are thin plate while broad crested weirs usually made from wood or reinforced concrete and used for measuring high flow discharges. The depth of water flowing in the channel through the notch correlate to the discharge in the channel (Cruise, 2007). Furthermore, the discharge may also be influenced by the crest configuration. A quarter round broad crested weirs may give higher discharge for a given head than a sharp crested weir; a half round broad crested weir may give better discharge than the quarter round broad crested weir or sharp crested weir (Tingey, 2011). Salmasi et al (2012) study Discharge Relations for Rectangular Broad-Crested Weirs. Series of experiments were conducted in the laboratory to examine the influence of widths of lower weir crest and height of a step of broad crested weir with compound cross section on the values of coefficient of discharge (Cd). They concluded that the values Cd obtained from the compound broad crested weir experiment are lower than those of broad crested weir having rectangular cross section. This is due to the contraction effects in compound weirs. ARTICLE INFO Article History Received: December, 2020 Received in revised form: January, 2020 Accepted: March, 2021 Published online: June, 2021 KEYWORDS Weirs, flumes, coefficient of discharge, upstream and downstream
Transcript of EXPERIMENTAL STUDY OF FLOW CHARACTERISTICS OVER …

JOURNAL OF SCIECNCE TECHNOLOGY AND EDUCATION 9 (2), JUNE, 2021 ISSN: 2277-0011; Journal homepage: www.atbuftejoste.com
*Corresponding author: Tanimu, B. [email protected] Department of Water Resources and Environmental Engineering, Ahmadu Bello University, Zaria. © 2021 Faculty of Technology Education, ATBU Bauchi. All rights reserved
246
Experimental Study of Flow Characteristics Over Single Step Broad Crested Weir Bashir Tanimu1*, Aliyu Bamaiyi Usman1, Al-Amin Danladi Bello1, Surajo Abubakar Wada2, Khalid Sulaiman1 1Department of Water Resources and Environmental Engineering, 2Department of Civil Engineering, Faculty of Engineering, Ahmadu Bello University, Zaria.
ABSTRACT Weirs are hydraulic structures built across channels to raise the depth of water across irrigation channels and also to vary the channels flow characteristics making it easier to measure discharge rate of flow. This study analyzed the parameters that have effect on the steps and its shape to influence the flow characteristics such as coefficient of discharge, height, velocity etc. An empirical relations for discharge
coefficient (��) and flow rate due to these changes were derived. The
results showed that the weir model with ���� = 0.167 produce a higher
�� compared with other weir models of different configuration of constant round nose radius. At the end of the analysis, two model equations were obtained, the first model was used to estimate the flow rate over the weir models, the second was to estimate the �� in terms
of ratios of weir height (���) and round nose radius (
����).The model
results obtained can be used to design a prototype weirs of desired coefficient of discharge. INTRODUCTION
Weirs can be defined as an overflow strucures used in irrigation canal, river etc for measuring flow, diversion of flow and also in conrol of discharge sometimes. They are designed for free flow conditions and usually placed at right angle to the flow direction. A normal linear weir is used commonly in irrigation canal and also for diversion purpose which raises the water level upstream (Egnew, 2011). More over, weirs can also be used in make rivers more navigable and prevention of flooding (Sunderland, 2014).
According to Sharp (2014), there are mainly two types of weirs based on their function and appearance. Sharp crested weirs and broad crested. Sharp crested weirs are mainly applied in measuring discharge in small water bodies and canal and are thin plate while broad crested weirs usually made from wood or reinforced concrete and used for measuring high flow discharges. The depth of water flowing in the channel through the
notch correlate to the discharge in the channel (Cruise, 2007).
Furthermore, the discharge may also be influenced by the crest configuration. A quarter round broad crested weirs may give higher discharge for a given head than a sharp crested weir; a half round broad crested weir may give better discharge than the quarter round broad crested weir or sharp crested weir (Tingey, 2011). Salmasi et al (2012) study Discharge Relations for Rectangular Broad-Crested Weirs. Series of experiments were conducted in the laboratory to examine the influence of widths of lower weir crest and height of a step of broad crested weir with compound cross section on the values of coefficient of discharge (Cd). They concluded that the values Cd obtained from the compound broad crested weir experiment are lower than those of broad crested weir having rectangular cross section. This is due to the contraction effects in compound weirs.
ARTICLE INFO Article History Received: December, 2020 Received in revised form: January, 2020 Accepted: March, 2021 Published online: June, 2021 KEYWORDS Weirs, flumes, coefficient of discharge, upstream and downstream

JOURNAL OF SCIECNCE TECHNOLOGY AND EDUCATION 9 (2), JUNE, 2021 ISSN: 2277-0011; Journal homepage: www.atbuftejoste.com
*Corresponding author: Tanimu, B. [email protected] Department of Water Resources and Environmental Engineering, Ahmadu Bello University, Zaria. © 2021 Faculty of Technology Education, ATBU Bauchi. All rights reserved
247
Mujahid et al (2012) study the hydraulic performance of flow under the normal and inclined compound crested weir experimentally, they varied the weir crest radius R= 2.5cm, 3.5cm and 4.5cm, as well as the angle weir angles α=300, 450, 600 and 900 but maintaining a constant height of P=15cm for all the models. They found that the
increase in ratio of ��leads to increase in
coefficient of discharge. For compound sharp-crested weirs
(Rectangular-Triangular weir), the discharge coefficient decreases as both notch angles and cascading widths of the rectangular section are increased (Mujahid & Argungu, 2014). Jahad et al (2016) study Energy dissipation and geometry effects over stepped spillways. They fabricated four models in order to evaluate the impact of addition of end sills with a quarter circle shapes at the step edges. They concluded that the radius of the endsills and number of steps are more effective parameters in energy dissipation and also step number has greater effect that the step height for napped flow. For broad-crested oblique weir (Semi-circular), the weir performs best when the angle of inclination (oblique angle) is 15° with the crest radius being 5cm (Abdullahi, 2014).
Chinnarasri et al (2008) performed an experimental study of hydraulic characteristics over gabion stepped weirs. They that gabion stepped weirs were better in energy dissipation by about 7-14% than the corresponding horizontal stepped weir. However, they did not consider the discharge coefficient Al-Hashim et al (2018) study “Determination of Discharge Coefficient of Rectangular Broad-Crested Weir by CFD” In their study, The performance of broad crested weir was assess by varying an upstream face slope from 900 to 230 degree in order to reduce the effect of flow separation. They concluded that the coefficient of discharge tends to increase with decrease in upstream weir slope. Thus weirs with upstream face slopes 900 have the smallest and 230 has largest discharge coefficient. Altalib (2021) study Coefficient of Discharge for flow over Al-Shalalat stepped weir on Al-Khusr River. He uses the calculated discharge for daily rainstorm for the period of (2000-2018) data, then predicted a coefficient of discharge equation and predicted
coefficient of discharge using statistical tools and compare the equation obtained with the previous studies available. The study shows there is good agreement between their equations.
Hussein et al (2009) study flow characteristics and energy dissipation over stepped round nosed broad-crested weirs. The authors vary the weir models by reducing the downstream height of the weir to provide a different performance. The height of the downstream step was vary several times, while length of the downstream step was fixed. The results obtained showed the energy dissipation rate increased by 46% with reduction in downstream height of the weir. Moreover, the discharge coefficient were also improved as the values obtained are higher compared with that of traditional weirs.
Hussein et al (2011) also investigated the effects of changing the step geometry on the flow characteristics and energy dissipation downstream of the stepped weir by changing the downstream step length and fixing downstream step height. The experimental results showed that when the ratio of the length of the downstream step (L2) to the length of the weir (L1) equals 0.5 gives higher energy dissipation and over single step weirs there are two parts of flow, in the first part the flow is gradually-varied flow while in the second part the flow is rapidly-varied flow.
In the light of Hussein et al (2011), this study investigates the effects of changing the geometry of step on coefficient of discharge and flow characteristics of a single stepped weir by introducing two additional D/S round-noses before the step and after the step. THEORETICAL ANALYSIS
Seven models were fabricated from thermo-stone and painted to avoid swelling and decrease in surface roughness. But one of the models was a block (traditional) round-nosed broad-crested weir, it has a length 48cm, 50cm wide and 12cm height with 6cm radius of the round-nose. The remaining four models involved have dimensions of the weir with D/S stepped
height � = 6cm and D/S lengths � = 12, 18, 24 and 30cm. While the last two model’s length of the weirs was increased to 54 and 60cm with D/S lengths 30 and 36cm respectively
JOURNAL OF SCIECNCE TECHNOLOGY AND EDUCATION 9 (2), JUNE, 2021 ISSN: 2277-0011; Journal homepage: www.atbuftejoste.com
*Corresponding author: Tanimu, B. [email protected] Department of Water Resources and Environmental Engineering, Ahmadu Bello University, Zaria. © 2021 Faculty of Technology Education, ATBU Bauchi. All rights reserved
248
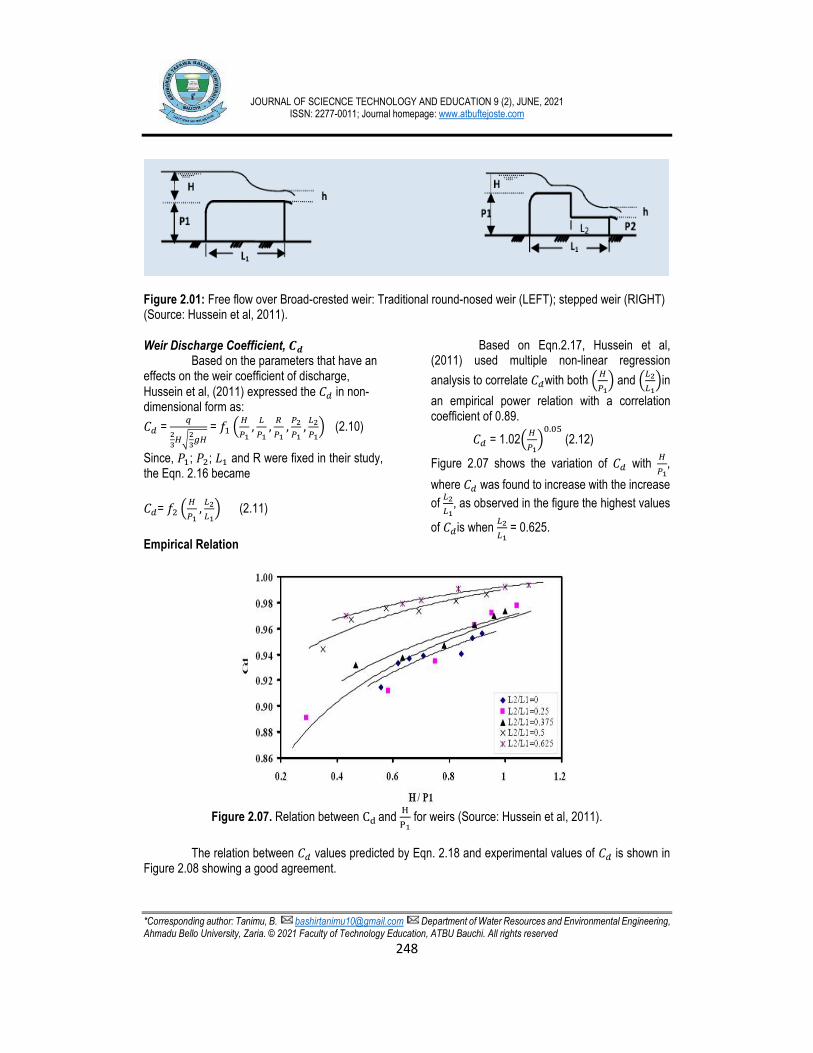
Figure 2.01: Free flow over Broad-crested weir: Traditional round-nosed weir (LEFT); stepped weir (RIGHT) (Source: Hussein et al, 2011).
Weir Discharge Coefficient, ��
Based on the parameters that have an effects on the weir coefficient of discharge,
Hussein et al, (2011) expressed the �� in non-dimensional form as:
�� = �
�����
��� = �� �
�� , ��� , �
�� , ���� , ��
��� (2.10)
Since, ��; � ; �� and R were fixed in their study, the Eqn. 2.16 became
��= � ��� , ��
��� (2.11)
Empirical Relation
Based on Eqn.2.17, Hussein et al, (2011) used multiple non-linear regression
analysis to correlate ��with both ���� and ��
���in
an empirical power relation with a correlation coefficient of 0.89.
�� = 1.02 �����.�� (2.12)
Figure 2.07 shows the variation of �� with ���,
where �� was found to increase with the increase
of ����, as observed in the figure the highest values
of �� is when ���� = 0.625.
Figure 2.07. Relation between C� and ��� for weirs (Source: Hussein et al, 2011).
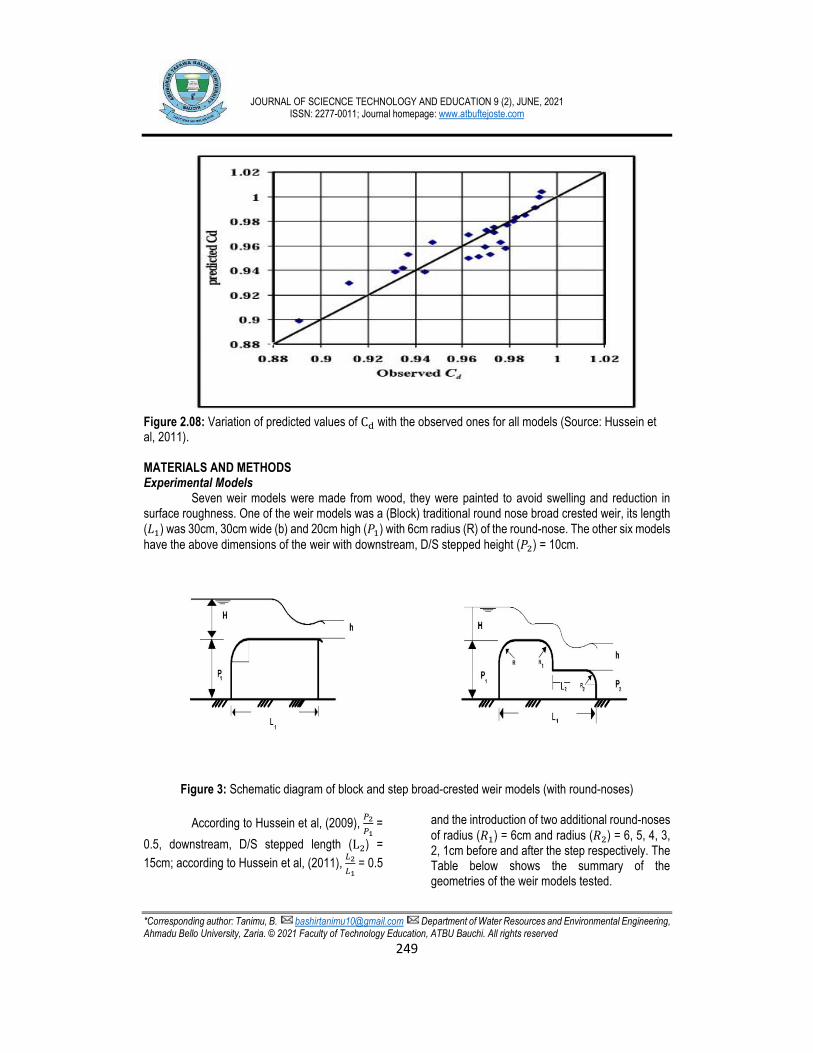
The relation between �� values predicted by Eqn. 2.18 and experimental values of �� is shown in
Figure 2.08 showing a good agreement.
JOURNAL OF SCIECNCE TECHNOLOGY AND EDUCATION 9 (2), JUNE, 2021 ISSN: 2277-0011; Journal homepage: www.atbuftejoste.com
*Corresponding author: Tanimu, B. [email protected] Department of Water Resources and Environmental Engineering, Ahmadu Bello University, Zaria. © 2021 Faculty of Technology Education, ATBU Bauchi. All rights reserved
249
Figure 2.08: Variation of predicted values of C� with the observed ones for all models (Source: Hussein et al, 2011). MATERIALS AND METHODS Experimental Models
Seven weir models were made from wood, they were painted to avoid swelling and reduction in surface roughness. One of the weir models was a (Block) traditional round nose broad crested weir, its length (��) was 30cm, 30cm wide (b) and 20cm high (��) with 6cm radius (R) of the round-nose. The other six models
have the above dimensions of the weir with downstream, D/S stepped height (� ) = 10cm.
Figure 3: Schematic diagram of block and step broad-crested weir models (with round-noses)
According to Hussein et al, (2009), ���� =
0.5, downstream, D/S stepped length (L ) =
15cm; according to Hussein et al, (2011), ���� = 0.5
and the introduction of two additional round-noses
of radius (!�) = 6cm and radius (! ) = 6, 5, 4, 3, 2, 1cm before and after the step respectively. The Table below shows the summary of the geometries of the weir models tested.

JOURNAL OF SCIECNCE TECHNOLOGY AND EDUCATION 9 (2), JUNE, 2021 ISSN: 2277-0011; Journal homepage: www.atbuftejoste.com
*Corresponding author: Tanimu, B. [email protected] Department of Water Resources and Environmental Engineering, Ahmadu Bello University, Zaria. © 2021 Faculty of Technology Education, ATBU Bauchi. All rights reserved
250
Table 3.0: Dimensions of weir models tested.
Model No.
"# (cm)
"$ (cm)
%# (cm)
%$ (cm)
R (cm)
&# (cm)
&$ (cm)
&$&#
1 30 –– 20 –– 6 –– –– ––
2 30 15 20 10 6 6 6 1.000
3 30 15 20 10 6 6 5 0.833
4 30 15 20 10 6 6 4 0.667
5 30 15 20 10 6 6 3 0.500
6 30 15 20 10 6 6 2 0.333
7 30 15 20 10 6 6 1 0.167
Experimental set up
The experiment was conducted in the Department of Water Resources and Environmental Engineering, Hydraulic laboratory ABU Zaria. The rectangular flume was leveled horizontally and then the weir model set at right angle to the direction of flow was installed at 3m from the inlet channel as suggested by Munta, (2010) and glued within the walls of the flume in order to prevent leakage of water at the walls of the flume. Water from the flume storage tank was then pumped to the flume main channel by a centrifugal pump through a pipe of 150mm which was regulated by a valve. As water overflows the weir model’s crest, it was allowed to flow till the
flow became steady before any measurement was taken. At steady state, the upstream, the upstream (U/S) water head above the weir crest (H) and downstream, D/S water head (h) were measured using the point gauge; also the mass flow rate passing over the model was determined using the weighing scale and the stop watch; Seven different discharges were passed over each model and the heights of water over specific grid points were measured in order to determine the upstream surface profile. The above procedure was then repeated for the rest of the weir models (Seven weir models were tested in total) as shown in the plates below
Plate I: Block Model Plate II: Model with &$ = 1cm

JOURNAL OF SCIECNCE TECHNOLOGY AND EDUCATION 9 (2), JUNE, 2021 ISSN: 2277-0011; Journal homepage: www.atbuftejoste.com
*Corresponding author: Tanimu, B. [email protected] Department of Water Resources and Environmental Engineering, Ahmadu Bello University, Zaria. © 2021 Faculty of Technology Education, ATBU Bauchi. All rights reserved
251
Plate III: Model with &$= 2cm Plate IV: Model with &$= 3cm
Plate V: Model with &$ = 4cm Plate VI: Model with &$ = 5cm
Plate VII: Model with &$ = 6cm

JOURNAL OF SCIECNCE TECHNOLOGY AND EDUCATION 9 (2), JUNE, 2021 ISSN: 2277-0011; Journal homepage: www.atbuftejoste.com
*Corresponding author: Tanimu, B. [email protected] Department of Water Resources and Environmental Engineering, Ahmadu Bello University, Zaria. © 2021 Faculty of Technology Education, ATBU Bauchi. All rights reserved
252
DETERMINATION OF WEIR DISCHARGE Since the physical models are
considered as a rectangular broad crested weir, the proposed theoretical equation for the step broad-crested weirs was initially assumed to be the basic equation developed for the linear weirs according to Chow (1959), expressed as Equation (3.01)
Q = �� 'Hb�
' () (3.01)
The actual/experimental discharge of
the weir model was determined by gravimetric method with the aid of a weighing scale and stop watch. In this method, the mass of the water that flows over the weir models was determined directly from the weighing scale on which a container that collects water from the flume was mounted; which was then converted to volumetric unit as follows as shown in Equations 3.02
*+,- = .
/.-012 (3.02)
Where, volume = ./
To determine the theoretical discharge Equation 3.03 was used
*-34= 'Hb�
' () (3.03)
The experimental discharge coefficient,
�� , has been taken as the ratio of the actual
discharge, *+,-, to the theoretical discharge *-34given by:
�� = 5067
5789: (3.04)
Basically, the general form of the
discharge equation for broad-crested weir is given as:
Q = �� 'Hb�
' () (3.05)
Where Q is the actual discharge of the
weir model, that is *+,- .
Q = K)�� where, ; =
' �� b� ' ( and n =
' , then
the above Eqn. 3.05 becomes
Q = K)= By simplifying the above equation taking log of both sides, then it becomes
log Q = log K + nlog H
Plotting a graph of log Q against log H, n is the slope and log K is the intercept. DETERMINATION OF ACTUAL WEIR DISCHARGE COEFFICIENT USING DIMENSIONAL ANALYSIS
The parameters that influence the weir coefficient of discharge can be selected and expressed as flows:
�� (q, H, ��, � , ��, � , R, !�, ! , g) = 0 (3.09)
The parameters in Eqn. 3.08. Expressed in non-dimensional form as
�� = �
�����
��� = � �
�� , ���� , ��
�� , ���� , ��
�� , ���� (3.10)
Since, ��, � , ��, � , R and !� are fixed in this study, then Eqn.3.09 can be expressed as:
�� = �' ��� , ��
��� (3.11)
COMPUTATION OF WATER SURFACE PROFILE
Water surface profile is defined as the measurement of flow depth as the depth of flow changes longitudinally. Over the weirs models, there are two flow paths. In the upstream path the flow is gradually-varied flow while in the downstream path the flow is rapidly-varied flow (Hussein et al, 2011).
The classic differential equation for gradually-varied flow in open channels as given by Chow, (1959) and Venutelli, (2004) is given below:
�>�? = @: A @B
�A C5�D �E�⁄ (3.15)
RESULTS AND DISCUSSION
Forty-nine experiments were conducted to determine the flow parameters; namely water

JOURNAL OF SCIECNCE TECHNOLOGY AND EDUCATION 9 (2), JUNE, 2021 ISSN: 2277-0011; Journal homepage: www.atbuftejoste.com
*Corresponding author: Tanimu, B. [email protected] Department of Water Resources and Environmental Engineering, Ahmadu Bello University, Zaria. © 2021 Faculty of Technology Education, ATBU Bauchi. All rights reserved
253
surface profile, U/S water head above the weir crest “H”, D/S water head “h”, actual discharge*+,-, theoretical discharge *-34 ,
discharge coefficient �� WATER SURFACE PROFILE
The graph in Figure 4.01 illustrates the water surface profile upstream of the weir using the measured water depth for seven various
discharges *�to*G (5.42 to 11.63litres per second).The abscissa of the graph represents the distance from the weir while the ordinate represents the water height from the bottom of the channel. As can be seen from the graph, the water surface is almost uniform after 50cm from the weir. So as stated in Section 3.1.3, in order to be on the safe side, the point gauge was located 60cm upstream from the weir.
Figure 4.01: Water Surface Profile for various Discharges FLOW REGIMES
The three flow regimes namely Nappe flow, Transition flow and Skimming flow were all observed during the experimental work. At smaller discharges where the step height is higher than depth of flow a free falling napped was observed. Transition flow occur at intermediate discharges where the depth of flow is close to step height, no free falling of flow and the water surface is rising and undulating. While for Skimming flow at higher discharges, the depth of flow is higher than the step height so the step has submerged (immerse completely) below strong current. NUMERICAL MODELLING OF FLOW RATE AND DISCHARGE COEFFICIENT From the following expressions below:
Q = k)= (14)
�� = α H%#�I &$
&#�J (15)
Equation 15 shows the non-linear
variation of E% with H
%#and���� which can be used
to determine the energy dissipation percent of any of the step broad-crested weir models. The parameters of the above equations that is k and n in eqn.14, α, β and γ in eqn.15 were determined using regression analysis. At the end of the regression analysis, the values of these parameters were found
Coefficient of Discharge ��”
Table 4.02 to 4.10 show variation of ��
with H P�M for the Block model and the
stepped models with ! = 1cm, 2cm 3cm, 4cm, 5cm 6cm. Hence, the following were
observed from the graphs of Cd against H P�M
below:
21
22
23
24
25
26
27
28
29
0 15 30 45 60 75 90 105 120 135 150 165 180 195 210 225 240 255 270 285 300
Hei
gh
t o
f w
ate
r fr
om
th
e b
ott
om
of
the
cha
nn
el (
cm)
Distance from the weir upstream (cm)
Q
₁Q
₂Q
₃Q
₄Q
₅

JOURNAL OF SCIECNCE TECHNOLOGY AND EDUCATION 9 (2), JUNE, 2021 ISSN: 2277-0011; Journal homepage: www.atbuftejoste.com
*Corresponding author: Tanimu, B. [email protected] Department of Water Resources and Environmental Engineering, Ahmadu Bello University, Zaria. © 2021 Faculty of Technology Education, ATBU Bauchi. All rights reserved
254
Figure 4.02: Variation of ��with ��� for Block and
Step Broad-crested weir (! = 1cm) The above figure, shows that the
coefficient of discharges of the step broad-crested
weir (! = 1cm) are higher than those of the Block model, which is technically due to the step
introduced which reduces the surface area for flow, hence, effect of friction between the fluid and weir surface. Subsequently, less pronounced as in the Block model. The introduction of the two round-noses increases the velocity due to streamline curvature, resulting to increase in the coefficient of discharge.
Figure 4.03: Variation of C� with ��� for Models (R = 2cm and 3cm)
For the second model (Fig. 4.03), the
coefficient of discharges of the model (! = 2cm)
are higher than those of model (!' = 3cm). As it
was also observed from their respective ��+Z� ;
0.964 and 0.918. This is because the model with
!' = 3cm has higher surface area of flow at the D/S round-nose, making the friction between the
fluid and the surface more pronounced, hence, reducing the discharges of the model (! = 3cm). Figure 4.04, showed the coefficient of discharges
of the model (! = 4cm) are higher than those of model (! = 5cm and ! = 6cm). This is because
the model with ! = 5cm and 6cm have higher surface area of flow at the D/S round-nose,
0
0.2
0.4
0.6
0.8
1
1.2
1.4
1.6
1.8
2
0.15 0.2 0.25 0.3 0.35 0.4 0.45 0.5
Cd
H/P1
R2/R1 = 0.333
R2/R1 = 0.500
0
0.2
0.4
0.6
0.8
1
1.2
1.4
1.6
1.8
2
0.15 0.25 0.35 0.45 0.55
Cd
H/P1
BLOCK R2/R1 = 0.167

JOURNAL OF SCIECNCE TECHNOLOGY AND EDUCATION 9 (2), JUNE, 2021 ISSN: 2277-0011; Journal homepage: www.atbuftejoste.com
*Corresponding author: Tanimu, B. [email protected] Department of Water Resources and Environmental Engineering, Ahmadu Bello University, Zaria. © 2021 Faculty of Technology Education, ATBU Bauchi. All rights reserved
255
making the friction between the fluid and the surface more pronounced, hence, reducing the discharges of the model (! = 5cm and 6cm).
Figure 4.04: Variation of C� with ��� for Models (R = 4cm, 5cm, 6cm)
The combined variation of ��with ��� for
all the weir models, indicated that the discharge
coefficient “��” decreases with increase in ���,
which means that the ��decreases as ����
increases. It implies that the radius of the D/S round-nose (! ) increases. As stated earlier, this
is technically due to the fact that as ���� increases,
the surface area of flow at the D/S round-nose is also increasing, hence, the friction between the
fluid and surface at the D/S round-nose increases. Thus, decreasing the coefficient of discharge “��”. The coefficients of discharges achieved were higher than those achieved by Hussein et al (2011) in their investigation by 10.63%. More so,
the �� values obtained were higher than the
��values of the traditional (Block) broad-crested weir by 14.78%. This is to say that introduction of round-noses at U/S and D/S of the step broad-crested weir will improve the coefficient of
discharges “��”.
Figure 4.05: Variation of C� with ��� for all the weir models
0
0.2
0.4
0.6
0.8
1
1.2
1.4
1.6
1.8
2
0.15 0.2 0.25 0.3 0.35 0.4 0.45
Cd
H/P1
R2/R1 = 0.667 R2/R1 = 0.833
R2/R1 = 1.000
0.7
0.75
0.8
0.85
0.9
0.95
1
1.05
1.1
1.15
1.2
0.15 0.2 0.25 0.3 0.35 0.4 0.45 0.5 0.55
Cd
H/P1
BLOCK
R2/R1 = 0.167
R2/R1 = 0.333
R2/R1 = 0.500
R2/R1 = 0.667
R2/R1 = 0.833
R2/R1 = 1.000

JOURNAL OF SCIECNCE TECHNOLOGY AND EDUCATION 9 (2), JUNE, 2021 ISSN: 2277-0011; Journal homepage: www.atbuftejoste.com
*Corresponding author: Tanimu, B. [email protected] Department of Water Resources and Environmental Engineering, Ahmadu Bello University, Zaria. © 2021 Faculty of Technology Education, ATBU Bauchi. All rights reserved
256
The Developed Model Equations The parameters of Equations (4.01) and
(4.02), were obtained using a statistical package
analysis. Correlation coefficient (! ) is an indicator of how reliable the regression model is.
Eqn. (4.01) has ! of 0.788, this means that 78.8% of the variation in the observed values of the dependent variable is explained by the model, and 21.2% of these differences remain unexplained in the error (residual) term. Similarly,
Eqn. 4.02 has ! value of 0.895 and maximum error of 0.105 for predicting the discharge
coefficient ��.
Q = 0.462)�. [\ (4.04)
Equation (4.04) is the discharge-head relationship which can be used to calculate the flow rate over the step broad-crested weir. Considering equation. 4.02, multiple non-linear regression analysis was applied to correlate
��with both H
%# and &$&# in an empirical power
relation.
�� = 0.0437 H%#�A�.�]^G &$
&#�A�.^\^] (4.05)
The correlation between �� values
predicted by eqn 4.05 and experimental values of �� is plotted in figure 4.17 showing a good agreement between the two data.
Figure 4.17: Variation of predicted values of C� with the observed values for all weir models
CONCLUSION
Within the scope of the study and the analysis of the results obtained, the following conclusions are summarized as follows:
1. Stepping and introducing round-nose at U/S and D/S of the broad–crested weirs will increase the discharge coefficient;
resulting to higher �� values compared to those of the traditional weir by 14.78%.
2. The coefficient of discharge
��decreases as the ratio ���� increases.
Thus the value of the weir model ratio
���� = 0.167 gives a higher �� when
compare with the other weir models. 3. Flow regimes were observed, Nappe flow
at small discharges, Transition flow at intermediate discharges and Skimming flow at large discharges
4. Considering the results obtained in this study, the efficiency of the weir can be improved by stepping and varying the weir sections.
0.94
0.96
0.98
1
1.02
1.04
1.06
1.08
1.1
1.12
0.6 0.7 0.8 0.9 1 1.1 1.2
Pre
dic
ted
Cd
Observed Cd

JOURNAL OF SCIECNCE TECHNOLOGY AND EDUCATION 9 (2), JUNE, 2021 ISSN: 2277-0011; Journal homepage: www.atbuftejoste.com
*Corresponding author: Tanimu, B. [email protected] Department of Water Resources and Environmental Engineering, Ahmadu Bello University, Zaria. © 2021 Faculty of Technology Education, ATBU Bauchi. All rights reserved
257
REFERENCES Abdullahi U (2014); “Experimental Investigation
of Flow Characteristics Over Semi-Circular Broad Crested Weir Models” M.sc Thesis, Department of Water Resources and Environmental Engineering, Ahmadu Bello University, Zaria.
Cruise, James F., and M. M. Sheriff. Elementary Hydraulics. Toronto, Ont.: Thomson/Nelson, 2007 Dissipaters", Dam Energy, Vol.11, No.4, PP. 205-242
Claydon, John F., “Broad Crested Weir.” Broad Crested Weir. Web. 18 Nov. 2014. http://www.jfccivilengineer.com/broad-crested-weir.htm
Salmasi, F. Poorescandar. S Dalir, A. H. and Zadeh,D. F. (2012) “Discharge
Relations for Rectangular Broad-Crested Weirs” Journal Agricultural Sciences. www.agri.ankara.edu.tr/journal
Hussein, H. H., Juma, I. A., and Shareef, S. J., 2011, “Improving the Hydraulic Performance of Single Step Broad-Crested Weirs", Journal of Al-Rafidain Engineering., Mosul University.
Muhammad, M. M (2012); “Experimental study of flow characteristics over compound crested weir” M.sc Thesis, Department of Water Resources and Environmental Engineering, Ahmadu Bello University, Zaria.
Munta. S.K(2010) “evaluation study of energy dissipation over stepped spillway models” M.Sc thesis, Department of Water Resources and Environmental Engineering, Ahmadu Bello University Zaria.
Chinnarasri, C., Donjadee, S., and Israngkura,
U., 2008, “Hydraulic characteristics of gabion-stepped weirs." Journal of Hydraulic Engineering, ASCE, 134(8), 1147-1152.
Chow, V. T., (1959), Open-channel Hydraulics, McGraw-Hill, New York. Hussein, H. H., Juma, I. A., and Shareef, S. J.,
(2009), “Flow characteristics and energy dissipation over stepped round–nosed broad–crested weirs", accepted in Journal of Al-Rafidain Engineering., Mosul University.
Altalid, A. (2021). Discharge coefficient of flow over Al-Shalalat stepped weir on Al-Khusr River” Journal of Water Applied science.
Al-Hashimi, S. M, Madhloom, H. M, Khalaf R. M, Nahi T. N. and Al-Ansari, N. A. (2017) “Flow over Broad Crested weirs: Comparison of 2D and 3D Models” Journal of Civil Engineering and Architecture 11 (2017) 769-779 Tingey S.E. “Discharge Coefficients of Oblique Weirs,” 2011.
Mujahid M. M, Ismail A, Otun J.A and Adie D.B “Hydraulic Performance of Flow over Normal and Inclined Compound Crested weir Models” Niger Assoc. Hydrol.Sci.2012 no 2005, pp.288-295, 2012.
Hubert Chanson and Davide Wüthrich (2014), Hydraulics, Air Entrainment and Energy Dissipation on a Gabion Stepped Weir. Journal of American Society of Civil Engineers.
Ayush Vashisth, (2014). “Energy Dissipation over Stepped Gabion Weir”. International Journal of Dynamics of Fluids. ISSN 0973-1784 Volume 13, Number 1 (2017), pp. 153 -159