Experimental Study of a TLP Offshore Floating Wind Turbine · ICMT2016, 16-18 July 2016, Harbin...
6
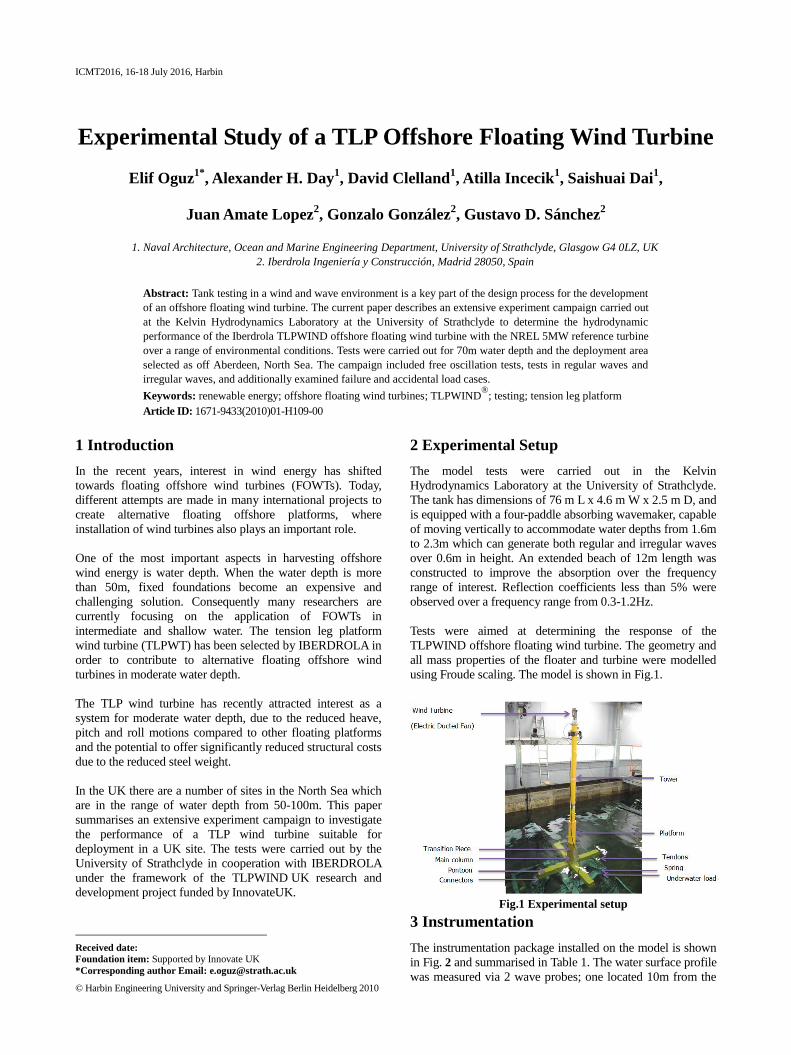
ICMT2016, 16-18 July 2016, Harbin Experimental Study of a TLP Offshore Floating Wind Turbine Elif Oguz 1* , Alexander H. Day 1 , David Clelland 1 , Atilla Incecik 1 , Saishuai Dai 1 , Juan Amate Lopez 2 , Gonzalo González 2 , Gustavo D. Sánchez 2 1. Naval Architecture, Ocean and Marine Engineering Department, University of Strathclyde, Glasgow G4 0LZ, UK 2. Iberdrola Ingeniería y Construcción, Madrid 28050, Spain Abstract: Tank testing in a wind and wave environment is a key part of the design process for the development of an offshore floating wind turbine. The current paper describes an extensive experiment campaign carried out at the Kelvin Hydrodynamics Laboratory at the University of Strathclyde to determine the hydrodynamic performance of the Iberdrola TLPWIND offshore floating wind turbine with the NREL 5MW reference turbine over a range of environmental conditions. Tests were carried out for 70m water depth and the deployment area selected as off Aberdeen, North Sea. The campaign included free oscillation tests, tests in regular waves and irregular waves, and additionally examined failure and accidental load cases. Keywords: renewable energy; offshore floating wind turbines; TLPWIND ® ; testing; tension leg platform Article ID: 1671-9433(2010)01-H109-00 1 Introduction 1 In the recent years, interest in wind energy has shifted towards floating offshore wind turbines (FOWTs). Today, different attempts are made in many international projects to create alternative floating offshore platforms, where installation of wind turbines also plays an important role. One of the most important aspects in harvesting offshore wind energy is water depth. When the water depth is more than 50m, fixed foundations become an expensive and challenging solution. Consequently many researchers are currently focusing on the application of FOWTs in intermediate and shallow water. The tension leg platform wind turbine (TLPWT) has been selected by IBERDROLA in order to contribute to alternative floating offshore wind turbines in moderate water depth. The TLP wind turbine has recently attracted interest as a system for moderate water depth, due to the reduced heave, pitch and roll motions compared to other floating platforms and the potential to offer significantly reduced structural costs due to the reduced steel weight. In the UK there are a number of sites in the North Sea which are in the range of water depth from 50-100m. This paper summarises an extensive experiment campaign to investigate the performance of a TLP wind turbine suitable for deployment in a UK site. The tests were carried out by the University of Strathclyde in cooperation with IBERDROLA under the framework of the TLPWIND UK research and development project funded by InnovateUK. Received date: Foundation item: Supported by Innovate UK *Corresponding author Email: [email protected] © Harbin Engineering University and Springer-Verlag Berlin Heidelberg 2010 2 Experimental Setup The model tests were carried out in the Kelvin Hydrodynamics Laboratory at the University of Strathclyde. The tank has dimensions of 76 m L x 4.6 m W x 2.5 m D, and is equipped with a four-paddle absorbing wavemaker, capable of moving vertically to accommodate water depths from 1.6m to 2.3m which can generate both regular and irregular waves over 0.6m in height. An extended beach of 12m length was constructed to improve the absorption over the frequency range of interest. Reflection coefficients less than 5% were observed over a frequency range from 0.3-1.2Hz. Tests were aimed at determining the response of the TLPWIND offshore floating wind turbine. The geometry and all mass properties of the floater and turbine were modelled using Froude scaling. The model is shown in Fig.1. Fig.1 Experimental setup 3 Instrumentation The instrumentation package installed on the model is shown in Fig. 2 and summarised in Table 1. The water surface profile was measured via 2 wave probes; one located 10m from the
Transcript of Experimental Study of a TLP Offshore Floating Wind Turbine · ICMT2016, 16-18 July 2016, Harbin...
ICMT2016, 16-18 July 2016, Harbin
Experimental Study of a TLP Offshore Floating Wind Turbine
Elif Oguz1*
, Alexander H. Day1, David Clelland
1, Atilla Incecik
1, Saishuai Dai
1,
Juan Amate Lopez2, Gonzalo González
2, Gustavo D. Sánchez
2
1. Naval Architecture, Ocean and Marine Engineering Department, University of Strathclyde, Glasgow G4 0LZ, UK
2. Iberdrola Ingeniería y Construcción, Madrid 28050, Spain
Abstract: Tank testing in a wind and wave environment is a key part of the design process for the development
of an offshore floating wind turbine. The current paper describes an extensive experiment campaign carried out
at the Kelvin Hydrodynamics Laboratory at the University of Strathclyde to determine the hydrodynamic
performance of the Iberdrola TLPWIND offshore floating wind turbine with the NREL 5MW reference turbine
over a range of environmental conditions. Tests were carried out for 70m water depth and the deployment area
selected as off Aberdeen, North Sea. The campaign included free oscillation tests, tests in regular waves and
irregular waves, and additionally examined failure and accidental load cases.
Keywords: renewable energy; offshore floating wind turbines; TLPWIND®
; testing; tension leg platform
Article ID: 1671-9433(2010)01-H109-00
1 Introduction1
In the recent years, interest in wind energy has shifted
towards floating offshore wind turbines (FOWTs). Today,
different attempts are made in many international projects to
create alternative floating offshore platforms, where
installation of wind turbines also plays an important role.
One of the most important aspects in harvesting offshore
wind energy is water depth. When the water depth is more
than 50m, fixed foundations become an expensive and
challenging solution. Consequently many researchers are
currently focusing on the application of FOWTs in
intermediate and shallow water. The tension leg platform
wind turbine (TLPWT) has been selected by IBERDROLA in
order to contribute to alternative floating offshore wind
turbines in moderate water depth.
The TLP wind turbine has recently attracted interest as a
system for moderate water depth, due to the reduced heave,
pitch and roll motions compared to other floating platforms
and the potential to offer significantly reduced structural costs
due to the reduced steel weight.
In the UK there are a number of sites in the North Sea which
are in the range of water depth from 50-100m. This paper
summarises an extensive experiment campaign to investigate
the performance of a TLP wind turbine suitable for
deployment in a UK site. The tests were carried out by the
University of Strathclyde in cooperation with IBERDROLA
under the framework of the TLPWIND UK research and
development project funded by InnovateUK.
Received date: Foundation item: Supported by Innovate UK
*Corresponding author Email: [email protected]
© Harbin Engineering University and Springer-Verlag Berlin Heidelberg 2010
2 Experimental Setup
The model tests were carried out in the Kelvin
Hydrodynamics Laboratory at the University of Strathclyde.
The tank has dimensions of 76 m L x 4.6 m W x 2.5 m D, and
is equipped with a four-paddle absorbing wavemaker, capable
of moving vertically to accommodate water depths from 1.6m
to 2.3m which can generate both regular and irregular waves
over 0.6m in height. An extended beach of 12m length was
constructed to improve the absorption over the frequency
range of interest. Reflection coefficients less than 5% were
observed over a frequency range from 0.3-1.2Hz.
Tests were aimed at determining the response of the
TLPWIND offshore floating wind turbine. The geometry and
all mass properties of the floater and turbine were modelled
using Froude scaling. The model is shown in Fig.1.
Fig.1 Experimental setup
3 Instrumentation
The instrumentation package installed on the model is shown
in Fig. 2 and summarised in Table 1. The water surface profile
was measured via 2 wave probes; one located 10m from the

Oguz et al. Experimental Study of a TLP Offshore Floating Wind Turbine 2
face of the wave maker (tank wave) and one in-line with the
model (model wave). The six-degree-of-freedom floating
body motions were measured using a Qualisys optical
tracking camera system. Strain gauges were installed to
measure tower bending moments. Turbine thrust was
measured using a load cell located at the base of the fan.
Tendon tensions were measured at the bottom of the tank
using 8 underwater load cells. A 3 axis accelerometer was
mounted at the model VCG and a second 3 axis
accelerometer mounted at the top of the tower to obtain the
accelerations at COG and at tower.
A range of different approaches have been used in previous
studies to simulate the wind loading on floating wind turbines
in the laboratory environment. In the present study, a
“software in the loop”(SIL) method developed by CENER
has been deployed to generate the aerodynamic thrust loads
(see Day et al. (2015). This approach does not require the
generation of wind over the tank or the construction of a
working scaled rotor.
Fig. 2 Instrumentation Package
Table 1: Instrumentation summary
ID Contents Measurement
1 Electric Ducted Fan (EDF)
2 Beam Load Cell (measure thrust) Fan Thrust
3 Wireless accelerometer Acceleration at nacelle
4 Qualisys motion capture
reflection markers
6 DOF motion of
platform
5 Strain gauges Tower bending
moments
6 Wired accelerometer at VCG
(inside)
Acceleration at CG
7 Water proof camera (inside)
8 Tendon wires (8 in total)
9 Springs (8 in total)
10 Under water load cell (8 in total) Tendon tension
Using the six degree of platform motions measured during the
tests, the aerodynamic thrust related to the instantaneous
position and velocity of the platform are calculated in real
time using a modified version of the FAST
aero-hydro-servo-elastic software code. The calculated values
for scaled thrust load are used to drive a calibrated high-speed
fan (Electric Ducted Fan, EDF) located on the model in line
with the rotor drivetrain to generate the thrust component of
the wind load.
4 Model Installation
The model was installed at the midpoint of the tank (Figure 1)
on a mounting frame installed on the base of the tank
arranged to allow the model to be rotated through 45 degrees.
A detailed drawing of the plan and profile view of the tank
showing the experimental setup is given in Fig.3.
Fig.3 Schematic view of the model installed in the tank
Apart from a set of tests conducted to define the effect of
varying water depth on the system due to tide, the water depth
was kept at a value of 70m in full scale for all tests.
Since tendon performance is critical to the performance of a
TLP, great care was taken to ensure that pretention and
stiffness were correctly adjusted. The eight tendons were
constructed using stainless steel wires, and the full-scale
tendon stiffness was modelled using calibrated springs. The
tendons were attached at both ends to universal joints to
minimize friction. The model was designed to allow the
tendon tension to be adjusted from above with the model at
the correct draft and the water level at the design value. Since
the weight of the tendons could not be correctly scaled,
appropriate corrections were made to the expected value of
the pre-tension to allow the model to be installed correctly.
After a process of careful adjustment, the mean tendon
tension was less than 3% of the target value.
5 Free Oscillation Tests
Six sets of free oscillation tests were carried out to
characterise the damping coefficients and natural periods of
the system in four different modes of motion as described in
Table 2. Each test was repeated at least ten times. The surge
tests were carried out for three conditions to understand the
3
importance of the wind effect on the system damping: no
wind, constant predefined thrust (PT), and software in the
loop (SIL) controlled thrust, with wind speeds corresponding
to the rated wind speed for the turbine.
The tests were carried out by displacing the structure in the
mode of motion and carefully releasing it. In the case of
heave and pitch it proved extremely difficult to achieve
reliable results due to the high stiffness of the system, the
difficulty of imposing sufficient motion without exciting
other modes, and the rapid decay. Consistent results were
achieved in surge and yaw.
Table 2: Free Oscillation Tests
Test ID Contents
D1001 Surge (no wind)
D1002 Surge (PT ws=11.4m/s)
D1003 Surge (SIL ws=11.4m/s)
D1004 Yaw (no wind)
D1005 Heave (no wind)
D1006 Pitch (no wind)
It was relatively easy to displace the structure in surge
without inducing other motions. Sample results for surge are
shown in Figure 4. This shows the offset generated by the
mean wind. It can be seen that the wind has almost no impact
on the natural period, with the mean period for the SIL case
found to be around 1% lower than with no wind.
-150
-100
-50
0
50
100
150
200
0 5 10 15 20 25 30 35 40
X [
mm
]
Time [sec]
NO WIND
PT
SIL
Figure 4 Free Oscillation Tests in surge
The data was analyzed by fitting an analytical solution for a
linear spring-mass-damper system to the time history:
2ˆexp cos 1x t x x t t
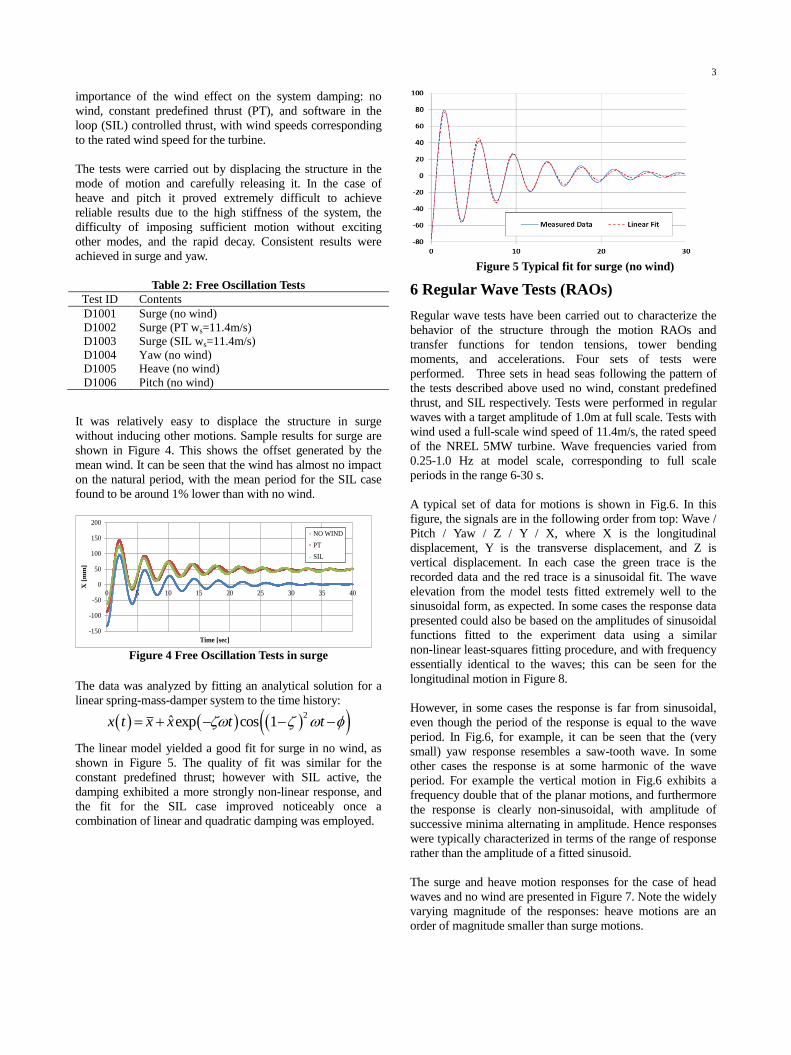
The linear model yielded a good fit for surge in no wind, as
shown in Figure 5. The quality of fit was similar for the
constant predefined thrust; however with SIL active, the
damping exhibited a more strongly non-linear response, and
the fit for the SIL case improved noticeably once a
combination of linear and quadratic damping was employed.
Figure 5 Typical fit for surge (no wind)
6 Regular Wave Tests (RAOs)
Regular wave tests have been carried out to characterize the
behavior of the structure through the motion RAOs and
transfer functions for tendon tensions, tower bending
moments, and accelerations. Four sets of tests were
performed. Three sets in head seas following the pattern of
the tests described above used no wind, constant predefined
thrust, and SIL respectively. Tests were performed in regular
waves with a target amplitude of 1.0m at full scale. Tests with
wind used a full-scale wind speed of 11.4m/s, the rated speed
of the NREL 5MW turbine. Wave frequencies varied from
0.25-1.0 Hz at model scale, corresponding to full scale
periods in the range 6-30 s.
A typical set of data for motions is shown in Fig.6. In this
figure, the signals are in the following order from top: Wave /
Pitch / Yaw / Z / Y / X, where X is the longitudinal
displacement, Y is the transverse displacement, and Z is
vertical displacement. In each case the green trace is the
recorded data and the red trace is a sinusoidal fit. The wave
elevation from the model tests fitted extremely well to the
sinusoidal form, as expected. In some cases the response data
presented could also be based on the amplitudes of sinusoidal
functions fitted to the experiment data using a similar
non-linear least-squares fitting procedure, and with frequency
essentially identical to the waves; this can be seen for the
longitudinal motion in Figure 8.
However, in some cases the response is far from sinusoidal,
even though the period of the response is equal to the wave
period. In Fig.6, for example, it can be seen that the (very
small) yaw response resembles a saw-tooth wave. In some
other cases the response is at some harmonic of the wave
period. For example the vertical motion in Fig.6 exhibits a
frequency double that of the planar motions, and furthermore
the response is clearly non-sinusoidal, with amplitude of
successive minima alternating in amplitude. Hence responses
were typically characterized in terms of the range of response
rather than the amplitude of a fitted sinusoid.
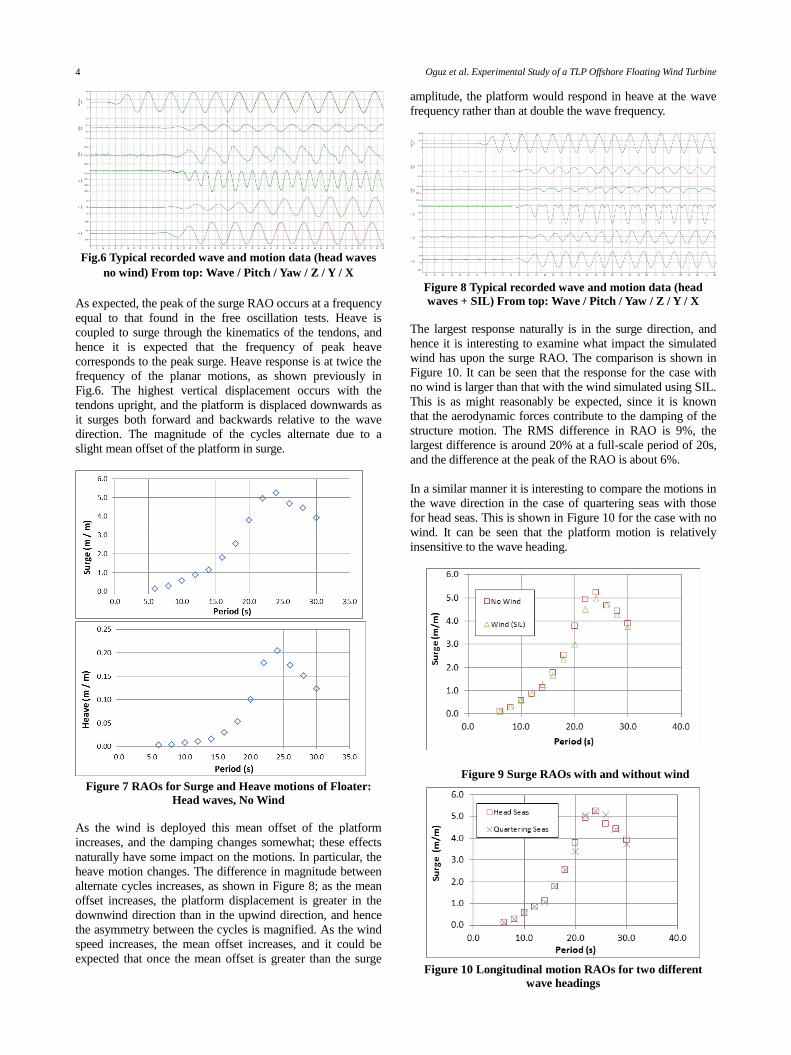
The surge and heave motion responses for the case of head
waves and no wind are presented in Figure 7. Note the widely
varying magnitude of the responses: heave motions are an
order of magnitude smaller than surge motions.
Oguz et al. Experimental Study of a TLP Offshore Floating Wind Turbine 4
Fig.6 Typical recorded wave and motion data (head waves
no wind) From top: Wave / Pitch / Yaw / Z / Y / X
As expected, the peak of the surge RAO occurs at a frequency
equal to that found in the free oscillation tests. Heave is
coupled to surge through the kinematics of the tendons, and
hence it is expected that the frequency of peak heave
corresponds to the peak surge. Heave response is at twice the
frequency of the planar motions, as shown previously in
Fig.6. The highest vertical displacement occurs with the
tendons upright, and the platform is displaced downwards as
it surges both forward and backwards relative to the wave
direction. The magnitude of the cycles alternate due to a
slight mean offset of the platform in surge.
Figure 7 RAOs for Surge and Heave motions of Floater:
Head waves, No Wind
As the wind is deployed this mean offset of the platform
increases, and the damping changes somewhat; these effects
naturally have some impact on the motions. In particular, the
heave motion changes. The difference in magnitude between
alternate cycles increases, as shown in Figure 8; as the mean
offset increases, the platform displacement is greater in the
downwind direction than in the upwind direction, and hence
the asymmetry between the cycles is magnified. As the wind
speed increases, the mean offset increases, and it could be
expected that once the mean offset is greater than the surge
amplitude, the platform would respond in heave at the wave
frequency rather than at double the wave frequency.
Figure 8 Typical recorded wave and motion data (head
waves + SIL) From top: Wave / Pitch / Yaw / Z / Y / X
The largest response naturally is in the surge direction, and
hence it is interesting to examine what impact the simulated
wind has upon the surge RAO. The comparison is shown in
Figure 10. It can be seen that the response for the case with
no wind is larger than that with the wind simulated using SIL.
This is as might reasonably be expected, since it is known
that the aerodynamic forces contribute to the damping of the
structure motion. The RMS difference in RAO is 9%, the
largest difference is around 20% at a full-scale period of 20s,
and the difference at the peak of the RAO is about 6%.
In a similar manner it is interesting to compare the motions in
the wave direction in the case of quartering seas with those
for head seas. This is shown in Figure 10 for the case with no
wind. It can be seen that the platform motion is relatively
insensitive to the wave heading.
Figure 9 Surge RAOs with and without wind
Figure 10 Longitudinal motion RAOs for two different
wave headings
5
7 Tests in Irregular Waves
A series of irregular wave tests were conducted to
characterise the platform response in a realistic sea
environment. 8 different sea states with different wave and
wind conditions were used (Table 3). All sea states were
generated for a period corresponding to three hours at full
scale. Variations in wind direction were accommodated by
rotating the fan on top of the tower.
All sea states were calibrated before the structure was
deployed using measurements taken at the still-water position
of the TLP. Significant wave heights were adjusted to be
correct to within 2% of target values in all cases.
Table 3: Sea States
Sea State Hs (m) Tp (s) Wind Speed(m/s)
N1 4.55 9.00 11.40
N2 1.50 6.61 11.40
N3 8.46 10.13 38.76
N4 0.75 5.44 6.05
N5 1.25 6.36 9.18
N6 1.75 6.86 12.80
N7 2.75 7.80 16.80
N8 6.00 10.28 25.00
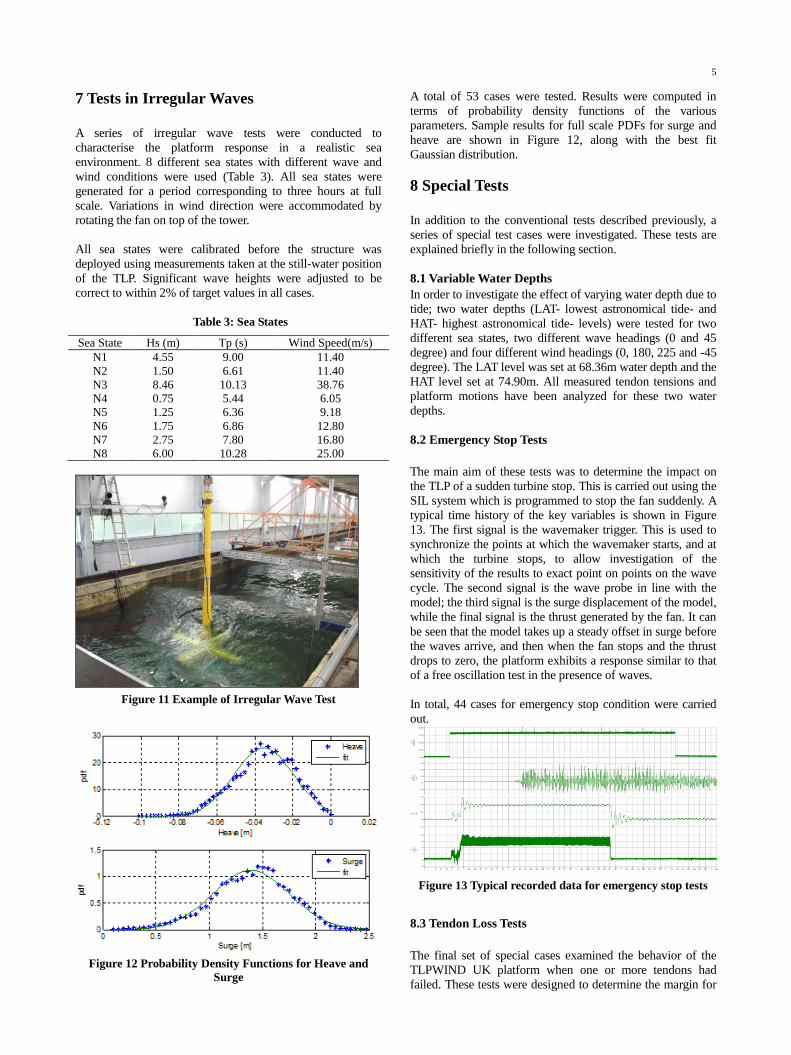
Figure 11 Example of Irregular Wave Test
Figure 12 Probability Density Functions for Heave and
Surge
A total of 53 cases were tested. Results were computed in
terms of probability density functions of the various
parameters. Sample results for full scale PDFs for surge and
heave are shown in Figure 12, along with the best fit
Gaussian distribution.
8 Special Tests
In addition to the conventional tests described previously, a
series of special test cases were investigated. These tests are
explained briefly in the following section.
8.1 Variable Water Depths
In order to investigate the effect of varying water depth due to
tide; two water depths (LAT- lowest astronomical tide- and
HAT- highest astronomical tide- levels) were tested for two
different sea states, two different wave headings (0 and 45
degree) and four different wind headings (0, 180, 225 and -45
degree). The LAT level was set at 68.36m water depth and the
HAT level set at 74.90m. All measured tendon tensions and
platform motions have been analyzed for these two water
depths.
8.2 Emergency Stop Tests
The main aim of these tests was to determine the impact on
the TLP of a sudden turbine stop. This is carried out using the
SIL system which is programmed to stop the fan suddenly. A
typical time history of the key variables is shown in Figure
13. The first signal is the wavemaker trigger. This is used to
synchronize the points at which the wavemaker starts, and at
which the turbine stops, to allow investigation of the
sensitivity of the results to exact point on points on the wave
cycle. The second signal is the wave probe in line with the
model; the third signal is the surge displacement of the model,
while the final signal is the thrust generated by the fan. It can
be seen that the model takes up a steady offset in surge before
the waves arrive, and then when the fan stops and the thrust
drops to zero, the platform exhibits a response similar to that
of a free oscillation test in the presence of waves.
In total, 44 cases for emergency stop condition were carried
out.
Figure 13 Typical recorded data for emergency stop tests
8.3 Tendon Loss Tests
The final set of special cases examined the behavior of the
TLPWIND UK platform when one or more tendons had
failed. These tests were designed to determine the margin for

Oguz et al. Experimental Study of a TLP Offshore Floating Wind Turbine 6
safety in the remaining tendons. Three different failures
modes were analysed, with tendons numbered as shown in
Figure 14: First loss of tendon 1, loss of tendon 3 and finally
loss of both tendons.
Figure 14 Tendon numbering
9 Installation Tests
In addition to the tests on the floater, a further series of tests
were carried out on the installation vessel designed for this
platform. The vessel consists of a customised
semi-submersible barge to which the floater is attached
during the tow out operation. Once at station the barge is
ballasted to the connection draft; the tendons are connected,
and the barge de-ballasted and towed back to port.
These tests were carried out at a smaller scale due to the size
of the barge. Tests consisted of towing tests at tow out and
return conditions, sea-keeping tests we are carried out at four
different drafts representing the installation process. The
barge and floater at connection draft are shown in Figure 15.
Figure 15 Installation barge at connection draft
A sample set of results for the final connection draft are
shown in Figure 16 for wave heading= 0°, Hs= 2.75m,
Tp=7.8s.
Figure 16 Probability density functions for Pitch, Heave
and Surge motions
10 Conclusion
An extensive campaign of experiments were carried out
under the framework of the “TLPWIND UK” project to
characterize the hydrodynamic performance of a 70m water
depth TLP offshore wind turbine system. In this paper, the
experimental setup, free oscillation tests, motion RAOs,
irregular wave tests and installation tests have been described.
Acknowledgement
The work was funded under the InnovateUK grant
“TLPWind UK: Driving down the cost of offshore wind in
UK waters”, project reference 101969. The authors
acknowledge the support of Iberdrola and CENER to this
work.
References
Day AH, Babarit A, Fontaine A, He YP, Kraskowski M, Murai M,
Penesis I, Salvatore F, Shin HK (2015). Hydrodynamic
modelling of marine renewable energy devices: A state of the
art review. Ocean Engineering, 108, 46-69.
Zamora Rodriguez R, Gomez Alonso P, Amate Lopez J, De Diego
Martin V, Dinoi P & Souto Iglesias A (2014). Model Scale
Analysis of a TLP Floating Offshore Wind Turbine. OMAE
33rd
International Conference on Ocean, Offshore and Arctic
Engineering, San Francisco, California, USA