EXPERIMENTAL PHASE SYNCHRONIZATION OF CHAOS IN A PLASMA DISCHARGE By Catalin Mihai Ticos A...
51
EXPERIMENTAL PHASE SYNCHRONIZATION OF CHAOS IN A PLASMA DISCHARGE By Catalin Mihai Ticos A Dissertation Presented in Partial Fulfillment of the Requirements for the Degree Doctor of Philosophy Coral Gables, Florida May 2002 UNIVERSITY OF MIAMI
-
Upload
tomas-sage -
Category
Documents
-
view
216 -
download
1
Transcript of EXPERIMENTAL PHASE SYNCHRONIZATION OF CHAOS IN A PLASMA DISCHARGE By Catalin Mihai Ticos A...

EXPERIMENTAL PHASE SYNCHRONIZATION OF CHAOS IN A PLASMA DISCHARGE
By
Catalin Mihai Ticos
A Dissertation Presented in PartialFulfillment of the Requirements for the Degree
Doctor of Philosophy
Coral Gables, Florida
May 2002
UNIVERSITY OF MIAMI

1. Introduction 2. Dynamics of Continuous Chaotic Systems The Lorenz Attractor The Rössler Attractor The Chua Attractor Chaotic Semiconductor Lasers Chaotic Plasma Discharges3. Control and Synchronization of Chaotic Systems
Methods of Controlling Chaos The Ott-Grebogi-Yorke Method Pyraga’s Method Pecora and Carrol Method
Synchronization of Identical Systems4. Phase Synchronization of Chaos
Phase of a Periodic Oscillator Phase of Noisy OscillatorsPhase of Chaotic OscillatorsDynamics of the Phase of Chaotic OscillatorsPhase Synchronization with an External Periodic Force
5. Phase Synchronization of Chaos in a Plasma DischargePhase Synchronization of the Discharge Light IntensityReal-Time Phase Synchronization of the Current DischargeDriving a Chaotic Plasma with an Information Signal
6. Phase Synchronization of Chaos Between a Plasma Discharge and the Chua Circuit
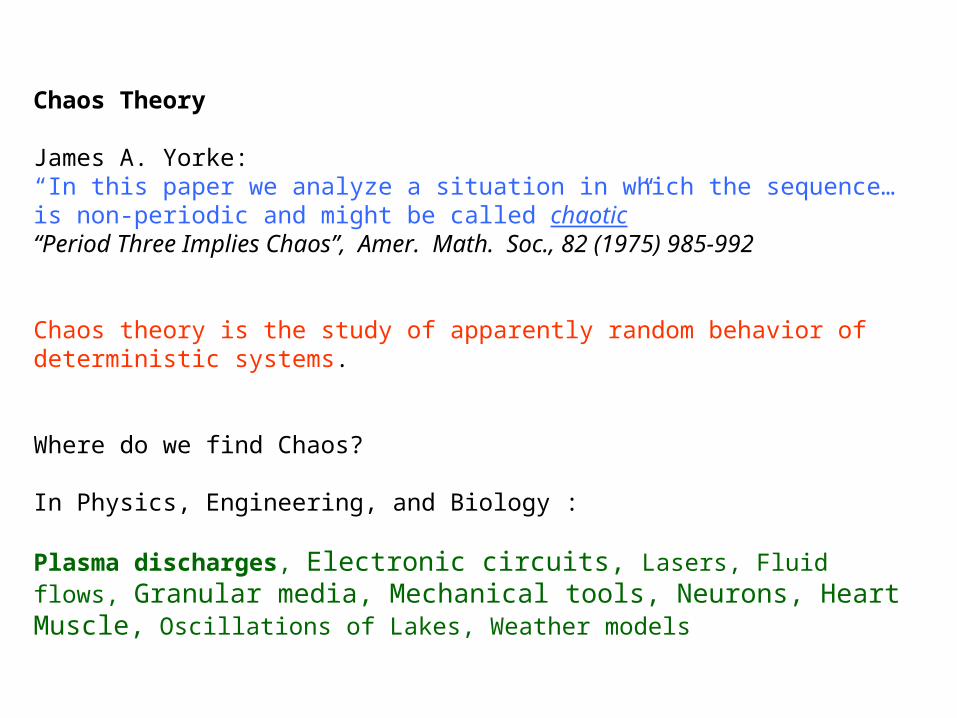
Chaos Theory
James A. Yorke: “In this paper we analyze a situation in which the sequence…is non-periodic and might be called chaotic” “Period Three Implies Chaos”, Amer. Math. Soc., 82 (1975) 985-992
Chaos theory is the study of apparently random behavior of deterministic systems.
Where do we find Chaos?
In Physics, Engineering, and Biology :
Plasma discharges, Electronic circuits, Lasers, Fluid flows, Granular media, Mechanical tools, Neurons, Heart Muscle, Oscillations of Lakes, Weather models
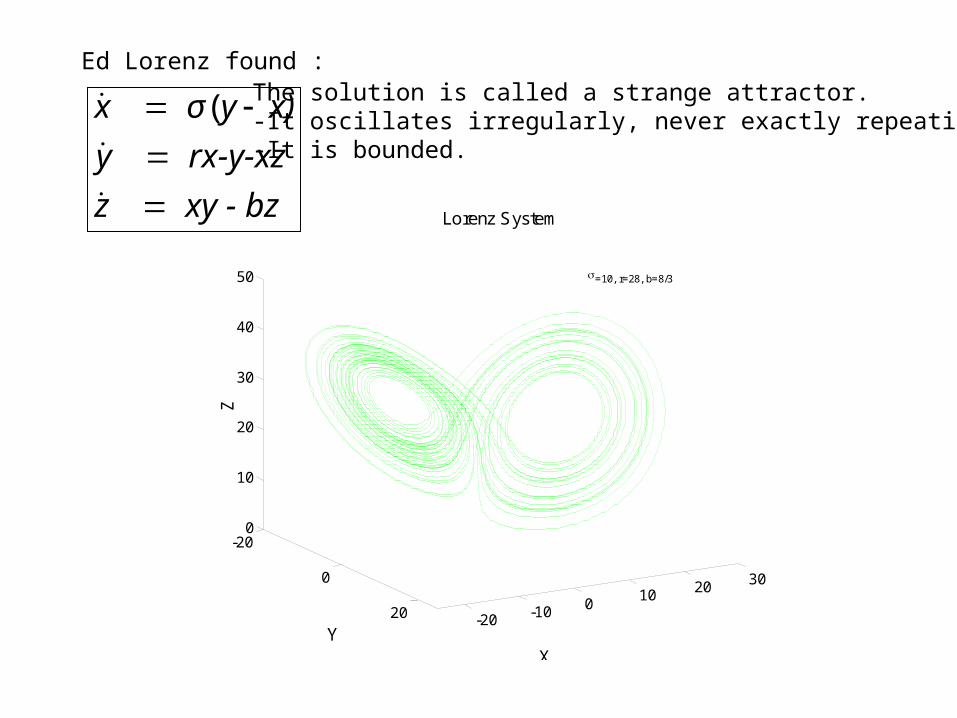
Ed Lorenz found :
-20 -10 010 20 30
-20
0
20
0
10
20
30
40
50 =10, r=28, b=8/3
X
Lorenz System
Y
Z xy - bz z
rx-y-xz y
x)y σ x
( The solution is called a strange attractor.
-It oscillates irregularly, never exactly repeating.-It is bounded.
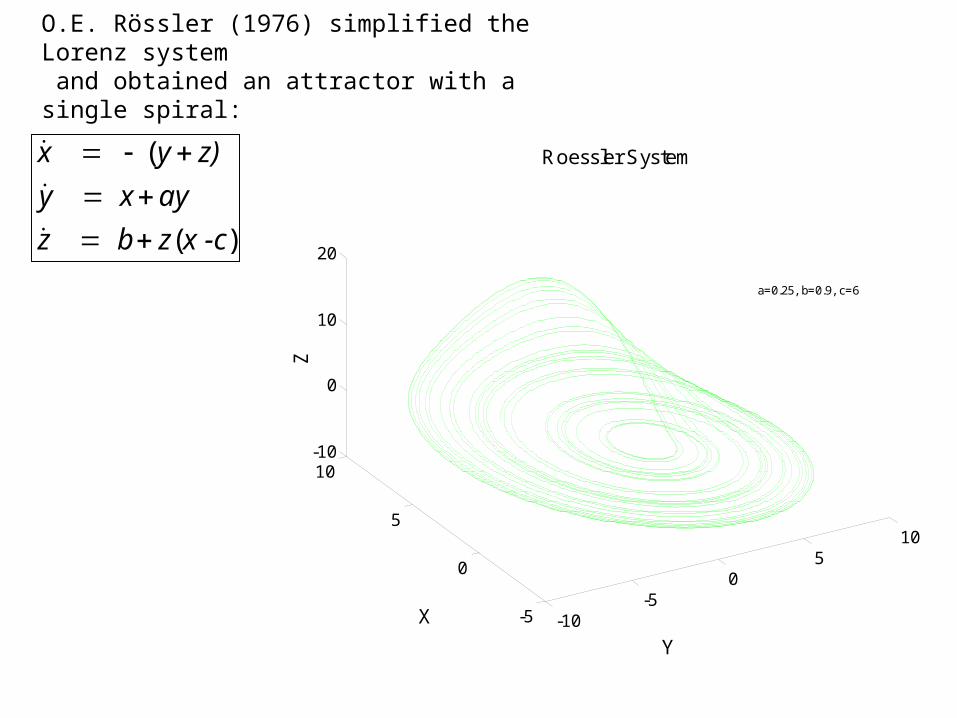
O.E. Rössler (1976) simplified the Lorenz system and obtained an attractor with a single spiral:
)(
(
x -cz b z
ay x y
z)y x
-5
0
5
10
-10-5
05
10
-10
0
10
20
a=0.25, b=0.9, c=6
Y
Roessler System
X
Z
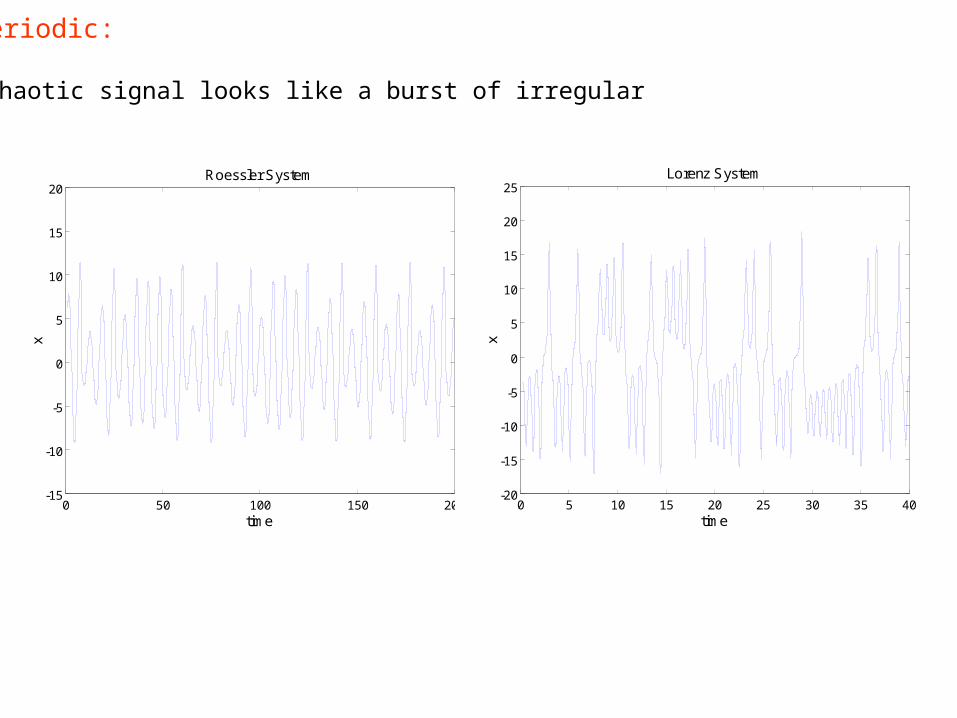
Aperiodic:
A chaotic signal looks like a burst of irregular pulses
0 50 100 150 200-15
-10
-5
0
5
10
15
20Roessler System
time
x
0 5 10 15 20 25 30 35 40-20
-15
-10
-5
0
5
10
15
20
25Lorenz System
time
x

Sensitive dependence on initial conditions:
Two initially nearby trajectories (green and red)
separate exponentially fast in time.
-20 -10 010 20 30
-20
0
20
0
10
20
30
40
50 =10, r=28, b=8/3
X
Lorenz System
Y
Z
-5
0
5
10
-10-5
05
10
-10
0
10
20
a=0.25, b=0.9, c=6
Y
Roessler System
X
Z

Lyapunov Exponents
Largest Lyapunov Exponent:
||||
||)(||1lnlim
0 t
tt
For a 3-dim system we have 3 exponents:Chaos: λ1 >0
λ2 =0 , where | λ3| > | λ1| => λ1 + λ2 + λ3 <0 λ3 <0
Periodic Torus : λ1 = 0 λ2 = 0 λ3 < 0
Periodic Cycle : λ1 = 0 λ2 < 0 λ3 < 0
Chaos Characterization
tet 0)(

Lyapunov Dimension
If k is the largest integer for which 01
k
ll
|| 1
1
k
k
ll
L kD
then we define
Fractal Dimension
l
lND
l log
)(loglim
00
For regular geometrical shapes D0 is an integer.
For 3-dim Chaotic Attractors: 2 < D0 < 3

2
2122
1121
1
)(
)()(
CL
LCCC
CCCC
V dt
diL
iR
VV
dt
dVC
VfR
VV
dt
dVC
Chua Circuit
112
1)(
1111 010 CCCC VVmmVmVf
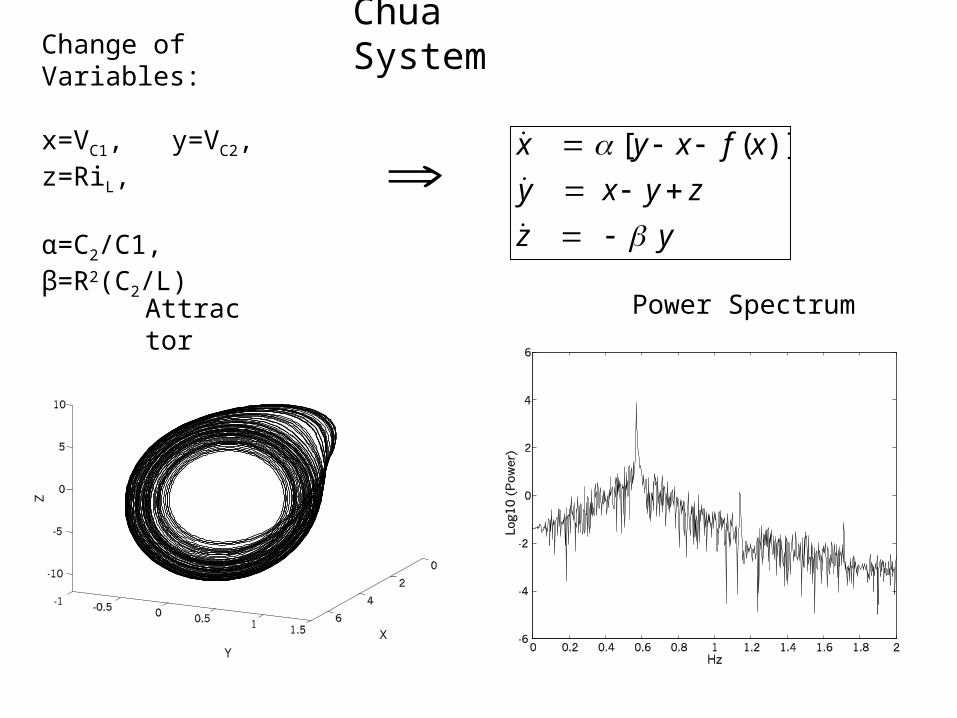
Chua System
y z
zy x y
xfxy x
)]([
Power SpectrumAttractor
Change of Variables:
x=VC1, y=VC2, z=RiL,
α=C2/C1, β=R2(C2/L)

Nonlinear and Chaotic Plasma Discharges
Nonlinear spatial structures (striations) and stability analysis in RF Ar plasmas:R. A. Goldstein et al, Phys. Fluids 22 (1979), 231M. A. Huerta et al, Phys. Rev. A 26 (1982), 539J. A. Walkenstein et al., Phys. Lett. A261 (1999), 183
Chaotic oscillations of the current, light flux, and bifurcation route to chaos in glow discharges in Ar, He and Ne, and thermoionic discharges in Ar:P.Y. Cheung et al., Phys. Rev. Lett.59 (1987), 551T. Braun et al., Phys. Rev. Lett. 59 (1987), 613T. Mausbach et al. , Phys. Plasmas 6 (1999), 3817

Models for a chaotic plasma:
Metastables are important in obtaining self sustained oscillations in the positive column of a dc discharge:V. O. Papanyan et al., Int. J. Bifurc. Chaos 4 (1994), 1495
m
n
mnmnP
t
m
nnmnZ
t
n
),(
),( Where n, m are the electron and metastable concentrations,
n and m are the lifetimes; P is the rate of metastable productionZ is the effective ionization rate
0
0
0
0 )()(,
)()(
m
mtmtM
n
ntntN
where m0, n0 are the equilibrium values
Ni+1 =Ni (1-Ni) (bifurcation similar to the logistic map)

Control of Chaos
OGY method (Ott-Grebogi-Yorke ‘89)
Stabilization on a periodic orbit by a small time-dependent perturbation of one systems’ parameter
Pyragas’ method
Stabilization on a periodic orbit by delayed feedback
Complete Synchronization of Chaos (Pecora and Carroll ‘90)
Synchronization trough coupling between identical systems
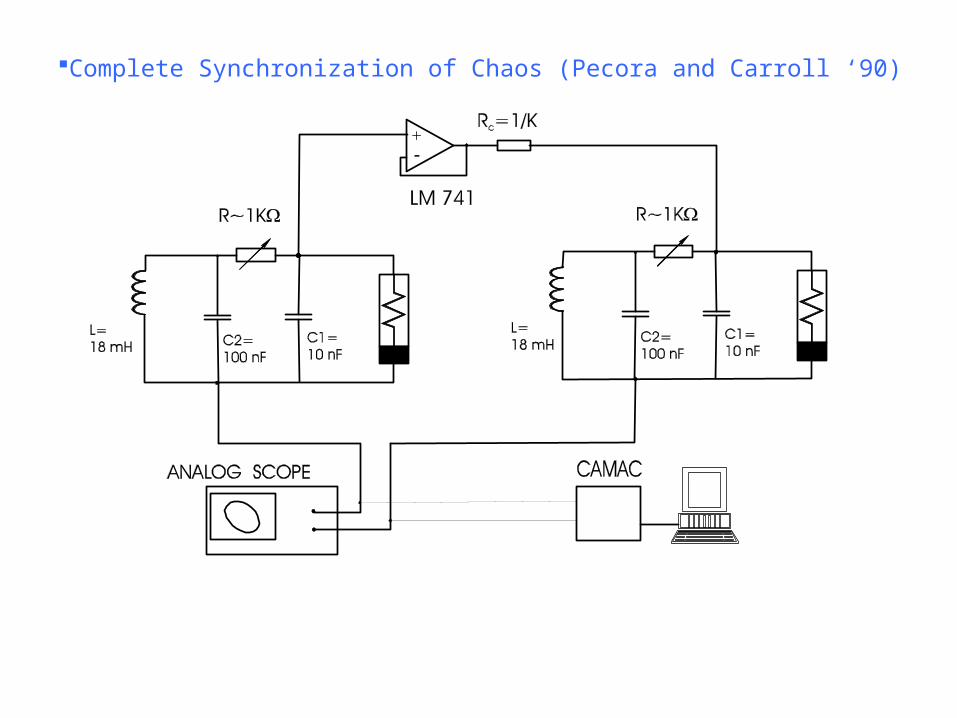
Complete Synchronization of Chaos (Pecora and Carroll ‘90)
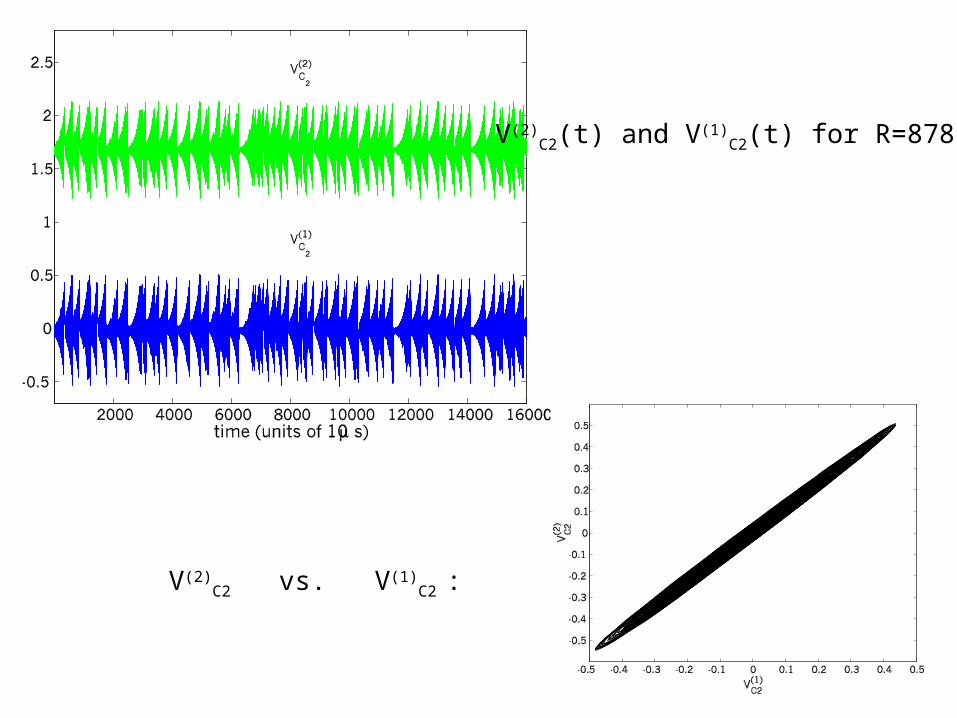
V(2)C2(t) and V(1)
C2(t) for R=878
V(2)C2 vs. V(1)
C2 :
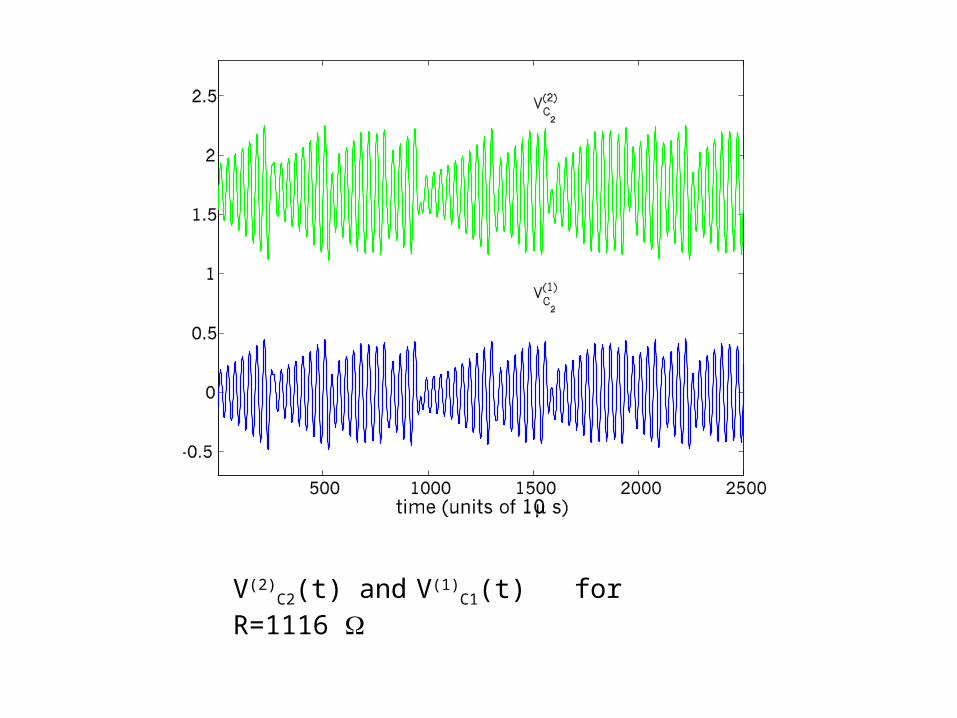
V(2)C2(t) and V(1)
C1(t) for R=1116
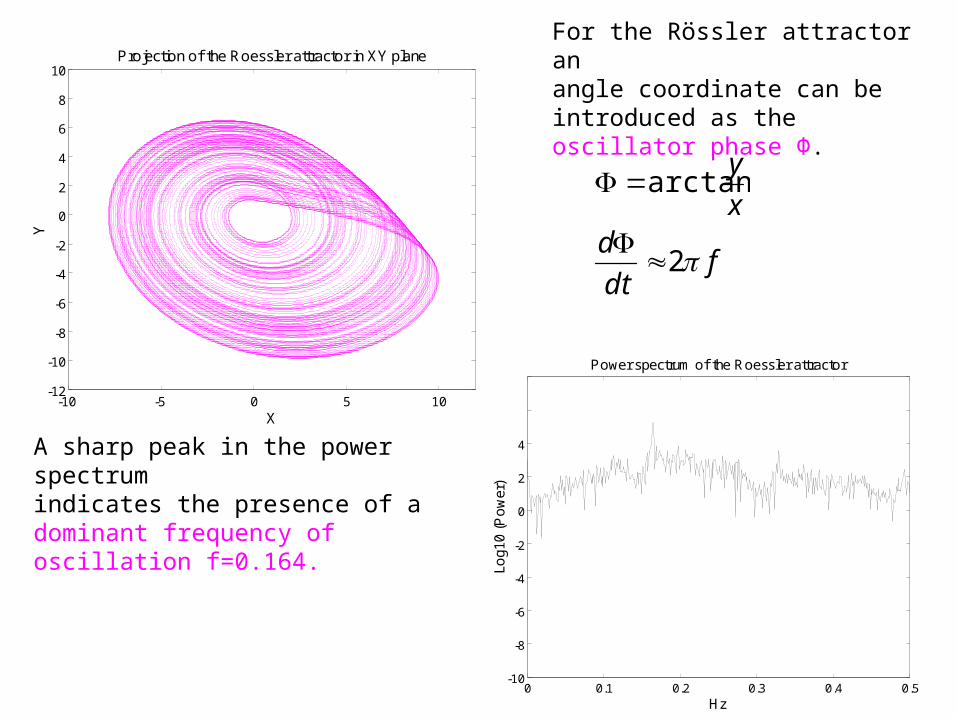
For the Rössler attractor an angle coordinate can beintroduced as the oscillator phase Φ.
0 0.1 0.2 0.3 0.4 0.5-10
-8
-6
-4
-2
0
2
4
6
8
Hz
Log1
0 (P
ow
er)
Power spectrum of the Roessler attractor
-10 -5 0 5 10-12
-10
-8
-6
-4
-2
0
2
4
6
8
10Projection of the Roessler attractor in XY plane
X
Y
A sharp peak in the power spectrum indicates the presence of a dominant frequency of oscillation f=0.164.
fdt
dx
y
2
arctan
-10 -5 0 5 10
-12
-10
-8
-6
-4
-2
0
2
4
6
8
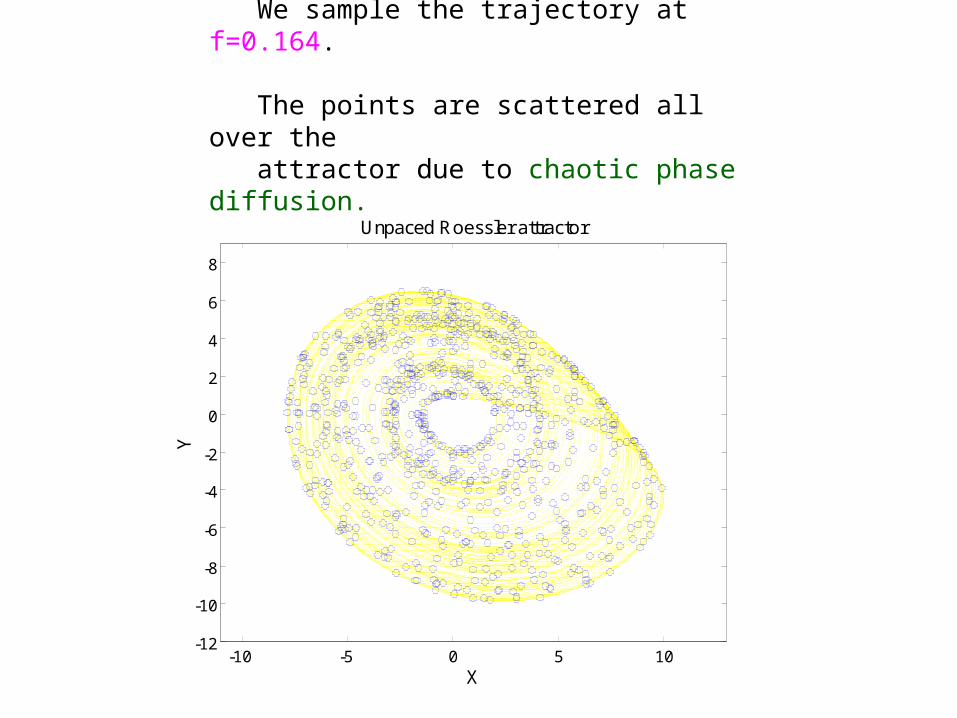
Unpaced Roessler attractor
X
Y
We sample the trajectory at f=0.164.
The points are scattered all over the attractor due to chaotic phase diffusion.

We introduce in the system a small perturbation P = A sin (2πft), called pacer :
where f=0.164 is the dominant frequency and A=0.007
)(
)2sin(
(
x -cz b z
ftAay x y
z)y x
We sample the trajectory of the paced System at the pacer frequency and we get points that are located nearby each other, within a limited range.
-10 -5 0 5 10-12
-10
-8
-6
-4
-2
0
2
4
6
8
Paced Roessler attractor
X
Y
Phase Synchronization of Chaos:
-E. Rosa, Jr., et al (1998)Phys. Rev. Lett. 80, 1642-1645;-M.G. Rosenblum et al (1996)Phys. Rev. Lett. 76, 1804-1807 ;


C. M. Ticos et al (2000)Phys. Rev. Lett. 85, 2929-2932;
Phase synchronization of the plasma discharge current
-0.03 -0.02 -0.01 0 0.01 0.02-0.12
-0.1
-0.08
-0.06
-0.04
-0.02
0
0.02
0.04
0.06
0.08
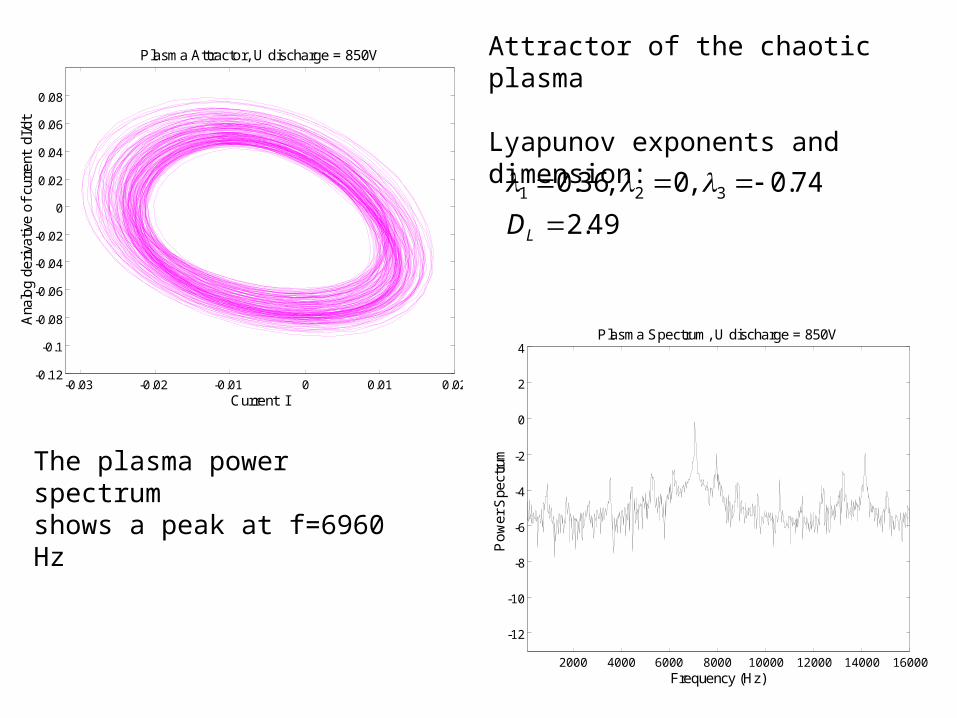
Plasma Attractor, U discharge = 850V
Current I
Ana
log
deriv
ativ
e o
f cu
rren
t dI
/dt
2000 4000 6000 8000 10000 12000 14000 16000
-12
-10
-8
-6
-4
-2
0
2
4Plasma Spectrum, U discharge = 850V
Frequency (Hz)
Po
wer
Spe
ctru
m
Attractor of the chaotic plasma
Lyapunov exponents and dimension:
The plasma power spectrum shows a peak at f=6960 Hz
49.2
74.0,0,36.0 321
LD
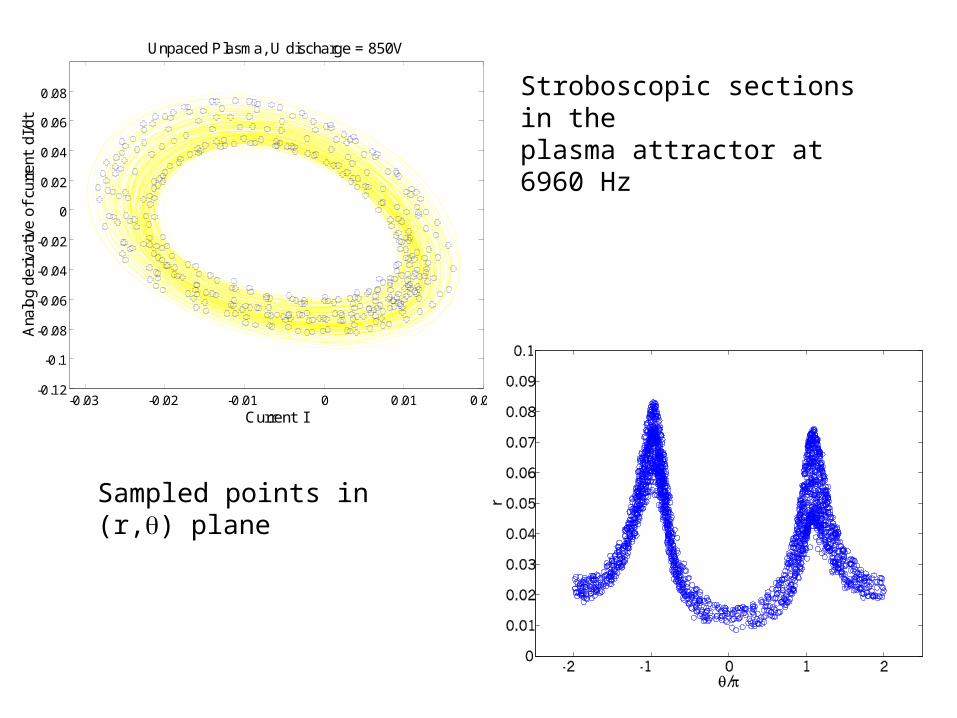
-0.03 -0.02 -0.01 0 0.01 0.02-0.12
-0.1
-0.08
-0.06
-0.04
-0.02
0
0.02
0.04
0.06
0.08
Unpaced Plasma, U discharge = 850V
Current I
Ana
log
deriv
ativ
e o
f cu
rren
t dI
/dt
Stroboscopic sections in the plasma attractor at 6960 Hz
Sampled points in (r,) plane

-0.03 -0.02 -0.01 0 0.01 0.02-0.12
-0.1
-0.08
-0.06
-0.04
-0.02
0
0.02
0.04
0.06
0.08
Paced Plasma, U discharge = 850V
Current I
Ana
log
deriv
ativ
e o
f cu
rren
t dI
/dt
Phase synchronization of plasma
Stroboscopic sections in the paced plasma attractor;Pacer amplitude and frequency A=0.4 V, f=6960 Hz
Sampled points in (r,) planeof the paced plasma
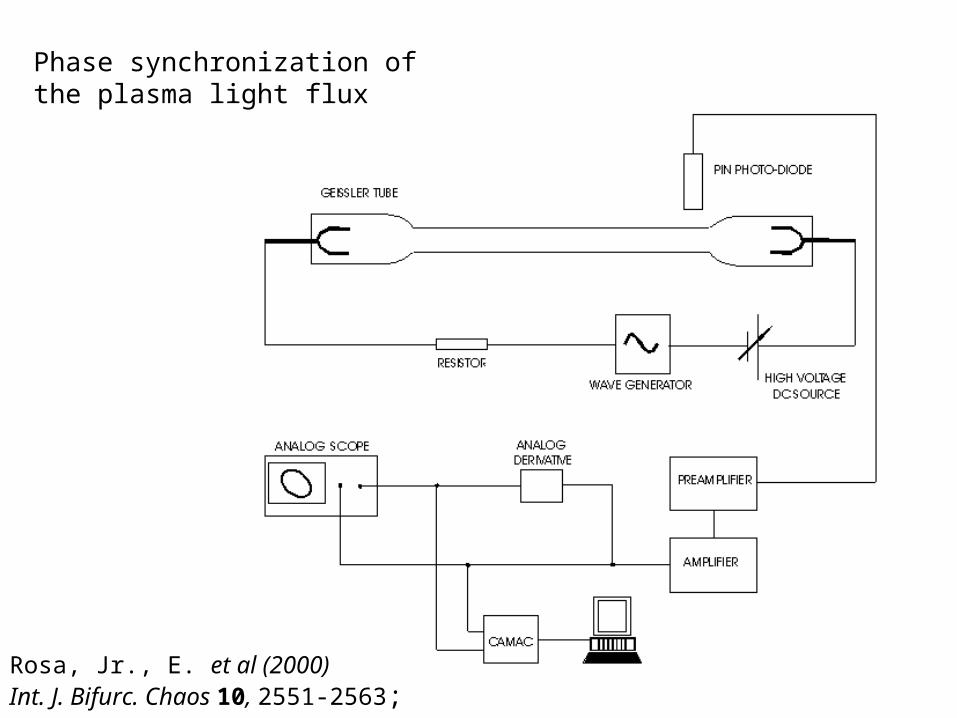
Rosa, Jr., E. et al (2000)Int. J. Bifurc. Chaos 10, 2551-2563;
Phase synchronization of the plasma light flux

Attractor of the local light intensity reconstructed by time-delay embedding
Fractal Dimension D0= 2.18
Power spectrum of the light intensityfpeak= 3850 Hz

Stroboscopic sections in the plasma attractor at 3850 Hz
Stroboscopic sections in the paced plasma attractor;Pacer amplitude and frequency A~1V, f=3850 Hz

6900 6950 7000 7050 7100 7150 7200 7250 73000
0.05
0.1
0.15
0.2
0.25
0.3
0.35
0.4
0.45P
acer
Am
plitu
de (
V)
Frequency (Hz)
We explore the region of phase synchronization (green circles)in the pacer parameter space (frequency - amplitude),the Arnold Tongue .

Real-time power spectrum of the plasma oscillation in LabVIEW(resolution of 1 Hz)
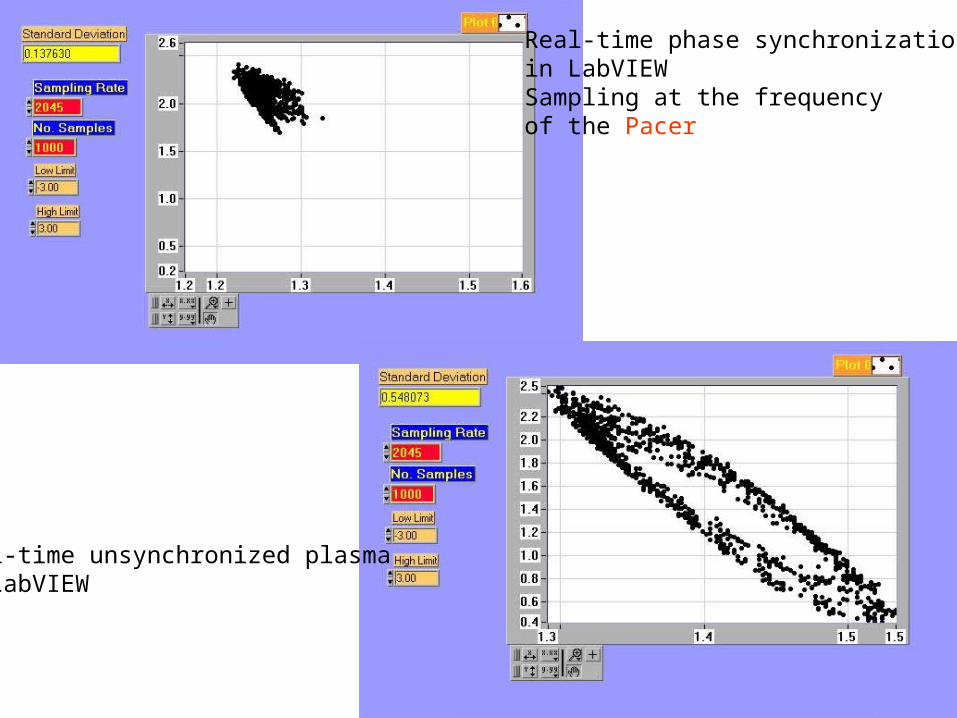
Real-time phase synchronization in LabVIEW Sampling at the frequency of the Pacer
Real-time unsynchronized plasma in LabVIEW
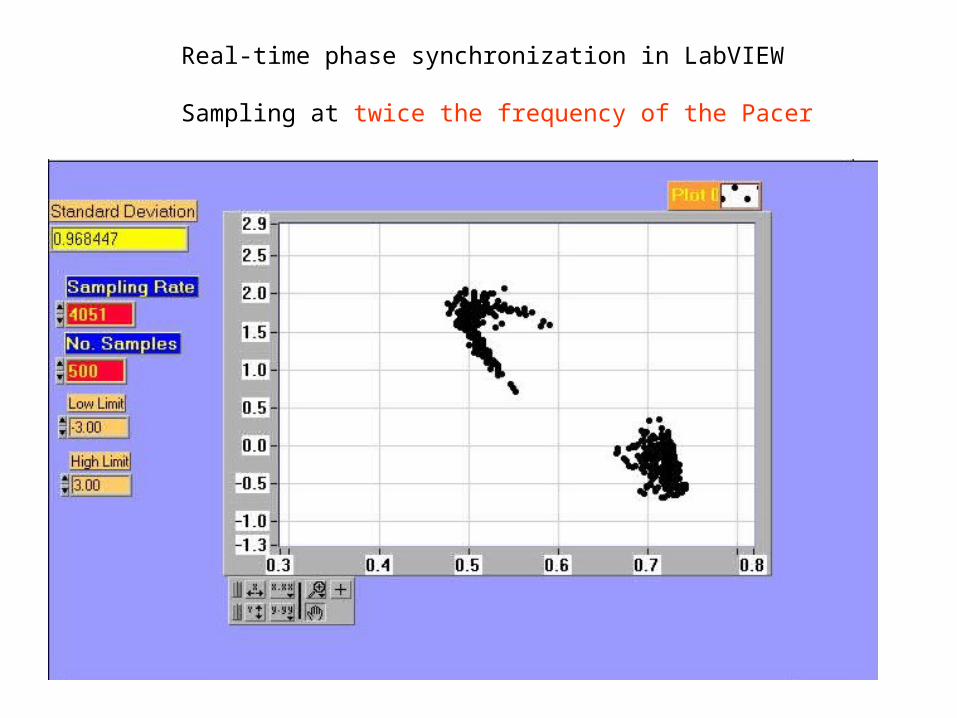
Real-time phase synchronization in LabVIEW
Sampling at twice the frequency of the Pacer

We apply Kirchoff’s lawon the two loops:Plasma-Resistor-Source, and Resistor-Inductor-Capacitor dt
C
IIIR
dt
dIL
IVIIREdt
dILp p
331
3
1311
)(
)()(
-Lp is the parasitic inductance of the discharge;
-Vp (I1) is the nonlinear voltage-current characteristic of the plasma;
-E is the high voltage.
C
I
dt
dudt
C
IuNotation 33:
C
I
dt
du
uIIRdt
dIL
IVIIREdt
dILp p
3
313
1311
)(
)()(
Numerical Model for the Experimental Set-up


CR
L
L
L
R
vzIyIx
p231 ,,,,
and the system becomes:
yz
zyxy
xVR
yxR
Ex p
)()(
where
xmAformmxm
mAxforxm
xfor
xVp
6.2)(6.21000
6.201000
00
)(
011
0
The values corresponding to our experiment are:R=30KΩ , C=3.5 pF, L=30mH, Lp=4mH, E=850V,
m0=-136.53 V/mA, m1= -7.46 V/mA ,
Change of variables:
0
10
20
-5 0 5
-25
-20
-15
-10
-5
0
5
10
Y
Z
X
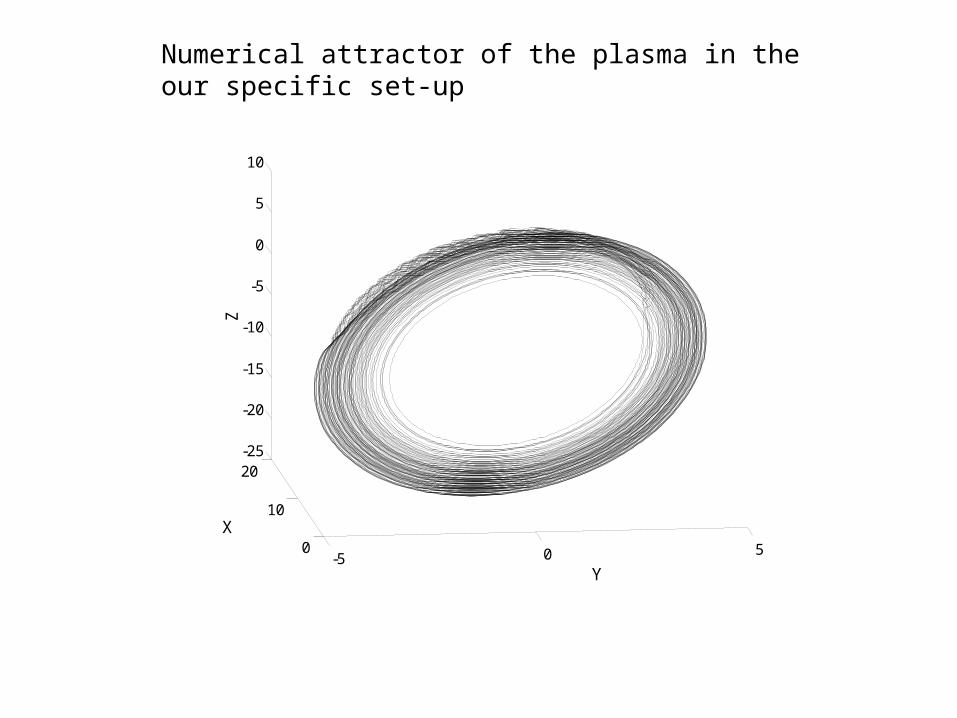
Numerical attractor of the plasma in the our specific set-up

W.B. Pardo et al. (2001)Phys. Lett. A 284, 259-265 ;
A harmonic signal, from a CD player, drives the plasma
-We retrieve the driving signal in the negative light of the dischargewhen the plasmaoscillates with period 2-In the chaotic regime the chaoscovers the driving signal
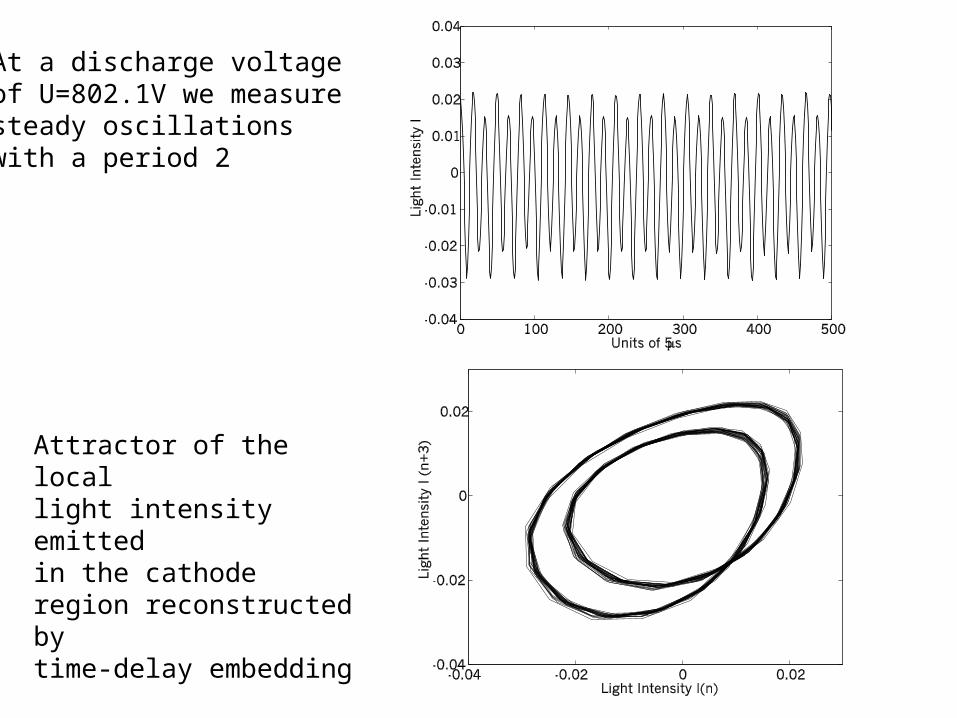
At a discharge voltage of U=802.1V we measure steady oscillations with a period 2
Attractor of the local light intensity emitted in the cathode region reconstructed by time-delay embedding
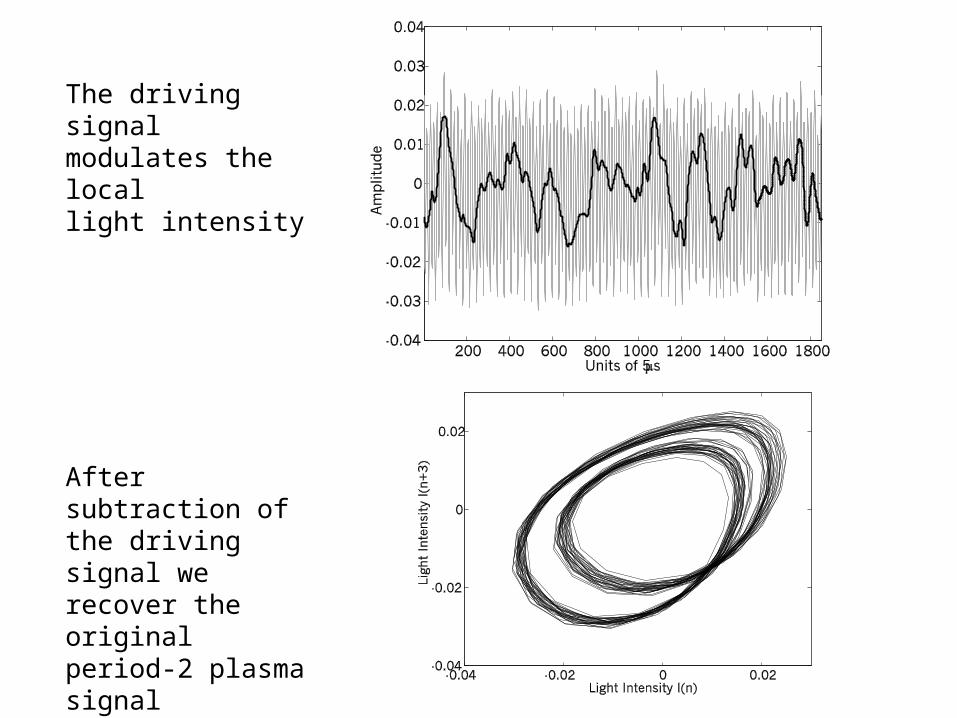
The driving signal modulates the local light intensity
After subtraction of the driving signal werecover the originalperiod-2 plasma signal
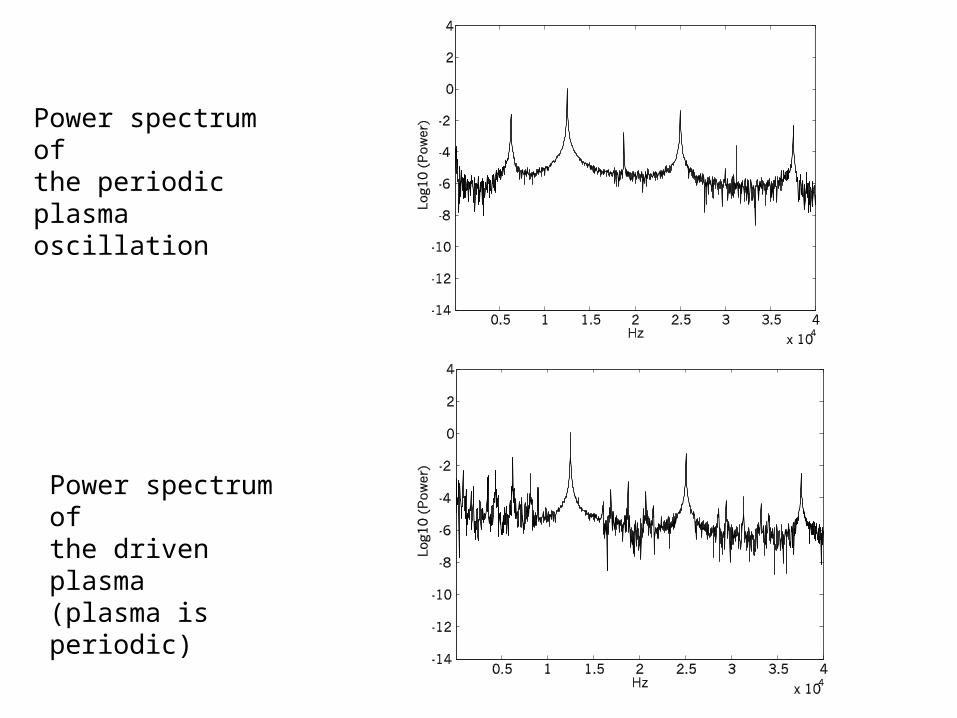
Power spectrum of the periodic plasma oscillation
Power spectrum of the driven plasma (plasma is periodic)

Chaotic plasma local light intensity (grey)and driving signal (black)
Attractor of the plasma at U=830.1 V in chaotic regime

Power spectrum of the chaotic plasma oscillation
Power spectrum of the chaotic driven plasma

The Chua circuit is driving the chaotic plasma
-Variable coupling through Rc
-One way couplingusing OP-AMP LM741-Measured signals:Plasma Light FluxChua Voltage VC2
E. Rosa, Jr., et al, To be published

We tune the two uncoupled systems until they show nearly the same dominant frequency in their power spectrum.
The frequency mismatch of the peaks is about Δf ≈ 50 Hz.
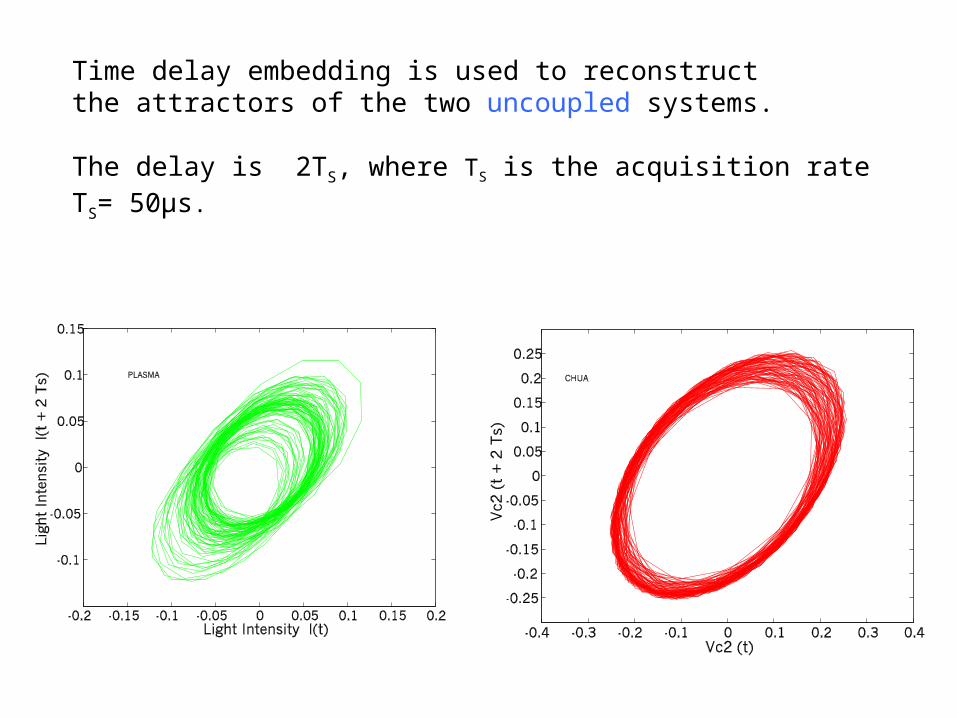
Time delay embedding is used to reconstruct the attractors of the two uncoupled systems.
The delay is 2TS, where TS is the acquisition rateTS= 50µs.

We then couple the systems at Rc=0.7 KΩ.
The peaks in the power spectrum are at exactlythe same frequency.
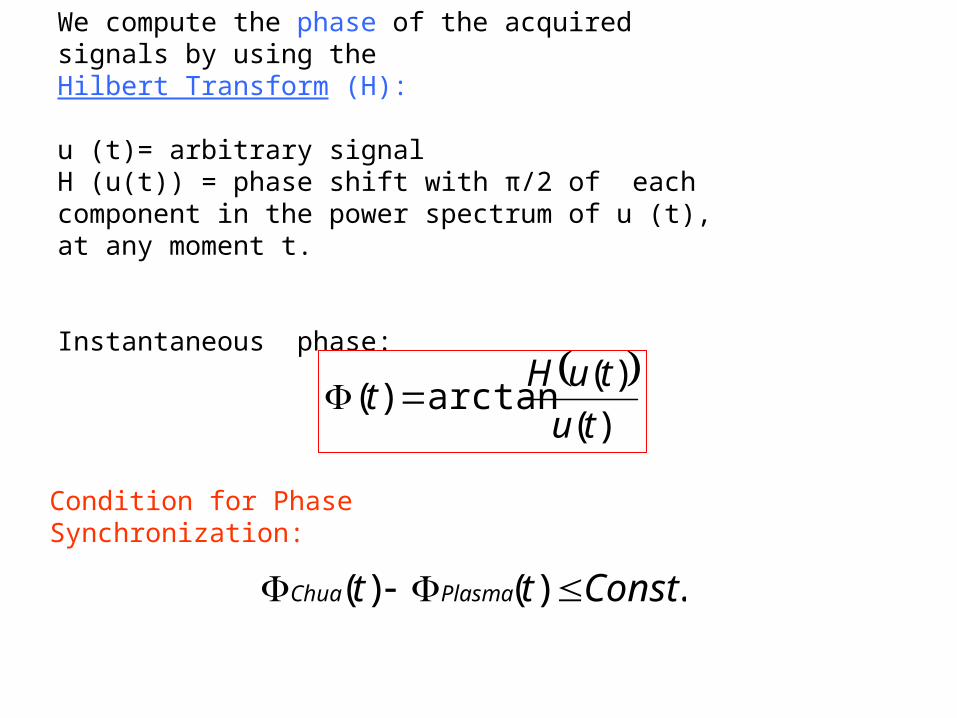
We compute the phase of the acquired signals by using the Hilbert Transform (H):
u (t)= arbitrary signalH (u(t)) = phase shift with π/2 of each component in the power spectrum of u (t), at any moment t.
Instantaneous phase:
)(
)(arctan)(
tu
tuHt
Condition for Phase Synchronization:
.)()( Consttt PlasmaChua

We compute the phase difference ΔΦ = ΦChua - Φplasma
of the time series acquired for different coupling strengths Rc
2/1
..log criticC RRconst
Average time of chaotic transients:
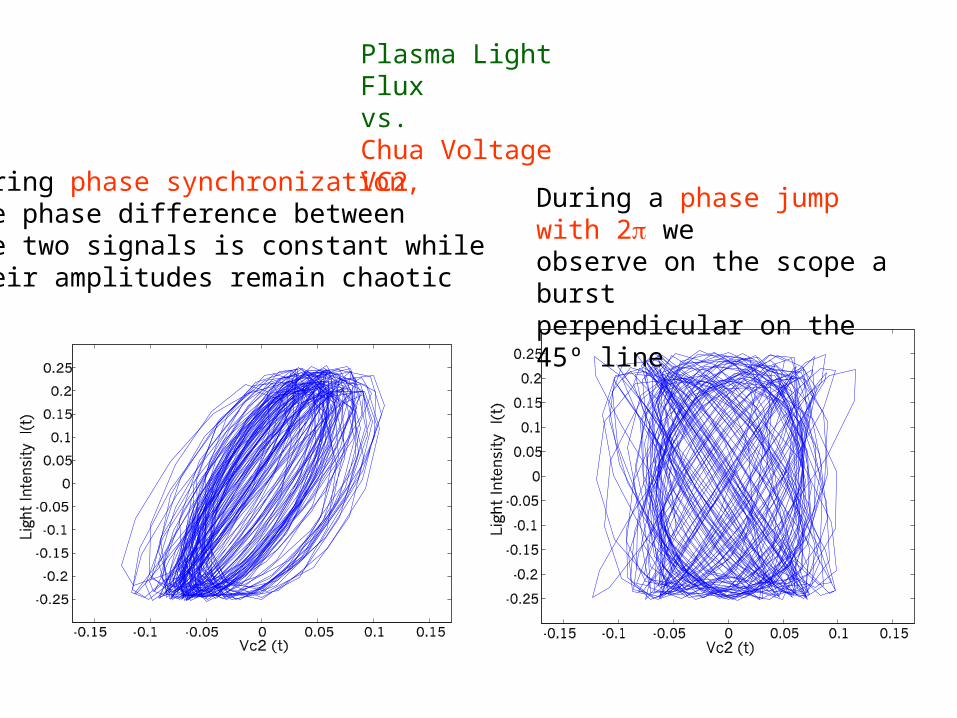
During phase synchronization, the phase difference between the two signals is constant whiletheir amplitudes remain chaotic
Plasma Light Fluxvs.Chua Voltage VC2
During a phase jump with 2 we observe on the scope a burst perpendicular on the 45º line

CONCLUSIONS
Showed phase synchronization between the plasma discharge currentand a periodic low-voltage sine wave
Showed phase synchronization between the plasma discharge light fluxand a periodic low-voltage sine wave
Found the whole region of phase synchronization, in the space of amplitude and frequency (A, f) of the pacing voltage
Drove the plasma discharge with a harmonic signal
Showed phase synchronization between a plasma discharge and the Chua electronic circuit.
3 published papers, 1 submitted

Special Thanks to :
Prof. Rosa,
Prof. Pardo
Prof. Alexandrakis
Prof. Huerta
Prof. Voss
Prof. Wang
Jonathan Walkenstein
Marco Monti
Robert Heyman