Evaluation and Methodology For Experimental Computer Science

Army Research LaboratoryAberdeen Proving Ground, MD 21005-5068
ARL-TR-0000 November 2010
Experimental Methodology using Digital ImageCorrelation (DIC) to Assess Ballistic Helmet BluntTrauma
Dixie Hisley, James Gurganus, Joseph Lee*, Scott Williams, AndrewDrysdaleSurvivability/Lethality Analysis Directorate, ARL,*Bowhead Technical and Professional Services, Inc.
Approved for public release; distribution is unlimited.

Report Documentation Page Form ApprovedOMB No. 0704-0188
Public reporting burden for the collection of information is estimated to average 1 hour per response, including the time for reviewing instructions, searching existing data sources, gathering andmaintaining the data needed, and completing and reviewing the collection of information. Send comments regarding this burden estimate or any other aspect of this collection of information,including suggestions for reducing this burden, to Washington Headquarters Services, Directorate for Information Operations and Reports, 1215 Jefferson Davis Highway, Suite 1204, ArlingtonVA 22202-4302. Respondents should be aware that notwithstanding any other provision of law, no person shall be subject to a penalty for failing to comply with a collection of information if itdoes not display a currently valid OMB control number.
1. REPORT DATE NOV 2010 2. REPORT TYPE
3. DATES COVERED 00-00-2010 to 00-00-2010
4. TITLE AND SUBTITLE Experimental Methodology Using Digital Image Correlation (DIC) ToAssess Ballistic Helmet Blunt Trauma
5a. CONTRACT NUMBER
5b. GRANT NUMBER
5c. PROGRAM ELEMENT NUMBER
6. AUTHOR(S) 5d. PROJECT NUMBER
5e. TASK NUMBER
5f. WORK UNIT NUMBER
7. PERFORMING ORGANIZATION NAME(S) AND ADDRESS(ES) Army Research Laboratory,Aberdeen Proving Ground,MD,21005
8. PERFORMING ORGANIZATIONREPORT NUMBER
9. SPONSORING/MONITORING AGENCY NAME(S) AND ADDRESS(ES) 10. SPONSOR/MONITOR’S ACRONYM(S)
11. SPONSOR/MONITOR’S REPORT NUMBER(S)
12. DISTRIBUTION/AVAILABILITY STATEMENT Approved for public release; distribution unlimited
13. SUPPLEMENTARY NOTES
14. ABSTRACT As modern helmets have become quite capable of defeating the penetration capabilities of ballistic threats,Soldiers may experience head injuries due to blunt trauma caused by helmet back face deformation (BFD).Possible resulting injuries include skull fracture, hematoma, concussion,contusion, diffuse axonal injury,etc. Some of these injuries have been associated with traumatic brain injury.
15. SUBJECT TERMS
16. SECURITY CLASSIFICATION OF: 17. LIMITATION OF ABSTRACT Same as
Report (SAR)
18. NUMBEROF PAGES
30
19a. NAME OFRESPONSIBLE PERSON
a. REPORT unclassified
b. ABSTRACT unclassified
c. THIS PAGE unclassified
Standard Form 298 (Rev. 8-98) Prescribed by ANSI Std Z39-18

Abstract
As modern helmets have become quite capable of defeating the penetration capabilities ofballistic threats, Soldiers may experience head injuries due to blunt trauma caused by helmet backface deformation (BFD). Possible resulting injuries include skull fracture, hematoma, concussion,contusion, diffuse axonal injury, etc. Some of these injuries have been associated with traumaticbrain injury.
In order to assess potential injury mechanisms prior to fielding new helmets, we have developed ameans to experimentally replicate and measure helmet BFD that can be correlated to injurycriteria. In this study, helmet performance test methodology is developed using a digital imagecorrelation (DIC) technique. DIC provides the capability to measure dynamic displacements,thereby, providing the ability to calculate deformation, velocity and acceleration rates. We haveshown that digital image correlation is an experimentation technique that accurately capturesBFD area and rate of deformation for impacts against combat helmets. We used the DIC data tocalculate a new metric; the available energy that could potentially impact a Soldiers head, thus,showing that DIC can be used to provide dynamic helmet performance data that will allowincreased understanding of BFD and quantitative assessment and validation of helmetperformance results.
Our study shows that DIC data upholds the hypothesis that helmet BFD mechanically loads theskull similar to a direct impact from a less-than-lethal projectile or blunt object impact. Theavailable energy obtained from DIC measurements was used to calculate the blunt criterion (BC)for helmet standoff distances of .5 in and .75 in, which in turn can provide a prediction of theprobability of abbreviated injury scale (AIS) levels and, in particular, skull fracture.
Knowledge of the conditions leading to head trauma obtained through experimentation ornumerical modeling should enable the selection of new energy-absorbing materials for helmets.The ultimate goal of future instrumentation and methodology efforts should allow helmet designcandidate performances to be objectively evaluated. Test data and characterization of helmetresponse could then be used to achieve improved warfighter survivability.

Report Documentation Page
Insert the “Report Documentation Page” here.
ii

Contents
List of Figures v
List of Tables vi
1. Introduction 11.1 Helmet Back Face Deformation (BFD) and Behind Armor Blunt Trauma (BABT) . . . 11.2 Experimentation Techniques for Replicating and Measuring Helmet BFD . . . . . . . . . 2
2. Objectives 2
3. Approach/Methods 33.1 Criteria to Predict Blunt Impact Injury and Guide Experimentation . . . . . . . . . . . . . . . 33.2 DIC Concepts . . . . . . . . . . . . . . . . . . . . . . . . . . . . . . . . . . . . . . . . . . . . . . . . . . . . . . . . . 4
3.2.1 Calibration . . . . . . . . . . . . . . . . . . . . . . . . . . . . . . . . . . . . . . . . . . . . . . . . . . . . . 43.2.2 Noise Floor . . . . . . . . . . . . . . . . . . . . . . . . . . . . . . . . . . . . . . . . . . . . . . . . . . . . . 5
3.3 Gaining Experience with DIC using Pendulum Impacts . . . . . . . . . . . . . . . . . . . . . . . . 53.3.1 Pendulum Impacts on Cardboard . . . . . . . . . . . . . . . . . . . . . . . . . . . . . . . . . . . . 63.3.2 Pendulum Impacts on Copper . . . . . . . . . . . . . . . . . . . . . . . . . . . . . . . . . . . . . . . 6
3.4 Range and DIC Set-up for 9 mm Impacts on Helmets . . . . . . . . . . . . . . . . . . . . . . . . . 73.4.1 Helmet Mounting Technique . . . . . . . . . . . . . . . . . . . . . . . . . . . . . . . . . . . . . . . 83.4.2 Surface Preparation, Dot Pattern, and Lighting . . . . . . . . . . . . . . . . . . . . . . . . . 9
4. Results and Discussion 94.1 Overview of DIC Tests for 9 mm Shots Against Helmets . . . . . . . . . . . . . . . . . . . . . . . 94.2 Available Energy for Potential Impact to Solider’s Head . . . . . . . . . . . . . . . . . . . . . . . 104.3 Using DIC Measurements to Calculate Energy for Blunt Criterion . . . . . . . . . . . . . . . 114.4 BFD Velocity Surface Plot . . . . . . . . . . . . . . . . . . . . . . . . . . . . . . . . . . . . . . . . . . . . . . . 134.5 Summary of Helmet Results . . . . . . . . . . . . . . . . . . . . . . . . . . . . . . . . . . . . . . . . . . . . . 144.6 Similarity of Helmet BFD to Blunt Object Impact . . . . . . . . . . . . . . . . . . . . . . . . . . . . 16
5. Conclusions 16
6. Recommendations 17
7. References 18
List of Symbols, Abbreviatons, and Acronyms 21
iii

Distribution List 23
iv

List of Figures
Figure 1. Dynamic (increasing time left to right) development of helmet back-face deformation 12 Hypothesis question: Is helmet BFD similar to blunt impact? . . . . . . . . . . . . . . . . . . . . 2Figure 3. Noise floor measurement . . . . . . . . . . . . . . . . . . . . . . . . . . . . . . . . . . . . . . . . . . . . . . 5Figure 4. DIC image for cardboard impact (a) before tearing (b) after tearing . . . . . . . . . . . . . 6Figure 5. DIC and FARO R© images for copper plate impact . . . . . . . . . . . . . . . . . . . . . . . . . . 7Figure 6. Range schematic for 9mm shots against helmets . . . . . . . . . . . . . . . . . . . . . . . . . . . . 8Figure 7. Process of small arms penetration into a composite laminate . . . . . . . . . . . . . . . . . . 10Figure 8. Dissected helmet and mushroomed 9mm bullet . . . . . . . . . . . . . . . . . . . . . . . . . . . . . 11Figure 9. DIC deformation contours for 9 mm impact (a) at helmet standoff (b) at maximum
deformation . . . . . . . . . . . . . . . . . . . . . . . . . . . . . . . . . . . . . . . . . . . . . . . . . . . . . . . . . . . . 12Figure 10. DIC time histories and surface contours for 9 mm impact (a) at helmet standoff
(b) at maximum deformation . . . . . . . . . . . . . . . . . . . . . . . . . . . . . . . . . . . . . . . . . . . . . . 13Figure 11. BFD velocity surface plot . . . . . . . . . . . . . . . . . . . . . . . . . . . . . . . . . . . . . . . . . . . . . 13Figure 12. Cumulative available energy, effective area and BC time histories . . . . . . . . . . . . . 15Figure 13. Helmet BFD similar to blunt object impact . . . . . . . . . . . . . . . . . . . . . . . . . . . . . . . 16
v

List of Tables
Table 1. Summary of helmet tests . . . . . . . . . . . . . . . . . . . . . . . . . . . . . . . . . . . . . . . . . . . . . . . 9Table 2. Summary of helmet results . . . . . . . . . . . . . . . . . . . . . . . . . . . . . . . . . . . . . . . . . . . . . 14
vi
1. Introduction
As modern helmets and body armor have become quite capable of defeating the penetrationcapabilities of ballistic threats, Soldiers are surviving injuries that would have been potentiallyfatal in previous wars. However, Soldiers may now experience injuries due to behind armor blunttrauma (BABT) (1–3) . For example, a .44 Magnum has almost twice the energy of all the othercalibers identified under Henry Packard White Test Procedure Level IIIA for helmets (4). Thehelmet will stop the projectile, but the resultant blunt trauma is likely to cause serious injury (5).When the impact energy of a threat on a helmet is converted to other forms of energy, onepotential phenomenon that can occur is helmet back face deformation (BFD).
1.1 Helmet Back Face Deformation (BFD) and Behind Armor Blunt Trauma (BABT)
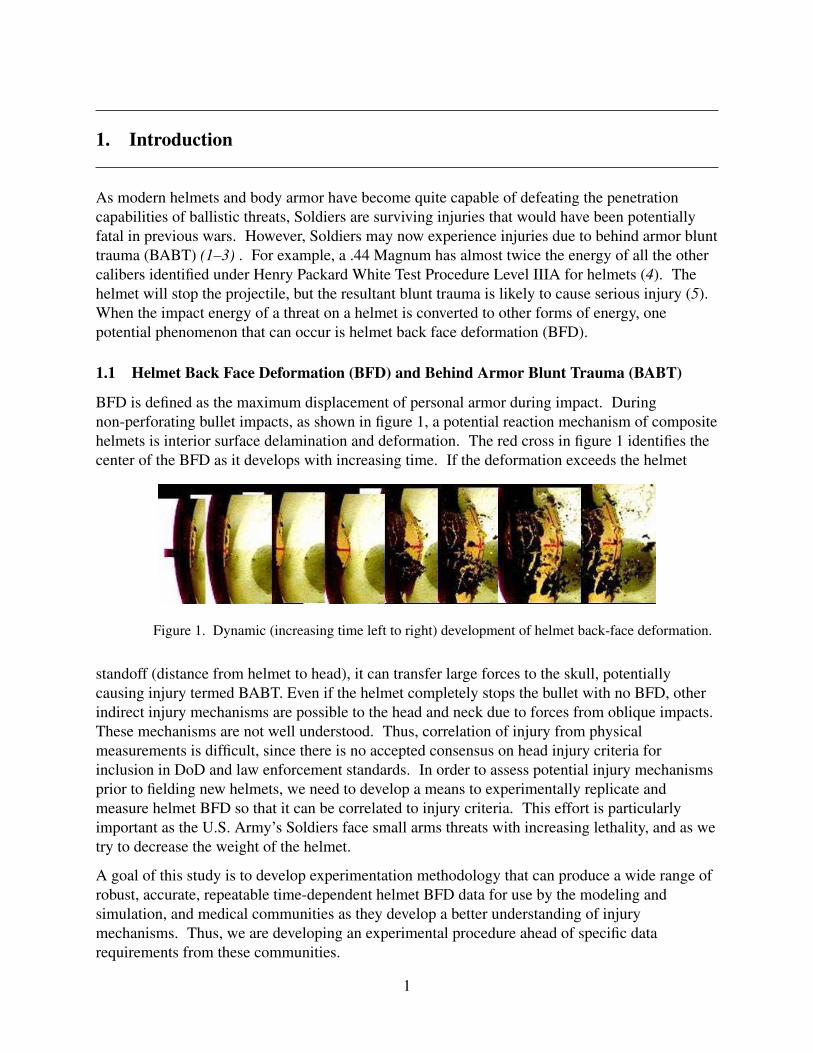
BFD is defined as the maximum displacement of personal armor during impact. Duringnon-perforating bullet impacts, as shown in figure 1, a potential reaction mechanism of compositehelmets is interior surface delamination and deformation. The red cross in figure 1 identifies thecenter of the BFD as it develops with increasing time. If the deformation exceeds the helmet
Figure 1. Dynamic (increasing time left to right) development of helmet back-face deformation.
standoff (distance from helmet to head), it can transfer large forces to the skull, potentiallycausing injury termed BABT. Even if the helmet completely stops the bullet with no BFD, otherindirect injury mechanisms are possible to the head and neck due to forces from oblique impacts.These mechanisms are not well understood. Thus, correlation of injury from physicalmeasurements is difficult, since there is no accepted consensus on head injury criteria forinclusion in DoD and law enforcement standards. In order to assess potential injury mechanismsprior to fielding new helmets, we need to develop a means to experimentally replicate andmeasure helmet BFD so that it can be correlated to injury criteria. This effort is particularlyimportant as the U.S. Army’s Soldiers face small arms threats with increasing lethality, and as wetry to decrease the weight of the helmet.
A goal of this study is to develop experimentation methodology that can produce a wide range ofrobust, accurate, repeatable time-dependent helmet BFD data for use by the modeling andsimulation, and medical communities as they develop a better understanding of injurymechanisms. Thus, we are developing an experimental procedure ahead of specific datarequirements from these communities.
1

1.2 Experimentation Techniques for Replicating and Measuring Helmet BFD
A promising experimentation technique for helmet test methodology and the subject of this reportis digital image correlation (DIC) – a non-contact, optical technique that can be used to measurethree-dimensional (3-D) deformations. DIC can provide area or volume of back facedeformation, velocity and acceleration of back face deformation, and in-plane strainmeasurements. Previously at the U.S. Army Research Laboratory (ARL), DIC has been used byYu et al.(6, 7) and Weerasooriya (8) to measure transient deformation of the back surface ofcomposite material and experimental helmets during impact. Their purpose was to collecttransient displacement and strain history data to improve understanding of various materials andadvance their finite element analysis (FEA) models.
By using DIC to collect helmet BFD data, it is possible to compute a new helmet performancemetric; the “available energy” that might be potentially imparted to a Soldier’s head. Thus, a newexperimentation methodology to test and evaluate helmet BFD characteristics that is dynamic andpreviously correlated to injury will be presented. This approach advances the state-of-the-art inhelmet BFD evaluations from using only static, post-impact metrics (deformation into clay) todynamic, fully profiled (volume, velocity, etc.) helmet BFDs.
2. Objectives
Ballistic impact to a Soldier’s helmet by small arms is typically seen as a high-speed, low-massimpact. However, when a composite helmet is used as protective equipment, the ballistic impacttransferred to the Soldier’s head is lessened to a lower speed, slightly higher mass impact causedby helmet BFD.
Figure 2: Hypothesis question: Is helmet BFD similar to blunt impact?
2

As shown in figure 2 (9), we want to test the hypothesis that helmet BFD mechanically loads theskull similar to a direct impact from a less-than-lethal projectile or blunt object impact.Thebenefit of relating helmet BFD to blunt object impact is to take advantage of the more prevalentdata that exists for relating the tolerance of the head to blunt, non-lethal impacts as developed bythe automotive, sports, and law enforcement communities.
The objectives of this program are to: 1) gain experience with, and demonstrate the utility of DICas a tool to enable calculations of the energy required for the blunt criterion injury metric and 2)test the hypothesis that helmet BFD mechanically loads the skull similar to a direct impact from aless-than-lethal projectile or blunt object impact.
3. Approach/Methods
ARL has a well-established history of experimentation expertise to measure and characterizesmall arms ballistic impacts on many types of armor. In current helmet experimentation, it isroutine to test for perforation/no perforation, V0, and V50 ballistic resistance metrics. Thesemetrics are determined from a series of ballistic shots, executed for a specific threat and helmetusing methodology described in NIJ-STD-0106.01 (10), MIL-STD-662F (11) and the modifiedLanglie Users Manual (12). Complete or partial penetration data are only required to calculatethese static metrics. In this study, a new test methodology for obtaining dynamic (vice static)impact metrics for ballistic helmet BFD is examined.
3.1 Criteria to Predict Blunt Impact Injury and Guide Experimentation
Some experimental measures have been developed by the automotive and sports industries toassess injury risks for low speed, high mass impacts. Criteria such as head injury criteria (HIC),viscous criterion, angular rotation thresholds, translational acceleration limits, and head impactpower have been proposed. It is commonly accepted that skull fracture can be related tomaximum dynamic force; however, there is no consensus on the criteria to use to cover the fullspectrum of possible head injuries.
Sturdivan (13) states that no one injury model works well across the spectrum of blunt head andneck injuries due to the different mechanisms that are potentially involved. Sturdivan describesthe four basic injury mechanisms as the following:
• Skull fracture, with damage to the underlying tissue (brain, cranial nerves, blood vessels).
• Shear injury from rapid rotation of the skull combined with a lagging rotation of contents.
• Cavitation caused by differential acceleration of the skull and its contents.
• Fractures to the cervical spine, connective tissue injury, and spinal cord injury from bendingor twisting stress caused by the differential motion between the head and trunk.
3

Sturdivan indicates the physical quantity that properly expresses the capacity to do work on tissueand cause damage from blunt impact is energy. He proposes the blunt criterion (BC) as aprospective measure to predict head injury from blunt, less-than-lethal projectiles.
BC = ln(
ET ∗D
), (1)
where E is the impact kinetic energy in Joules, D is the diameter of the projectile in centimeters(if impact area is circular), and T is the thickness of the skull in millimeters.
The BC has been demonstrated to correlate very well with experimental data published fromcadaver and animal studies (5–7). Until more input from the medical community andindependent validation of injury models are performed, we believe the BC will provide a goodstarting point for injury correlations due to helmet BFD. Therefore, we strive to develop nextgeneration ballistic helmet test methodology for non-penetrating impacts that allows us tomeasure the energy required for BC calculations in addition to maximum dynamic force.
3.2 DIC Concepts
DIC is a promising technique that can measure area or volume of back face deformation, rate ofback face deformation (velocity), and acceleration. The DIC system used in this study wasdeveloped by GOM Optical Measuring Techniques of Braunschweig, Germany and utilizes asoftware package called ARAMIS (16).
Three-dimensional DIC uses two high-speed cameras to stereoscopically track the movement of agrey scale or dot pattern in space. For this study, a dot pattern is applied to the inside surface of ahelmet with padding and harnesses removed. During ballistic impact of the helmet, the camerasand software track changes in the dot pattern. The 3-D coordinates of specific surface locationsare determined, and the movement of those discrete locations relative to each other over time iscomputed. In the DIC software, any single data point within the dot pattern can be selected andits time history displayed. The time dependent values of the entire surface of data points can beexported and post-processed as needed. This is a powerful technique for capturing dynamicdeformation, volume, velocity, and acceleration data. DIC is well-suited for 3-D displacementmeasurements under static and dynamic load in order to analyze deformations and strain.
3.2.1 Calibration
To measure helmet BFD, the deforming helmet surface needs to stay within a calibratedmeasuring volume. The calibrated measuring volume is mapped out by moving National Instituteof Standards and Technology (NIST)-traceable calibration panels with refererence points throughspace in a predetermined sequence. As part of the calibration process, the distance between thecameras and the orientation of the cameras relative to each other is determined. Using thetwo-dimensional (2-D) camera images, the software triangulates the 3-D coordinates of thereference points. The calculated 3-D coordinates are “calculated back” again into the 2-D cameracoordinate system. The difference between the original and recomputed 2-D camera coordinatesis called the reference point deviation. The calibration deviation is calculated from the averagereference point deviation of all points recorded during the calibration process. For correct
4

calibration, calibration deviation should be between .02 and .08 pixels (16). Decalibration mayoccur if any changes are made to the cameras’ positions or focal lengths.
3.2.2 Noise Floor
A noise floor measurement, shown in figure 3, should be made preliminary to any testing. Thisnoise floor determination will show the level of ambient environment (temperature, vibration, aircurrents) and testing system noise. The noise floor measurement is made using the identical setupof the test situation; i.e., target is mounted as in the actual test, lighting and camera settings aremade identical to actual testing environment, target surface preparation is made as in the actualtest. The video acquisition is done as though measuring an actual event by collecting about adozen or more frames of video for the noise floor measurement.
Figure 3. Noise floor measurement.
In practice, a noise floor can be collected during any test, as the stages prior to any targetdeformation, by saving a few frames of the video before impact. At this point in the DIC systemsetup, we are interested in observing and diagnosing any unusually high level of noise with anattempt toward attenuating its source.
In figure 3, the highest level of noise deformation at any point on the surface, relative to the zerostage, is shown as the maximum value at either end of the auto-scaled index. This value shouldbe relatively low, compared to the expected deformation of the target upon testing. In this samplestage, the maximum noise deformation is 0.140 mm which is about 0.6 % of the expecteddeformation of 25 mm. How low the noise floor level should be depends on specific testrequirements and engineering judgment.
3.3 Gaining Experience with DIC using Pendulum Impacts
In order to gain experience with DIC, pendulum impacts on cardboard and copper plates wereperformed. The impacts produced a dynamic bulge formation in the plates that was tracked using
5

DIC and then compared to FARO R©∗ arm measurements. From these experiments, familiaritywith the software, cameras, lighting and deforming surface preparation were obtained.
3.3.1 Pendulum Impacts on Cardboard
As a preliminary step in our analysis of the DIC system, steps were taken to record and measurethe deformation created by dropping a pendulum onto a piece of conventional corrugatedcardboard. The virtue of a pendulum is that it can provide consistent impact energies from agiven release height; therefore, comparisons can be made between impacts onto various targets.
A one-foot-square piece of corrugated cardboard was attached to a sturdy steel frame by clampsat the four corners. A hex bolt was attached to the face of the pendulum bob and the head of thebolt was aligned to impact the center of the cardboard squarely. The noise floor measurementpreviously mentioned was done and found acceptable.
(a) (b)
Figure 4. DIC image for cardboard impact (a) before tearing (b) after tearing.
Figure 5 shows DIC images for the cardboard impact before and after tearing. The upper imagesshow the left and right camera views, respectively. The bottom right images show surfacedeformation contour plots. The black line across the middle of the surface contour plotshighlights where data is collected to produce the displacement versus section length data shown inthe bottom left images. The displacement versus section length contours start at zero time andincrease in time until the contours show rupture.
The bulge formation in the cardbord was tracked up to the point where the cardboard ruptured.Even after the cardboard developed a tear, the DIC software did an excellent job of computing thedata around and up to the rupture. Comparison of the tear computed by the DIC software and thetear captured by the camera images reveals a very similar pattern.
3.3.2 Pendulum Impacts on Copper
Next, pendulum impacts were done on a 1-ft2 sheet of 0.0625 in copper plate. It was alsomounted to the stand by the four corners with clamps, and was impacted by the bolt head of the∗FARO is a registered trademark of FARO Technologies, Inc.
6
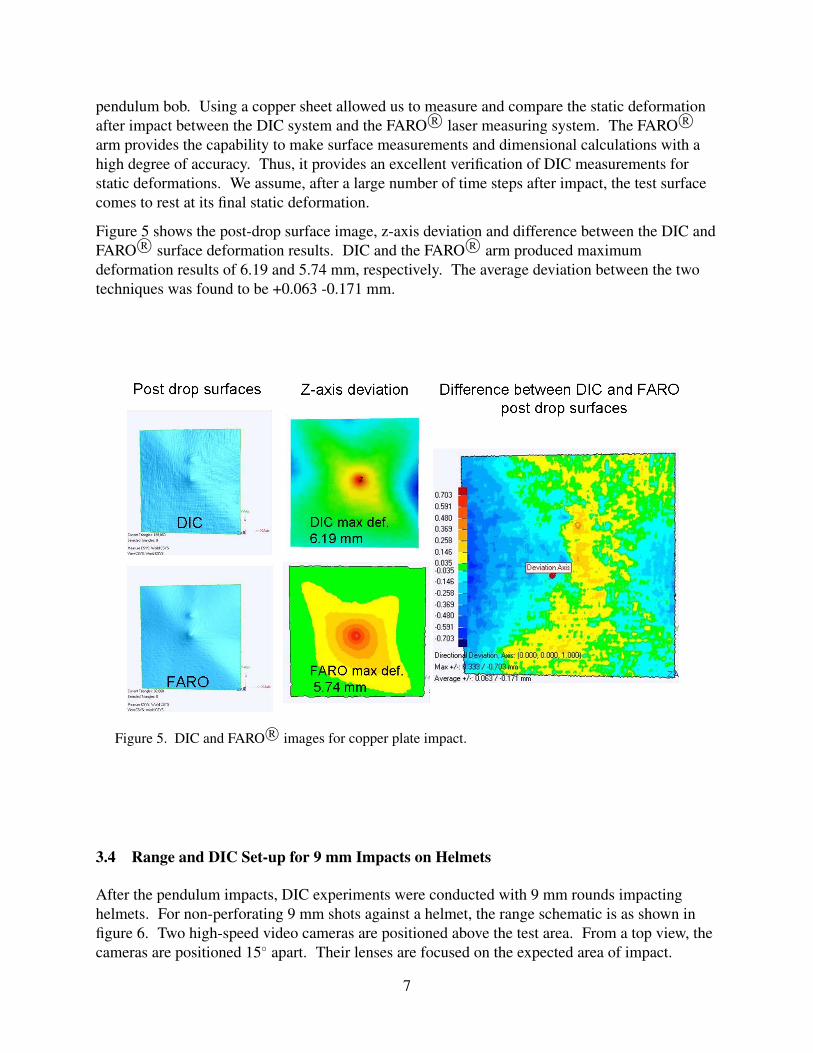
pendulum bob. Using a copper sheet allowed us to measure and compare the static deformationafter impact between the DIC system and the FARO R© laser measuring system. The FARO R©arm provides the capability to make surface measurements and dimensional calculations with ahigh degree of accuracy. Thus, it provides an excellent verification of DIC measurements forstatic deformations. We assume, after a large number of time steps after impact, the test surfacecomes to rest at its final static deformation.
Figure 5 shows the post-drop surface image, z-axis deviation and difference between the DIC andFARO R© surface deformation results. DIC and the FARO R© arm produced maximumdeformation results of 6.19 and 5.74 mm, respectively. The average deviation between the twotechniques was found to be +0.063 -0.171 mm.
Figure 5. DIC and FARO R© images for copper plate impact.
3.4 Range and DIC Set-up for 9 mm Impacts on Helmets
After the pendulum impacts, DIC experiments were conducted with 9 mm rounds impactinghelmets. For non-perforating 9 mm shots against a helmet, the range schematic is as shown infigure 6. Two high-speed video cameras are positioned above the test area. From a top view, thecameras are positioned 15◦ apart. Their lenses are focused on the expected area of impact.
7

Figure 6. Range schematic for 9mm shots against helmets.
Additional details pertinent to the firing sequence are as follows:
• Gun was a 9 mm Aero tube, 8.25 in long, 1:10 twist, 6 groove (Bill Wiseman .357 Magnumber: 1), fired by solenoid.
• Muzzle to target distance of 254.5 in.
• Triggering screens were 4 in diameter (Whithner #0303375D00) held in a custom builtholder with 0.500 m separation. Average velocity at the midpoint between screensdetermined by dividing the 0.500 m separation by the time interval.
• Second screen to target distance of 50.5 in.
• Time intervals were measured using Agilent universal counter model 53131A (225 MHz,s/n: MY47003526). The time intervals are sent to a LabVIEW program to display velocityin ft/s and m/s. The program also records range temperature and humidity as well as: shotsper barrel, projectile, propellant type, and load.
3.4.1 Helmet Mounting Technique
A single clamp to secure the helmet was initially tried, but did not work because often the impactwould cause the helmet to move with the deformation. A more secure clamping of the helmetwas used to reduce the effects of impact momentum. The ARAMIS software has the capability tocompensate for full body motion such that only local deformations are tracked; however, forsimplicity and repeatability, we secured the helmet to prevent full body motion. In the future,boundary conditions that better emulate the biofidelic neck movement of a Soldier are desirable.
8

3.4.2 Surface Preparation, Dot Pattern, and Lighting
In order to prepare helmets for DIC testing, the interior surface of the helmets were lightly sandedto remove any loose paint present that might fly off during ballistic impact. Then, an ink dotpattern was applied to the helmet’s interior surface where deformation was expected to occur.Initially, the dot pattern was applied by hand using permanent ink markers. This process workedwell, but was found to be labor intensive and tedious. Subsequently, an ink tattoo was developedby the ARAMIS technical representative for our use. The ink tattoo was found to work as well asthe hand-applied ink dots, but with significantly less application labor. One difficultyencountered when attempting to use DIC on a helmet is getting optimal lighting to illuminate thecurvature of the helmet interior where deformation is expected to occur. The high-speed cameraimages taken during DIC data collection required camera speeds of 50,000 frames per second andshutter speeds of 1/(frame speed) seconds. At these camera speeds, an intense light source isneeded to uniformly illuminate the helmet surface without introducing glare or shadows. Lightsource placement was achieved through trial and error while taking noise floor images.
4. Results and Discussion
4.1 Overview of DIC Tests for 9 mm Shots Against Helmets
A total of fifteen 9 mm shots against large and extra-large size helmets (noted in comments intable 1) were performed to the left, right, front, back, and crown locations of the helmets asdescribed in NIJ-STD-0106.01 (10). The bullet velocities were in the range of 1215± 25 ft/s,which is slightly above the required velocity range of 1175 ± 50 ft/s indicated in the NIJstandard. The total yaw was less than 5◦ for all cases. The impact kinetic energy of the roundswere in the range of 555 ± 25 J. Details of the impact conditions are provided in table 1.
Table 1. Summary of helmet tests.
9

Data could not be collected (dots required for DIC flew off or disappeared) for shots 6, 11, and 14(missing in the table) due to surface preparation or delamination issues. In some cases, thecomments in the table indicate the final layer of composite material delaminated during the BFDof the helmet. Delamination is the separation between fibers and the matrix material of acomposite material. Delamination of the final layer of composite material typically occurs whenBFD is centered on a seam present in the final layer of the helmet.
4.2 Available Energy for Potential Impact to Solider’s Head
The process of small arms penetration into compliant, composite laminates as described byCheeseman and Bogetti (17) is shown in figure 7. The bulging of the back surface illustrates thehelmet BFD we are replicating and measuring. For non-perforating impacts, the remaining pliesof composite material eventually stop the bullet, but not always before the bulging area of thehelmet impacts the Soldier’s head with significant force. The bulging area impacts the Soldier’shead from the helmet standoff distance until the point of maximum helmet BFD. During thisprocess, it would be useful to know the available energy that could be potentially deposited into aSoldier’s head as a predictor of injury.
Figure 7. Process of small arms penetration into a composite laminate.
In figure 8, the interior composite plies of a shot helmet can be seen. The helmet was dissected toreveal the delamination of the interior composite layers. We were able to extract the mushroomed9 mm bullet that was captured in the composite layers. The back surface of the bullet is shown inthe left of the image. Also, the side view of the dissected helmet reveals the bulging of the backsurface and cavity that results after coming to a static resting point. The cavity at the top of thefigure is from a different shot.
10

Figure 8. Dissected helmet and mushroomed 9mm bullet.
4.3 Using DIC Measurements to Calculate Energy for Blunt Criterion
As indicated by equation (1), the blunt criterion is a function of impact kinetic energy, thicknessof the skull, and projectile or blunt object effective diameter (the diameter of the contact areabetween the skull and the striking surface). The average thickness of the skull used in this studyis 6.8 mm. By using DIC to collect helmet BFD and velocity data, it is possible to compute theavailable energy that might be potentially imparted to a Soldier’s head. The available impactenergy in a differential area of helmet surface is equivalent to the kinetic energy that the helmetarea possesses when it deforms to the helmet standoff distance (0.5 in). This available energyquantity can be used to calculate the blunt criterion metric, which in turn provides a prediction forAIS levels and skull fracture.
E = Available EnergyBFD = E 12 in− Emax def (2)
E =∫
F (x) dx =∫
F (t)v (t) dt (3)
E =∫
m (t)a (t)v (t) dt (4)
E =∫ 1
2 in
max defρ (t) Vol (t)a (t)v (t) dt (5)
11

E =12
ρ (t)effective area(t)v2 (t) |12 inmax def (6)
As shown in equation (5), the available energy from helmet BFD can be computed where ρ is theareal density of the remaining plies of helmet after partial penetration of the round. For thisstudy, ρ is set to 1.5 lbsf, three-fourths its typical value of 2.0 lbsf, to approximate the pliesremaining after ballistic impact. In future work, better estimates of the remaining plies afterimpact will be obtained by x-ray or helmet dissection. In equation (5), Vol is the volume, a is theacceleration and v is the velocity of the helmet BFD region.
However, it is computationally simpler to use the instantaneous velocity as provided by DICmeasurements rather than integrate to find it. It is also more accurate, since acceleration valuesare a) subject to far more error, and b) instantaneous velocity is more representative of what wasactually measured, i.e., displacement. Thus, we obtain the instantaneous energy by computing 1
2m(t) v2(t) where m(t) is computed from ρ times the area associated with the effective diameter asshown in equation (6). The mass of the bullet is also included in m(t). Thus, the availableenergy is accumulated from 1
2 in., reached at 220 µsec in figure 9a, to maximum deformation at740 µsec in figure 9b for a sample case (shot 16 in table 2).
(a) (b)
Figure 9. DIC deformation contours for 9 mm impact (a) at helmet standoff (b) at maximumdeformation.
In figure 10a, the three red x’s show the values of displacement, velocity, and acceleration,respectively, for a point located at the center of the bulge area (reference point 1), at 220 µsec.The red x’s in figure 10b show the values of the same variables at 740 µsec. With thepostprocessing available in ARAMIS, the data for all points within the deforming surface bulgecan be output to a text file. Then, the data for displacement, velocity and acceleration can begraphed with respect to time or postprocessed using a MATLAB program to produce the availableenergy from helmet BFD.
12

(a) (b)
Figure 10. DIC time histories and surface contours for 9 mm impact (a) at helmet standoff (b) atmaximum deformation.
4.4 BFD Velocity Surface Plot
Shown in figure 11 is a surface plot of maximum velocity for shot 16 of 2,939 surface points aftereach point crossed the 0.5 in standoff distance. These velocities were typically decreasing as theypassed the standoff distance, which is consistent with the process of the composite fibers retardingthe forward motion of the projectile until a point of maximum deformation is reached. After thepoint of maximum deformation, the deforming surface often rebounds as seen in high speed videoand the last frame of figure 1. The velocity is an important parameter as it is the dominant factorin calculations for the available energy used to compute the BC.
Figure 11. BFD velocity surface plot.
13

4.5 Summary of Helmet Results
In table 2, DIC results are summarized and the BC is calculated for the 9mm versus helmet shotsconducted in this study. At the time of maximum BFD, we can determine from DIC data theprojected area of impact to a Soldier’s head. We then compute an equivalent circular area fromwhich the effective diameter is determined. The maximum velocity typically occurs after impactand well before the point of maximum BFD as seen in figure 10b. Maximum z-axis deformationis the distance from a point on the surface of the helmet to its location at maximum deformationalong the direction of deformation. The available energy, effective diameter, and BC arecomputed assuming a helmet standoff distance (gap) of 0.5 in and 0.75 in. The actual standoffdistance of a helmet to a Solider’s head depends on pad thickness and personal anatomy and inreality is probably somewhere between these two distances. Therefore, the actual availableenergy and BC values also probably fall between the values noted in the chart for helmet standoffdistances of 0.5 in and 0.75 in.
Also evident from the table is that crown shots result in lower BC values than shots to the front,back or sides of the helmet. The crown of the helmet is stronger than the other sides due to itsinherently flatter geometry. Also, the composite layers in all areas except the crown have beencut to accomodate the manufacturing process required to mold flat sheets into the final curvedhelmet geometry.
Very little can be said about the spread of the data shown in table 2 for similar helmet locations.The helmets used in this study were not from the same lot number or even necessarily the samemanufacturer. They were excess helmets previously turned in to the Defense Reutilization andMarketing Services (DRMS) and used by this project to simply study feasibility of themethodology and techniques tested herein. In future efforts, it would be desirable to obtainunused helmets from the same manufacturer with the same lot number for all tests.
Table 2. Summary of helmet results.
In Sturdivan (13), the mean is the value of the model variable for which the predicted probability
14

of occurrence is 50 %. He describes the skull mean as equivalent to the energy-based BC.Sturdivan computes BC values using data from 25 to 28 gram impactors versus rehydrated skulls,filled and coated with 20% gelatin. For AIS levels of 2, 3, and 4, BC values reported bySturdivan were 0.5667, 0.8081 and 1.0527, respectively. Fitted mean BC values ranged from0.323 for AIS level 1 to 1.538 for AIS level 6. From table 2, Our BC values primarily fall in thesame range as Sturdivan’s reported values, although some values are higher, particularly for the0.5 in helmet standoff distance. Raymond et al. (15) report a 50 % risk of skull fracture for BCvalues greater than 1.61. However, Raymond used a slightly modified version (added M
13
multiplier to denominator where M is mass of struck cadaver) of Sturdivan’s BC. Raymond’saverage BC value was 2.12, obtained from fourteen direct impact tests of blunt objects againstcadaver skulls. In this study, we are approximating helmet BFD as an equivalent blunt object,and find it promising that our BC values fall in the same range as their experiments.
Figure 12. Cumulative available energy, effective area and BC time histories.
In figure 12, cumulative available energy and effective area as a function of time are provided forshot 16. The average BC between the .5 and .75 in data was computed to be 1.48. The trends inthese time histories are representative of the other shots as well. We note the effective areacontinues to increase with time although the available energy levels off at an earlier time. Aspreviously mentioned, from DIC deformation and velocity versus time charts (see figure 10b), thevelocity peaks and actually starts to decrease well before the maximum displacement is reached,thus supporting the trend found here in the available energy. Velocity is the predominant variableinfluencing the available energy and BC results. Although the area continues to increase, theenergy has leveled off meaning very little additional injury probably occurs at latter times and atthe point of maximum deformation. The more important time period is right after the initialimpact of helmet BFD when velocity and its contribution to available energy is the highest.
15

4.6 Similarity of Helmet BFD to Blunt Object Impact
When the helmet BFD data collected as part of this study is plotted on the log-log plot of velocityversus mass, it falls in the same realm of data as that of blunt object impact (see figure 13).
Figure 13. Helmet BFD similar to blunt object impact.
For the 9 mm threats and helmets tested in this study, the data confirms our original hypothesisthat helmet BFD mechanically loads the skull similar to a direct impact from a less-than-lethalprojectile or blunt object impact.
5. Conclusions
An experimentation technique that replicates the helmet and Soldier’s head as a system and canaccurately replicate biofidelic loading and response is desirable. However, our currentunderstanding of composite materials, varying properties of the human skull fromperson-to-person, and the many ways helmet manufacturers can use composites underperformance-based standards makes the problem intractable. Also, experimental methodology isdesirable that predicts injury potential using biofidelic, durable, repeatable and calibratedtechniques. However, experimental methodology that is both biofidelic and durable whenimpacting a fragile human skull or its surrogate is problematic.
Digital image correlation is a desirable experimentation technique that can be used to accuratelycapture BFD area and rate of deformation for a helmet undergoing impact from a small armsround. As the helmet deforms from the standoff distance to its point of maximum BFDdeformation, these data can be used to calculate an available energy that could potentially impacta Soldier’s head. Thus, DIC is an excellent helmet experimentation technique for providingaccurate helmet performance data that will allow increased understanding of BFD and quanitative
16

assessment and validation of helmet performance results. The added complication of determininghow this available energy is actually absorbed by the Soldier’s head, is not necessary to provide afirst order, conservative estimate of injury potential. It may be desirable to bring down thisconservative estimate by developing correction factors for pads, and other energy absorptionliners.
For the 9 mm threats and helmets tested in this study, the DIC data confirms our originalhypothesis that helmet BFD mechanically loads the skull similar to a direct impact from aless-than-lethal projectile or blunt object impact. Thus, if we assume all the available energyfrom helmet BFD is absorbed by the head, the resulting blunt criterion calculation provides aconservative prediction of AIS levels and skull fracture.
Finally, a new experimentation methodology to test and evaluate helmet BFD characteristics thatis dynamic and correlated to injury has been presented. Utilizing DIC data, a new metric,available energy for potential impact to a Soldier’s head, has been developed that allows one tocompute a conservative estimate of the blunt criterion. This experimentation methodologyadvances the state-of-the-art in helmet BFD evaluations from using only static, post-impactmetrics (deformation into clay) to dynamic, fully profiled (volume, velocity, etc.) helmet BFDs.
6. Recommendations
In this study, estimates of the areal density of the remaining plies of composite material afternon-perforating impact were made in order to compute the BC. In the future, the areal densitywill be more accurately determined using x-ray or helmet dissection. Another methodologyimprovement would be to mount the helmet with boundary conditions that simulate how thehelmet is actually constrained when worn by a Soldier. Future studies should use helmets that arefrom the same manufacturer and have the same lot number. In future studies, it might also bepossible to reduce the available energy that could potentially impact a Soldier’s head bycorrection factors for pads, or other energy absorption liners.
The BC data produced by the methodology outlined in this report is compared to BC injurycorrelations previously performed by others. However, it would be more desirable to obtaininjury correlations where our dynamic BFD data is used as the loading condition for post-mortemhuman subject tests.
The complex response of composite materials can potentially make the experimentalcharacterization of helmet deformation expensive and time consuming. Therefore, aphysics-based finite element analysis simulation capability will be pursued to supplement andvalidate our experimental data.
In addition, blunt trauma may also be caused by rapid translational and rotationalaccelerations/decelerations of the head with respect to spinal joints as a result of ballistic helmetimpacts. Future work will focus on techniques for experimentally capturing these accelerationsand making correlations to possible injury.
17

Finally, knowledge of the conditions leading to head trauma obtained through experimentation ornumerical modeling should enable the selection of new energy-absorbing materials for helmets.The ultimate goal of future instrumentation and methodology efforts should allow helmet designcandidate performances to be objectively evaluated. Test data and characterization of helmetresponse could then be used to achieve improved warfighter survivability.
7. References
1. Mahoney, P.; Ryan, J.; Brooks, A.; Schwab, C. Ballistic Trauma, A Practical Guide,second ed.; Springer-Verlag, 2005.
2. Cannon, L. Behind Armour Blunt Trauma - an emerging problem. J R Army Med Corps2001, 147 (1), 87–96.
3. Carroll, A.; Soderstrom, C. A New Nonpenetrating Ballistic Injury. 1st NationalSymposium on Traumatology, 1978.
4. H.P. White Laboratory Inc. Test Procedure for Bullet Resistant Helmet. HPW-TP-0401.01B1995.
5. http://www.briscoetechnologies.com/vest.
6. Yu, J.; Hsieh, A.; Dehmer, P.; Sands, J. Real-Time Full-field Deformation Analysis on theBallistic Impact of Polymeric Materials Using High-speed Photogrammetry; ARL-RP-0290;U.S. Army Research Laboratory, 2010.
7. Yu, J.; Dehmer, P.; Yen, c. High-speed Photogrammetric Analysis on the Ballistic Behaviorof Kevlar Fabrics Impacted by Various Projectiles; ARL-TR-5333; U.S. Army ResearchLaboratory, 2010.
8. Weerasooriya, T.; Moy, P. “Measurement of Full-Field Transient Deformation of the BackSurface of a Kevlar KM2 Fabric during Impact for Material Model Validation.” Proceedingsof the 2008 International Congress and Exposition on Experimental Mechanics and AppliedMechanics, Orlando,Florida, 2008.
9. Sherman, D.; Bir, C. An Overview of Human Effects of Less-lethal Kinetic Energy Rounds.Wayne State University Presentation to Personnel Vulnerability Workshop, Army ResearchLaboratory, APG, MD, 2009.
10. National Insitute of Justice. NIJ Standard for Ballistic Helmets. NIJ Standard 0106.01 1981.
11. MIL-STD-662F. V50 Ballistic Test for Armor. Department of Defense Test MethodStandard, 1997.
12. Collins, J.; Moss, L. LangMod Users Manual. ARL Internal Document, 2008.
18

13. Sturdivan, L. Injury Criteria for Blunt Impact to the Head. Draft Report, 2005.
14. Sturdivan, L.; Viano, D.; Champion, H. Analysis of Injury Criteria to Assess Chest andAbdominal Injury Risks in Blunt and Ballistic Impacts. The Journal of Trauma Injury,Infection, and Critical Care 2005, 56, 651–663.
15. Raymond, R.; Van Ee, C.; Crawford, G.; Bir, C. Tolerance of the Skull to Blunt BallisticTemporo-parietal Impact. Journal of Biomechanics 2009, 42, 2479–2485.
16. ARAMIS v6.1 User Manual. Gom Optical Measuring Techniques,Braunschweig, Germany,2009.
17. Cheeseman, B.; Bogetti, T. Ballistic impact into fabric and compliant composite laminates.Composite Structures 2003, 61, 161–173.
19

INTENTIONALLY LEFT BLANK.
20

List of Symbols, Abbreviations, and Acronyms
ACH Advanced Combat HelmetAIS Abbreviated Injury ScoreARL U.S. Army Research LaboratoryBC blunt criterionBABT Behind Armor Blunt TraumaBFD back face deformationDAQ data acquisitionDIC digital image correlationFEA finite element analysisFMJ Full Metal JacketHIC head injury criteriaHPW Henry Packard WhiteISO International Organization for StandardizationLRHV Long Rifle High VelocityNIJ National Institute of JusticeNIST National Institute of Standards and TechnologyTBI traumatic brain injury
21

INTENTIONALLY LEFT BLANK.
22

NO. OFCOPIES ORGANIZATION
NO. OFCOPIES ORGANIZATION
1 AdmnstrDefns Techl Info CtrATTN DTIC OCP (Electronic Only)8725 John J Kingman Rd Ste 0944FT Belvoir VA 22060-6218
1 DARPAATTN IXO S Welby3701 N Fairfax DrArlington VA 22203-1714
1 Ofc of the Secy of DefnsATTN ODDRE (R&AT) (1 CD)The PentagonWashington DC 20301-3080
1 US Army Info Sys Engrg CmndATTN AMSEL IE TD A RiveraFT Huachuca AZ 85613-5300
1 CommanderUS Army RDECOMATTN AMSRD AMR W C McCorkle5400 Fowler RdRedstone Arsenal AL 35898-5000
1 US Army Rsrch LabATTN IMNE ALC HRR Mail &Records MgmtATTN RDRL CIM L Techl LibATTN RDRL CIM P Techl PubAdelphi MD 20783-1197
ABERDEEN PROVING GROUND
1 US Army Rsrch LabATTN RDRL CIM G T LandfriedBldg 4600Aberdeen Proving Ground MD21005-5066
11 DIR USARLRDRL SLB D
D HisleyJ GurganusA DrysdaleJ LeeS WilliamsR KinslerJ PolesneR Grote
RDRL SLB WW MermagenP GillichC KennedyN EberiusL RoachE Hanlon
RDRL WMT DR Kraft
RDRL WMM DS WalshL Vargas-Gonzalez
RDRL WMM EP Dehmer
RDRL WMM BJ Yu
23