
Experimental Investigation of Water Sand Mixed Fluid ...
18
Research Article Experimental Investigation of Water–Sand Mixed Fluid Initiation and Migration in Porous Skeleton during Water and Sand Inrush Xin Yang , 1,2 Yong J. Liu , 1 Ming Xue, 1 Tian H. Yang, 2 and Bin Yang 2 1 School of Civil and Transportation Engineering, Guangdong University of Technology, Guangzhou 510006, China 2 Centre of Rock Instability and Seismicity Research, School of Resources and Civil Engineering, Northeastern University, Shenyang 110819, China Correspondence should be addressed to Xin Yang; [email protected] and Yong J. Liu; [email protected] Received 9 December 2019; Revised 17 May 2020; Accepted 3 June 2020; Published 3 August 2020 Academic Editor: Ye Zhang Copyright © 2020 Xin Yang et al. This is an open access article distributed under the Creative Commons Attribution License, which permits unrestricted use, distribution, and reproduction in any medium, provided the original work is properly cited. Water–sand inrush is one of the most serious disasters for mining in China. The evaluation of the occurrence and development of a high-concentration water and sand mixed fluid is an important issue for mining in China. In this study, contraposing to the 3 phases of water–sand inrush, three kinds of experiments are designed for the investigation of initiation, development, and occurrence of the disaster. A new sand–water transport testing system is setup to perform the tests. The results show that there are two key points in the disaster: (1) sand particle incipient motion and (2) porous skeleton structural instability. The incipient motion of sand grains is accompanied with the phenomena of volumetric dilatation and granular fluidization. The critical velocity of the incipient motion of the water–sand mixed fluid is significantly affected by the particle size and external stress. The interaction between water and sand grains is the key factor affecting the motion characteristics of water–sand mixture. When the hydraulic conditions exceed the threshold, the water and sand grains are mutually promoted, and the aquifer skeleton becomes unstable. Furthermore, during the water–sand inrush, the curves of volumetric flow rates of sand and water, respectively, for different samples manifest as two distinct waveforms. 1. Introduction Water–sand inrush is a most serious mine disaster in western China, particularly in the Shaanxi province, the major energy resource centre of China [1, 2]. The typical geological charac- teristics of the coal mines in this area provide the conditions for the occurrence of water–sand inrush. According to the statistics data on the scenario of the water–sand inrush occurring in western China, accidents during coal mining extremely affect over 47.5% of the estimated reserves, equiv- alent to an excess of 100 billion tons [3]. These disasters cause serious damage, enormous financial loss, and numerous casualties. For example, when a water–sand inrush occurred at the Longde coal mine in 2012 [4], the total subsidence vol- ume reached 16 350 m 3 and the direct economic losses exceeded 100 million yuan. Another example is that of the serious water and sand inrush accident occurrence in the Halagou coal mine in 2010 [5]. In this case, the entire long- wall mining face and a large part of the roadways were bur- ied, and two large cone-shaped subsidence areas were formed with a height of 12 m and diameter of 47 m and a height of 9 m and diameter of 23 m, respectively. Another typical example is that of a highly serious water–sand inrush accident occurrence at the Ciyaowan coal mine of the Shenfu ore district in 1990 [6]. In this accident, the instantaneous inflow water volume reached up to 200 m 3 /h, and the 306- meter long underground mining face was buried such that the average buried thickness of the sediment exceeded 2 m. In addition to the threat to the safety of mining opera- tions, water–sand intrusion also causes serious environmen- tal issues [7, 8]. Therefore, over the past few years, simulation and laboratory investigations of the effects of a water–sand inrush on the hydrogeological characteristics, mechanism properties, and mining environment have been performed extensively [1, 9–12]. The results of these investigations show that during the process of a water and sand inrush, the sand– water mixed fluid can migrate through the cracks and broken rock mass and swarm into the working areas. Following this, Hindawi Geofluids Volume 2020, Article ID 8679861, 18 pages https://doi.org/10.1155/2020/8679861
Transcript of Experimental Investigation of Water Sand Mixed Fluid ...
Research ArticleExperimental Investigation of Water–Sand Mixed Fluid Initiationand Migration in Porous Skeleton during Water and Sand Inrush
Xin Yang ,1,2 Yong J. Liu ,1 Ming Xue,1 Tian H. Yang,2 and Bin Yang2
1School of Civil and Transportation Engineering, Guangdong University of Technology, Guangzhou 510006, China2Centre of Rock Instability and Seismicity Research, School of Resources and Civil Engineering, Northeastern University,Shenyang 110819, China
Correspondence should be addressed to Xin Yang; [email protected] and Yong J. Liu; [email protected]
Received 9 December 2019; Revised 17 May 2020; Accepted 3 June 2020; Published 3 August 2020
Academic Editor: Ye Zhang
Copyright © 2020 Xin Yang et al. This is an open access article distributed under the Creative Commons Attribution License, whichpermits unrestricted use, distribution, and reproduction in any medium, provided the original work is properly cited.
Water–sand inrush is one of the most serious disasters for mining in China. The evaluation of the occurrence and development of ahigh-concentration water and sand mixed fluid is an important issue for mining in China. In this study, contraposing to the 3phases of water–sand inrush, three kinds of experiments are designed for the investigation of initiation, development, andoccurrence of the disaster. A new sand–water transport testing system is setup to perform the tests. The results show that thereare two key points in the disaster: (1) sand particle incipient motion and (2) porous skeleton structural instability. The incipientmotion of sand grains is accompanied with the phenomena of volumetric dilatation and granular fluidization. The criticalvelocity of the incipient motion of the water–sand mixed fluid is significantly affected by the particle size and external stress.The interaction between water and sand grains is the key factor affecting the motion characteristics of water–sand mixture.When the hydraulic conditions exceed the threshold, the water and sand grains are mutually promoted, and the aquifer skeletonbecomes unstable. Furthermore, during the water–sand inrush, the curves of volumetric flow rates of sand and water,respectively, for different samples manifest as two distinct waveforms.
1. Introduction
Water–sand inrush is a most serious mine disaster in westernChina, particularly in the Shaanxi province, the major energyresource centre of China [1, 2]. The typical geological charac-teristics of the coal mines in this area provide the conditionsfor the occurrence of water–sand inrush. According to thestatistics data on the scenario of the water–sand inrushoccurring in western China, accidents during coal miningextremely affect over 47.5% of the estimated reserves, equiv-alent to an excess of 100 billion tons [3]. These disasters causeserious damage, enormous financial loss, and numerouscasualties. For example, when a water–sand inrush occurredat the Longde coal mine in 2012 [4], the total subsidence vol-ume reached 16 350m3 and the direct economic lossesexceeded 100 million yuan. Another example is that of theserious water and sand inrush accident occurrence in theHalagou coal mine in 2010 [5]. In this case, the entire long-wall mining face and a large part of the roadways were bur-
ied, and two large cone-shaped subsidence areas wereformed with a height of 12m and diameter of 47m and aheight of 9m and diameter of 23m, respectively. Anothertypical example is that of a highly serious water–sand inrushaccident occurrence at the Ciyaowan coal mine of the Shenfuore district in 1990 [6]. In this accident, the instantaneousinflow water volume reached up to 200m3/h, and the 306-meter long underground mining face was buried such thatthe average buried thickness of the sediment exceeded 2m.
In addition to the threat to the safety of mining opera-tions, water–sand intrusion also causes serious environmen-tal issues [7, 8]. Therefore, over the past few years, simulationand laboratory investigations of the effects of a water–sandinrush on the hydrogeological characteristics, mechanismproperties, and mining environment have been performedextensively [1, 9–12]. The results of these investigations showthat during the process of a water and sand inrush, the sand–water mixed fluid can migrate through the cracks and brokenrock mass and swarm into the working areas. Following this,
HindawiGeofluidsVolume 2020, Article ID 8679861, 18 pageshttps://doi.org/10.1155/2020/8679861

the groundwater is discharged without the solids, and solidgrains remain in the goaf and bury the equipment. The char-acteristics of the aquifer combined with the mining-inducedstrata failure [9, 13] and inherent geological structures of acoalfield [2, 14] such as shallow mining depths, thick coalseams, and overlying loose quaternary Aeolian sand nearthe ground surface are the main factors that cause accidents[12, 15]. As shown in Figure 1, a crushed rock mass (porousskeleton) in a caved zone is connecting an aquifer and a goafand creating an effective water–sand inrush channel. Theincipient motion of saturated sand grains and migration fea-tures of the sand–water mixture could be the determiningfactors of water–sand intrusion accidents.
Until now, the studies on the water–sand inrush mecha-nism have been mainly focused on either the influence of theoverburden failure or the qualitative analysis of the seepageevolution [12, 16–21]. The permeability characteristics of agranular rock mass during the water inrush process havebeen widely studied [22–29]; however, such a high concen-tration of particle migration during a sand and water inrushinvolving a mixed fluid cannot be regarded as a single-phasefluid [30, 31], being significantly different from a waterinrush. Therefore, in addition to the factors of the hydraulicfeatures of the geological structure, the groundwater seepagecharacteristic is also a key issue to consider in the incipientmotion and migration of a water and sand mixed fluid.
At present, the existing test equipment and method can-not separate water and sand mixtures completely, and it isdifficult to measure the real-time water/sand single-phasevelocity accurately. There is lack of quantitative and scientificresearch on the initiation and development process of awater–sand inrush. In this study, a custom-built high-speedwater–sand transfer experimental system with a water–sandseparation velocimeter (WPV) was adopted to investigatethe flow characteristics of a water–sand mixed fluid. Threesets of laboratory tests were designed and performed, aimedat revealing the occurrence, development process, and evo-lution feature of a water–sand inrush. The effective factorsof the incipient motion of the sand grains in a porousskeleton, characteristics of the fine particle loss in theporous skeleton, and characteristics of the migration ofthe high-concentration water–sand mixed fluid migrationwere analysed based on the test data obtained in the labo-ratory. From the perspective of hydraulics, two necessaryconditions were proposed for the occurrence of a water–sand inrush disaster. The dominant relationship betweenwater and sand and rheological feature of a water andsand mixture fluid were revealed.
2. Experimental Equipment
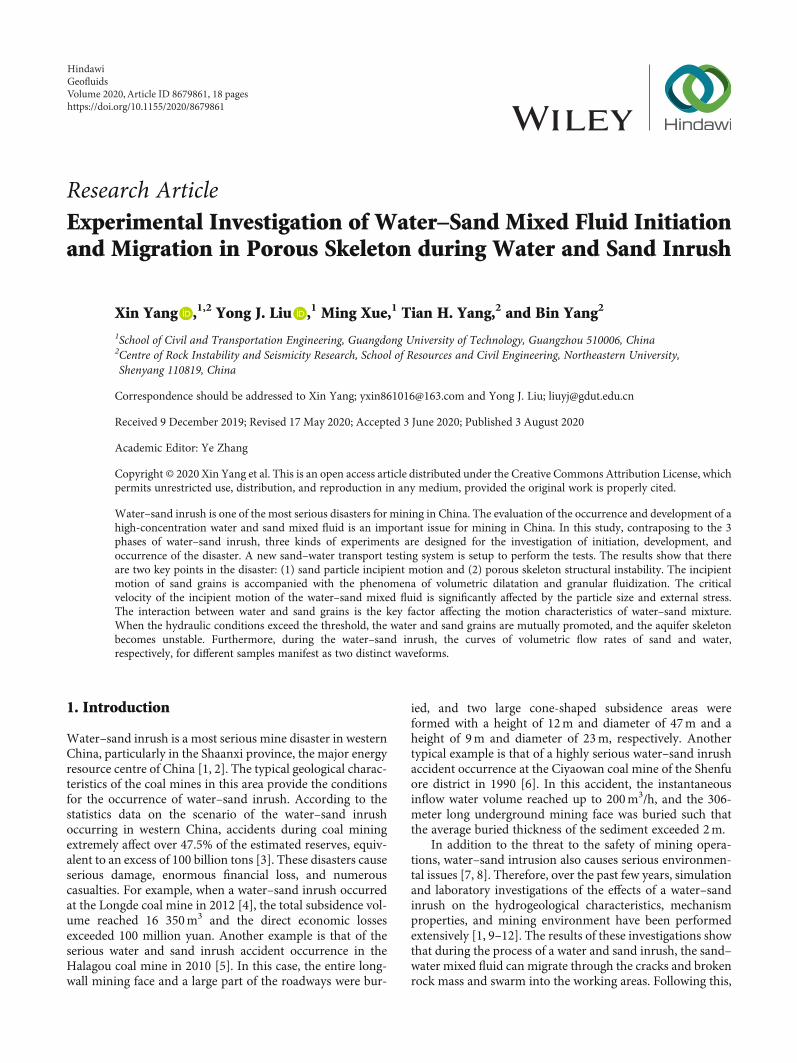
2.1. Experimental Setup. Figure 2 illustrates the connectionand principle of the testing system. The apparatus consistsof four main parts as follows:
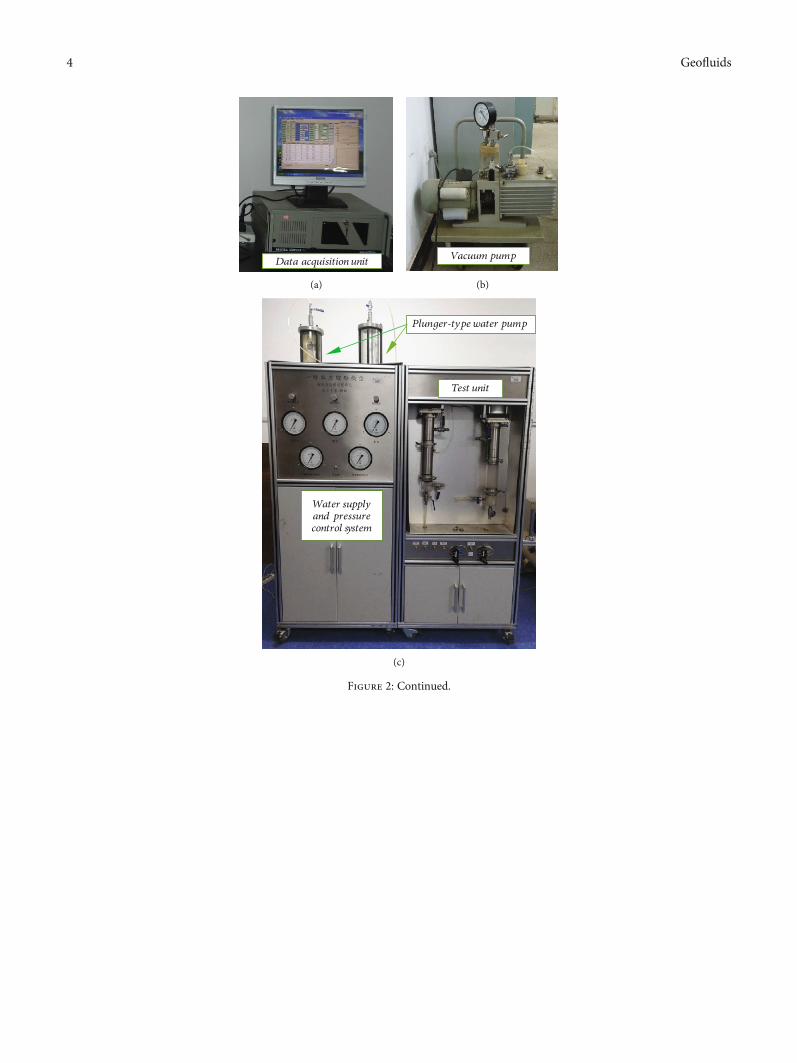
Test Cell. The test cell of the apparatus mainly consists ofa cylindrical tube composed of an organic glass with an innerdiameter of 60mm, wall thickness of 7mm, and strength of2MPa, as shown in Figure 3(a), and cone-shaped joints, asshown in Figure 3(b), which permit the visualization of the
testing process. The tube is sealed with the cone-shapedreducing pipes at both ends, which serve as diffusers to createuniform flow conditions. Two porous plates (thickness of4mm and bore diameter of 2 or 4mm, Figure 3(c)) arefastened to the bellbottom of the reducing pipes. To avoidthe effects of air on the experiments, the following measuresare adopted. Before starting the experiments, a vacuumpump (Figure 2(b)) is first used to remove the air from theinside of the sample.
Water Supply Cell. The water supply system is composedof a plunger-type constant-pressure water pump powered byan air compressor and a plunger-type constant-flow waterpump powered by a servo motor. The constant-pressurewater pump had a volume of 12 L and could provide a max-imum water pressure of 2MPa. Concurrently, the upstreampressure of the samples could be precisely controlled with aprecision of 0.005MPa by adjusting the air pressure regula-tor. In addition, the constant-flow water pump provided astable water flow of 0–3L/min.
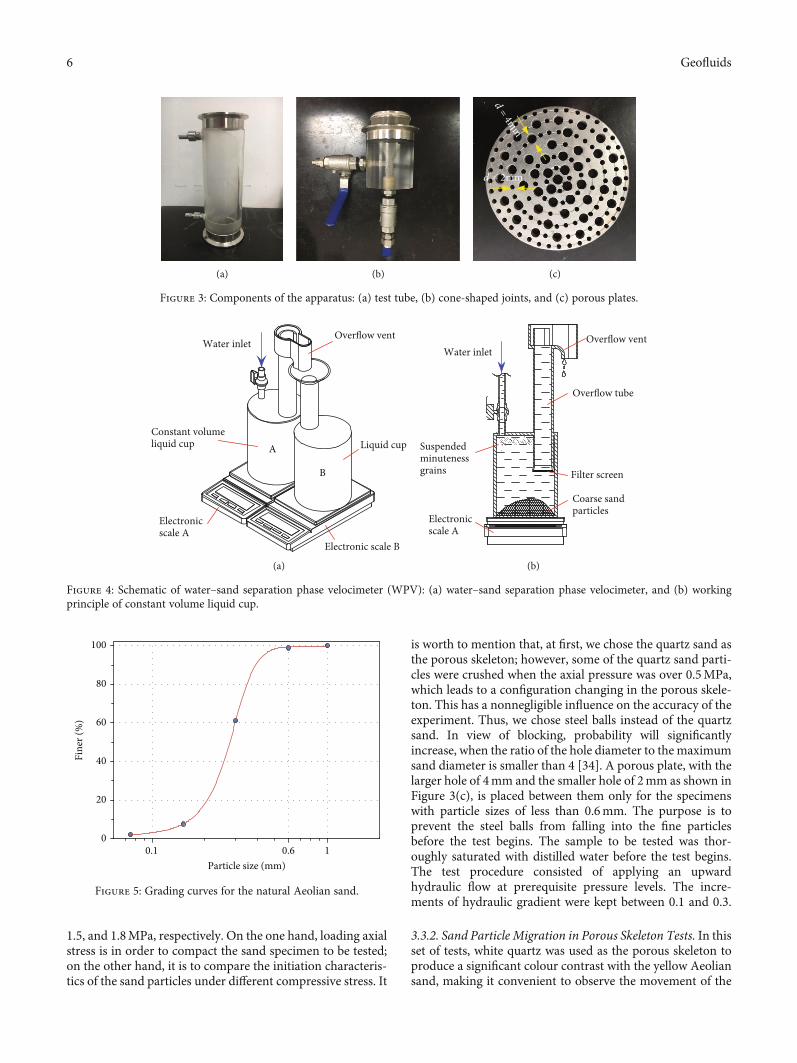
Data Measuring Cell. A custom-built WPV is developedfor the flow velocity measurement, as shown in Figure 4,which can realize real-time and accurate measurement ofthe single-phase flow velocity of the water and sand mixedfluid. The water pressure at the upstream and downstreamends of the sample was measured by a pressure sensor(Q/JL015-2009, Longchi Xinda Electronics, Beijing, China)in the range of 0–2:38MPa ± 0:1% of the full scale (FS).The speed measuring device included two electronic balances(TCL 12000, Gottingen, Germany) set in the range of0–12,000 g ± 0:1% FS and a large beaker.
Data Recording Cell. During the test, a data acquisitionsystem in the computer, as shown in Figure 2(a), is used forrecording and storing the experimental data every 3 s.
2.2. Velocity Measurement Principle. The key component ofthe experimental system is the WPV (see Figure 4). It iscomprised of two electronic scales and two vessels. VesselA named, as the constant-volume liquid cup, has an overflowvent on the top and a honeycomb duct at the water inlet. Ves-sel B, named as the liquid cup, has a funnel-shaped waterinlet and no outlet. The test procedure and working principleof the velocimeter are as follows:
(i) Firstly, distilled water is poured into the constant-volume liquid cup until it overflows from the vent.The outer wall of vessel A is dried and then placedon balance A
(ii) Secondly, the dry empty vessel B is placed on balanceB. It is ensured that the water inlet of vessel B isplaced directly below the overflow nozzle of vessel A
(iii) Thirdly, when the water and sand flow initiatesthrough the sample, initially the mixed fluid entersvessel A, then the sand particles are filtered out,and pure water falls into vessel B
As shown in Figure 4(b), in vessel A, the coarse sandgranules sink down to the bottom, and the fine particles floatabove it. A filter screen is fastened to the bottom of the
2 Geofluids

overflow pipe to prevent the sand particles from beingflushed out of vessel A. The mixed fluid displaces an equalvolume of pure water in vessel B through the overflow nozzle.Electronic scale A reads the difference in the masses of thesand and the water it replaces, and electronic scale B readsthe mass of the water with the same volume as the mixedfluid, i.e.,
MA,j =ms,j −mdw,j j = 1, 2,⋯, nð Þ,MB,j =mw,j +mdw,j j = 1, 2,⋯, nð Þ,
ð1Þ
where MA,j is the record of electronic scale A, MB,j is therecord of electronic scale B, ms,j represents the mass of thesand flowing out of the sample (SFO), mdw,j represents themass of the water displaced by the sand, and mw,j is the massof the water flowing through the sample (WFT). The volumeof the sand (Vs,j) is equal to the volume of the displaced water(Vdw,j); therefore, the total volumes of the sand and watercan, respectively, be calculated by
Vs,j =MA,j
ρs − ρw j = 1, 2,⋯, nð Þ,
Vw,j =MB,jρw
−MA,j
ρs − ρwj = 1, 2,⋯, nð Þ:
ð2Þ
ms,j and mw,j can, respectively, be obtained as
ms,j =Vs,j∙ρs =MA,j
ρs − ρw∙ρs j = 1, 2,⋯, nð Þ, ð3Þ
mw,j =Vw,j∙ρw =MB,jρw
−MA,j
ρs − ρw
� �∙ρw j = 1, 2,⋯, nð Þ,
ð4Þ
where Vs,j is the volume of SFO and Vw,j is the volume ofWFT; therefore, the volumetric flow rate can be determinedas follows:
vs,j =Vs,jt j
=MA,j
ρs − ρwð Þ∙t j j = 1, 2,⋯, nð Þ, ð5Þ
vw,j =Vw,jt j
=MB,jρw∙t j
−MA,j
ρs − ρwð Þ∙t j j = 1, 2,⋯, nð Þ, ð6Þ
where vs,j is the average volumetric flow rate of SFO and vw,jis the average volumetric flow rate of WFT, cm3/s. ρs is thedensity of the sand particles and ρw is the density of distilledwater (ρw = 1 g/cm3). During the test, the data are recordingand storing every 3 seconds, and the masses measured atthe time intervals read MA1,MA2,⋯,MAn and MB1,MB2,⋯,MBn. As the duration of the test is 155 seconds for the lon-gest, the maximum n value is 85.
3. Materials and Methods
3.1. Experimental Materials. In the experimental research,natural Aeolian sand was adopted as the main researchobject. The Aeolian sand was collected from the Xiaojihancoal mine in the Yulin mining area, Shaanxi province ofChina. By the sieve analysis, the size distribution of Aeoliansand particles is presented in Figure 5. In the original Aeoliansand samples, the particles with a diameter of less than0.6mm accounted for 98.8% of the total, and the residualwere impurities.
The river sand, quartz sand, and steel balls are used asauxiliary experimental material in the tests. Using a vibratorysieve shaker, the Aeolian sand river sand particles are sepa-rated into six groups according to their sizes ranging from0.075mm to 2.36mm, as shown in Figures 6(a)–6(f). Thequartz sand has a particle size of 4.75–9.5mm, as shown inFigure 6(g), and the steel spheres are 14mm in diameter, asshown in Figure 6(h).
Coal
Aquifer
Water and sand mixture
Water and sandinrush
Broken rockmass
GoafGoaf Coal
Figure 1: Schematic of a water and Aeolian sand inrush.
3Geofluids
Data acquisition unit
(a)
Vacuum pump
(b)
Water supplyand pressurecontrol system
Plunger-type water pump
Test unit
(c)
Figure 2: Continued.
4 Geofluids

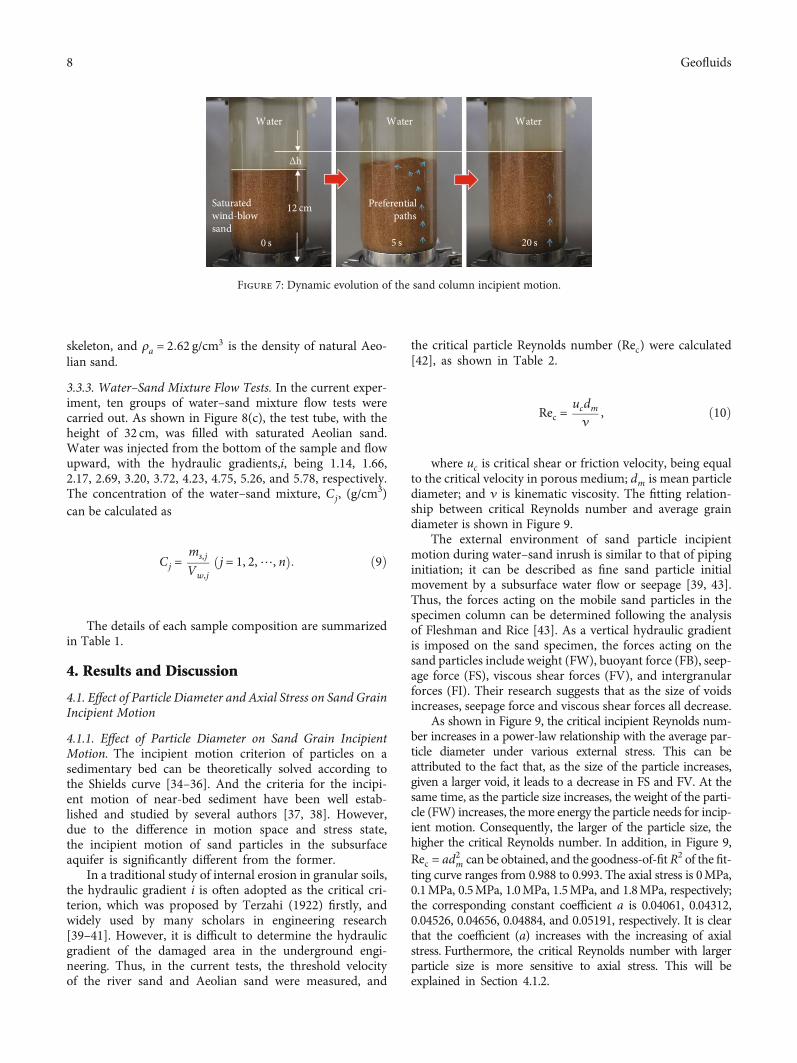
3.2. Preliminary Tests. A set of preliminary tests were carriedout, in order to observe sand particle motion characters anddetermine the follow-up test program. Natural Aeolian sand,with a particle size of less than 0.6mm, was adopted in thistest. Saturated original Aeolian sand is filled in the test tubelayer by layer with the height of 3.5 cm and 12 cm, respec-tively. The initial hydraulic gradient value was 0.1, and thehydraulic gradient was increased slowly by 0.1 each time.
Figure 7 illustrates the evolution of movement for naturalAeolian sand column under water, with a hydraulic gradientvalue of 1.0 and height of 12 cm. It can be observed that,when the hydraulic gradient threshold of particle incipientmotion is achieved, a volume dilation of the sand columnis forming, and the sand grains undergo fluidization. In 5seconds, a dominant channel for the granular sand migra-tion is formed along the smooth tube inner wall. The finersand particles flow upward along the channel, with thelarger particles settling. In 20 seconds, the volume of thesand column reaches maximum. Apparently, this is similarto the behaviour of the dilatation effect of a solid mass;the movement of a sand swarm is accompanied by volumedilation [32], which may be attributed to the nonnegligiblefrictional drag between sand particles. In addition, it canbe found from the tests that, with the same grain composi-tion, the higher the hydraulic gradient value, the greater theexpanded volume of the sand column. The time requiredfor the volume of the sand column to reach maximumdepends on the initial height of the sand column, the size ofthe grains, and the gradation of sand sample. This issue willbe analysed in depth in subsequent research.
3.3. Experimental Procedure. The occurrence of a water–sandinrush disaster is a complex physical process, which can beidentified in three stages [33]: (i) the “sand particle incipi-ent motion” stage, at this stage, the sand particles in thesubsurface system are activated by groundwater seepageand leads to instability seepage; (ii) the “sand particlesmigration” stage, during this stage, movable sand particlestransport in the aquifer, leaving behind a coarse porousskeleton, moreover, with the increase of the amount ofmobile sand, the skeleton porosity increases; (iii) the“high-concentration water–sand flow” stage, at this stage,the hydraulic gradient threshold of sand failure is reachedand water–sand inrush is formed. According to the threedifferent stages of water–sand inrush, three kinds of exper-iments were designed, including (1) sand particle incipientmotion tests, (2) sand particle migration in porous skeleton,and (3) water–sand mixture flow tests. Figure 8 presents thesketch of samples of the three experiments to be tested.
3.3.1. Sand Particle Incipient Motion Tests. In this set of tests,a 3-component grade Aeolian sand was adopted; at the sametime, three groups of river sands were also selected in order toanalyse the effect of particle size on the critical parameters.The sketch of the sample to be tested is shown inFigure 8(a), the sand specimen is filled in the bottom partof the test tube layer by layer, with a height of 12 cm. Steelballs are filled in the upside, with the height of 8 cm. Consid-ering the stress environment of the subsurface aquifer duringthe water–sand inrush, an axial stress was loaded on the sam-ple. The design values of the axial stress were 0, 0.1, 0.5, 1.0,
S1S3
S7
V V4
S4
S5 11
9
V2
V3 1
23
5
S6
S8
S2
V1
V54
6
7
8
10
12
V
V13
(d)
Figure 2: Experimental apparatus: (a) data acquisition system, (b) vacuum pump, (c) conveyance and flux control system and test cell, and(d) schematic (S1: computer; S2: servomotor; S3, S4: pressure sensor; S5: air compressor; S6: water pump; S7: measurement cell; S8: vacuumpump; V1/V2/V3: pressure-regulating valve; V4: emptying valve; V5: pump out valve; V: globe value. (1) Air inlet hole for axial pressure load;(2) air cylinder for axle load; (3) plunger of axle load; (4)/(13) water inlet (outlet); (5), (11) clamp; (6), (12) cone shape press ram; (7), (10)porous plate; (8) sample; (9.) air inlet hole for confining pressure load).
5Geofluids
1.5, and 1.8MPa, respectively. On the one hand, loading axialstress is in order to compact the sand specimen to be tested;on the other hand, it is to compare the initiation characteris-tics of the sand particles under different compressive stress. It
is worth to mention that, at first, we chose the quartz sand asthe porous skeleton; however, some of the quartz sand parti-cles were crushed when the axial pressure was over 0.5MPa,which leads to a configuration changing in the porous skele-ton. This has a nonnegligible influence on the accuracy of theexperiment. Thus, we chose steel balls instead of the quartzsand. In view of blocking, probability will significantlyincrease, when the ratio of the hole diameter to the maximumsand diameter is smaller than 4 [34]. A porous plate, with thelarger hole of 4mm and the smaller hole of 2mm as shown inFigure 3(c), is placed between them only for the specimenswith particle sizes of less than 0.6mm. The purpose is toprevent the steel balls from falling into the fine particlesbefore the test begins. The sample to be tested was thor-oughly saturated with distilled water before the test begins.The test procedure consisted of applying an upwardhydraulic flow at prerequisite pressure levels. The incre-ments of hydraulic gradient were kept between 0.1 and 0.3.
3.3.2. Sand Particle Migration in Porous Skeleton Tests. In thisset of tests, white quartz was used as the porous skeleton toproduce a significant colour contrast with the yellow Aeoliansand, making it convenient to observe the movement of the
10
20
100
80
60
40Fine
r (%
)
Particle size (mm)0.1 0.6
Figure 5: Grading curves for the natural Aeolian sand.
Constant volumeliquid cup Liquid cup
Electronicscale A
Overflow vent
Electronic scale B
A
B
Water inlet
(a)
Electronicscale A
Overflow vent
Overflow tube
Suspendedminutenessgrains
Water inlet
Filter screen
Coarse sandparticles
(b)
Figure 4: Schematic of water–sand separation phase velocimeter (WPV): (a) water–sand separation phase velocimeter, and (b) workingprinciple of constant volume liquid cup.
(a) (b)
d = 2mm
d = 4mm(c)
Figure 3: Components of the apparatus: (a) test tube, (b) cone-shaped joints, and (c) porous plates.
6 Geofluids

Aeolian sand during the experiment. Before the tests, theAeolian sand and quartz were thoroughly saturated.Figure 8(b) shows the sample sketch. Firstly, fill the quartzsand layer by layer into the test tube to ensure the quartz skel-eton uniform. Then, fasten two porous plates to the ends ofthe quartz skeleton. ϕq = 49:31% is the porosity of the quartzskeleton. At last, fill the Aeolian sand grains into the intersti-tial voids of the quartz skeleton until it is completely filled.ϕo = 30:94% is the initial porosity of the Aeolian-quartzsample. Water was pumped from the bottom of the test tube,which flowed upwards through the sample, before flowinginto the WPV device. The upstream water pressures were0.11MPa, 0.20MPa, 0.275MPa, 0.375MPa, and 0.45MPa,respectively; the corresponding water pressure differenceswere 0.095, 0.17, 0.23, 0.25, and 0.377MPa, respectively.
The continuous flow may cause the sand particle tomove out of the aquifer skeleton, which result in an
increase in the porosity. Using Equation (3), the mass ofSFO (ms,j ) can be calculated, based on the cumulative massof sand loss. At every 3 seconds, the porosity ϕj and the
porosity increase rate ϕj′ can, respectively, be calculated by
ϕ j =Ah − mq/ρq +mf ill/ρa −ms,j/ρa
� �A∙h
j = 1, 2,⋯, nð Þ,ð7Þ
ϕj′= ϕj − ϕj−1
� �/3 j = 1, 2,⋯, nð Þ, ð8Þ
where A is the cross-section of the test tube, h is the height ofthe sample, mq = 808 kg and ρq = 2:82 g/cm3 are the massand density of the quartz gravel, respectively, mfill = 272 kgis the mass of the Aeolian sand in the pores of the quartz
(a) (b) (c)
(d) (e) (f)
(g) (h)
Figure 6: Experimental materials: Aeolian sand: (a) 0.075–0.15mm, (b) 0.15–0.3mm, and (c) 0.3–0.6mm; river sand: (d) 0.6–1.0mm, (e)1.0–2.0mm, and (f) 2.0–2.36mm; quartz sand: (g) 4.75–9.5mm; and steel balls: (h) 14mm.
7Geofluids
skeleton, and ρa = 2:62 g/cm3 is the density of natural Aeo-lian sand.
3.3.3. Water–Sand Mixture Flow Tests. In the current exper-iment, ten groups of water–sand mixture flow tests werecarried out. As shown in Figure 8(c), the test tube, with theheight of 32 cm, was filled with saturated Aeolian sand.Water was injected from the bottom of the sample and flowupward, with the hydraulic gradients,i, being 1.14, 1.66,2.17, 2.69, 3.20, 3.72, 4.23, 4.75, 5.26, and 5.78, respectively.The concentration of the water–sand mixture, Cj, (g/cm
3)can be calculated as
Cj =ms,jVw,j
j = 1, 2,⋯, nð Þ: ð9Þ
The details of each sample composition are summarizedin Table 1.
4. Results and Discussion
4.1. Effect of Particle Diameter and Axial Stress on Sand GrainIncipient Motion
4.1.1. Effect of Particle Diameter on Sand Grain IncipientMotion. The incipient motion criterion of particles on asedimentary bed can be theoretically solved according tothe Shields curve [34–36]. And the criteria for the incipi-ent motion of near-bed sediment have been well estab-lished and studied by several authors [37, 38]. However,due to the difference in motion space and stress state,the incipient motion of sand particles in the subsurfaceaquifer is significantly different from the former.
In a traditional study of internal erosion in granular soils,the hydraulic gradient i is often adopted as the critical cri-terion, which was proposed by Terzahi (1922) firstly, andwidely used by many scholars in engineering research[39–41]. However, it is difficult to determine the hydraulicgradient of the damaged area in the underground engi-neering. Thus, in the current tests, the threshold velocityof the river sand and Aeolian sand were measured, and
the critical particle Reynolds number (Rec) were calculated[42], as shown in Table 2.
Rec =ucdmν
, ð10Þ
where uc is critical shear or friction velocity, being equalto the critical velocity in porous medium; dm is mean particlediameter; and ν is kinematic viscosity. The fitting relation-ship between critical Reynolds number and average graindiameter is shown in Figure 9.
The external environment of sand particle incipientmotion during water–sand inrush is similar to that of pipinginitiation; it can be described as fine sand particle initialmovement by a subsurface water flow or seepage [39, 43].Thus, the forces acting on the mobile sand particles in thespecimen column can be determined following the analysisof Fleshman and Rice [43]. As a vertical hydraulic gradientis imposed on the sand specimen, the forces acting on thesand particles include weight (FW), buoyant force (FB), seep-age force (FS), viscous shear forces (FV), and intergranularforces (FI). Their research suggests that as the size of voidsincreases, seepage force and viscous shear forces all decrease.
As shown in Figure 9, the critical incipient Reynolds num-ber increases in a power-law relationship with the average par-ticle diameter under various external stress. This can beattributed to the fact that, as the size of the particle increases,given a larger void, it leads to a decrease in FS and FV. At thesame time, as the particle size increases, the weight of the parti-cle (FW) increases, the more energy the particle needs for incip-ient motion. Consequently, the larger of the particle size, thehigher the critical Reynolds number. In addition, in Figure 9,Rec = ad2m can be obtained, and the goodness-of-fit R2 of the fit-ting curve ranges from 0.988 to 0.993. The axial stress is 0MPa,0.1MPa, 0.5MPa, 1.0MPa, 1.5MPa, and 1.8MPa, respectively;the corresponding constant coefficient a is 0.04061, 0.04312,0.04526, 0.04656, 0.04884, and 0.05191, respectively. It is clearthat the coefficient (a) increases with the increasing of axialstress. Furthermore, the critical Reynolds number with largerparticle size is more sensitive to axial stress. This will beexplained in Section 4.1.2.
Δh
0 s 5 s 20 s
Preferentialpaths
Saturatedwind-blowsand
Water Water Water
12 cm
Figure 7: Dynamic evolution of the sand column incipient motion.
8 Geofluids

4.1.2. Effect of Axial Stress on Sand Grain Incipient Motion.The intergranular forces are caused by two distinct physicalorigins: (1) intergrain contacts between kinetic sand particlesand (2) intergrain contacts between kinetic sand particle andskeleton granular. According to Table 2, it also can be foundthat the critical Reynolds number increases with the increas-ing axial stress. This is because the axial stress makes the sandswarmmore compact and to a certain extent reduces the voidvolume among particles. As a result, the two kinds of inter-granular forces mentioned above are increased. Therefore, a
larger external stress denotes higher critical Reynolds num-ber for sand grain incipient motion. Furthermore, Figure 10depicts the effect of axial stress on critical Reynolds number.Through the image, as mentioned above, the river sand sam-ples are more sensitive to the external stress than the Aeoliansand samples. This result is caused by the river sand particlebeing rougher than the Aeolian sand particle in the currenttests. The particle with rougher surfaces generated greaterintergranular force, leading to the increase of critical Reyn-olds number for particle incipient motion.
Porous plates
Porous plates, forthe specimens withparticle sizes ofless than 0.6 mm
Sand specimenh = 12 cm
Steel balls porousskeletonh = 8 cm
(a)
Porous platesSand specimenwithin quartz
skeletonh = 20 cm
(b)
Porous platesSand specimen
h = 32 cm
(c)
Figure 8: Sketch of the sample to be tested for (a) sand particle incipient motion tests, (b) sand particles migration in porous skeleton tests,and (c) water–sand mixture flow tests.
9Geofluids

4.2. Characteristics of Water–Sand Mixture Migration inQuartz Gravel Skeleton
4.2.1. Water and Sand Flow Rate Evolution. The continuousflow may cause the accumulation in the quantitative mecha-nism of mobile sand, to such an extent that the sand skeletonof the aquifer becomes unstable. In the second experiment,the evolution of volumetric flow rates of the Aeolian sand(vs) and water (vw) are calculated using Equations (5) and(6), as shown in Table 3.
Figure 11 presents the evolution of (a) sand and (b) waterflow rates with time for B1–B5 samples. As shown inFigure 11(a), in the beginning of the test, the sand flow rateincreases rapidly, reaches the maximum value in 6 seconds,and then gradually decreases. It can be observed that thetransportation of sand particles in the porosity skeleton is anonlinear process. Owing to the sand grain continuous flowout of the test tube, the porosity of the sample keeps increas-ing. In the first 6 seconds, the sand flow rate rises sharply.However, under the same water pressure difference, the
higher the porosity, the lower the interstitial water flow rate,leading to a decrease of the particle flushing ability. There-fore, as the test progresses, the sand flow rate of all the sam-ples increases first and then decreases.
In Figure 11(b), the water flow rate shows obvious fluc-tuations. The greater the water pressure difference, themore significant the increase or decrease in flow rate. Onthe one hand, the continuous water flow causes the mov-able sand particles in the upper part of the sample to flowout of the test tube, while the sand particles in the lowerpart of the sample fill in the upper part, resulting in thelocal porosity continuous change. On the other hand, themigration of sand grains causes changes in the structureof the porous skeleton, which in turn causes changes inpermeability. Thus, there is a character of significant fluctu-ations in the water flow rate.
The above analysis indicates that the interaction betweenwater and movable sand is the key factor affecting the motioncharacteristics of the water–sand mixture. When the aquiferskeleton is stable, the water and movable sand grains are
Table 1: Details of the testing samples.
Sampleno.
Particle size(mm)
Porosity Axial stress, P (MPa)
Incipient motion tests
A1 0.075-0.15 36.09%
0, 0.1, 0.5, 1.0, 1.5, and 1.8 for eachsample
A2 0.15-0.3 33.57%
A3 0.3-0.6 33.98%
A4 0.6-1.0 45.32%
A5 1.0-2.0 42.36%
A6 2.0-2.36 43.36%
Sand grain migration inquartz skeleton tests
Sampleno.
Particle size(mm)
PorosityWater pressure difference, ΔP
(MPa)
B1
0-0.6Porosity of the quartz skeleton is 49.31 %,
porosity of the sample is 30.94 %
0.095
B2 0.17
B3 0.23
B4 0.25
B5 0.377
Water–sand mixturemigration tests
Sampleno.
Particle size(mm)
Porosity Hydraulic gradient, i
C1–C10
0-0.6 33.47%1.14, 1.66, 2.17, 2.69, 3.20, 3.37,
4.23, 4.75, 5.26, 5.78
Table 2: Critical Reynolds number of Aeolian sand and river sand particles under various axial stress.
Sample no. Particle size (mm)Critical Reynolds number, Rec
0MPa 0.1MPa 0.5MPa 1.0MPa 1.5MPa 1.8MPa
A1 0.075-0.15 0.1888 0.1987 0.2082 0.2135 0.2236 0.2390
A2 0.15-0.3 0.1028 0.1124 0.1182 0.1199 0.1261 0.1299
A3 0.3-0.6 0.0212 0.0227 0.0256 0.0373 0.0404 0.0475
A4 0.6-1.0 0.0015 0.0015 0.00157 0.00165 0.0017 0.00177
A5 1.0-2.0 1.5817e-4 2.3715e-4 3.1613e-4 5.5328e-4 6.3248e-4 7.1145e-4
A6 2.0-2.36 2.1960e-5 2.2044e-5 2.2629e-5 2.3965e-5 2.4700e-5 2.8975e-5
10 Geofluids

mutually restricted, and the flow tends to be stable. On thecontrary, when the water and movable sand grains are mutu-ally promoted, the water–sand mixture flow rate continues toincrease, and the aquifer skeleton becomes unstable. There-fore, aquifer structure instability is one of the key criterionsfor the water–sand inrush disaster occurrence.
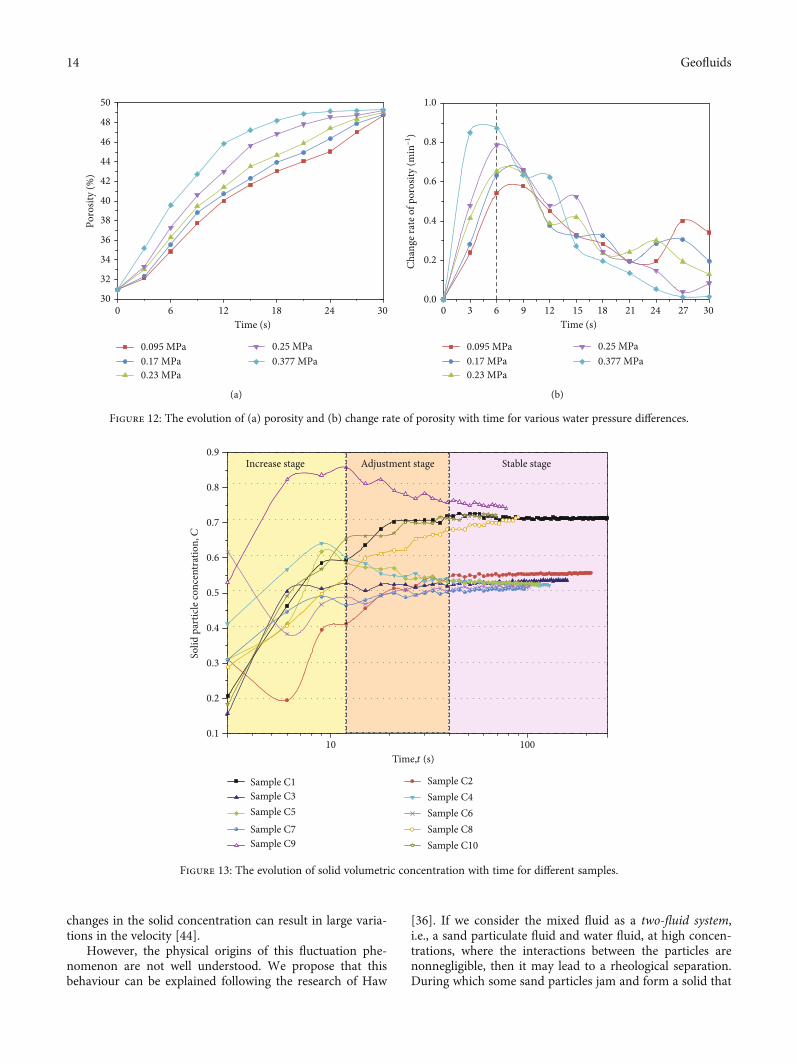
4.2.2. Porosity Evolution. Using Equations (7) and (8), theporosity ϕ and the porosity increase rate ϕ′ can be calculated,respectively. The results are shown in Table 4.
Figure 12 presents the evolution of (a) porosity and (b)change rate of porosity with time, respectively. It can befound that the porosity remains increased with time. Com-pared with Figure 11(a), the change rate of porosity increasessharply in the first 6 seconds due to the sand flow rateincreasing rapidly. Meanwhile, the rate of change in porosity
reaches the maximum value at the sixth second, just corre-sponding to the peak value of the sand flow rate. Then, theincrease slows down and shows notable fluctuations anddecreases, as shown in Figure 12(b). Furthermore, it can beseen that the higher the water pressure difference, the moresignificant the change of porosity.
The above phenomenon indicates that, as the movablesand particle transport through the porous skeleton, the porestructure rearranges. At the beginning of the test, water is thedominant phase. As the water flow rate increase, a large num-ber of particles flow with the water flow, and the sandbecomes the dominant phase. Meanwhile, a large amountof movable sand particles occupy the flow pathways, leadingto the reduction of the water flow rate. However, as the flowrate of water decreases, the particle-carrying ability decreasesaccordingly [31]. Therefore, some of the movable sand
Rec
0.00
0.05
0.10
0.15
0.20
0.25
0.0 0.5 1.0 1.5 2.0 2.5
Rec
0.00
0.05
0.10
0.15
0.20
0.25
Rec
0.00
0.05
0.10
0.15
0.20
0.25
Rec
0.00
0.05
0.10
0.15
0.20
0.25
Rec
0.00
0.05
0.10
0.15
0.20
0.25
Rec
0.00
0.05
0.10
0.15
0.20
0.25
dm (mm)0.0 0.5 1.0 1.5 2.0 2.5
dm (mm)
0.0 0.5 1.0 1.5 2.0 2.5dm (mm)
0.0 0.5 1.0 1.5 2.0 2.5dm (mm)
0.0 0.5 1.0 1.5 2.0 2.5dm (mm)
0.0 0.5 1.0 1.5 2.0 2.5dm (mm)
Rec = 0.04061d2mR2 = 0.993
Rec = 0.04312d2mR2 = 0.990
Rec = 0.04526d2mR2 = 0.990
Rec = 0.04656d2mR2 = 0.989
Rec = 0.04884d2mR2 = 0.988
Rec = 0.05191d2mR2 = 0.989
0 MPa0.1 MPa0.5 MPa
1.0 MPa1.5 MPa1.8 MPa
Figure 9: Relationship between the critical Reynolds number and particle size at different axial pressure.
11Geofluids

particles are deposited in the porous skeleton, and the sandflow rate decreases. Subsequently, the water flow once againoccupies the flow pathways and becomes the dominantphase, and the water flow rate increases again.
To sum up, when the hydraulic condition reaches thethreshold of water–sand inrush, the sand flow rate increasessignificantly and the change rate of porosity remains at a highlevel. Otherwise, the sand flow rate decreases with time. It isnoteworthy that the water–sand inrush prevention methodsshould be performed to control the water pressure differenceand sand flow rate.
4.3. Character of High-Concentration Water–Sand MixedFluid Migration
4.3.1. The Evolution of Solid Concentration. In the currentexperiment, the evolution of the solid concentration of thewater–sand mixture is calculated based on Equation (9).The results for the solid concentration evolution are shownin Figure 13. It should be noted that in the relatively shortperiod of time after the start of the tests (0-40 s), the solidparticle concentration changes drastically, while in a longerperiod of time (40-225 s), the solid concentration graduallyremains constant. Therefore, in order to describe the charac-ters in the change of solid concentration more clearly, a log-arithmic time axis is used for graphing.
Based on the results illustrated in Figure 13, the overallprocess of solid particle concentration evolution during thetests can be divided into three different stages, including (1)growth stage, during which the solid concentration ofwater–sand mixture increases rapidly in a short time; (2)adjustment stage, during which the solid concentrationshows notable fluctuation; and (3) steady stage, in this stage,the solid concentration generally remains constant. It is clearthat the solid concentration settles after about 40 secondsfrom the beginning of the tests.
During the steady stage, the average solid concentrationfor samples C2–C7 is 0.554, 0.533, 0.526, 0.528, 0.517, and0.510, respectively; the corresponding hydraulic gradient is1.66, 2.17, 2.69, 3.20, 3.72, and 4.32, respectively. And theaverage solid concentration for samples C1 and C8–C10 is0.714, 0.703, 0.749, and 0.721, respectively; the correspond-ing hydraulic gradient is 1.44, 4.75, 5.26, and 5.78, respec-tively. It can be concluded that the mixed fluid isdominated by sand grains traveling when the hydraulic gra-dient is 1.44, 4.75, 5.26, and 5.78, and the fluid phase (water)and solid phase (sand grains) dominate equally when thehydraulic gradient is between 2.17 and 4.32. This behaviourmay be of concern to the complex interaction between solidparticles, but explaining it from a mesomechanic perspectivewould require more sophisticated testing equipment anddesigning other experiments. Therefore, in this research, weanalyse the motion characteristics of the mixture from amacroperspective view, and the behaviour is explained inthe sequel.
4.3.2. Volumetric Flow Rates of Sand and Water. For every 3seconds (Δt), based on ms,j and mw,j, the interval volumetricflow rate of water (~vw,j) and sand (~vs,j) can, respectively, becalculated as
vs,j =ms,j −ms,j−1
ρs∙ΔtΔt = 3, j = 1, 2,⋯, nð Þ,
~vw,j =mw,j −mw,j−1
ρw∙ΔtΔt = 3, j = 1, 2,⋯, nð Þ,
ð11Þ
Figure 14 shows the variations of the water and sand flowrates with time for different samples, respectively. In general,the higher the water pressure, the higher the sand flow rate.Comparing the images of Figure 14, with the increase ofhydraulic gradient, a clear increase in the sand flow rate hasbeen witnessed. It can be observed that, for samples C1, C8,C9, and C10 (record as group-1), the volumetric flow rateof sand is significantly higher than that of water, leading toa greater solid concentration (greater than 0.7). While, forsamples C2, C3, C4, C5, C6 (record as group-2), and C7,the volumetric flow rate of sand is a little higher than thatof water, resulting in a relatively lower solid concentration(between 0.51 and 0.554).
Moreover, it is an interesting observation that for all thesamples C1 to C10, the curves of the volumetric flow rate ofwater and sand shows regular fluctuations. It can be seenfrom Figure 14 that there are two types of distinct waveformsin the curves. For the samples of group-1, the curve of thewater flow rate displays an “upward convex” shape, and thecurve of sand flow rate displays a “downward concave”shape. By contrast, for the samples of group-2, the flow ratecurve shows a “downward concave” shape for water and an“upward convex” shape for sand. Apparently, group-1 sam-ples with waveform-i (see Figure 14) have a significantlyhigher concentration than that of group-2 with waveform-ii(see Figure 14). This may owe to the rheology of the mixedfluid, e.g., R. Medina et al. indicated that extremely small
Chan
ge ra
te o
f Re c
0.02
0.01
0.00
Axial stress, P (MPa)0.0 0.5 1.0 1.5
2.0-2.36 mmRiver sand: Aeolian sand:
0.3-0.6 mm1.0-2.0 mm 0.15-0.3 mm0.6-1.0 mm 0.075-0.15 mm
Figure 10: Effect of axial stress on critical Reynolds number.
12 Geofluids
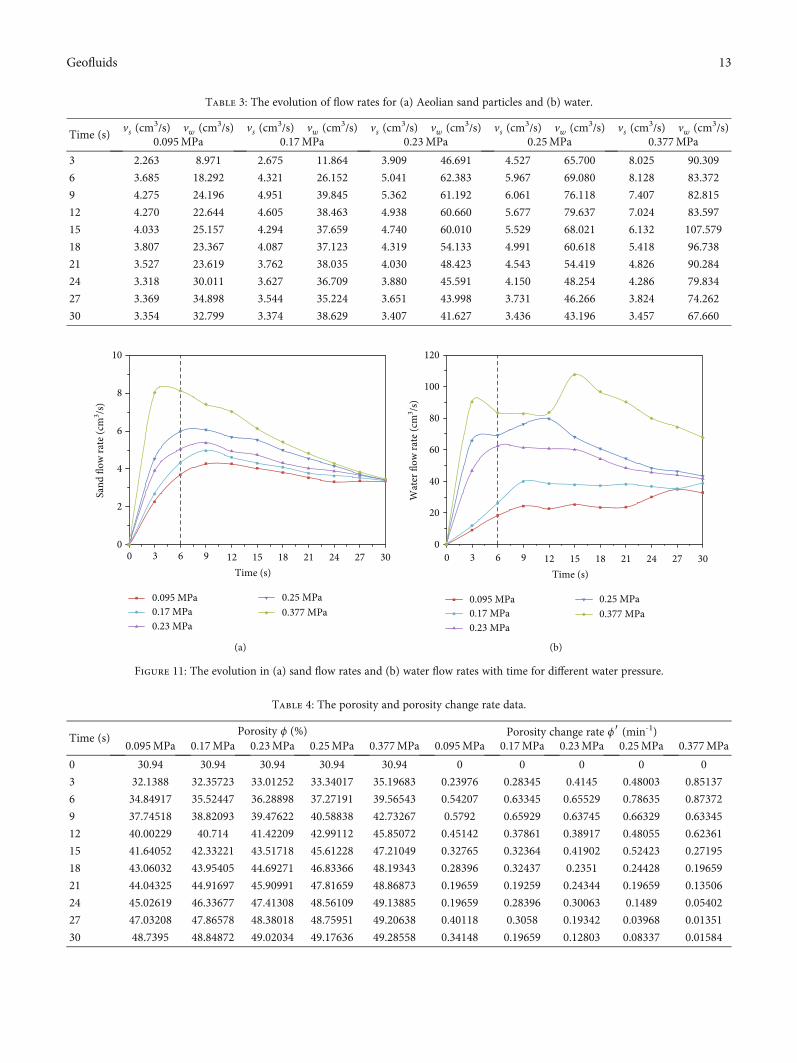
Table 3: The evolution of flow rates for (a) Aeolian sand particles and (b) water.
Time (s)vs (cm
3/s) vw (cm3/s) vs (cm3/s) vw (cm3/s) vs (cm
3/s) vw (cm3/s) vs (cm3/s) vw (cm3/s) vs (cm
3/s) vw (cm3/s)0.095MPa 0.17MPa 0.23MPa 0.25MPa 0.377MPa
3 2.263 8.971 2.675 11.864 3.909 46.691 4.527 65.700 8.025 90.309
6 3.685 18.292 4.321 26.152 5.041 62.383 5.967 69.080 8.128 83.372
9 4.275 24.196 4.951 39.845 5.362 61.192 6.061 76.118 7.407 82.815
12 4.270 22.644 4.605 38.463 4.938 60.660 5.677 79.637 7.024 83.597
15 4.033 25.157 4.294 37.659 4.740 60.010 5.529 68.021 6.132 107.579
18 3.807 23.367 4.087 37.123 4.319 54.133 4.991 60.618 5.418 96.738
21 3.527 23.619 3.762 38.035 4.030 48.423 4.543 54.419 4.826 90.284
24 3.318 30.011 3.627 36.709 3.880 45.591 4.150 48.254 4.286 79.834
27 3.369 34.898 3.544 35.224 3.651 43.998 3.731 46.266 3.824 74.262
30 3.354 32.799 3.374 38.629 3.407 41.627 3.436 43.196 3.457 67.660
0 3 6 90
2
4
6
8
10
0.095 MPa0.17 MPa0.23 MPa
0.25 MPa0.377 MPa
Sand
flow
rate
(cm
3 /s)
Time (s)30272421181512
(a)
0
20
40
60
80
100
120
0 3 6 9
0.095 MPa0.17 MPa0.23 MPa
0.25 MPa0.377 MPa
Time (s)30272421181512
Wat
er fl
ow ra
te (c
m3 /s
)
(b)
Figure 11: The evolution in (a) sand flow rates and (b) water flow rates with time for different water pressure.
Table 4: The porosity and porosity change rate data.
Time (s)Porosity ϕ (%) Porosity change rate ϕ′ (min-1)
0.095MPa 0.17MPa 0.23MPa 0.25MPa 0.377MPa 0.095MPa 0.17MPa 0.23MPa 0.25MPa 0.377MPa
0 30.94 30.94 30.94 30.94 30.94 0 0 0 0 0
3 32.1388 32.35723 33.01252 33.34017 35.19683 0.23976 0.28345 0.4145 0.48003 0.85137
6 34.84917 35.52447 36.28898 37.27191 39.56543 0.54207 0.63345 0.65529 0.78635 0.87372
9 37.74518 38.82093 39.47622 40.58838 42.73267 0.5792 0.65929 0.63745 0.66329 0.63345
12 40.00229 40.714 41.42209 42.99112 45.85072 0.45142 0.37861 0.38917 0.48055 0.62361
15 41.64052 42.33221 43.51718 45.61228 47.21049 0.32765 0.32364 0.41902 0.52423 0.27195
18 43.06032 43.95405 44.69271 46.83366 48.19343 0.28396 0.32437 0.2351 0.24428 0.19659
21 44.04325 44.91697 45.90991 47.81659 48.86873 0.19659 0.19259 0.24344 0.19659 0.13506
24 45.02619 46.33677 47.41308 48.56109 49.13885 0.19659 0.28396 0.30063 0.1489 0.05402
27 47.03208 47.86578 48.38018 48.75951 49.20638 0.40118 0.3058 0.19342 0.03968 0.01351
30 48.7395 48.84872 49.02034 49.17636 49.28558 0.34148 0.19659 0.12803 0.08337 0.01584
13Geofluids
changes in the solid concentration can result in large varia-tions in the velocity [44].
However, the physical origins of this fluctuation phe-nomenon are not well understood. We propose that thisbehaviour can be explained following the research of Haw
[36]. If we consider the mixed fluid as a two-fluid system,i.e., a sand particulate fluid and water fluid, at high concen-trations, where the interactions between the particles arenonnegligible, then it may lead to a rheological separation.During which some sand particles jam and form a solid that
0 6 12 18 24 30
0.095 MPa0.17 MPa0.23 MPa
0.25 MPa0.377 MPa
Time (s)
Poro
sity
(%)
30
32
34
36
38
40
42
44
46
48
50
(a)
0 63 9 12 15 21 2718 24 30
0.095 MPa0.17 MPa0.23 MPa
0.25 MPa0.377 MPa
Time (s)
Chan
ge ra
te o
f por
osity
(min
–1)
0.0
0.2
0.4
0.6
0.8
1.0
(b)
Figure 12: The evolution of (a) porosity and (b) change rate of porosity with time for various water pressure differences.
10 100Time,t (s)
Stable stageAdjustment stageIncrease stage0.9
0.8
0.7
0.6
0.5
0.4
0.3
0.2
0.1
Solid
par
ticle
conc
entr
atio
n, C
Sample C1Sample C3Sample C5Sample C7Sample C9
Sample C2Sample C4Sample C6Sample C8Sample C10
Figure 13: The evolution of solid volumetric concentration with time for different samples.
14 Geofluids

0 30 60 90 120 150 180 210 2400
1
2
3
4
5
6
7
8
140 1500
1
2
Insta
ntan
eous
flow
rate
, v (c
m3 /s
)
Times, t (s)
Waveform-i
Sample C1i = 1.14
SandWater
v(c
m3 /s
)
130t (s)
(a)
0
1
2
3
4
5
6
7
8
Insta
ntan
eous
flow
rate
, v (c
m3 /s
)
0 30 60 90 120 150 180 210Times, t (s)
SandWater
v(c
m3 /s
)
t (s)Waveform-ii
Sample C2i = 1.66
120 1301.0
1.5
2.0
(b)
0
1
2
3
4
5
6
7
8
Insta
ntan
eous
flow
rate
, v (c
m3 /s
)
0 30 60 90 120 150Times, t (s)
SandWater
v(c
m3 /s
)
Waveform-ii
Sample C3i = 2.17
8075706560t(s)
2.5
2.0
1.5
(c)
0
1
2
3
4
5
6
7
8
Insta
ntan
eous
flow
rate
, v (c
m3 /s
)
0 30 60 90 120Times, t (s)
SandWater
v(c
m3 /s
)
Waveform-ii
Sample C4i = 2.69
t (s)
2.0
2.5
3.0
40 45 50 55
(d)
0
1
2
3
4
5
6
7
8
Insta
ntan
eous
flow
rate
, v (c
m3 /s
)
0 30 60 90 120Times, t (s)
SandWater
Waveform-ii
Sample C5i = 3.20
(e)
0
1
2
3
4
5
6
7
8
Insta
ntan
eous
flow
rate
, v (c
m3 /s
)
0 30 60 90Times, t (s)
SandWater
Waveform-ii
Sample C6i =3.72
(f)
Figure 14: Continued.
15Geofluids
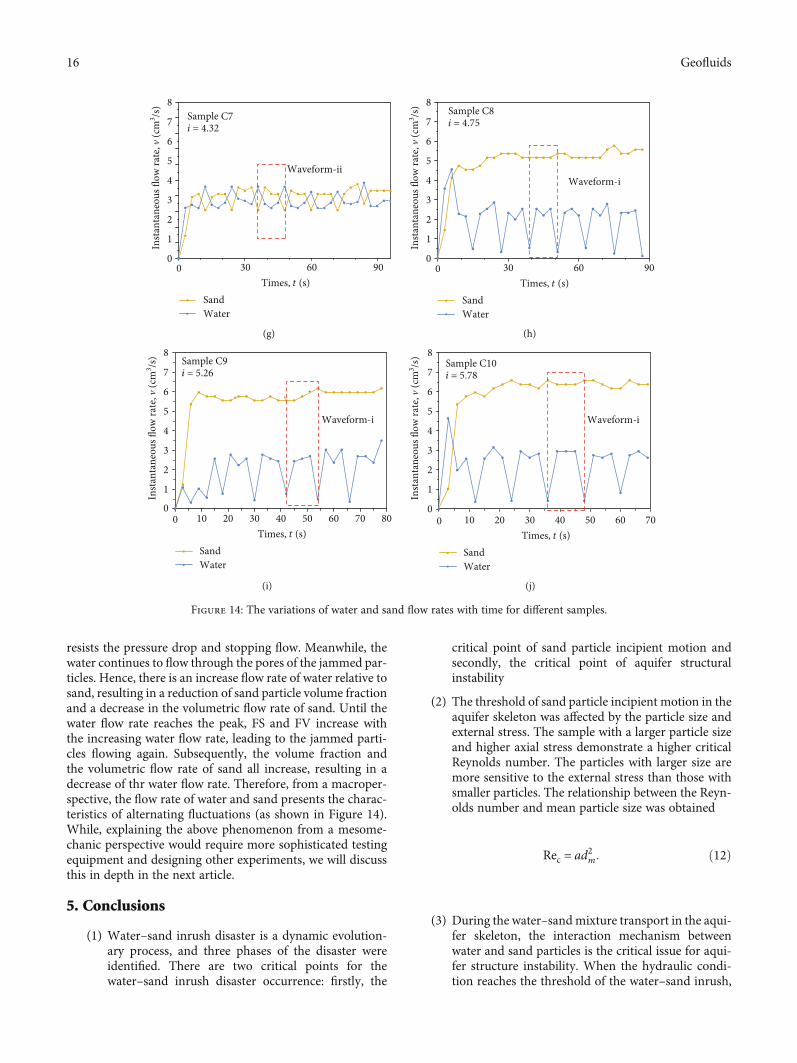
resists the pressure drop and stopping flow. Meanwhile, thewater continues to flow through the pores of the jammed par-ticles. Hence, there is an increase flow rate of water relative tosand, resulting in a reduction of sand particle volume fractionand a decrease in the volumetric flow rate of sand. Until thewater flow rate reaches the peak, FS and FV increase withthe increasing water flow rate, leading to the jammed parti-cles flowing again. Subsequently, the volume fraction andthe volumetric flow rate of sand all increase, resulting in adecrease of thr water flow rate. Therefore, from a macroper-spective, the flow rate of water and sand presents the charac-teristics of alternating fluctuations (as shown in Figure 14).While, explaining the above phenomenon from a mesome-chanic perspective would require more sophisticated testingequipment and designing other experiments, we will discussthis in depth in the next article.
5. Conclusions
(1) Water–sand inrush disaster is a dynamic evolution-ary process, and three phases of the disaster wereidentified. There are two critical points for thewater–sand inrush disaster occurrence: firstly, the
critical point of sand particle incipient motion andsecondly, the critical point of aquifer structuralinstability
(2) The threshold of sand particle incipient motion in theaquifer skeleton was affected by the particle size andexternal stress. The sample with a larger particle sizeand higher axial stress demonstrate a higher criticalReynolds number. The particles with larger size aremore sensitive to the external stress than those withsmaller particles. The relationship between the Reyn-olds number and mean particle size was obtained
Rec = ad2m: ð12Þ
(3) During the water–sandmixture transport in the aqui-fer skeleton, the interaction mechanism betweenwater and sand particles is the critical issue for aqui-fer structure instability. When the hydraulic condi-tion reaches the threshold of the water–sand inrush,
0
1
2
3
4
5
6
7
8
Insta
ntan
eous
flow
rate
, v (c
m3 /s
)
0 30 60 90Times, t (s)
SandWater
Waveform-ii
Sample C7i = 4.32
(g)
0
1
2
3
4
5
6
7
8
Insta
ntan
eous
flow
rate
, v (c
m3 /s
)
0 30 60 90Times, t (s)
SandWater
Waveform-i
Sample C8i = 4.75
(h)
1
0
2
3
4
5
6
7
8
Insta
ntan
eous
flow
rate
, v (c
m3 /s
)
0 10 20 30 40 50 60 8070Times, t (s)
SandWater
Waveform-i
Sample C9i = 5.26
(i)
0
1
2
3
4
5
6
7
8
Insta
ntan
eous
flow
rate
, v (c
m3 /s
)
0 10 20 30 40 50 60 70Times, t (s)
SandWater
Waveform-i
Sample C10i = 5.78
(j)
Figure 14: The variations of water and sand flow rates with time for different samples.
16 Geofluids
the water and sand grains are mutually promoted,and the aquifer skeleton becomes unstable. On thecontrary, when the water and sand grains are mutu-ally restricted, the aquifer skeleton tends to be stable
(4) When the water–sand inrush disaster occurs, solidconcentration remains at a relatively high level, forinstance above 0.5 or above 0.7. The motion featureof the mixed fluid was greatly dominated by the rhe-ological property of the sand fluid. Two types ofwaveforms in the curve of volumetric flow rates forsand and water, respectively, were experimentallyobserved
Data Availability
The experiment data used to support the findings of thisstudy are included within the supplementary informationfile.
Conflicts of Interest
There is no conflict of interest regarding the publication ofthis paper.
Acknowledgments
The authors would like to acknowledge Prof. Zeng H. Xu forhis guidance and advice, which have greatly improved thispaper. This work was supported by the National BasicResearch Program of China (2013CB227900) and the Natu-ral Science Foundation of Guangdong province, China(2016A030313692).
Supplementary Materials
Table 1: water and sand flow rates for the tests of sand parti-cles migration in sand–quartz-filled bed. Table 2: mass ofSFO and porosity for the tests of sand particles migrationin sand–quartz-filled bed. Table 3: change rate of porosityfor the tests of sand particles migration in sand–quartz-filled bed. Table 4: sand flow rate for the tests of water–sandmixed fluid migration. Table 5: water flow rate for the tests ofwater–sand mixed fluid migration. Table 6: solid particleconcentration for the tests of water–sand mixed fluid migra-tion. (Supplementary Materials)
References
[1] Q. Sun, J. Zhang, Q. Zhang, and X. Zhao, “Analysis and Pre-vention of Geo-Environmental Hazards with High-IntensiveCoal Mining: A Case Study in China’s Western Eco-Environment Frangible Area,” Energies, vol. 10, no. 6, article786, 2017.
[2] K. Zhang, B. Y. Zhang, J. F. Liu, D. Ma, and H. Bai, “Experi-ment on seepage property and sand inrush criterion for gran-ular rock mass,” Geofluids, vol. 2017, Article ID 9352618, 10pages, 2017.
[3] L. Chen, S. Zhang, and H. Gui, “Prevention of water andquicksand inrush during extracting contiguous coal seamsunder the lowermost aquifer in the unconsolidated Cenozoic
alluvium—a case study,” Arabian Journal of Geosciences,vol. 7, no. 6, pp. 2139–2149, 2014.
[4] G. Zhang, K. Zhang, L. Wang, and Y. Wu, “Mechanism ofwater inrush and quicksand movement induced by a boreholeand measures for prevention and remediation,” Bulletin ofEngineering Geology and the Environment, vol. 74, no. 4,pp. 1395–1405, 2015.
[5] Y. X. Song, “Water inrush and sand inrush mechanism andprevention technology during the initial mining period in22402 working face of Halagou coal mine,” Safety in CoalMines, vol. 43, no. 12, pp. 91–93, 2012.
[6] L. Fan, “Controlling tecnological study on suffosion hazard ofcoal shaft in Shenfu minin area,” The Chinese Journal of Geo-logical Hazard and Control, vol. 7, no. 4, pp. 35–38, 1996.
[7] H. Si, H. Bi, X. Li, and C. Yang, “Environmental evaluation forsustainable development of coal mining in Qijiang, WesternChina,” International Journal of Coal Geology, vol. 81, no. 3,pp. 163–168, 2010.
[8] D. J. Yang, Z. F. Bian, and S. G. Lei, “Impact on soil physicalqualities by the subsidence of coal mining: a case study inWestern China,” Environmental Earth Sciences, vol. 75, no. 8,p. 652, 2016.
[9] W. Yang, X. Xia, G. Zhao, Y. Ji, and D. Shen, “Overburden fail-ure and the prevention of water and sand inrush during coalmining under thin bedrock,” Mining Science and Technology(China), vol. 21, no. 5, pp. 733–736, 2011.
[10] X. Miao, X. Cui, J. Wang, and J. Xu, “The height of fracturedwater-conducting zone in undermined rock strata,” Engineer-ing Geology, vol. 120, no. 1-4, pp. 32–39, 2011.
[11] D. Zhang, G. Fan, L. Ma, and X. Wang, “Aquifer protectionduring longwall mining of shallow coal seams: A case studyin the Shendong Coalfield of China,” International Journal ofCoal Geology, vol. 86, no. 2-3, pp. 190–196, 2011.
[12] W. Yang, L. Jin, and X. Zhang, “Simulation test onmixed waterand sand inrush disaster induced by mining under the thinbedrock,” Journal of Loss Prevention in the Process Industries,vol. 57, pp. 1–6, 2019.
[13] Z. Meng, X. Shi, and G. Li, “Deformation, failure and perme-ability of coal-bearing strata during longwall mining,” Engi-neering Geology, vol. 208, pp. 69–80, 2016.
[14] F. Du, Z. H. Li, G. H. Jiang, and Z. Q. Chen, “Types and mech-anism of water-sand inrush disaster in west coal mine,” Jour-nal of China Coal Society, vol. 42, no. 7, pp. 1846–1853, 2017.
[15] J. Wang and J. Yang, “Roof stability of the mining face underthe condition of water and sand inrush,” Journal of China CoalSociety, vol. 40, no. 2, pp. 254–260, 2015.
[16] Z. W. Qian, Z. Q. Jiang, Y. Z. Guan, and N. Yue, “Mechanismand remediation of water and sand inrush induced in aninclined shaft by large-tonnage vehicles,” Mine Water andthe Environment, vol. 37, no. 4, pp. 849–855, 2018.
[17] Y. Chen, G. Zhao, S. Wang, H.Wu, and S.Wang, “A case studyon the height of a water-flow fracture zone above underseamining: Sanshandao Gold Mine, China,” Environmental EarthSciences, vol. 78, no. 4, p. 122, 2019.
[18] G. Zhang, Z. Wang, L. Wang et al., “Mechanism of collapsesinkholes induced by solution mining of salt formations andmeasures for prediction and prevention,” Bulletin of Engineer-ing Geology and the Environment, vol. 78, no. 3, pp. 1401–1415, 2019.
[19] D. Ma, X. Cai, Z. Zhou, and X. Li, “Experimental investigationon hydraulic properties of granular sandstone and mudstone
17Geofluids
mixtures,” Geofluids, vol. 2018, Article ID 9216578, 13 pages,2018.
[20] H. Zhang, Z. Wan, D. Ma, Y. Zhang, J. Cheng, and Q. Zhang,“Experimental investigation on the strength and failure behav-ior of coal and synthetic materials under plane-strain biaxialcompression,” Energies, vol. 10, no. 4, article 500, 2017.
[21] D. Ma, J. J. Wang, X. Cai et al., “Effects of height/diameter ratioon failure and damage properties of granite under coupledbending and splitting deformation,” Engineering FractureMechanics, vol. 220, p. 106640, 2019.
[22] Z. Huang, Z. Jiang, S. Zhu, X. Wu, L. Yang, and Y. Guan,“Influence of structure and water pressure on the hydraulicconductivity of the rock mass around underground excava-tions,” Engineering Geology, vol. 202, pp. 74–84, 2016.
[23] D. Ma, H. Duan, X. Li, Z. Li, Z. Zhou, and T. Li, “Effects ofseepage-induced erosion on nonlinear hydraulic properties ofbroken red sandstones,” Tunnelling and Underground SpaceTechnology, vol. 91, p. 102993, 2019.
[24] Y. Yuan, Z. S. Chen, X. W. Zhang, and Z. H. Wang, “Interme-diate coal pillar instability and permeability evolution inextremely thin protective seam by auger mining,” ArabianJournal of Geosciences, vol. 12, no. 10, article 322, 2019.
[25] B. Yao, Z. Chen, J. Wei, T. Bai, and S. Liu, “Predicting erosion-induced water inrush of Karst collapse pillars using inversevelocity theory,” Geofluids, vol. 2018, Article ID 2090584, 18pages, 2018.
[26] J. Wu, S. C. Li, Z. H. Xu, D. D. Pan, and S. J. He, “Flow charac-teristics after water inrush from the working face in Karsttunnelling,” Geomechanics and Engineering, vol. 14, no. 5,pp. 407–419, 2018.
[27] C. Li, B. Yao, and Q. Ma, “Numerical simulation study ofvariable-mass permeation of the broken rock mass under dif-ferent cementation degrees,” Advances in Civil Engineering,vol. 2018, Article ID 3592851, 8 pages, 2018.
[28] H. Li, H. Bai, J. Wu et al., “A cascade disaster caused by geolog-ical and coupled hydro-mechanical factors-water inrushmechanism from Karst collapse column under confining pres-sure,” Energies, vol. 10, no. 12, article 1938, 2017.
[29] X. Yang, T. H. Yang, Z. Xu, and B. Yang, “Experimentalinves-tigation of division in packed with Particles,” Energies, vol. 10,no. 9, article 1401, 2017.
[30] D. Ma, X. Miao, H. Bai et al., “Impact of particle transfer onflow properties of crushed mudstones,” Environmental EarthSciences, vol. 75, no. 7, article 593, 2016.
[31] D. Ma, M. Rezania, H. S. Yu, and H. B. Bai, “Variations ofhydraulic properties of granular sandstones during waterinrush: effect of small particle migration,” Engineering Geol-ogy, vol. 217, pp. 61–70, 2017.
[32] A. A. Beheshti and B. Ataie-Ashtiani, “Analysis of thresholdand incipient conditions for sediment movement,” CoastalEngineering, vol. 55, no. 5, pp. 423–430, 2008.
[33] X. Yang, Z. H. Xu, T. H. Yang, B. Yang, and W. H. Shi, “Incip-ience condition and migration characteristics of aeolian-sandaquifer in a typical western mine,” Rock & Soil Mechanics,vol. 39, no. 1, pp. 21–28, 2018.
[34] K To, P. Y. Lai, and H. K. Pak, “Jamming of granular flow in atwo-dimensional hopper,” Physical Review Letters, vol. 86,no. 1, pp. 71–74, 2001.
[35] A. I. Campbell and M. D. Haw, “Jamming and unjamming ofconcentrated colloidal dispersions in channel flows,” Soft Mat-ter, vol. 6, no. 19, pp. 4688–4693, 2010.
[36] M. D. Haw, “Jamming, two-fluid behavior, and “self-filtration”in concentrated particulate suspensions,” Physical Review Let-ters, vol. 92, no. 18, p. 185506(1-4), 2004.
[37] D. Chen, Y. Wang, B. Melville, H. Huang, and W. Zhang,“Unifiedformula for Stress for of Sand, Mud, and Sand–Mud-Mixtures,” Journal of Hydraulic Engineering, vol. 144, no. 8,article 04018046, 2018.
[38] Z. Ahmad, U. K. Singh, and A. Kumar, “Incipient motion forgravel particles in clay-silt-gravel cohesive mixtures,” Journalof Soils and Sediments, vol. 18, no. 10, pp. 3082–3093, 2018.
[39] J. Israr and B. Indraratna, “Study of gradients for Seepage-Inducedfailures in Soils,” Journal of Geotechnical and Geoen-vironmental Engineering, vol. 145, no. 7, p. 04019025, 2019.
[40] R. Moffat and R. J. Fannin, “A hydromechanical relation gov-erning internal stability of cohesionless soil,” Canadian Geo-technical Journal, vol. 48, no. 3, pp. 413–424, 2011.
[41] B. Indraratna, J. Israr, and C. Rujikiatkamjorn, “Geometrical-method for the instability of based on Distribution,” Journalof Geotechnical and Geoenvironmental Engineering, vol. 141,no. 10, article 04015045, 2015.
[42] C.-H. Ling, “Criteria for Incipient Motion of Spherical Sedi-ment Particles,” Journal of Hydraulic Engineering, vol. 121,no. 6, pp. 472–478, 1995.
[43] M. S. Fleshman and J. D. Rice, “Laboratorymodeling of theofpiping Initiation,” Journal of Geotechnical and Geoenviron-mental Engineering, vol. 140, no. 6, p. 04014017, 2014.
[44] R. Medina, J. E. Elkhoury, J. P. Morris, R. Prioul, J. Desroches,and R. L. Detwiler, “Flow of concentrated suspensions throughfractures: small variations in solid concentration cause signifi-cant in-plane velocity variations,” Geofluids, vol. 15, no. 1-2,pp. 24–36, 2015.
18 Geofluids


![Fluid Properties Effects on Sand Production using Discrete ...€¦ · Li et al. [6] developed a sand control screen pipe in unconsolidated sandstone reservoirs by com-bining swellable](https://static.fdocuments.us/doc/165x107/60611fea0c9a7829a56f7165/fluid-properties-effects-on-sand-production-using-discrete-li-et-al-6-developed.jpg)


![Animating Sand as a Fluid - UBC Computer Sciencerbridson/docs/zhu-siggraph05-sandfluid.pdf · Animating Sand as a Fluid ... Li and Moshell[1993] presented a dynamic height-field](https://static.fdocuments.us/doc/165x107/5af5f1297f8b9ae9488e21d0/animating-sand-as-a-fluid-ubc-computer-science-rbridsondocszhu-siggraph05-sand.jpg)
