
Peningkatan Peran Wakil Presiden Melalui Keppres No. 121 ...

International Journal of Energy Science and Engineering
Vol. 3, No. 2, 2017, pp. 11-28
http://www.aiscience.org/journal/ijese
ISSN: 2381-7267 (Print); ISSN: 2381-7275 (Online)
* Corresponding author
E-mail address: [email protected] (S. M. Saleh), [email protected] (Q. S. Mahdi), [email protected] (B. S. Khalaf)
Experimental Investigation of Natural Draft Wet Cooling Tower Performance
Saad Muhsen Saleh1, Qasim Saleh Mahdi2, Basima Salman Khalaf2, *
1Department of Mechanical Engineering, Baghdad University, Baghdad, Iraq
2Department of Mechanical Engineering, Al-Mustansiriyah University, Baghdad, Iraq
Abstract
This study is deals with the performance of natural draft wet cooling tower, using a suitable technique. This technique takes
into account the effects of fill type, nozzle hole and hot water flow rate on the performance of cooling tower. The model
dimensions were: top outlet diameter (370 mm), bottom diameter (680 mm) and height (850 mm). (210) test experiments were
done in three parts, (48) for different water flow rate, (108) for different fill types and (56 tests) for different nozzle holes.
Three cases were studied for film and splash fills, where for film the heights were (60, 90 and 120mm) and for splash fill (30,
45 and 60mm) heights were studied. The performance parameter of the tower such as range, approach, effectiveness and
Merkel number were studied. Eighteenth new experimental relation was proposed for Merkel number and water to air mass
flow rate ratio. And compared with previous works.
Keywords
Cooling Tower, Natural Draft, Film Fill, Splash Fill
Received: March 8, 2017 / Accepted: April 7, 2017 / Published online: June 14, 2017
@ 2017 The Authors. Published by American Institute of Science. This Open Access article is under the CC BY license.
http://creativecommons.org/licenses/by/4.0/
1. Introduction
A cooling tower cools water by a combination of heat and
mass transfer. The hot water to be cooled is distributed in the
tower by spray nozzles, splash bars, or film- type fill, which
exposes a very large water surface area to atmospheric air. A
portion of the water absorbs heat and it is changed to a
vapour at constant pressure. This latent heat of vaporization
has long been used to transfer heat from the water to the
atmosphere. Additional heat is taken away by the air by
virtue of its temperature increase but this sensible heat
exchange is minor compared to the latent component
provided by the water’s phase change, El-Wakil, [1988].
Cooling towers of interest play an important role in the cool-
end system of power plant, and its cooling capacity can affect
the total power generation capacity directly. The cooling
efficient is highly sensitive to environmental conditions,
particularly for most cases under the cross-wind conditions
that may reduce dry-cooling towers up to (40%) of the total
power generation capacity. However, for the conventional
design of cooling towers, the impact of cross-wind, which
actually exists in most cases, has not been paid more
attention, Gao et al., [2007].
2. Natural Draft Cooling Tower
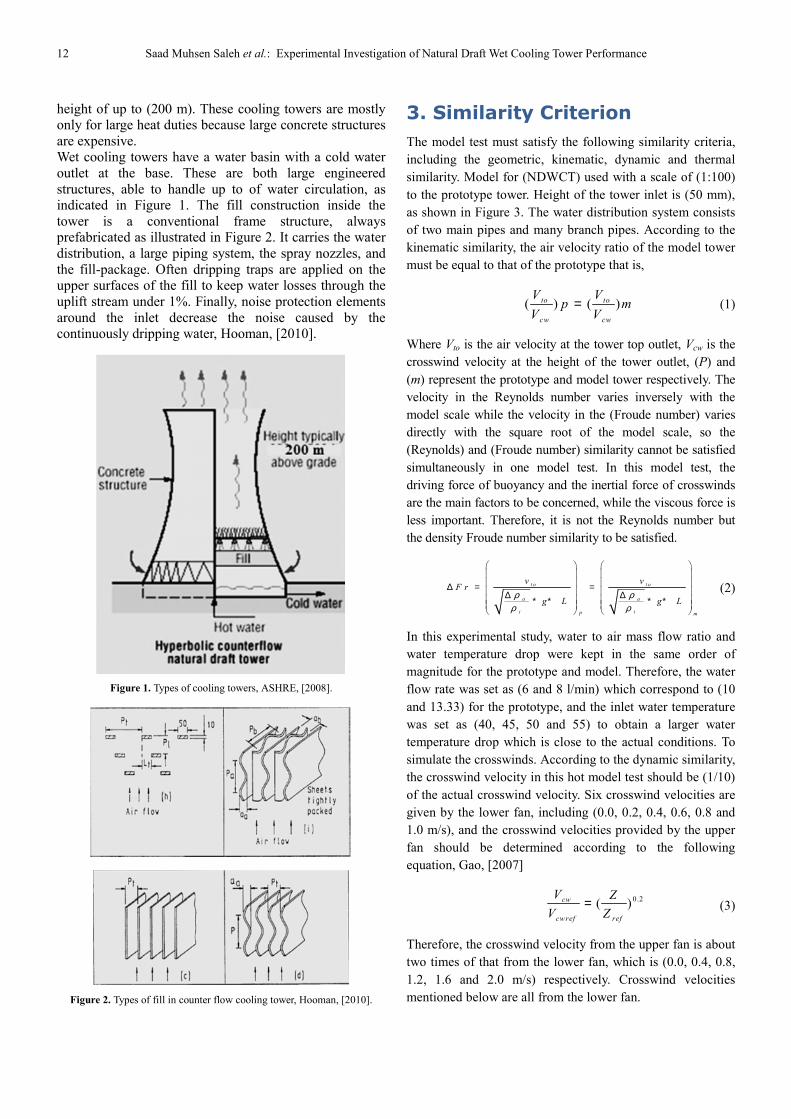
The natural draft wet cooling tower (NDWCT) or
hyperbolic cooling tower, Figure 1 makes use of the
difference in temperature between the ambient air and the
hotter air inside the tower. As hot air moves up wards
through the tower (because hot air rises), fresh cool air is
drawn into the tower through an air inlet at the bottom.
Due to the layout of the tower, no fan is required and there
is almost no circulation of hot air that could affect the
performance. Concrete is used for the tower shell with a
12 Saad Muhsen Saleh et al.: Experimental Investigation of Natural Draft Wet Cooling Tower Performance
height of up to (200 m). These cooling towers are mostly
only for large heat duties because large concrete structures
are expensive.
Wet cooling towers have a water basin with a cold water
outlet at the base. These are both large engineered
structures, able to handle up to of water circulation, as
indicated in Figure 1. The fill construction inside the
tower is a conventional frame structure, always
prefabricated as illustrated in Figure 2. It carries the water
distribution, a large piping system, the spray nozzles, and
the fill-package. Often dripping traps are applied on the
upper surfaces of the fill to keep water losses through the
uplift stream under 1%. Finally, noise protection elements
around the inlet decrease the noise caused by the
continuously dripping water, Hooman, [2010].
Figure 1. Types of cooling towers, ASHRE, [2008].
Figure 2. Types of fill in counter flow cooling tower, Hooman, [2010].
3. Similarity Criterion
The model test must satisfy the following similarity criteria,
including the geometric, kinematic, dynamic and thermal
similarity. Model for (NDWCT) used with a scale of (1:100)
to the prototype tower. Height of the tower inlet is (50 mm),
as shown in Figure 3. The water distribution system consists
of two main pipes and many branch pipes. According to the
kinematic similarity, the air velocity ratio of the model tower
must be equal to that of the prototype that is,
( ) ( )to to
cw cw
V Vp m
V V= (1)
Where Vto is the air velocity at the tower top outlet, Vcw is the
crosswind velocity at the height of the tower outlet, (P) and
(m) represent the prototype and model tower respectively. The
velocity in the Reynolds number varies inversely with the
model scale while the velocity in the (Froude number) varies
directly with the square root of the model scale, so the
(Reynolds) and (Froude number) similarity cannot be satisfied
simultaneously in one model test. In this model test, the
driving force of buoyancy and the inertial force of crosswinds
are the main factors to be concerned, while the viscous force is
less important. Therefore, it is not the Reynolds number but
the density Froude number similarity to be satisfied.
t o t o
a a
i iP m
v vF r
g L g Lρ ρ
ρ ρ
∆ = = ∆ ∆ ∗ ∗ ∗ ∗
(2)
In this experimental study, water to air mass flow ratio and
water temperature drop were kept in the same order of
magnitude for the prototype and model. Therefore, the water
flow rate was set as (6 and 8 l/min) which correspond to (10
and 13.33) for the prototype, and the inlet water temperature
was set as (40, 45, 50 and 55) to obtain a larger water
temperature drop which is close to the actual conditions. To
simulate the crosswinds. According to the dynamic similarity,
the crosswind velocity in this hot model test should be (1/10)
of the actual crosswind velocity. Six crosswind velocities are
given by the lower fan, including (0.0, 0.2, 0.4, 0.6, 0.8 and
1.0 m/s), and the crosswind velocities provided by the upper
fan should be determined according to the following
equation, Gao, [2007]
0.2( )cw
cwref ref
V Z
V Z= (3)
Therefore, the crosswind velocity from the upper fan is about
two times of that from the lower fan, which is (0.0, 0.4, 0.8,
1.2, 1.6 and 2.0 m/s) respectively. Crosswind velocities
mentioned below are all from the lower fan.

International Journal of Energy Science and Engineering Vol. 3, No. 2, 2017, pp. 11-28 13
The effectiveness of a cooling tower is defined as the ratio
between the range and the ideal range, (i.e. difference
between cooling water inlet temperature and ambient wet
bulb temperature). The higher this ratio means higher cooling
tower effectiveness.
[water inlet temp. water outlet temp.]Effectiveness(%)
[water inlet temp. air inletwetbulb temp.]
−=
− (4)
4. Experimental Apparatus Layout
The whole experimental simulates the actual working process
of cooling tower in power plant. Before operating
experiments, the pure water, that is circulating, and heated up
to required temperature by several heaters, then the
circulating pump feeds the water to the overhead water tank.
During the experiments, circulating water enters into the
model tower and goes through the fills from top to bottom,
while the dry air flows through the fills from bottom to top.
Heat and mass transfer are finished in the course of flow. A
schematic diagram of the equipment used in the experimental
study is shown in Figure 3. The cooling tower has been
designed to meet the demand for compact cooling tower
which clearly demonstrates all the processes found in model
for natural draft wet cooling tower and behaves in a
representative manner supplied with standard column. Water
distribution troughs and pressure tapping with (0.5,1.0 and
1.5 kW) heaters and float level control, make up tank, bronze
circulating pump, air fan, electrical control panel.
Figure 3. Test rig for NDWCT model.
5. Results and Discussions
5.1. Cooling Tower Range
For film fill, the effect of water flow rate on cooling tower
range at different values of inlet water temperature is
illustrated in Figure 4. For each value of water inlet
temperature, as the water flow rate is increased, the cooling
tower range is decreased. For instance, as water inlet
temperature (40, 55°C) and water flow rate is (2, 14 L/min),
the cooling tower range is (2.49, 10.47°C) and (1.5, 3.89°C)
respectively. Splash fill behave same as film fill as shown in
Figure 5, where in splash fill, the range is slightly more than
film fill. As water inlet temperature (40, 55°C) and water
flow rate is (2, 14 L/min) the cooling tower range is (4.59,
12.4°C) and (4.3, 6.7°C) respectively. This can be explained
as the water mass flow rate increases, cooling tower range
must be decrease due to the cooling load is constant. Cooling
tower range decreases the at water mass flow rate increases,
due to the increasing of heat and mass transfer coefficients.
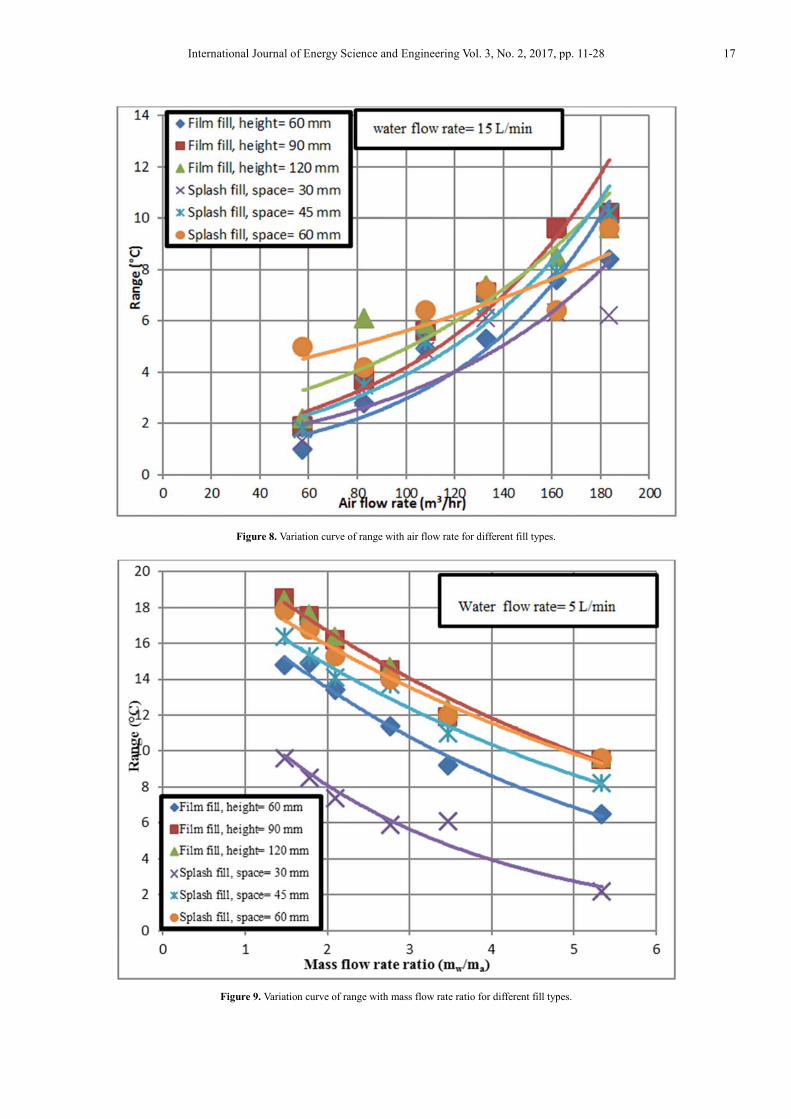
The effects of air flow rate on cooling tower range, for
different values of the water flow rate are illustrated in figs.
6, 7 and 8. For each value of water flow rate, as the air flow
rate is increased, the cooling tower range is increased. For
instance, as water flow rate of (5 L/min) and air flow rate of
(46.8m3/hr and 169.2m
3/hr), the cooling tower range is
(9.5°C and 18.4°C) respectively. For film fill at height (120
mm) is the best range for all types of fills as shown in Figure
6. This result can be explained as the air flow rate increases,
the evaporated water per unit of air increases and when fill
height increase due to an increase in air travelling and to
break up droplets of water into films, and finally falling to
the next element below. Figs. 7 and 8 show the variation of
range with air flow rate after increasing water flow rate (10
L/min) and (15 L/min) respectively. It can show that
increasing water flow rate cause a decreasing in range due to
decreasing heat transfer which arise from no time enough of
heat transfer exchange.
The variation of cooling water range with water to air mass
flow rate ratio (m•w/m•a), for different values of air flow rate
is illustrated in figs. 9, 10 and 11. As shown in Figure 9, at
lowest values of (m•w/m•a), the best cooling water range is
achieved. When the water flow rate increases (m•w/m•a
increases), cooling water range decreases. This decrease is
seen clearly at the lowest value of air flow rate, which means
at the highest (m•w/m•a) ratio as shown in Figure 9. For
instance, as water flow rate of (5 L/min) and water to air
mass flow rate ratio of (5.34) and (1.477), the cooling tower
range is (9.5°C and 18.4°C) respectively for film fill at height
(120 mm) which is the best range for all types of fills as
shown in Figure 9. Therefore, the mass flow rate of air and
water has a direct effect on cooling tower range. Figs. 10 and
11 show the variation of range with water to air mass flow
rate ratio after increasing water flow rate (10 L/min) and (15
L/min) respectively. It can see that increasing water flow rate
cause increasing in mass flow rate ratio and decreasing in
range.

14 Saad Muhsen Saleh et al.: Experimental Investigation of Natural Draft Wet Cooling Tower Performance
5.2. Cooling Tower Effectiveness
The influence of air and water mass flow rate on cooling tower
effectiveness is analysed. Since the cooling tower effectiveness
(ε) is defined as the ratio of the actual energy transfer to the
maximum possible energy transfer. Therefore, the tower
effectiveness is determined from eqn.(4). Variation of cooling
tower effectiveness with water flow rate for different values of
water inlet temperature for film fill is illustrated in the Figure
12. For each value of water inlet temperature, as the water flow
rate is increased, the cooling tower effectiveness is decreased.
For instance, as water inlet temperature (40, 55°C) and water
flow rate is (2, 14 L/min) the cooling tower effectiveness is
(12.39%, 27.99%) and (6.9%, 10.9%) respectively. Splash fill
behave same as film fill as shown in Figure 13, while for
splash fill, the effectiveness value is more than the
effectiveness value film fill. Also, for splash fill as water inlet
temperature (40°C, 55°C) and water flow rate is (2,14 l/min),
the cooling tower effectiveness are (16.9%, 33.7%) and
(12.4%, 22.06%) respectively.
Therefore, as the water to air mass flow rate ratio (m•w/m•a)
is decreased, the cooling tower effectiveness is increased. as
shown in Figure 14 for water flow rate (5L/min). For
instance, as (m•w/m•a) ratio of (5.43); the effectiveness is
calculated as (35.29%.) Where, as water mass flow rate is
constant and air mass flow rate is decreased, which means
(m•w/m•a) ratio of (1.47), the effectiveness is calculated as
(69.9%). The best effectiveness for film fill at height
(120mm) as shown in Figure 14. This means for each value
of water mass flow rate, as (m•w/m•a) ratio decreases,
effectiveness increases. Therefore, at constant mass flow rate
of water, the mass flow rate of air is very important factor
which affects the cooling tower effectiveness. The variation
of cooling tower effectiveness with water to air mass flow
rate ratio for different values of air mass flow rate is
illustrated in figs. 14, 15 and 16. As shown in these figures as
the ratio (m•w/m•a) value increases, cooling tower
effectiveness decreases. Where for water flow rate (10
L/min) effectiveness reach to (58.1%) at mass flow rate ratio
(m•w/m•a) is (2.59) for film fill at height (120mm) as shown
in Figure 15. From Figure 16 best effectiveness is (46.6%) at
mass flow rate ratio (m•w/m•a) is (4.08), water flow rate (15
L/min) for same fill type. That means when water flow rate
increase effectiveness decrease at same type of fill, at the
lowest values of (m•w/m•a) ratio the best cooling tower
effectiveness is achieved.
Figure 17 and Figure 18 show the variation of effectiveness
with circulating water flow rate for different nozzle hole for
both cases heating air input and without heating. Figures
show that effectiveness increase with increasing water flow
rate.
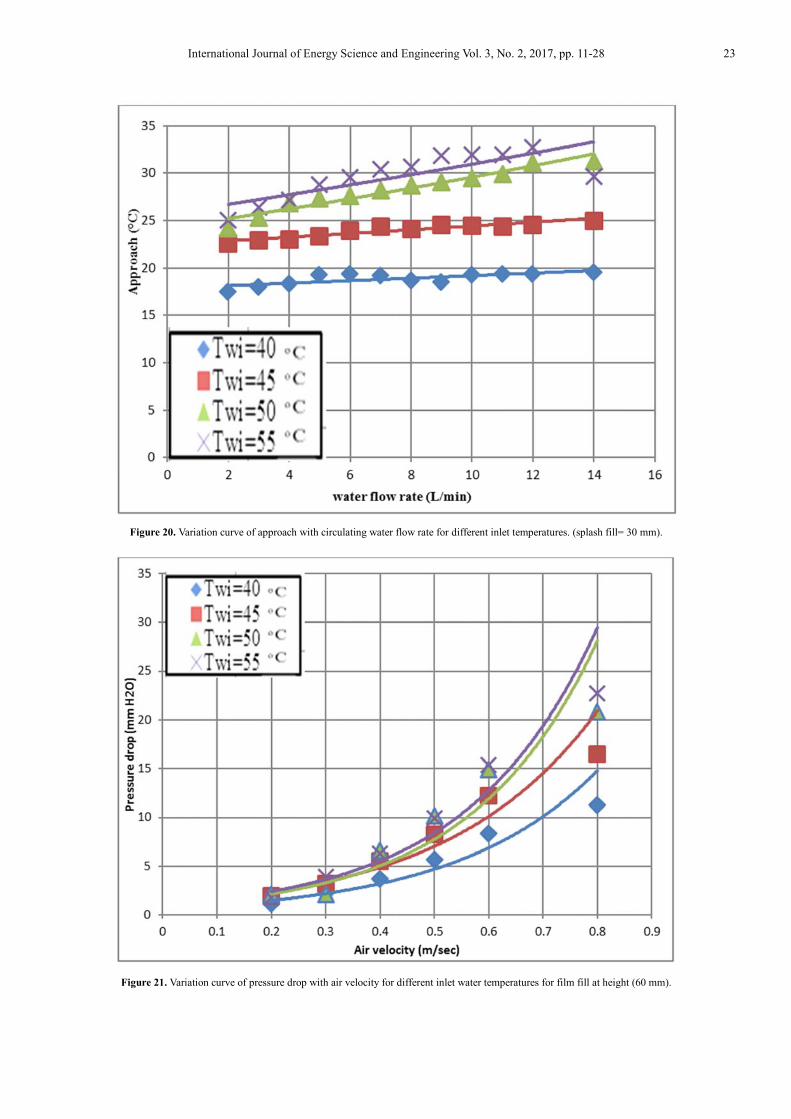
5.3. Cooling Tower Approach
The relationship between approach and water flow rates with
different water inlet temperature for film fill are illustrated in
the Figure 19. As shown in this figure, the outlet water
temperature approach to wet bulb temperature with
increasing water flow rates. The increase of the outlet water
temperatures caused by the increase of water flow rate. These
results are obtained because increasing in hot water lead
approach to increase. Splash fill as shown in Figure 20 show
the approach increase slightly less than form film fill because
heat transfer in splash boards serve two functions. The first is
to break the large water droplets into smaller ones, thus
increasing the air-water contact area. The second function is
to slow the fall of the water droplets, and increase the water
resident time in the tower.
For the best performance, water should be cooled to the
entering air wet bulb temperature. Theoretically, this is
possible when the packing heights approaching to infinity.
5.4. Pressure Drop Across Packing
The pressure drop across packing through a natural draft wet
cooling tower depends on the geometry of the packing as
well as the water and air flow rates along the tower.
Therefore, if the velocity of air flow is decreased in the
cooling tower, the air side pressure tends to drop. Where the
pressure losses of air occur in the natural draft wet cooling
tower, are; at air inlet (entrance losses), in the fill passages,
pressure losses due to water distribution system.
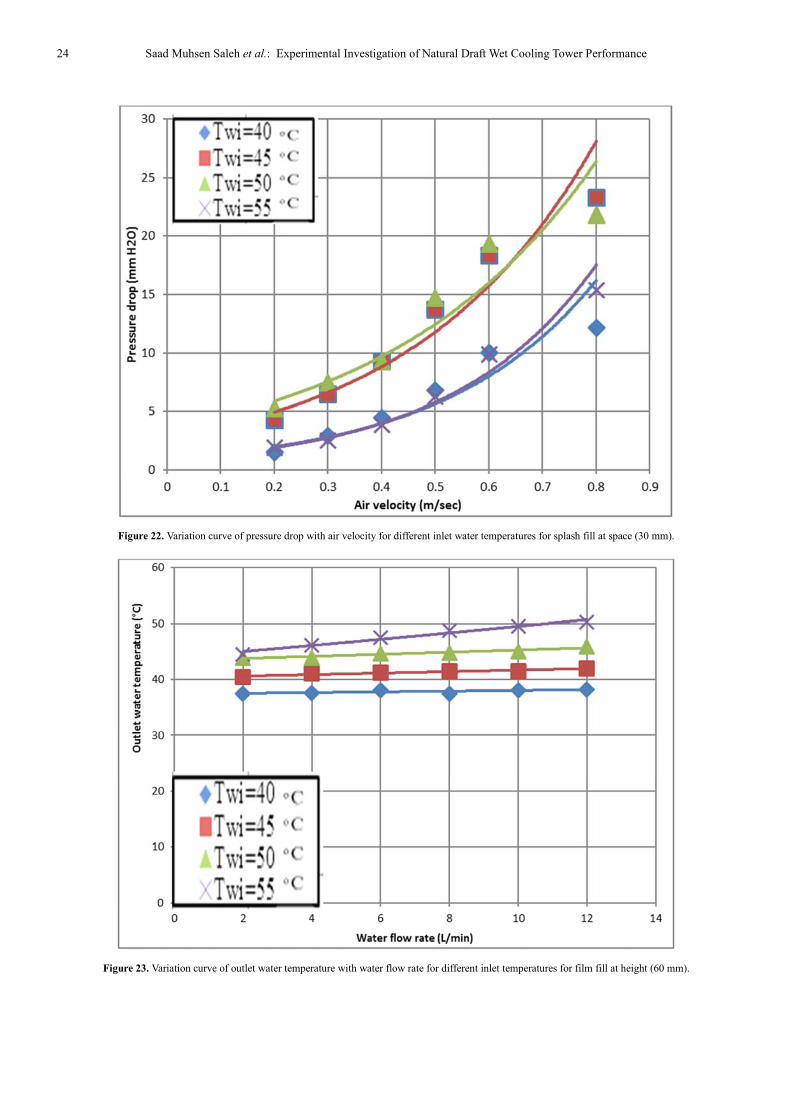
The variation of pressure drop with respect to air velocities
for different inlet water temperature for two types of fill are
shown in the Figure 21 and Figure 22 respectively. Pressure
drop across the packing increases with increasing air velocity
at constant height of film fill and constant fill space for
splash fill. The higher the pressure drop occur at higher water
temperature inlet (55°C), as illustrated in Figure 21, for film
fill. For splash fill pressure drop is decrease with decrease air
velocity, the higher pressure drop occur at (45°C) as shown
in Figure 22.
5.5. Variation of Outlet Water Temperature
Variation of outlet water temperature with water flow rate for
different values of water inlet temperature for film fill at
height (60mm) are illustrated in Figure 23. For each value of
water inlet temperature outlet water temperature increase
with increasing water flow rate because heat and mass
transfer in tower.
Splash fill at fill spacing (30mm) behave differ from film fill
for different inlet water temperature as shown in Figure 24,
where outlet water temperature increase with increasing water
flow rate. But the outlet water temperature increase with

International Journal of Energy Science and Engineering Vol. 3, No. 2, 2017, pp. 11-28 15
increasing mass flow rate ratio for different water temperature
as shown in Figure 25 for film fill at height (60 mm) and for
splash fill at space (30 mm) as shown in Figure 26.
5.6. Merkel Number
The heat transfer capability of the cooling tower is measured
by Merkel number (Me) to analyse the cooling tower
performance. Figure 27- Figure 29 show the variation of
Merkel number with mass flow rate ratio for different fill
type, at water flow rate (5L/min,10L/min and 15L/min)
respectively, where Merkel number decrease with increasing
mass flow rate ratio. As shown in these figures, film fill at
(120 mm)is the highest Merkel number for all the types of
fills. The empirical relations were summarized at table (1).
Therefore, tower characteristic increases with an increase in
air mass flow rate and a decrease in water mass flow rate.
This value starts to decrease as the water flows towards the
tower bottom until it reaches its lowest value as the water
leaves the tower. This is due to evaporation process that takes
its necessary heat of evaporation from the remaining water
that leads to cooling the remaining water and decreasing its
enthalpy.
Figure 4. Variation curve of range with circulating water flow rate for different inlet temperatures.
Figure 5. Variation curve of range with circulating water flow rate for different inlet temperatures.

16 Saad Muhsen Saleh et al.: Experimental Investigation of Natural Draft Wet Cooling Tower Performance
Figure 6. Variation curve of range with air flow rate for different fill types.
Figure 7. Variation curve of range with air flow rate for different fill types.
International Journal of Energy Science and Engineering Vol. 3, No. 2, 2017, pp. 11-28 17
Figure 8. Variation curve of range with air flow rate for different fill types.
Figure 9. Variation curve of range with mass flow rate ratio for different fill types.

18 Saad Muhsen Saleh et al.: Experimental Investigation of Natural Draft Wet Cooling Tower Performance
Figure 10. Variation curve of range with mass flow rate ratio for different fill types.
Figure 11. Variation curve of range with mass flow rate ratio for different fill types.

International Journal of Energy Science and Engineering Vol. 3, No. 2, 2017, pp. 11-28 19
Figure 12. Variation curve of effectiveness with circulating water flow rate for different inlet temperatures of film fill.
Figure 13. Variation curve of effectiveness with circulating water flow rate for different inlet temperatures for splash fill.

20 Saad Muhsen Saleh et al.: Experimental Investigation of Natural Draft Wet Cooling Tower Performance
Figure 14. Variation curve of effectiveness with mass flow rate ratio for different fill types.
Figure 15. Variation curve of effectiveness with mass flow rate ratio for different fill types.

International Journal of Energy Science and Engineering Vol. 3, No. 2, 2017, pp. 11-28 21
Figure 16. Variation curve of effectiveness with mass flow rate ratio for different fill types.
Figure 17. Variation curve of effectiveness with circulating water flow rate for different nozzle hole.

22 Saad Muhsen Saleh et al.: Experimental Investigation of Natural Draft Wet Cooling Tower Performance
Figure 18. Variation curve of effectiveness with circulating water flow rate for different nozzle hole.
Figure 19. Variation curve of approach with circulating water flow rate for different inlet temperatures.(film fill=60mm).
International Journal of Energy Science and Engineering Vol. 3, No. 2, 2017, pp. 11-28 23
Figure 20. Variation curve of approach with circulating water flow rate for different inlet temperatures. (splash fill= 30 mm).
Figure 21. Variation curve of pressure drop with air velocity for different inlet water temperatures for film fill at height (60 mm).
24 Saad Muhsen Saleh et al.: Experimental Investigation of Natural Draft Wet Cooling Tower Performance
Figure 22. Variation curve of pressure drop with air velocity for different inlet water temperatures for splash fill at space (30 mm).
Figure 23. Variation curve of outlet water temperature with water flow rate for different inlet temperatures for film fill at height (60 mm).

International Journal of Energy Science and Engineering Vol. 3, No. 2, 2017, pp. 11-28 25
Figure 24. Variation curve of outlet water temperature with water flowrate for different inlet temperatures for splash fill at space (30 mm).
Figure 25. Variation curve of outlet water temperature with mass flowrate ratio for different water temperature for film fill at height (60 mm).

26 Saad Muhsen Saleh et al.: Experimental Investigation of Natural Draft Wet Cooling Tower Performance
Figure 26. Variation curve of outlet water temperature with mass flow rate ratio for different water temperature for splash fill at space (30 mm).
Figure 27. Variation curve of Merkel number with mass flow rate ratio for different fill type.

International Journal of Energy Science and Engineering Vol. 3, No. 2, 2017, pp. 11-28 27
Figure 28. Variation curve of Merkel number with mass flow rate ratio for different fill type.
Figure 29. Variation curve of Merkel number with mass flow rate ratio for different fill type.
28 Saad Muhsen Saleh et al.: Experimental Investigation of Natural Draft Wet Cooling Tower Performance
6. Conclusions
The conclusions drawn from the experimental and theoretical
analysis are given as follows:
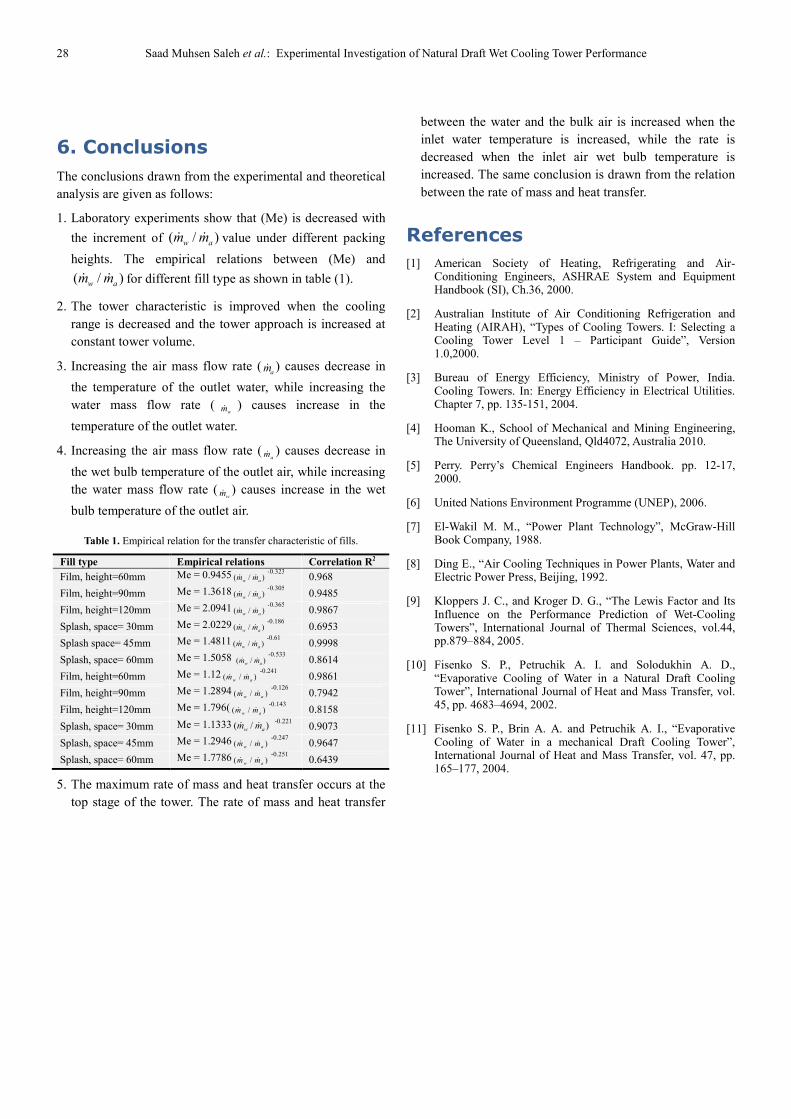
1. Laboratory experiments show that (Me) is decreased with
the increment of ( / )w a
m mɺ ɺ value under different packing
heights. The empirical relations between (Me) and
( / )w a
m mɺ ɺ for different fill type as shown in table (1).
2. The tower characteristic is improved when the cooling
range is decreased and the tower approach is increased at
constant tower volume.
3. Increasing the air mass flow rate (amɺ ) causes decrease in
the temperature of the outlet water, while increasing the
water mass flow rate (wmɺ ) causes increase in the
temperature of the outlet water.
4. Increasing the air mass flow rate (amɺ ) causes decrease in
the wet bulb temperature of the outlet air, while increasing
the water mass flow rate (wmɺ ) causes increase in the wet
bulb temperature of the outlet air.
Table 1. Empirical relation for the transfer characteristic of fills.
Fill type Empirical relations Correlation R2
Film, height=60mm Me = 0.9455 ( / )w am mɺ ɺ-0.323 0.968
Film, height=90mm Me = 1.3618 ( / )w am mɺ ɺ-0.305 0.9485
Film, height=120mm Me = 2.0941 ( / )w am mɺ ɺ-0.365 0.9867
Splash, space= 30mm Me = 2.0229 ( / )w am mɺ ɺ-0.186 0.6953
Splash space= 45mm Me = 1.4811 ( / )w am mɺ ɺ-0.61 0.9998
Splash, space= 60mm Me = 1.5058 ( / )w am mɺ ɺ
-0.533 0.8614
Film, height=60mm Me = 1.12 ( / )w am mɺ ɺ-0.241 0.9861
Film, height=90mm Me = 1.2894 ( / )w am mɺ ɺ-0.126 0.7942
Film, height=120mm Me = 1.796( ( / )w am mɺ ɺ-0.143 0.8158
Splash, space= 30mm Me = 1.1333 ( / )w a
m mɺ ɺ -0.221 0.9073
Splash, space= 45mm Me = 1.2946 ( / )w am mɺ ɺ-0.247 0.9647
Splash, space= 60mm Me = 1.7786 ( / )w am mɺ ɺ-0.251 0.6439
5. The maximum rate of mass and heat transfer occurs at the
top stage of the tower. The rate of mass and heat transfer
between the water and the bulk air is increased when the
inlet water temperature is increased, while the rate is
decreased when the inlet air wet bulb temperature is
increased. The same conclusion is drawn from the relation
between the rate of mass and heat transfer.
References
[1] American Society of Heating, Refrigerating and Air-Conditioning Engineers, ASHRAE System and Equipment Handbook (SI), Ch.36, 2000.
[2] Australian Institute of Air Conditioning Refrigeration and Heating (AIRAH), “Types of Cooling Towers. I: Selecting a Cooling Tower Level 1 – Participant Guide”, Version 1.0,2000.
[3] Bureau of Energy Efficiency, Ministry of Power, India. Cooling Towers. In: Energy Efficiency in Electrical Utilities. Chapter 7, pp. 135-151, 2004.
[4] Hooman K., School of Mechanical and Mining Engineering, The University of Queensland, Qld4072, Australia 2010.
[5] Perry. Perry’s Chemical Engineers Handbook. pp. 12-17, 2000.
[6] United Nations Environment Programme (UNEP), 2006.
[7] El-Wakil M. M., “Power Plant Technology”, McGraw-Hill Book Company, 1988.
[8] Ding E., “Air Cooling Techniques in Power Plants, Water and Electric Power Press, Beijing, 1992.
[9] Kloppers J. C., and Kroger D. G., “The Lewis Factor and Its Influence on the Performance Prediction of Wet-Cooling Towers”, International Journal of Thermal Sciences, vol.44, pp.879–884, 2005.
[10] Fisenko S. P., Petruchik A. I. and Solodukhin A. D., “Evaporative Cooling of Water in a Natural Draft Cooling Tower”, International Journal of Heat and Mass Transfer, vol. 45, pp. 4683–4694, 2002.
[11] Fisenko S. P., Brin A. A. and Petruchik A. I., “Evaporative Cooling of Water in a mechanical Draft Cooling Tower”, International Journal of Heat and Mass Transfer, vol. 47, pp. 165–177, 2004.