
Experimental Investigation of Composite Materials...
12
International Journal of Mechanical & Mechatronics Engineering IJMME-IJENS Vol:18 No:01 64 173101-2929-IJMME-IJENS © February 2018 IJENS I J E N S Abstract— This study focused on the dynamic behavior of pure epoxy, random-fiber-glass-epoxy, and woven-kevlar-fiber-epoxy at five angle of twist (4 ̊, 6 ̊, 8 ̊, 10 ̊ and 12 ̊ ) by using torsional -Split- Hopkinson-Bar (TSHB). A new mechanism of the clamp system is used in this work for the pressure on the lower ends of the clamp arms, which introducing a major simplification to (TSHP) design requirements the samples of composites were prepared by three volume fractions (25, 40 and 55%). The results indicated that maximum shear strain, and shear stress increased with increasing the shear strain rate for all types of these samples. The maximum shear-strain, shear-stress, and shear-strain-rate are observed in the 55% volume fraction of woven kevlar fiber-epoxy composite. When the angle of twist increased from 4 ̊ to 12 ̊, the shear-strain, shear-stress, and shear-strain-rate for 55% volume fraction of woven kevlar fiber-epoxy composite are increased by 4.9%, 5.8% and 6.7%, respectively. The composite samples with 55% volume fraction (random fiber glass and woven kevlar fiber) give shear- strain, shear-stress, and shear-strain-rate greater than samples with 25 and 40% volume fraction. Index Term— Hopkinson bar, high shear strain rate, composite materials. 1. INTRODUCTION High shear strain rate testing is encountered in many types of operations processing, such as forming, machining, grinding, penetration, and punching operations, processes, [1]. Air force massive ordnance air blast bomb and air force delta II rocket are examples of the military applications for the United States Air Force that benefit from testing with split-Hopkinson- torsion-bar [2]. The technique of Hopkinson was firstly developed to compression test of materials, later was extended to torsion and tension [3]. The torsional Hopkinson bar is a reliable device for materials testing from to strain rate. Hopkinson torsional bar is consisting of two bars (transmitter and incident bars) propped by bearings which permit them to rotate easily. A short-sample is fixed between them, (thin wall tube). The torsional-wave is generated in the incident-bar by the leave of the torque which is stored primarily in the part of device (between loading-end and clamp system) [4]. A. Gilat and C. S. Cheng (2002) [5] worked in the bases of modeling the split-torsional-Hopkinson-bar experiments at strain-rates above . Finite-element-analysis is used to investigate the material response by split-torsional-Hopkinson- bar apparatus in which strain-rate about is reached through utilizing samples with very short gage length. Stress- strain curves which are acquired in this method from measured elastic-waves in the bars, by assuming uniform and pure deformation and shear-stress in gage length, have some errors but, supply a satisfactory estimation for the response of material. F. Barthelat et al. (2004) [6] presented experimental- methodology for the dynamic torsion and quasi-static tests of nano, and micro-structured coating for (Tungsten carbide cobalt WC-Co, and Aluminum Titanium Oxide Powder - ) coating, at aluminum substrates utilizing speckle photograph. The displacement field given by speckle correlation method permitted the identification of mechanism of deformation, i.e., early crack bridging and crack propagation by ductile aluminum-substrate. No big changes in strength and modulus are founded between micro, and nano-structured material, but final changes between micro, and nano-structured material are maybe disguised by the first damage in coating, as observed on Scanning Electron Microscope and optical pictures. A. Gilat et al. (2007) [7] carried out a study to investigate the mechanical response for (PR-520 and E-862) epoxy-resin in the shear, and the tensile loading. On two sorts of the loading, two types of resins are experimented at the strain-rate about 450 to 700, 2, 5x . Results, display that, toughened (PR-520) can carry greater stresses than untoughened (E-862). Toughened (PR-520) has greater maximum-stress in the shear and greater failure-stress in the tension, compared with untoughened (E-862). M. N. Bassim (2007) [8] used Armor materials to evaluate high strain rate. They include Rolled homogeneous armor steel plate, 5083 aluminum alloys and ceramics. It used both direct impact, Hopkinson-compressive- bar, and split-torsional-Hopkinson-bar. Specimens were examined to determine the microstructural evolution during impact. Microstructural evolution in the materials during high strain-rate deformation is also investigated. Occurrence of adiabatic shear bands shows considerable influence on dynamic stress-strain curves for the materials and cause failure at high- strain-rates. Results refers to that the strain-rate in this study in excess of ( ). The main objective of the study carried out by R. S. Yatnalkar (2010) [9] is to investigate the plastic deformation of 6.35 mm thick Ti-6Al-4V plate under various loading conditions. Tensile, shear and compressive tests are performed at quasi-static strain-rate ( ) to Experimental Investigation of Composite Materials Subjected to Torsional Stresses at High Shear Strain Rate 1Asst. Prof. Dr. Fadhel Abbas Abdullah, M.Sc. student. Eng. Waad Adnan Khalaf Mech. Eng. Dep., College of Engineering, Al-Mustansiriyah University ([email protected])
Transcript of Experimental Investigation of Composite Materials...

International Journal of Mechanical & Mechatronics Engineering IJMME-IJENS Vol:18 No:01 64
173101-2929-IJMME-IJENS © February 2018 IJENS I J E N S
Abstract— This study focused on the dynamic behavior of pure
epoxy, random-fiber-glass-epoxy, and woven-kevlar-fiber-epoxy
at five angle of twist (4 ̊, 6 ,̊ 8 ̊, 10 ̊ and 12 ̊ ) by using torsional-Split-
Hopkinson-Bar (TSHB). A new mechanism of the clamp system is
used in this work for the pressure on the lower ends of the clamp
arms, which introducing a major simplification to (TSHP) design
requirements the samples of composites were prepared by three
volume fractions (25, 40 and 55%). The results indicated that
maximum shear strain, and shear stress increased with increasing
the shear strain rate for all types of these samples. The maximum
shear-strain, shear-stress, and shear-strain-rate are observed in
the 55% volume fraction of woven kevlar fiber-epoxy composite.
When the angle of twist increased from 4 ̊ to 12 ̊, the shear-strain,
shear-stress, and shear-strain-rate for 55% volume fraction of
woven kevlar fiber-epoxy composite are increased by 4.9%, 5.8%
and 6.7%, respectively. The composite samples with 55% volume
fraction (random fiber glass and woven kevlar fiber) give shear-
strain, shear-stress, and shear-strain-rate greater than samples
with 25 and 40% volume fraction.
Index Term— Hopkinson bar, high shear strain rate, composite
materials.
1. INTRODUCTION
High shear strain rate testing is encountered in many types of
operations processing, such as forming, machining, grinding,
penetration, and punching operations, processes, [1]. Air force
massive ordnance air blast bomb and air force delta II rocket
are examples of the military applications for the United States
Air Force that benefit from testing with split-Hopkinson-
torsion-bar [2]. The technique of Hopkinson was firstly
developed to compression test of materials, later was extended
to torsion and tension [3]. The torsional Hopkinson bar is a
reliable device for materials testing from to strain
rate. Hopkinson torsional bar is consisting of two bars
(transmitter and incident bars) propped by bearings which
permit them to rotate easily. A short-sample is fixed between
them, (thin wall tube). The torsional-wave is generated in the
incident-bar by the leave of the torque which is stored primarily
in the part of device (between loading-end and clamp system)
[4].
A. Gilat and C. S. Cheng (2002) [5] worked in the bases of
modeling the split-torsional-Hopkinson-bar experiments at
strain-rates above . Finite-element-analysis is used to
investigate the material response by split-torsional-Hopkinson-
bar apparatus in which strain-rate about is reached
through utilizing samples with very short gage length. Stress-
strain curves which are acquired in this method from measured
elastic-waves in the bars, by assuming uniform and pure
deformation and shear-stress in gage length, have some errors
but, supply a satisfactory estimation for the response of
material.
F. Barthelat et al. (2004) [6] presented experimental-
methodology for the dynamic torsion and quasi-static tests of
nano, and micro-structured coating for (Tungsten carbide cobalt
WC-Co, and Aluminum Titanium Oxide Powder - )
coating, at aluminum substrates utilizing speckle photograph.
The displacement field given by speckle correlation method
permitted the identification of mechanism of deformation, i.e.,
early crack bridging and crack propagation by ductile
aluminum-substrate. No big changes in strength and modulus
are founded between micro, and nano-structured material, but
final changes between micro, and nano-structured material are
maybe disguised by the first damage in coating, as observed
on Scanning Electron Microscope and optical pictures. A. Gilat
et al. (2007) [7] carried out a study to investigate the
mechanical response for (PR-520 and E-862) epoxy-resin in the
shear, and the tensile loading. On two sorts of the loading, two
types of resins are experimented at the strain-rate about 450 to
700, 2, 5x . Results, display that, toughened (PR-520)
can carry greater stresses than untoughened (E-862).
Toughened (PR-520) has greater maximum-stress in the shear
and greater failure-stress in the tension, compared with
untoughened (E-862). M. N. Bassim (2007) [8] used Armor
materials to evaluate high strain rate. They include Rolled
homogeneous armor steel plate, 5083 aluminum alloys and
ceramics. It used both direct impact, Hopkinson-compressive-
bar, and split-torsional-Hopkinson-bar. Specimens were
examined to determine the microstructural evolution during
impact. Microstructural evolution in the materials during high
strain-rate deformation is also investigated. Occurrence of
adiabatic shear bands shows considerable influence on dynamic
stress-strain curves for the materials and cause failure at high-
strain-rates. Results refers to that the strain-rate in this study in
excess of ( ). The main objective of the study carried out
by R. S. Yatnalkar (2010) [9] is to investigate the plastic
deformation of 6.35 mm thick Ti-6Al-4V plate under various
loading conditions. Tensile, shear and compressive tests are
performed at quasi-static strain-rate ( ) to
Experimental Investigation of Composite
Materials Subjected to Torsional Stresses at
High Shear Strain Rate
1Asst. Prof. Dr. Fadhel Abbas Abdullah, M.Sc. student. Eng. Waad Adnan Khalaf
Mech. Eng. Dep., College of Engineering, Al-Mustansiriyah University ([email protected])
International Journal of Mechanical & Mechatronics Engineering IJMME-IJENS Vol:18 No:01 65
173101-2929-IJMME-IJENS © February 2018 IJENS I J E N S
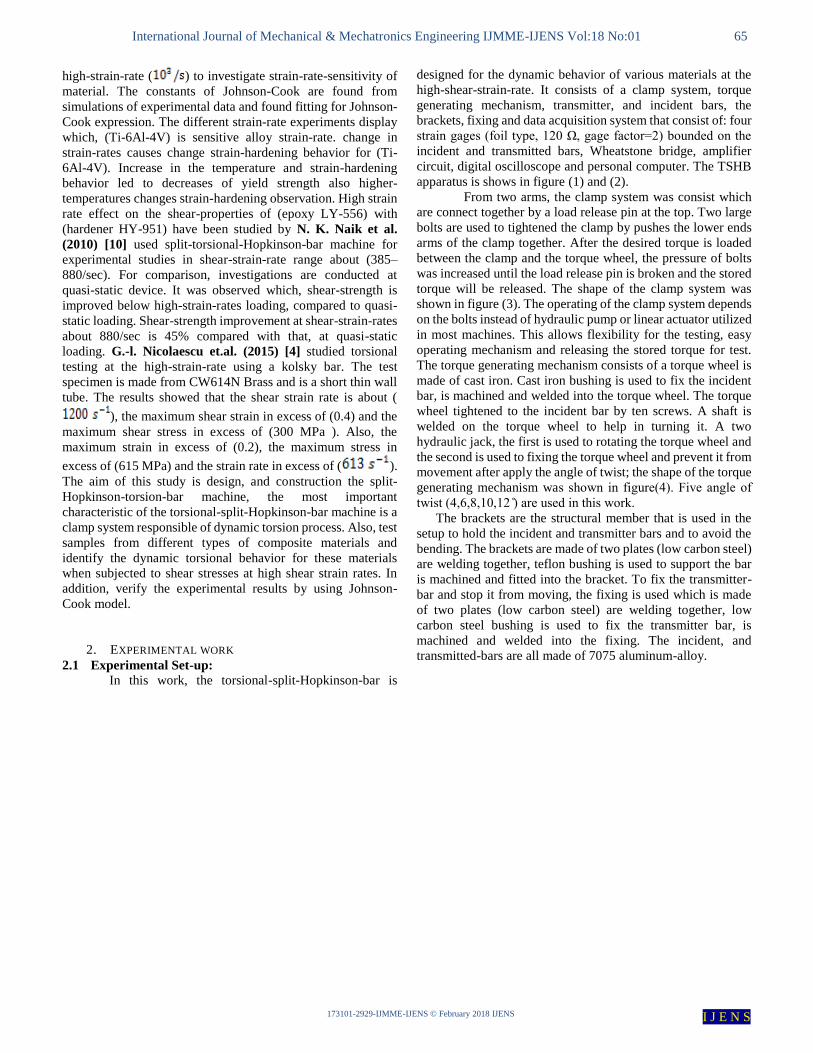
high-strain-rate ( ) to investigate strain-rate-sensitivity of
material. The constants of Johnson-Cook are found from
simulations of experimental data and found fitting for Johnson-
Cook expression. The different strain-rate experiments display
which, (Ti-6Al-4V) is sensitive alloy strain-rate. change in
strain-rates causes change strain-hardening behavior for (Ti-
6Al-4V). Increase in the temperature and strain-hardening
behavior led to decreases of yield strength also higher-
temperatures changes strain-hardening observation. High strain
rate effect on the shear-properties of (epoxy LY-556) with
(hardener HY-951) have been studied by N. K. Naik et al.
(2010) [10] used split-torsional-Hopkinson-bar machine for
experimental studies in shear-strain-rate range about (385–
880/sec). For comparison, investigations are conducted at
quasi-static device. It was observed which, shear-strength is
improved below high-strain-rates loading, compared to quasi-
static loading. Shear-strength improvement at shear-strain-rates
about 880/sec is 45% compared with that, at quasi-static
loading. G.-l. Nicolaescu et.al. (2015) [4] studied torsional
testing at the high-strain-rate using a kolsky bar. The test
specimen is made from CW614N Brass and is a short thin wall
tube. The results showed that the shear strain rate is about (
), the maximum shear strain in excess of (0.4) and the
maximum shear stress in excess of (300 MPa ). Also, the
maximum strain in excess of (0.2), the maximum stress in
excess of (615 MPa) and the strain rate in excess of ( ).
The aim of this study is design, and construction the split-
Hopkinson-torsion-bar machine, the most important
characteristic of the torsional-split-Hopkinson-bar machine is a
clamp system responsible of dynamic torsion process. Also, test
samples from different types of composite materials and
identify the dynamic torsional behavior for these materials
when subjected to shear stresses at high shear strain rates. In
addition, verify the experimental results by using Johnson-
Cook model.
2. EXPERIMENTAL WORK
2.1 Experimental Set-up:
In this work, the torsional-split-Hopkinson-bar is
designed for the dynamic behavior of various materials at the
high-shear-strain-rate. It consists of a clamp system, torque
generating mechanism, transmitter, and incident bars, the
brackets, fixing and data acquisition system that consist of: four
strain gages (foil type, 120 Ω, gage factor=2) bounded on the
incident and transmitted bars, Wheatstone bridge, amplifier
circuit, digital oscilloscope and personal computer. The TSHB
apparatus is shows in figure (1) and (2).
From two arms, the clamp system was consist which
are connect together by a load release pin at the top. Two large
bolts are used to tightened the clamp by pushes the lower ends
arms of the clamp together. After the desired torque is loaded
between the clamp and the torque wheel, the pressure of bolts
was increased until the load release pin is broken and the stored
torque will be released. The shape of the clamp system was
shown in figure (3). The operating of the clamp system depends
on the bolts instead of hydraulic pump or linear actuator utilized
in most machines. This allows flexibility for the testing, easy
operating mechanism and releasing the stored torque for test.
The torque generating mechanism consists of a torque wheel is
made of cast iron. Cast iron bushing is used to fix the incident
bar, is machined and welded into the torque wheel. The torque
wheel tightened to the incident bar by ten screws. A shaft is
welded on the torque wheel to help in turning it. A two
hydraulic jack, the first is used to rotating the torque wheel and
the second is used to fixing the torque wheel and prevent it from
movement after apply the angle of twist; the shape of the torque
generating mechanism was shown in figure(4). Five angle of
twist (4,6,8,10,12 )̊ are used in this work.
The brackets are the structural member that is used in the
setup to hold the incident and transmitter bars and to avoid the
bending. The brackets are made of two plates (low carbon steel)
are welding together, teflon bushing is used to support the bar
is machined and fitted into the bracket. To fix the transmitter-
bar and stop it from moving, the fixing is used which is made
of two plates (low carbon steel) are welding together, low
carbon steel bushing is used to fix the transmitter bar, is
machined and welded into the fixing. The incident, and
transmitted-bars are all made of 7075 aluminum-alloy.

International Journal of Mechanical & Mechatronics Engineering IJMME-IJENS Vol:18 No:01 66
173101-2929-IJMME-IJENS © February 2018 IJENS I J E N S
Fig. 1. Photographs of the Torsional Split Hopkinson Bar

International Journal of Mechanical & Mechatronics Engineering IJMME-IJENS Vol:18 No:01 67
173101-2929-IJMME-IJENS © February 2018 IJENS I J E N S
Fig. 2. Schematic of the Torsional Split Hopkinson Bar

International Journal of Mechanical & Mechatronics Engineering IJMME-IJENS Vol:18 No:01 68
173101-2929-IJMME-IJENS © February 2018 IJENS I J E N S
Fig. 3. The Clamp System. a) Photograph. b) Schematic
Fig. 4. The Torque Generating Mechanism. a) Photograph. b) Schematic
2.2 Material properties:
In present work, random fiber glass, and woven kevlar fiber all with 25%, 40% and 55% with epoxy resin are used to
prepared samples. Table (1) describes properties of fiber glass, and kevlar fiber. Table (2) displays properties of epoxy resin.
Table I
List of Properties of Kevlar Fiber, and Fiber Glass [11,12]
Properties Kevlar fiber Fiber glass
Density (gm/ ) 1.44 2.54
Tensile strength (MPa) 3600 3450
Modulus of elasticity (GPa) 83 72.4
% elongation 4 4.8
Table II
Properties of Epoxy Resin (Quickmast-105)
Density
(g/ )
Tensile-strength
(MPa)
Compressive-strength
(MPa)
Flexural-strength
(MPa)
1.1 25 70 45
a) b)

International Journal of Mechanical & Mechatronics Engineering IJMME-IJENS Vol:18 No:01 69
173101-2929-IJMME-IJENS © February 2018 IJENS I J E N S
2.3 Specimens Molding:
1. Measuring the epoxy resin by electronically balance.
2. A glass mold of (18 mm diameter and 140 mm length) with unlocked end is used in this work. Lubricating the pipe
from inside by oil and placing the fibers in glass-mold in homogenous shape to cover most sample volume, as shown
in figure (5).
5. Adding the epoxy with the hardener inside the molding.
6. The composite was left in mold for (6) hours at room-temperature to harden.
7. Lastly, test samples will be submitted to notching, cutting, and drilling processes.
Fig. 5. The Fibers in the Glass Mold
2.4 Specimens Machining:
The specimens are cut, notch and drill by using a lathe machine to get the final shape and dimensions of specimens. The
shape of the notch is square and place of the notch in the middle. The dimensions of a thin-walled cylindrical sample in this work
are 18 mm outer diameter (Do), 8 mm inner diameter (Di), 12 mm gage mean diameter (Ds), 14 mm overall length (Lt), 3.5 mm
gage length (Ls) and 2 mm wall thickness (ts); the final shape of specimen is shown in figure (6). In the previous work of TSHB,
there are different dimensions of specimen [4,8,10]. In this work, the dimensions of specimens are based on this different for
dimensions of the previous work.
Figure (6): The Final Shape of Test Specimen. a) Photograph. b) Schematic
3. CALCULATION OF THE SHEAR-STRAIN, SHEAR-STRESS, AND SHEAR-STRAIN-RATE:
The analytical solution to calculate shear-stress, shear-strain and shear-strain-rate of samples are [8]:
The expression for the specimen shear stress:
………………………. (1)
Where D is diameter of bar, G is modulus of shear of the bar, is gage thickness of the sample, is mean diameter of
gage of the sample and is the shear strain at the transmitter bar.
The expression for the specimen shear strain:
………………………. (2)
………………………. (3)
Here is shear wave speed in bar material, is the length of gage of the sample, is the density of the bar and is
the shear strain reflected to the incident bar.
The expression for the specimen shear strain rate:
…..…………………… (4)
a) b)

International Journal of Mechanical & Mechatronics Engineering IJMME-IJENS Vol:18 No:01 70
173101-2929-IJMME-IJENS © February 2018 IJENS I J E N S
Thus, the shear stress- shear strain behavior of specimen is determined simply by measurement made on the elastic wave in
torsional-split-Hopkinson-bar. The above equations relate strain gauges measurement to shear strain shear stress behavior in the
specimens deforming and require that the wave within the bar must be one dimensional and the specimen must deform uniformly.
4. RESULTS AND DISCUSSION
4.1 Shear Stress, Shear Strain, and Shear Strain Rate: Figure (7) shows the relation between the dynamic shear strain and shear stress for different shear strain rates. From this figure,
it can be seen that, when the angle of twist increased from 4 ̊ to 12 ̊, the shear strain, shear stress and shear strain rate increased by
27.8%, 42% and 35.9%, respectively. These increases reason is due to the increasing in the stored energy at the bars section between
the systems clamp and the torque of wheel which led to increase in transmitted (released after the clamp system) energy to the
sample.
Figure (8) shows the effect of volume fraction of the random fiber glass-epoxy composite on the shear stress-shear strain
behavior at maximum and minimum angle of twist. From this figure at Ө=12 ̊, when the volume fraction increased from 25% to
40% , the shear strain rate, shear strain, and shear stress are increased by 18.9 %,12.4 %, and 12.5% respectively, as well when
the volume fraction increased from 40% to 50% , the shear strain rate, shear strain, and shear stress increased by 6.4%, 8.7%
and 5.5%, respectively. It is evident that, when the volume fraction increasing, the magnetic force between atoms will be increasing,
and the sample will be becoming more stiffer and strength. These results indicate that improvement of the dynamic shear behavior
and the properties of materials occur when the samples subjected to torsional load at high shear strain-rates.
Fig. 7. Stress-Strain curves of Epoxy
Fig. 8. Stress-Strain curves for Random Fiber Glass-
Epoxy-Composite with different Volume-Fraction

International Journal of Mechanical & Mechatronics Engineering IJMME-IJENS Vol:18 No:01 71
173101-2929-IJMME-IJENS © February 2018 IJENS I J E N S
The shear stress versus shear strain curves for woven kevlar fiber -epoxy composite samples at minimum and maximum angle
of twist is shown in figure (9). It was appeared in the shape of the curves of shear strain -shear stress, the non- linearity increased
when the shear strain increases. From this figure, at θ=12 ̊, the percentage incremental in shear strain and shear stress with respect
to increase in volume fraction from 25% to 55% are 15.9% and 10.3%, respectively. Also, the incremental percentage in shear
strain rate with respect to incremental in volume fraction from 25% to 55% is 14.4%. The reason for these increases is due to
the increasing of the volume fraction which causes enhancement in the stiffness of samples.
Figure (10) shows the effect of maximum shear strain rate on the variations of maximum shear stress and maximum shear strain
for epoxy. From this figure, the increase in maximum shear strain and shear stress with shear strain rate is demonstrated clearly
because the increase in angle of twist led to an increase in transmitted energy. In addition, this material exhibited the maximum
shear strain and shear stress values at maximum shear strain rate of 425.2/s. The maximum shear strain and shear stress are 4.02 %
and 44.1 MPa respectively.
A B
Fig. 10. Variations of Maximum Shear Strain rate for Epoxy in: (A- Maximum Shear Stress, B- Maximum Shear Strain)
Fig. 9. Stress-Strain curves for Woven Kevlar Fiber-
Epoxy-Composite with different Volume-Fraction
International Journal of Mechanical & Mechatronics Engineering IJMME-IJENS Vol:18 No:01 72
173101-2929-IJMME-IJENS © February 2018 IJENS I J E N S
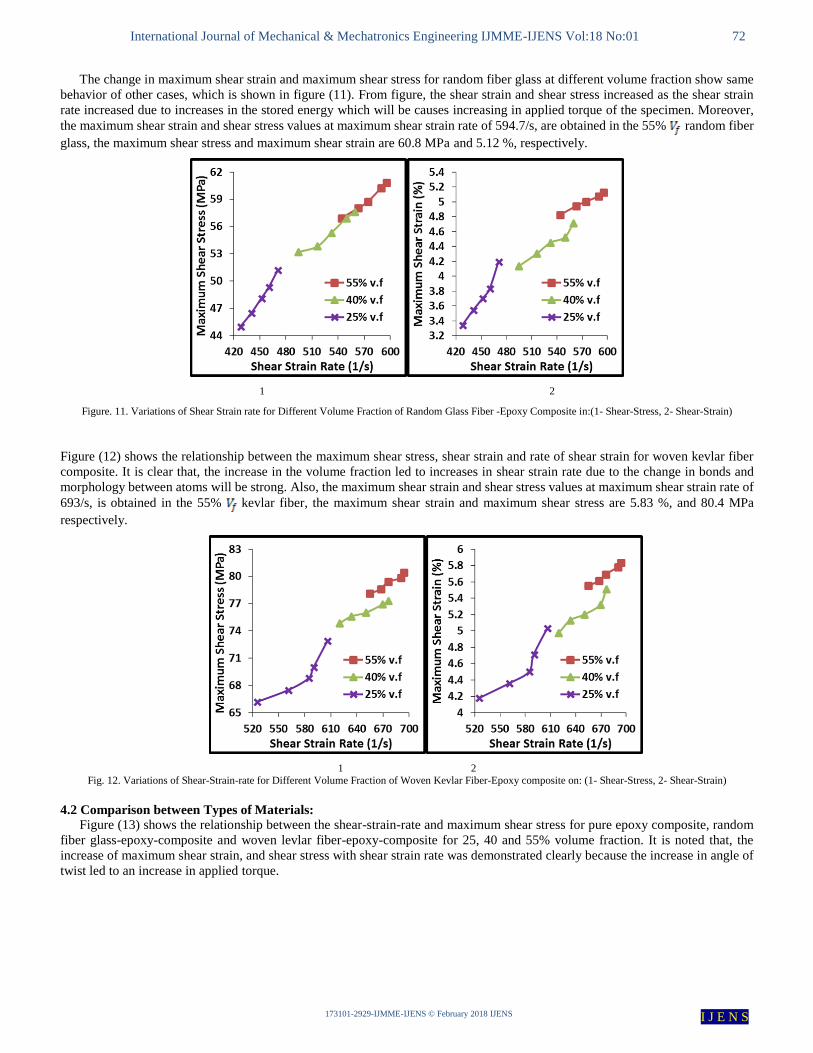
The change in maximum shear strain and maximum shear stress for random fiber glass at different volume fraction show same
behavior of other cases, which is shown in figure (11). From figure, the shear strain and shear stress increased as the shear strain
rate increased due to increases in the stored energy which will be causes increasing in applied torque of the specimen. Moreover,
the maximum shear strain and shear stress values at maximum shear strain rate of 594.7/s, are obtained in the 55% random fiber
glass, the maximum shear stress and maximum shear strain are 60.8 MPa and 5.12 %, respectively.
1 2
Figure. 11. Variations of Shear Strain rate for Different Volume Fraction of Random Glass Fiber -Epoxy Composite in:(1- Shear-Stress, 2- Shear-Strain)
Figure (12) shows the relationship between the maximum shear stress, shear strain and rate of shear strain for woven kevlar fiber
composite. It is clear that, the increase in the volume fraction led to increases in shear strain rate due to the change in bonds and
morphology between atoms will be strong. Also, the maximum shear strain and shear stress values at maximum shear strain rate of
693/s, is obtained in the 55% kevlar fiber, the maximum shear strain and maximum shear stress are 5.83 %, and 80.4 MPa
respectively.
1 2
Fig. 12. Variations of Shear-Strain-rate for Different Volume Fraction of Woven Kevlar Fiber-Epoxy composite on: (1- Shear-Stress, 2- Shear-Strain)
4.2 Comparison between Types of Materials:
Figure (13) shows the relationship between the shear-strain-rate and maximum shear stress for pure epoxy composite, random
fiber glass-epoxy-composite and woven levlar fiber-epoxy-composite for 25, 40 and 55% volume fraction. It is noted that, the
increase of maximum shear strain, and shear stress with shear strain rate was demonstrated clearly because the increase in angle of
twist led to an increase in applied torque.

International Journal of Mechanical & Mechatronics Engineering IJMME-IJENS Vol:18 No:01 73
173101-2929-IJMME-IJENS © February 2018 IJENS I J E N S
A B
C
Effect of shear-strain-rate on the maximum shear-strain for pure epoxy composite, random fiber glass-epoxy-composite and
woven kevlar fiber-epoxy-composite for 25, 40 and 55% volume fraction are shown in Figure (14). It is clear that, the 55% volume
fraction have higher shear strain and shear strain rate compared with those of 25 and 40% volume fraction. So, it is clear that, the
increase in volume-fraction led to increases in shear strain and shear strain rate.
A B
C
The shear stress versus shear strain curves for the epoxy in the present work and the epoxy in N. K. Naik et.al. [10] are shown
in figure (15).
Fig. 13. Comparison of Epoxy and Composite samples for
Effect of Shear Strain rate on Maximum Shear Stress at: (A-
25% Volume Fraction, B- 40% Volume Fraction and C-
55% Volume Fraction)
Fig.14. Comparison of Epoxy and Composite samples for
Effect of Shear-Strain-rate on Maximum Shear Strain at:
(A- 25% Volume Fraction, B- 40% Volume Fraction and C-
55% Volume Fraction)

International Journal of Mechanical & Mechatronics Engineering IJMME-IJENS Vol:18 No:01 74
173101-2929-IJMME-IJENS © February 2018 IJENS I J E N S
The results show that, a reasonable agreement between the shear properties of epoxy in the present work and the shear properties
of epoxy in N. K. Naik et.al. [10]. In addition, the epoxy in the present work has similar behavior to that of the epoxy in N. K. Naik
et.al. [10].
5. CONCLUSIONS
1. Tests have been carried out with split-Hopkinson-bar machine specially designed for the dynamic torsional tests. The design
and construction of the TSHB with its new clamp system mechanism (two bolts) proved to be successful and permitted
conducting tests in an easy and simplified method.
2. The composite samples with 55% volume fraction of (random fiber glass, and woven kevlar fibers) give shear stress, shear
strain and strain rate greater than samples with 25 and 40% volume fraction.
3. The 55% volume fraction of the woven kevlar fiber-epoxy composite, and radom fiber glass-epoxy-composite improved the
shear stress by 82.3%, and 37.9%, respectively compared with pure epoxy at θ=12 ̊.
4. When the angle of twist increased from 4 ̊ to 12 ̊, shear strain, shear stress, and shear-strain-rate of (55% volume fraction)
woven kevlar fiber-epoxy composite are increased by 2.9%, 5% and 5.9%, respectively.
ABBREVIATIONS
Symbol Description Units
A Static yield stress MPa
B Hardening modulus MPa
C Rate sensitivity constant -----
Shear wave speed m/s
D Diameter of bars mm
Inner diameter of a sample mm
Outer diameter of thin walled specimen mm
Gage mean diameter of thin walled specimen mm
G Shear modulus in the bars GPa
Gage length of thin walled specimen mm
Overall length of thin walled specimen mm
n Hardening coefficient -----
wall thickness of thin walled specimen mm
Volume fraction -----
The strain %
The strain rate 1/s
Equivalent plastic strain -----
The reference strain rate 1/s
The dimensionless strain rate 1/s
The angle of twist Degree
The shear strain %
Fig. 15. Comparison of Epoxy in the present work and Epoxy in
N. K. Naik et.al. [10] for Shear Stress- Shear Strain
Behavior

International Journal of Mechanical & Mechatronics Engineering IJMME-IJENS Vol:18 No:01 75
173101-2929-IJMME-IJENS © February 2018 IJENS I J E N S
The shear strain rate 1/s
Shear strain reflected to the incident bar %
Specimen shear strain %
Specimen shear strain rate 1/s
Shear strain in the transmitted bar %
The density of the bars 3g/cm
The stress MPa
The shear stress MPa
Specimen shear stress MPa
FSW Friction-Stir Welded -----
TSHP Torsional Split Hopkinson Bar -----
6. REFERENCES [1] K. Howard and M. Dana, "Mechanical Testing and Evaluation", ASM Handbook, vol. 8, ASM international, 2000.
[2] L. Fuentes, J. Gomez-Leon, and C. Trujillo, "Torsional Split Hopkinson Bar Optimization", B.Sc. Thesis, Department of Mechanical and Materials Engineering, Florida International University, USA, 2012.
[3] W. Chen and B. Song, "Split Hopkinson (Kolsky) Bar: Design, Testing and Applications", Springer Science & Business Media, LLC, 2011.
[4] G.-I. Nicolaescu, G.-A. Stefan, C. Enache and M. V. Carmaci, "Torsional Testing at High Strain Rates Using A Kolsky Bar", Land Forces Academy Review, vol. 20, no. 2, pp. 233-242, 2015.
[5] A. Gilat and C.-S. Cheng, "Modeling Torsional Split Hopkinson Bar Tests at Strain Rates above 10,000 ", International Journal of Plasticity,
vol. 18, no. 5, pp. 787-799, 2002.
[6] F. Barthelat, K. Malukhin and H. Espinosa, "Quasi-Static and Dynamic Torsion Testing of Ceramic Micro and Nano-Structured Coatings Using
Speckle Photography", Recent Advances in Experimental Mechanics, pp. 75-84, 2004.
[7] A. Gilat, R. K. Goldberg and G. D. Roberts, "Strain Rate Sensitivity of Epoxy Resin in Tensile and Shear Loading", Journal of Aerospace
Engineering, vol. 20, no. 2, pp. 75-89, 2007. [8] M. N. Bassim, "High Strain Rate Evaluation of Armor Materials", DRDC Valcartier CR, vol. 266, 2007.
[9] R. S. Yatnalkar, "Experimental Investigation of Plastic Deformation of Ti-6Al-4V under Various Loading Conditions", M.Sc. Thesis, The Ohio
State University, 2010. [10] N. K. Naik, R. Gadipatri, N. M. Thoram, V. R. Kavala and V. Ch, "Shear Properties of Epoxy Under High Strain Rate Loading", Polymer
Engineering & Science, vol. 50, no. 4, pp. 780-788, 2010.
[11] D. Gon, K. Das, P. Paul and S. Maity, "Jute Composites as Wood Substitute", International Journal of Textile Science, vol. 1, no. 6, pp. 84-93, 2012.
[12] G., Lubin, "Handbook of Composites", Van Nostrand Reinhold


![Influence of processing parameters and sintering ...ijens.org/Vol_12_I_01/120301-8484-IJMME-IJENS.pdf · biocompatibility, and insufficient affinity for cells and tissues [5, 6].](https://static.fdocuments.us/doc/165x107/5e5d8b01c516560c80780ba8/influence-of-processing-parameters-and-sintering-ijensorgvol12i01120301-8484-ijmme-ijenspdf.jpg)

