EXPERIMENTAL INVESTIGATION OF CAI COMBUSTION IN A TWO ...
196
EXPERIMENTAL INVESTIGATION OF CAI COMBUSTION IN A TWO-STROKE POPPET VALVE DI ENGINE A thesis submitted for the degree of Doctor of Philosophy By Yan Zhang College of Engineering, Design and Physical Sciences Brunel University London United Kingdom October 2014
Transcript of EXPERIMENTAL INVESTIGATION OF CAI COMBUSTION IN A TWO ...

EXPERIMENTAL INVESTIGATION OF CAI
COMBUSTION IN A TWO-STROKE POPPET VALVE DI
ENGINE
A thesis submitted for the degree of Doctor of Philosophy
By
Yan Zhang
College of Engineering, Design and Physical Sciences
Brunel University London
United Kingdom
October 2014

Brunel University London
College of Engineering, Design and Physical Sciences
United Kingdom
Yan Zhang
Experimental investigation of CAI combustion in a two-stroke poppet valve DI
engine
October 2014
Abstract
Due to their ability to simultaneously reduce fuel consumption and NOx emissions,
Controlled Auto Ignition (CAI) and HCCI combustion processes have been extensively
researched over the last decade and adopted on prototype gasoline engines. These
combustion processes were initially achieved on conventional two-stroke ported gasoline
engines, but there have been significantly fewer studies carried out on the CAI
combustion in two-stroke engines. This is primarily due to the inherent problems
associated with conventional two-stroke engine intake and exhaust ports.
Meanwhile, engine downsizing has been actively researched and developed as an
effective means to improve the vehicle’s fuel economy. This is achieved by operating the
engine at higher load regions of lower fuel consumption and by reducing the number of
cylinders. However, aggressive downsizing of the current 4-stroke gasoline engine is
limited by the knocking combustion and high peak cylinder pressure. As an alternative
approach to engine downsizing, boosted two-stroke operation is being researched. In
this thesis, it has been shown that the CAI combustion in the two-stroke cycle could be
readily achieved at part-load conditions with significant reductions in CO and uHC
emissions when compared to typical SI combustion in a single cylinder gasoline direct
injection camless engine. In addition, extensive engine experiments have been
performed to determine the optimum boosting for minimum fuel consumption during the
two-stroke operation. In order to minimise the air short-circuiting rate, the intake and
exhaust valve timings were varied and optimised. It is shown that the lean operation
under boosted condition can extend the range of CAI combustion and increase
combustion and thermal efficiencies as well as producing much lower CO and HC
emissions. By means of the cycle-resolved in-cylinder measurements and heat release

analysis, the improvement in combustion and thermal efficiencies were attributed to the
improved in-cylinder mixture, optimised autoignition, and combustion phases. Finally,
in view of the increased use of ethanol in gasoline engines, E15 and E85 were used and
their effect on engine performance, fuel economy and exhaust emissions were
investigated.

Acknowledgements
If life is a journey, PhD study must be a part of my journey. I would like to thank
everyone who helped me through this part of my journey.
I would like to express, first and foremost, my deep gratitude to Professor Hua Zhao for
all his help and support during the course of this project. I owe to him all the knowledge
and experience acquired during the past 3 years.
I would like to acknowledge Ricardo UK, Cambustion Ltd., and Prof. Nick Colling’s
group for all the support to engine control, the fast CO2 and O2 measurements during this
research.
I would like to express my gratitude to the continual assistance from various technicians
for their expertise and assistance for commissioning and maintaining the test cell.
Special thanks go to Clive Barrett, Andy Selway and Ken Anstiss.
I would like to thank my colleagues and friends Mohammed Ojapah and Macklini Dolla
Nora for their continuous help and support in solving the problems that happened during
this period and for their friendship that always helped to keep me motivated during
difficult moments.
I would also like to thank all my other colleagues and friends for their company,
friendship and moral support that made this a joyful time.
Finally, my most sincere gratitude goes to my family for their endless love, who has
helped me to keep my faith and motivation high, giving me the strength and support to
overcome the difficulties and to make the most of this experience.

Nomenclature
General Abbreviations
AC Alternating Current
ACEA European Automobile Manufacturers’ Association
AFR Air/Fuel Ratio
AFRS Stoichiometric Air/Fuel Ratio
ARC Active Radical Combustion
ATAC Active Thermal Atmosphere Combustion
ATDC After Top Dead Centre
BDC Bottom Dead Centre
BMEP Brake Mean Effective Pressure
BSCO Brake Specific Carbon Monoxide
BSFC Brake Specific Fuel Consumption
BSHC Brake Specific Hydro-Carbons
BSNO Brake Specific Nitrogen Oxides
BTDC Before Top Dead Centre
CA Crank Angle
CA Crank Angle
CAAA Clean Air Act Amendments
CAI Controlled Auto-Ignition
CARB Californian Air Resource Board
CI Compression Ignition
CR Compression Ratio
DAQ Data Acquisition Board
DI Direct Injection
ECU Electronic Control Unit
EGR Exhaust Gas Re-circulation
EPA Environmental Protection Agency-USA
EVC Exhaust Valve Closing
EVO Exhaust Valve Opening
FID Flame Ionization Detection
FTP Federal Test Procedure
GDI Gasoline Direct Injection
HCCI Homogeneous Charge Compression Ignition
HEV Hybrid Electric Vehicle
IC Internal Combustion
IMEP Indicated Mean Effective Pressure
ISCO Indicated Specific Carbon Monoxide
ISFC Indicated Specific Fuel Consumption
ISHC Indicated Specific Hydro-carbons
ISNO Indicated Specific Nitrogen Oxides
IVC Intake Valve Closing
IVO Intake Valve Opening
JAMA Japan Automobile Manufacturers’ Association
KAMA Korean Automobile Manufacturers’ Association
LEV Low Emission Vehicle
MBT Minimum Spark Advance for Best Torque
MFB Mass Fraction Burn
MHI Mitsubishi Heavy Industries
MPD Magneto-Pneumatic Detection
NDIR Non-Dispersive Infrared
NIMEP Net Indicated Mean Effective Pressure
NOx Nitrogen Oxides
NVO Negative Valve Overlap
NVO Negative Valve Overlap
PC Personal Computer
PM Particulate Matter
PMEP Pumping Mean Effective Pressure
ppm Parts per Million
PRF Primary Reference Fuel
PZEV Partial Zero Emissions Vehicle
RESS Rechargeable Energy Storage System
RON Research Octane Number
rpm Revolutions per Minute
SAE Society of Automotive Engineers
SCR Selective Catalyst Reduction
SI Spark Ignition
SULEV Super Low Emissions Vehicle
TDC Top Dead Centre

TLEV Transitional Low Emissions Vehicle
TPS Throttle Position Sensor
uHC Unburned Hydrocarbons
ULEV Ultra Low Emissions Vehicle
VBA Visual Basic for Applications
VCT Variable Compression Ratio
VCT Variable Cam Timing
VGT Variable Geometry Turbocharger
VOC Variable Organic Compounds
VR Variable Reluctance
VVA Variable Valve Actuation
WOT Wide Open Throttle
ZEV Zero Emission Vehicle

Contents Page Number
Abstract
Acknowlegements
Nomenclature
Chapter 1 Introduction 1
1.1 Introduction 1
1.2 Project objectives 2
1.3 Thesis outline 3
Chapter 2 Literature Review 5
2.1 Introduction 5
2.2 Internal Combustion Engine Technology 9
2.2.1 Two-Stroke Cycle 9
2.2.2 Four-Stroke Cycle 10
2.2.3 Variable Valve Actuation 11
2.2.4 Direct Injection 12
2.2.5 Engine Downsizing 14
2.2.6 Boosting Technologies 14
2.3 Controlled Auto-Ignition (CAI) Combustion 16
2.3.1 Principle of CAI and Previous Studies on Gasoline CAI
Combustion 16
2.3.2 Advantages and Challenges of CAI combustion in four-
stroke gasoline engines 23
2.3.3 Two-stroke CAI 26
2.4 Summary 27
Chapter 3 Experimental Setup and Test Facilities 29
3.1 Introduction 29
3.2 Camless two/four-stroke switchable DI engine and the valve train
system 29
3.2.1 Single Cylinder Engine 29
3.2.2 Electrohydraulic Valvetrain System 32
3.2.3 Fuelling System 35
3.2.4 Engine Control System 37
3.3 Dynamometer System 39

3.4 Supercharging System 40
3.5 Measurement System 41
3.6 Data Acquisition System 45
3.7 Summary 51
Chapter 4 Cycle-resolved Air Short-circuiting and Residual Gas Measurement 53
4.1 Introduction 53
4.2 Air Short-circuiting in Two-stroke Engines and its Measurement 53
4.3 Cycle-resolved Air Short-circuiting Measurement by Fast UEGO 54
4.4 Cycle-resolved Air Short-circuiting Measurement by Fast NDIR 60
4.5 Cycle-resolved Residual Gas Measurement by Fast NDIR 64
4.6 Summary 66
Chapter 5 Two-Stroke CAI Operation 68
5.1 Introduction 68
5.2 Two-stroke CAI Combustion at Lambda 1.0 68
5.2.1 Operating Range 69
5.2.2 Performance and Emissions at exhaust lambda 1.0 72
5.3 Short-circuiting Effects on Two-stroke CAI Combustion and
Emissions 76
5.4 Summary 81
Chapter 6 Further Analysis of Two-stroke CAI Combustion and Comparison
with other Combustion Modes 83
6.1 Introduction 83
6.2 Injection Timing Effects on CAI Combustion 83
6.2.1 Effect of Injection Timings on the Air Flow Rate 86
6.2.2 Effect of Injection Timings on Emissions 89
6.2.3 Effect of Injection Timing on CAI Combustion Process 91
6.3 Comparison between Two-stroke, Four-stroke, SI and CAI Operations98
6.3.1 Operating modes 99
6.3.2 Gas Exchange Efficiency 105
6.3.3 Combustion Efficiency 106
6.3.4 Thermodynamic Efficiency 108
6.3.5 Net Indicated Efficiency 109
6.3.6 Emissions 111
6.3.7 Mechanical Efficiency and BSFC 112
6.4 Summary 115

Chapter 7 Ethanol Blends CAI in Two-stroke Operation 117
7.1 Introduction 117
7.2 Ethanol Content Effects on CAI Combustion and Emissions 117
7.3 Ethanol Content Effects on Two-stroke CAI Operating Range 122
7.4 Ethanol Content Effects on Efficiencies of Two-stroke CAI Operation125
7.5 Summary 127
Chapter 8 Lean Boost CAI Operation 130
8.1 Introduction 130
8.2 Intake Pressure Effects on In-cylinder Lambda and Trapping
Efficiency 130
8.3 The Effects of Valve Timing on Two-stroke Lean Boost CAI 133
8.3.1 Effect of EVO 134
8.3.2 Effect of IVO 137
8.3.3 Effect of EVC 140
8.3.4 Effect of IVC 143
8.4 Fuel Consumption and Emissions 145
8.4.1 Heat Release Analysis of Lean Boost Two-stroke CAI
Operation 145
8.4.2 Emissions of Lean Boost Two-stroke CAI Operation 149
8.4.3 Combustion and Engine Efficiencies in the Lean Boost
Two-stroke CAI Operation 151
8.5 Effect of Ethanol Content on Two-stroke Lean Boost CAI 153
8.5.1 Operating Range 153
8.5.2 Combustion Process 156
8.5.3 Emissions 160
8.5.4 Efficiencies 162
8.6 Summary 164
Chapter 9 Conclusions and Recommendation for Future Work 167
9.1 Conclusions 167
9.2 Recommendations for Future Work 169
9.2.1 Combustion System Improvement 169
9.2.2 Further Extension of CAI Operating Range by Miller Cycle170
References 171
Appendix A – Publications related to this study 179

List of Figures Figure 2.1 CO2 Emission Standards [3] 6
Figure 2.2 A Typical Two-stroke Cycle Engine and Its Sequence of Two-stroke Cycle Events[15] 9
Figure 2.3 A Typical Four-stroke Cycle Engine and Its Sequence of Four-stroke Cycle Events [16] 11
Figure 2.4 Trend towards Increased Valve Timing Control [17] 12
Figure 2.5 Trend towards Increased Fuelling Control [17] 13
Figure 2.6 Electric Turbo Compound [29, 30] 15
Figure 2.7 Comparison of CI, SI and CAI Combustion Modes 16
Figure 2.8 Gasoline CAI Operating Range [39, 40] 19
Figure 2.9 Valve Lift Profiles for CAI Operation [49] 22
Figure 3.1 Schematic of Experimental Setup 29
Figure 3.2 Camless Two/Four-stroke Switchable DI Engine 30
Figure 3.3 Vertical Intake Port Design 31
Figure 3.4 Combustion Chamber and Piston Crown 32
Figure 3.5 Electrohydraulic Valve Actuator and its Cross Section Drawing 33
Figure 3.6 Valve Lift Profiles in Four-stroke Operation 33
Figure 3.7 Hydraulic Pump Unit 34
Figure 3.8 Valve Control Unit 34
Figure 3.9 Fuel Supply Circuit Diagram 35
Figure 3.10 Double Slit Solenoid GDI Injector and its Spray Pattern 36
Figure 3.11 Double-fan Spray in Combustion Chamber 36
Figure 3.12 Injector Mass Flow Rate Calibration 37
Figure 3.13 Engine Control System Diagram 37
Figure 3.14 INCA Interface 38
Figure 3.15 Sketch of Valve Profiles for Two-stroke SI and CAI Operation 39
Figure 3.16 AC Dynamometer and Inverter 39
Figure 3.17 Dynamometer Control Software Interface 40
Figure 3.18 AVL Supercharger and its Remote Controller 41
Figure 3.19 Kistler 6061B Pressure Transducer and 5011A Charge Amplifier 41
Figure 3.20 Kistler Type 4007B Piezo-resistive Pressure Transducer and its Installation for Instantaneous Intake and Exhaust Pressure Measurement 42
Figure 3.21 Coriolis Mass Flow Meter 43
Figure 3.22 Laminar Air Flow Meter 43
Figure 3.23 Diagram of Data Acquisition System 46
Figure 3.24 DAQ Card 47
Figure 3.25 Transient Combustion Analyser Panel 48
Figure 4.1 Short-circuiting of the Fresh Air during Scavenging Process 54
Figure 4.2 Lambda Variations during Scavenging Process 56
Figure 4.3 Modified Wide Band Lambda Sensor 57
Figure 4.4 Installation of Modified Lambda Sensor in a Fast Sampling Head 57
Figure 4.5 Sketch of the Structure of the Fast Sampling Head 58
Figure 4.6 Sketch of the Installation of the Sampling Probe 58
Figure 4.7 Installation of the Fast UEGO and Standard Lambda Sensors 59
Figure 4.8 In-cylinder Pressure and Fast Lambda VS Time 59
Figure 4.9 Variation of the CO2 concentration at the Back of Exhaust Valve 61
Figure 4.10 In-cylinder Pressure and CO2 Concentration Vs Time 61
Figure 4.11 Time-resolved CO2 Concentration over 100 Consecutive Engine Cycles 63
Figure 4.12 CO2b and Yshort in 100 Consecutive Engine Cycles 63

Figure 4.13 Spark Plug and Sample Probe Combination and its Installation on the Engine 65
Figure 4.14 In-cylinder Pressure and CO2 Concentration Vs Time 65
Figure 5.1 Operating Range for Two-stroke CAI Operation with Exhaust Lambda 1.0 70
Figure 5.2 Valve Profiles at 800rpm, 1500rpm and 3000rpm 70
Figure 5.3 Intake Pressure, Spark Timing, Combustion Duration and CA50 over the Operating Range 72
Figure 5.4 ISNOx, ISCO, ISHC, and Exhaust Temperature over the Operating Range 74
Figure 5.5 Effect of Short-circuiting on the Measurement of Lambda at 1500rpm 75
Figure 5.6 ISFC over the Operating Range 75
Figure 5.7 CO2 Concentration at the Exhaust Valve at 1500rpm Vs Time 76
Figure 5.8 IMEP, short-circuiting rate and air flow rate at 1500rpm VS. intake pressure77
Figure 5.9 Intake Pressure and Fuelling Rate Vs Lambdatp 77
Figure 5.10 Effect of Short-circuiting on the Difference between the Measured Exhaust Lambda and In-cylinder Lambda Values 78
Figure 5.11 Effect of Lambda on CO, HC and NOx Emissions 79
Figure 5.12 Effect of Lambda on CO2 Emissions 79
Figure 5.13 Effect of Lambda on Combustion Efficiency 80
Figure 5.14 Effect of Lambda on Combustion Duration 80
Figure 6.1 Valve Timings for Four-stroke and Two-stroke CAI Operations 84
Figure 6.2 Injection Timing in Four-stroke NVO CAI Operation 85
Figure 6.3 Injection Timing in Four-stroke Exhaust Rebreathe CAI Operation 85
Figure 6.4 Injection Timing in Two-stroke CAI Operation 86
Figure 6.5 Effect of Injection Timing on Intake Air Flow Rate in Four-stroke NVO CAI Operation (1500rpm, Lambda=1) 87
Figure 6.6 Effect of Injection Timing on Intake Air Flow Rate in Four-stroke Exhaust Rebreathe CAI Operation (1500rpm, Lambda=1) 88
Figure 6.7 Effect of Injection Timing on the Intake Air Flow Rate in Two-stroke CAI Operation (1500rpm, Lambda=1) 89
Figure 6.8 Effect of Injection Timing on CO Emissions in Four-stroke NVO CAI Operation (1500rpm, Lambda=1) 90
Figure 6.9 Effect of Injection Timing on HC Emissions in Four-stroke NVO CAI Operation (1500rpm, Lambda=1) 91
Figure 6.10 Effect of Injection Timing on CO Emissions in Four-stroke Exhaust Rebreathe CAI Operation (1500rpm, Lambda=1) 92
Figure 6.11 Effect of Injection Timing on HC Emissions in Four-stroke Exhaust Rebreathe CAI Operation (1500rpm, Lambda=1) 92
Figure 6.12 Effect of Injection Timing on CO Emissions in Two-stroke CAI Operation (1500rpm, Lambda=1) 93
Figure 6.13 Effect of Injection Timing on HC Emissions in Two-stroke CAI Operation (1500rpm, Lambda=1) 93
Figure 6.14 Effect of Injection Timing on CA10 and CA10-90 in Four-stroke NVO CAI Operation 95
Figure 6.15 Effect of Injection Timing on CA10 and CA10-90 in Four-stroke Exhaust Rebreathe CAI Operation 96
Figure 6.16 Effect of Injection Timing on CA50 and CA10-90 in Two-stroke CAI Operation 97
Figure 6.17 Valve Timings and Injection Timings for the 7 Operating Modes 102
Figure 6.18 P-V Diagram for 7 Operating Modes 104
Figure 6.19 PMEP of the 7 Operating Modes 105
Figure 6.20 Gas Exchange Efficiency of the 7 Operating Modes 106
Figure 6.21 Combustion Efficiency of the 7 Operating Modes 107

Figure 6.22 ISCO and ISHC of the 7 Operating Modes 107
Figure 6.23 Gross Indicated Thermodynamic Efficiency of the 7 Operating Modes 109
Figure 6.24 CA10, CA50, CA90 and Combustion Duration of the 7 Operating Modes 109
Figure 6.25 Indicated Efficiency of the 7 Operating Modes 110
Figure 6.26 ISFC of the 7 Operating Modes 111
Figure 6.27 NOx Emissions of the 7 Operating Modes 112
Figure 6.28 FMEP of the 7 Operating Modes 113
Figure 6.29 Mechanical Efficiency of the 7 Operating Modes 113
Figure 6.30 BSFC of the 7 Operating Modes 114
Figure 7.1 CA50 in Two-stroke CAI Operation at 2000rpm 118
Figure 7.2 CA10-90 in Two-stroke CAI Operation at 2000rpm 119
Figure 7.3 Heat Release Rate and Mass Fraction Burnt of E85 at 2000rpm 119
Figure 7.4 uHC Emissions in Two-stroke CAI Operation at 2000rpm 120
Figure 7.5 CO Emissions in Two-stroke CAI Operation at 2000rpm 120
Figure 7.6 NOx Emissions in Two-stroke CAI Operation at 2000rpm 121
Figure 7.7 Operating Range of Two-stroke CAI Fuelled with Gasoline, E15 and E85 122
Figure 7.8 In-cylinder Pressure and Heat Release Rate at 1000rpm and Different Loads 123
Figure 7.9 Heat Release Rate of Gasoline, E15 and E85 at 1000rpm and 5.3bar IMEP 123
Figure 7.10 Air Flow Rate [g/cycle] over Two-stroke CAI Operating Range 125
Figure 7.11 Combustion Efficiency in Two-stroke CAI Operation at 2000rpm 126
Figure 7.12 Thermodynamic Efficiency in Two-stroke CAI Operation at 2000rpm 126
Figure 7.13 Indicated Fuel Conversion Efficiency in Two-stroke CAI Operation at 2000rpm 127
Figure 8.1 CAI Operating Range and Intake Pressure Contours 132
Figure 8.2 Effect of Intake Pressure on the Scavenging Process with Lean Boost at 1000rpm 132
Figure 8.3 In-cylinder Lambda and Exhaust Lambda Values of Lean Boost Operations 133
Figure 8.4 Effect of EVO at 1500rpm 136
Figure 8.5 Effect of IVO at 1500rpm 139
Figure 8.6 Effect of EVC at 1500rpm 142
Figure 8.7 Effect of IVC at 1500rpm 145
Figure 8.8 In-cylinder Pressure and Heat Release Process of CAI Combustion at 1500rpm 147
Figure 8.9 Combustion Phasing (CA50), Spark Timing and Combustion Duration (CA10-90) over the Operating Range 148
Figure 8.10 Coefficient of Variation (COV) of IMEP over the Lean Boost Two-stroke CAI Operating Range 149
Figure 8.11 Indicated Specific CO Emissions 150
Figure 8.12 Indicated Specific HC Emissions 150
Figure 8.13 NOx Emissions 150
Figure 8.14 Exhaust Temperatures 151
Figure 8.15 Combustion Efficiencies 152
Figure 8.16 Indicated Specific Fuel Consumptions 152
Figure 8.17 RGF Measured by Fast CO2 Analyser at Lean Boost Operation 153
Figure 8.18 Operating Range of Two-stroke Lean Boost CAI with Gasoline, E15 and E85 155
Figure 8.19 Maximum Pressure Rise Rate at 1500rpm 155
Figure 8.20 COVimep at 1500rpm and 800rpm 156
Figure 8.21 Cylinder Pressure and Heat Release Rate at 2.1bar IMEP and 1500rpm 156
Figure 8.22 Cylinder Pressure and Heat Release Rate at 4.6bar IMEP and 1500rpm 157

Figure 8.23 Cylinder Pressure and Heat Release Rate at 7.6bar IMEP and 1500rpm 158
Figure 8.24 CA10 (Start of Combustion) and Spark Timing 159
Figure 8.25 CA50 Figure 8.26 CA10-90 159
Figure 8.27 Indicated Specific CO Emissions 160
Figure 8.28 Indicated Specific HC Emissions 161
Figure 8.29 Indicated Specific NOx Emissions 161
Figure 8.30 Combustion Efficiency 162
Figure 8.31 Thermodynamic Efficiency 163
Figure 8.32 Indicated Efficiency 163

List of Tables Table 2.1 EU Emission Standards for Passenger Cars [8] 7
Table 2.2 CARB Emission Legislations for Passenger Cars [9] 8
Table 3.1Engine Specifications 30
Table 3.2 E15 Fuel Properties 44
Table 3.3 E85 Fuel Properties 45
Table 3.4 Channel Definition in DAQ Card 47
Table 4.1 Sample Operating Condition 62
Table 6.1 Valve Timings and Lifts for each Operating Mode 84
Table 6.2 Valve Timings for each Operating Mode 103
Table 8.1 Operating Parameters for Valve Timing Effect Tests 134

Chapter 1
Introduction

1
Chapter 1 Introduction
1.1 Introduction
Transportation is a necessary part of daily human life. From ancient times to present day,
in every place where human beings exist in the world, people have been always trying to
find ways to transport themselves and goods robustly and efficiently over long distances.
The advent of the automobile has significantly changed the world and the lifestyle of
human beings. Although it is actually hard to imagine the world without automobile
today, no doubt it would have been impossible to make the first vehicle without the
contribution of internal combustion engine, this engine is attributed to the effort of an
engineer called Nikolaus Otto who gave his name to the ‘Otto’ cycle which has been
utilised in hundreds of millions of IC engines all over the world.
After the IC engine was applied to the motor vehicle, revolution of the transportation
industry took place. As important as the steam engine which brought up the early stage
train and railway, the IC engine solved the problem with moving heavy goods on the
road without the use of rails. This invention injected infinite vigour and vitality into the
modern consumer culture.
The IC engine is a machine that converts the thermal energy from a chemical reaction of
air and fuel into mechanical power. Initially, it had very low fuel conversion efficiency
and produced relatively high emissions. Over the last century, with the development of
innovative engine technologies, the IC engine has been developed into a high power
density powerplant of high fuel conversion efficiency and low emissions.
In order to further improve the fuel economy and reduce emissions of the IC engine,
alternative combustion systems have been proposed and investigated. In particular, a new
generation of combustion methodology known as Controlled Auto Ignition (CAI) or
Homogeneous Charge Compression Ignition (HCCI). These are researched due to their
potential to achieve simultaneous reductions in fuel consumption and NOx and
Particulate Matter (PM) emissions by combining the advantage of homogenous charge in
gasoline engines and compression ignition in diesel engines. This combustion system

2
provides a way to alleviate the pressure on the requirement of expensive, complex and
inefficient after-treatment systems under the increasingly strict emissions legislations.
Another engine technology for better fuel economy is engine downsizing which involves
the replacement of a bigger engine with a smaller engine of reduced displacement
volume and the number of cylinders. A lot of research and development efforts have been
made in engine downsizing in the last decade, which has led to the introduction of
turbocharged direct injection gasoline engines of higher power density and greater
BMEP.
To date, passenger cars in series production have been powered almost exclusively by
four-stroke reciprocating piston engines. However, due to their part-load pumping losses
and lower compression ratio, conventional four-stroke spark ignition (SI) gasoline
combustion engines are much less efficient than the high speed direct injection (HSDI)
diesel engines. Gasoline Direct Injection (GDI) engines are regarded as the most
promising technology to minimise fuel consumption. In the meanwhile, two-stroke
cycles, because of its higher specific output, are particularly attractive for automotive
applications. A four-stroke engine can be 50% downsized by halving the number of
cylinders but running in two-stroke operation.
In this work, two-stroke CAI combustion was achieved and investigated in a 2/4stroke
switchable DI gasoline engine equipped with poppet valves and a fully flexible variable
valve actuation system. The two-stroke CAI operational range from idle to part-load was
investigated. The combustion system, injection strategy, and boosting strategy were
optimized for best fuel economy and emissions. The results were compared to different
operating modes, such as 4-stroke throttled SI, Intake valve throttled SI, Positive valve
overlap SI, Negative valve overlap CAI, Exhaust rebreathing CAI and two-stroke SI.
The effect of ethanol content on the two-stroke engine’s performance, fuel economy and
emissions were also studied.
1.2 Project objectives

3
The aim of the project is to evaluate the potential of two-stroke CAI operations in a direct
injection gasoline engine with poppet valves and the effect of ethanol on such operations.
The specific objectives are:
1. To explore and research CAI combustion for stable, fuel efficient and low emission
part-load operations in a boosted DI gasoline engine with poppet valves operated in
two-stroke mode.
2. To study the effect of scavenging during gas exchange process on composition of in-
cylinder mixture and subsequent combustion process in two-stroke CAI and SI modes.
3. To investigate the performance, combustion and emission characteristics of two-
stroke CAI combustion and the effect of fuel injection strategy and valve timings.
4. To investigate the effect of blended ethanol and gasoline fuels on combustion, engine
efficiency and emissions from such an engine.
1.3 Thesis outline
Following this introduction, Chapter 2 gives a review of literature related to this work. In
Chapter 3, the experimental setup and test facilities are described in detail. This includes
the engine, dynamometer, supercharger and data acquisition system developed by the
author. The phenomenon of ‘air short-circuiting’ is introduced and an innovative method
of measuring it on the engine is also presented in Chapter 4. The results of two-stroke
CAI operating range, performance and emissions with exhaust lambda=1 are discussed in
Chapter 5. Further analysis, including injection timing effects and comparison between
two-stroke, four-stroke, SI, CAI operation, is presented in Chapter 6. Ethanol content
effect on two-stroke CAI is discussed in Chapter 7. In order to minimise air short-
circuiting, lean boost operation was investigated and their results are presented in
Chapter 8. Chapter 9 includes the conclusion and recommendation for future work.
4
Chapter 2
Literature Review

5
Chapter 2 Literature Review
2.1 Introduction
Since the 1960s, people have started paying more attention to the impact of the gaseous
and particulate emissions from vehicles and engines on environmental pollution. Over
the last 30 years, many countries have introduced more stringent legislations to limit
emissions from vehicles. The concern with limited fossil fuel reserves and recent climate
change caused by CO2 emissions led to the increasing rise in the road tax and fuel tax,
and more recently the introduction of CO2 and fuel economy limits. As a result,
automobile manufacturers are forced to research, develop and manufacture more efficient
and cleaner vehicles. Newly implemented technologies, such as battery electric vehicles
and fuel cell vehicles, have shown the potential to replace IC engines with minimal
pollution at the point of use. However, none of them can be utilised as a direct
replacement of the internal combustion engine so far due to the issues of their
practicality, cost, range, the source of electricity/hydrogen and the charging facilities.
Due to these drawbacks, the IC engine will still be the primary powertrain for vehicles.
In terms of energy consumption, IC engines are the main consumer of fossil fuels.
Statistical data from the Organization of the Petroleum Exporting Countries (OPEC)
showed in 2009 57% of global fossil fuels were consumed in vehicular traffic areas and it
is predicted that the percentage will increase to over 60% by 2035. This is due to an
increase in vehicle ownership in the developing countries [1].
The scientific community generally believes that burning fossil fuels is one of the main
causes of increased greenhouse gas concentrations in the atmosphere, contributing to
global warming in the last decades of the 20th century [2]. With the increase of car
ownership, the car has become one of the major sources of CO2 emissions. The most
effective way to reduce engine CO2 emissions is to improve fuel efficiency of the engine.
In addition, CO2 emissions can be reduced by the use of renewable fuels, such as ethanol
and bio-diesel.
In response to concerns with global warming and limited petroleum, a number of
countries have introduced fuel economy or CO2 emission legislations [3-7]. As shown in
Figure 2.1, Europe, US, Japan, and Canada have started CO2 legislation in 2000. In the

6
EU and Japan, CO2 legislation is more stringent than the US and Canada due to the
popularity of small vehicles. China, South Korea, and Australia began their CO2
legislation and their limit value is between that of the US and EU. The limit of CO2
emissions in each country is decreasing every year, but the rate at which it’s reducing is
getting smaller after 2010. Currently, the limit is about 130g/km in Europe while 167
g/km in China and 180 g/km in US. It is expected that the rate of reduction of the CO2
emission limit will be higher in the next 5 years due to the development of new advanced
engine technologies. By 2020, the CO2 regulations in Europe will be the most stringent
in the world, where 95g/km is nearly a half of that in 2000. The US is expected to reduce
CO2 emissions by more than 50% in a 25 year timeframe from 2000 to 2025. The
situation remains critical, as vehicle ownership in the world has increased by more than
10 times in the past 15 years.
Figure 2.1 CO2 Emission Standards [3]
Burning fossil fuels also produces harmful emissions such as carbon monoxide (CO),
unburnt hydrocarbons (uHC), nitrogen oxides (NOx) and particulate matter (PM). Over
the past 40 years many countries have implemented increasingly stringent emission
legislations to limit the output of harmful emissions from vehicles. The EU and
California emissions legislation for passenger cars are shown in Table 2.1 and 2.2
respectively [8, 9]. Other countries and regions have developed their own emission
regulations corresponding to their specific situations. Currently, the California emission
US 2025:107US 2025:107US 2025:107US 2025:107EU 2020: 95EU 2020: 95EU 2020: 95EU 2020: 95Japan 2020: 105Japan 2020: 105Japan 2020: 105Japan 2020: 105China 2020: 117China 2020: 117China 2020: 117China 2020: 11790909090110110110110130130130130150150150150170170170170190190190190210210210210230230230230250250250250270270270270
2000200020002000 2005200520052005 2010201020102010 2015201520152015 2020202020202020 2025202520252025Gra
ms
CO
2p
er k
ilom
eter
, n
orm
ali
zed
to
NE
DC
US-LDVCalifornia-LDVCanada-LDVEUJapanChinaS. KoreaAustralia

7
standards are the most stringent in the world. The United States and European emission
regulations were different in detection mode, but after normalization of LEV II and Euro
IV standard requirements, HC emissions are almost identical.[10] However, the limits
of NOx emissions in LEV II is only half of Euro IV. This led to the high speed diesel
engine and gasoline direct injection engine not being able to appear in the market before
their corresponding after treatment system development.
Table 2.1 EU Emission Standards for Passenger Cars [8]
Stage Date CO HC HC+NOx NOx PM PN
g/km #/km
Compression Ignition (Diesel)
Euro 1† 1992.07 2.72 (3.16) - 0.97 (1.13) - 0.14 (0.18) -
Euro2, IDI 1996.01 1.0 - 0.7 - 0.08 -
Euro 2, DI 1996.01a 1.0 - 0.9 - 0.10 -
Euro 3 2000.01 0.64 - 0.56 0.50 0.05 -
Euro 4 2005.01 0.50 - 0.30 0.25 0.025 -
Euro 5a 2009.09b 0.50 - 0.23 0.18 0.005f -
Euro 5b 2011.09c 0.50 - 0.23 0.18 0.005f 6.0×10¹¹
Euro 6 2014.09 0.50 - 0.17 0.08 0.005f 6.0×10¹¹
Positive Ignition (Gasoline)
Euro 1† 1992.07 2.72 (3.16) - 0.97 (1.13) - - -
Euro 2 1996.01 2.2 - 0.5 - - -
Euro 3 2000.01 2.30 0.20 - 0.15 - -
Euro 4 2005.01 1.0 0.10 - 0.08 - -
Euro 5 2009.09b 1.0 0.10d - 0.06 0.005e,f -
Euro 6 2014.09 1.0 0.10d - 0.06 0.005e,f 6.0×10¹¹
e,g
* At the Euro 1..4 stages, passenger vehicles > 2,500 kg were type approved as Category
N1 vehicles

8
Stage Date CO HC HC+NOx NOx PM PN
g/km #/km
† Values in brackets are conformity of production (COP) limits
a. until 1999.09.30 (after that date DI engines must meet the IDI limits)
b. 2011.01 for all models
c. 2013.01 for all models
d. and NMHC = 0.068 g/km
e. applicable only to vehicles using DI engines
f. 0.0045 g/km using the PMP measurement procedure
g. 6.0×10¹² /km within first three years from Euro 6 effective dates
Table 2.2 CARB Emission Legislations for Passenger Cars [9]
Standard
Year of
Approv
al
Durabil
ity
Vehicle
Basis
Engi
ne
type
CO
(g/km)
NMOG
(g/km)
NOx
(g/km)
HCHO
(g/km)
PM
(g/km)
Tier I
(LEV I)
2001-03 100,000
mi
TLEV Any 2.61 0.097 0.37 0.0112 0.05
LEV Any 2.61 0.056 0.19 0.0112 0.05
ULEV Any 1.30 0.034 0.19 0.0068 0.02
LEV II
2004-10 120,000
mi
LEV Any 2.61 0.056 0.04 0.0112 0.01
ULEV Any 1.30 0.034 0.04 0.0068 0.01
SULEV Any 0.06 0.006 0.01 0.0025 0.01
LEV III
2015-25 150,000
mi
NMOG+NOx (g/km)
LEV160 Any 2.61 0.099 - 0.0025 0.0062
ULEV125 Any 1.30 0.0776 - 0.0025 0.0062
SULEV30 Any 0.621 0.0186 - 0.0025 0.0062
Achieving high efficiency, low fuel consumption, and emissions in the internal
combustion engine has been a common challenge faced by engine researchers and the
engine manufacturers of the world.
9
2.2 Internal Combustion Engine Technology
2.2.1 Two-Stroke Cycle
Two-stroke cycle operation is not a new concept and was used in engines even earlier
than the four-stroke engine. Modern two-stroke engines are refined and have high
performance are compact and lightweight power devices. The largest and smallest
reciprocating piston engines are in two-stroke cycles. [11]
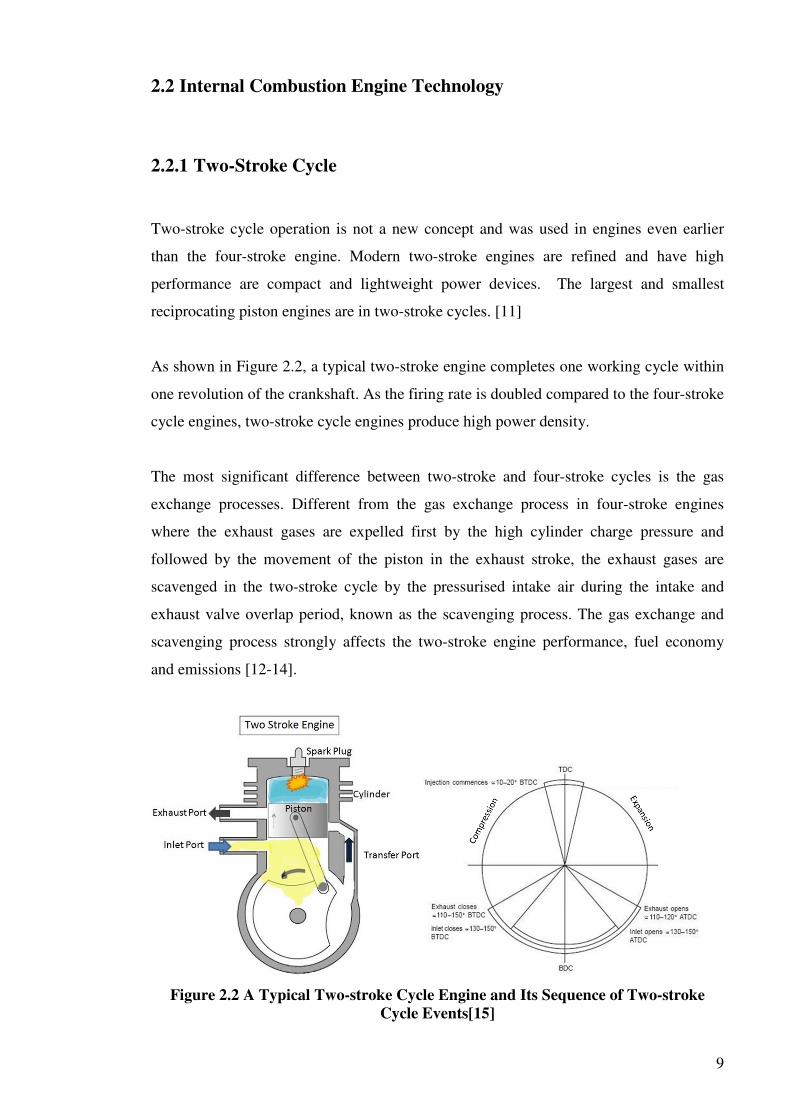
As shown in Figure 2.2, a typical two-stroke engine completes one working cycle within
one revolution of the crankshaft. As the firing rate is doubled compared to the four-stroke
cycle engines, two-stroke cycle engines produce high power density.
The most significant difference between two-stroke and four-stroke cycles is the gas
exchange processes. Different from the gas exchange process in four-stroke engines
where the exhaust gases are expelled first by the high cylinder charge pressure and
followed by the movement of the piston in the exhaust stroke, the exhaust gases are
scavenged in the two-stroke cycle by the pressurised intake air during the intake and
exhaust valve overlap period, known as the scavenging process. The gas exchange and
scavenging process strongly affects the two-stroke engine performance, fuel economy
and emissions [12-14].
Figure 2.2 A Typical Two-stroke Cycle Engine and Its Sequence of Two-stroke
Cycle Events[15]

10
2.2.2 Four-Stroke Cycle
Conventional two-stroke gasoline engines have been gradually replaced by four-stroke
engines in automotive applications because of inherent problems with emissions. Two-
strokes have high CO and HC emissions due to burning of mixed fuel and oil and fuel
short-circuiting, cylinder liner and piston deformation due to uneven thermal stress of hot
exhaust and cold intake ports, poor scavenging and low trapping efficiency with fixed
symmetrical port timings. In addition, conventional spark ignition combustion in the two-
stroke cycle suffers from high cyclic variation and sometimes misfire due to the presence
of significant amount of residual gases, ultimately resulting in high HC and CO
emissions and poor fuel economy.
In recognition of the drawbacks of two-stroke engines, the four-stroke engine was
invented. This was mainly aimed to improve the gas exchange process of two-stroke
engines. Firstly, as shown in Figure 2.3, compared to two-stroke cycle, the intake and
exhaust strokes are split out in the four-stroke engine. There are 2 independent cycles for
intake and exhaust process. Secondarily, the intake and exhaust ports in two-stroke
engines are replaced with poppet valves. In this case, there is no need for fresh air to go
through crankcase, where lubricant oil can mix with fresh air.

11
Figure 2.3 A Typical Four-stroke Cycle Engine and Its Sequence of Four-stroke
Cycle Events [16]
Nowadays all the vehicles are driven by four-stroke engines equipped with poppet valves
because of their lower emissions and better fuel economy than the conventional ported
two-stroke engines.
2.2.3 Variable Valve Actuation
The gas exchange process has a significant effect on engine performance and emissions
of modern engines. Apart from gas flow direction control, the amount of gas going in and
out of the engine cylinder is mainly controlled by intake and exhaust valve timings. The
study on the valve timing control technology started in 1880s. However, the progress
initially was very slow. The primary outcome was only achieved after 1985[17] and its
developing trend is shown in Figure 2.4.

12
Figure 2.4 Trend towards Increased Valve Timing Control [17]
The typical production valvetrain comprises of camshafts, valve springs, tappets and
poppet valves and is driven by a crankshaft through a transmission such as a belt, chain,
or gears. This design makes the intake and exhaust valve timings and opening durations
fixed to the crankshaft. Large amounts of work have been done to optimise cam profile
and valve opening and closing timings. It is also found that the fixed valve timings are no
longer adequate to deliver the improved engine performance and combustion efficiency
required over such a wide engine speed and load operating conditions. Thus, a range of
variable valve technologies has begun to appear in the market place. Variable Cam
Timing (VCT) has been considered as the most effective valve timing control technology
and has been widely implemented on a large number of modern gasoline engines.
With the engine VVA development, various innovative designs were invented. When
compared with conventional valves driven by cam, the camless electromagnetic or
electro-hydraulic valvetrains have more advantages in terms of valve timing flexibility.
However, the complexity and cost of their auxiliary control system and accessories is the
main obstacle in mass production. Mechanical VVA driven by cam is relatively small
and costly.
2.2.4 Direct Injection
Another thread of engine development is the advance in fuelling control technology. As
shown in Figure 2.5, in the gasoline engine development history, the revolution from
simple carburettors to electronically controlled port fuel injection started from the 1970s.

13
The second revolution was the invention of gasoline direct injection (GDI) and its
contribution was never less than the first in terms of the flexibly control of the fuel
supplied into the engine, although every step increased more complex control. GDI
engines can be operated in both stratified charge and homogeneous mixtures. In
particular, GDI is typically combined with turbocharging in the downsized engine to take
advantage of the charge cooling effects of direct fuel injection.
Figure 2.5 Trend towards Increased Fuelling Control [17]
In order to deliver finer fuel droplets and faster evaporation, the DI injector has evolved
from the single/double slit and swirl injectors to the multi-hole solenoid injector. In order
to improve the response of the injector, the piezo actuator is used in the pintle type
outward opening injector. Both side mounted and centrally mounted DI injectors are
used in production GDI engines. The latter arrangement is preferred for the stratified
charge operation [18]. In the case of two-stroke engines, GDI is necessary to avoid the
fuel short-circuiting [19].
GDI engines appeared on the market since 1990s and most of them operated with
stoichiometric combustion systems, which raised the cost of injection and control system
but did not provide satisfied fuel savings because their DI systems were wall-guided and
air-guided. [18] In late 2000s, the spray-guided stratified charge combustion systems
were introduced to the market by BMW and Mercedes-Benz. The fuel saving was
achieved by operating in globally lean conditions, while their after-treatment had to be

14
replace by lean NOx catalyst system to lower the high NOx emissions produced by the
lean combustion in the cylinder.
2.2.5 Engine Downsizing
In the last several years, engine downsizing has been actively researched and developed
as an effective means to improve the vehicle’s fuel economy. This is achieved by
operating the engine at higher load and more efficient regions and by reducing the
number of cylinders. However, aggressive engine downsizing of the current four-stroke
gasoline engine is limited by the knocking combustion and high peak cylinder pressure.
On the other hand, the two-stroke engine, due to its doubled firing frequency of four-
stroke engines, is capable of producing significantly greater torque and power output at
the same engine speed without the need for increased complexity of valvetrain. By means
of direct fuel injection and optimised combustion system, it is possible to realise the two-
stroke cycle operation in the poppet valved engine without the shortcomings of the
conventional ported two-stroke engines [20, 21]. Furthermore, with the development and
availability of Variable Valve Timing (VVT) and high efficiency boosting devices as
well as more flexible fuel injection equipment (FIE), a poppet valve two-stroke engine
can be boosted to produce superior low speed torque than the turbocharged 4-stroke
engine as demonstrated in a previous study [22]. However, to avoid the unstable SI
combustion and hence poor fuel economy at part-load of the two-stroke cycle operation,
4-stroke spark ignition combustion was retained and a sophisticated two/four stroke
switching system and control had to be included in the engine. As an alternative approach
to engine downsizing, boosted two-stroke operation in a poppet valve engine was
proposed and investigated in the current research.
2.2.6 Boosting Technologies
In order to maintain the full load torque and power performance, engine downsizing
requires engine boosting through a turbocharger or/and a supercharger [23]. The
supercharger is usually driven off of the engine crank shaft and it provides excellent
transient response [24-27]. The turbocharger comprises an exhaust gas turbine and a
compressor and is driven by the exhaust energy. Compared with supercharging,

15
turbocharging is more efficient but suffers from low speed lag. The Variable Geometry
Turbocharger (VGT) has the ability to improve the engine’s low speed response and is
widely used in high-speed diesel engine but its application to gasoline engines is
constrained by the engine’s higher exhaust gas temperature. Two-stage turbocharging
or compound supercharging and turbocharging can be used for further downsized four-
stroke gasoline engines [28].
In two-stroke operation, the intake pressure must always be higher than exhaust pressure
to realise the scavenging process. In this case, on the poppet valve two-stroke engine
(different from the ported two-stroke engines), the intake must be boosted. A single
turbocharger is inadequate for two-stroke engines as it cannot provide the intake air at
elevated pressure during the engine start-up and very low load operations when there is
little exhaust energy to drive the turbocharger. Therefore, an engine driven or preferably
electric supercharging or a combination of electric supercharging and turbocharging will
be needed.
An electric turbo compound or electrically assisted turbocharger [29, 30] could be a good
solution for two-stroke poppet valve engines. Base on the design of a turbocharger, an
electric motor is mounted in the middle of the shaft connecting the compressor and
turbine, as shown in Figure 2.6. With the electric turbo compound, the compressor can be
driven by the motor during the engine starting process. At some low load conditions
where the turbine energy is insufficient, the motor can supply extra energy and speed up
the compressor. At some high load conditions, where the turbine produces surplus energy,
the motor can work as a generator to absorb it.
Figure 2.6 Electric Turbo Compound [29, 30]

16
2.3 Controlled Auto-Ignition (CAI) Combustion
2.3.1 Principle of CAI and Previous Studies on Gasoline CAI
Combustion
A more advanced combustion process, referred as Homogeneous Charge Compression
Ignition (HCCI) or Controlled Auto-Ignition (CAI), different from conventional gasoline
spark ignition and diesel compression ignition has been widely studied in four-stroke
gasoline engines in the last 15 years because of its ability to simultaneously reduce
engine fuel consumption and NOx emissions [31].
CAI combustion is a process where a premixed mixture of fuel, air and recirculated gases
auto-ignites at multi points around the piston top dead centre when the charge
temperature reaches auto-ignition temperature. It typically features homogeneous charge,
auto ignition and low temperature combustion.
Diesel CI Gasoline SI CAI
Mixture: Non-premixed Premixed, homogeneous Premixed, homogeneous
Combustion: Diffusion Flame propagation Ignition at multi points
Emissions: High NOx and soot High NOx Low soot and NOx
Figure 2.7 Comparison of CI, SI and CAI Combustion Modes
As shown in Figure 2.7, in terms of mixture preparation, CAI is similar to gasoline SI
mode in which the premixed air and fuel mixture is formed in the intake port (PFI) or in
the cylinder (GDI) during the compression stroke. In comparison, the high pressure

17
diesel is injected into the combustion chamber just before the desired start of diesel CI
combustion.
From a combustion standpoint, diesel CI operation is dominated by diffusion combustion
and gasoline SI combustion is characterised by flame propagation from the spark to the
cylinder wall. However, CAI starts at the end of compression stroke and at some spots
where the mixture temperature has reached the auto-ignition temperature. Therefore, the
combustion takes place at multiple points in the cylinder and more ignition cores are
generated because of the rise in unburnt gas temperature caused by the compression from
the burnt gas to the unburnt gas. Compared to SI and CI, CAI combustion is more
uniform and faster.
The origin of CAI/HCCI combustion may be traced back to 1930s, when Russian
scientist Nikolai Semenov and his colleagues started studying a chemical-kinetic
controlled combustion process for IC engines, in order to overcome the limitations
imposed by the physical-dominating processes of SI and CI engines. In 1975, Semenov
and Gussak found that when the thermodynamic and chemical conditions of the entire
cylinder charge are similar to those of cool flames of hydrocarbon air mixtures, a more
uniform heat release process should be reached. This led to the first ‘Controlled
Combustion’, also named as ‘Avalanche Activated Combustion’ at that time [32]. In
1979, Onishi and Noguchi carried out systematic study on this combustion process in a
two-stroke engine. Onishi proposed to improve HC and CO emissions and fuel economy
at part loads by utilizing CAI combustion (at that time referred as ATAC-Active
Thermo-Atmosphere Combustion) in the two-stroke engine [33]. Experimental results
showed very low cycle to cycle variations when engine running in ATAC mode. Through
optical study, it was seen there was no visible flame front throughout the combustion
chamber. Then, Onishi summarized ATAC as: (1) Heating effect by hot residuals; (2)
homogeneous mixing of residuals and fresh charge; (3) Limited operating conditions of
ATAC mode. Noguchi analysed the middle product of CAI combustion in a two-stroke
engine [34]. Results showed there were massive CH2O, HO2 and O species produced
before auto-ignition process taking place. These intermediate products were recognized
as low temperature combustion products of hydrocarbons. After auto-ignition, there were
a lot of CH, H and OH produced, which indicates the intensive heat release process of
high temperature. This phenomenon is totally different from conventional gasoline SI
combustion process.

18
In 1983 Najt and Foster studied the autoignition combustion mechanism in a four-stroke
single cylinder engine using heating [35]. In 1979, Thring carried out the premixed
compression ignition combustion of diesel and introduce the definition of HCCI [36].
In 1990s, the strength and depth of research on CAI were greatly enhanced. In 1992,
Stockinger et al. showed for the first time that a four-cylinder gasoline engine could be
operated with auto-ignition by means of higher compression ratio and intake heating.
Although its speed and load range was very limited, the part load brake efficiency was
increased by 14~34%. [37] In the late 1990s, Olsson et al demonstrated CAI combustion
on a modified 12-litre six-cylinder diesel engine over a much wider speed and load range
by combined use of isooctane and heptane, closed loop control, turbocharging, higher
compression ratio and intake heating.[38]
The approaches to achieve CAI on gasoline engines can be summarised as follows:
1) Direct intake heating
Direct intake heating is the most obvious approach to achieve auto-ignition in gasoline
engines. Through heating the intake charge the initial temperature of the charge is
increased and thus the in-cylinder temperature history is varied without significant
change in cylinder pressure. Najt and Thring are the earliest researchers adopting intake
heating to achieve CAI combustion. In their work, the intake charge was heated up to
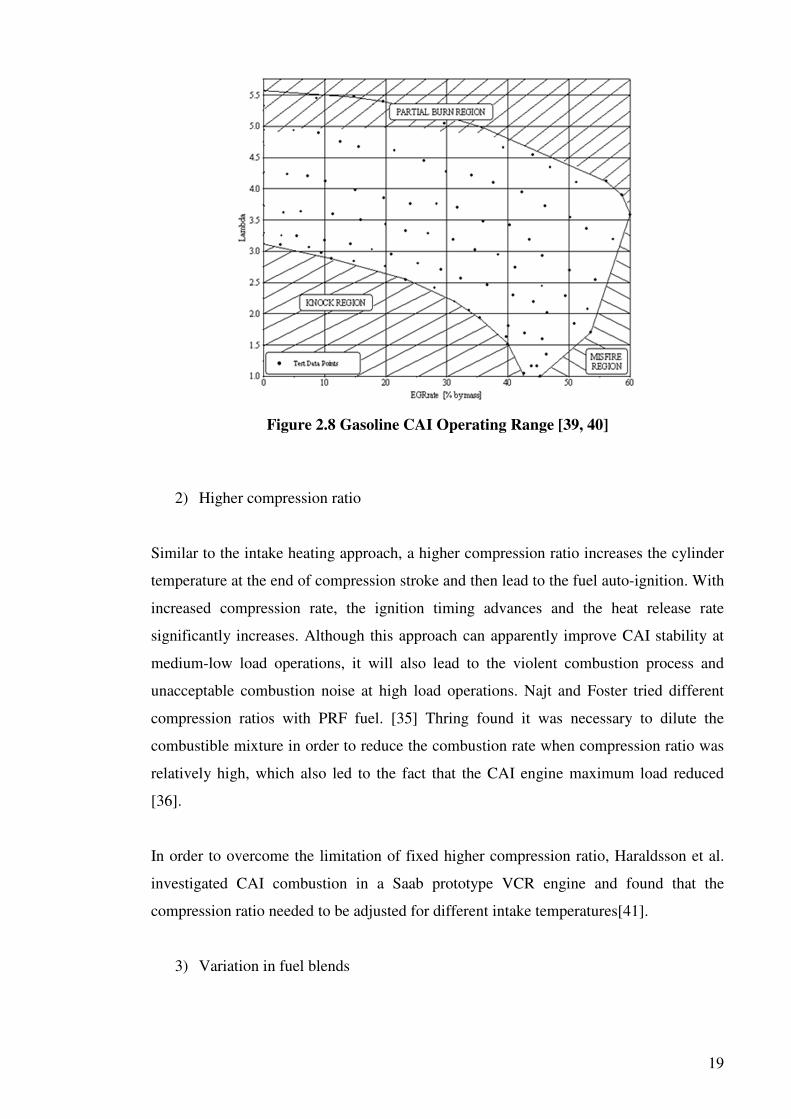
300 . [3℃ 5, 36] Oakley et al. [39, 40] also carried out CAI study on a four-stroke
gasoline engine with throttle removed and 320 intake temperature. ℃ Results showed the
mixture could reach auto-ignition temperature at the end of compression stroke with the
aid of the heat from external EGR. Figure 2.8 is the CAI operating range over the lambda
and EGR rate map. Knocking, misfiring and partially burning boundary were obtained as
well. Through this approach, NOx emissions were reduced by 97% at most of the
operating conditions and fuel consumption was reduced by 20% at maximum load
condition. However, the drawback is the high power consumption and large intake
heating system, which brought high heat inertia and reduced the engine response.
Therefore, this approach is not applicable for the production engine.
19
Figure 2.8 Gasoline CAI Operating Range [39, 40]
2) Higher compression ratio
Similar to the intake heating approach, a higher compression ratio increases the cylinder
temperature at the end of compression stroke and then lead to the fuel auto-ignition. With
increased compression rate, the ignition timing advances and the heat release rate
significantly increases. Although this approach can apparently improve CAI stability at
medium-low load operations, it will also lead to the violent combustion process and
unacceptable combustion noise at high load operations. Najt and Foster tried different
compression ratios with PRF fuel. [35] Thring found it was necessary to dilute the
combustible mixture in order to reduce the combustion rate when compression ratio was
relatively high, which also led to the fact that the CAI engine maximum load reduced
[36].
In order to overcome the limitation of fixed higher compression ratio, Haraldsson et al.
investigated CAI combustion in a Saab prototype VCR engine and found that the
compression ratio needed to be adjusted for different intake temperatures[41].
3) Variation in fuel blends

20
It is also a good solution to achieve CAI combustion through varying fuel properties to
suit CAI combustion at different load conditions. Research results [38, 42-44] have
shown the composition and properties of the fuel have strong effects on the CAI
combustion process, and thus can improve the operating range, emissions and
combustion noise of CAI engines. However, this method requires some unconventional
fuel, such as ethanol or DME, to be blended with gasoline in the cylinder. Therefore, in
practice, it is limited by the current lack of infrastructure to supply the required fuels as
well as the complexity and cost of a dual fuel system.
4) Exhaust gas recirculation (EGR)
From the path of the recirculated exhaust gas, EGR can be classified as External EGR
(eEGR) and Internal EGR (iEGR).
External EGR is an approach to recirculate exhaust gases on the engine by introducing it
from exhaust pipe into intake pipe to have it re-enter the cylinder while mixing with fresh
air. Compared to iEGR, eEGR temperature is much lower as the exhaust gas has flown
through a long pipe out of engine, plus the effect of inter-cooling. As a result, low
temperature exhaust gasses mixed with fresh charge is introduced into the cylinder. It is
hard for the fresh charge to reach auto-ignition temperature simply by the compression
from piston. Therefore, on the CAI engine, eEGR has to be used with other approaches,
such as intake heating [39, 40] and iEGR [45].
Internal EGR is the approach of recirculating exhaust gases by retaining it in the cylinder
instead of displacing it out of the engine. It is necessary to work with Variable Valve
Actuation (VVA), which is capable of flexibly adjusting the amount of recirculated
exhaust gas and intake air by varying the valve opening timing and duration. Generally
speaking, iEGR can be classified as exhaust gas trapping and exhaust gas rebreathing
according to the valve control strategy and the way to retain exhaust gas internally.
1. Exhaust gas rebreathing:
The exhaust gas is recirculated by the means of drawing the exhaust gas back into
the cylinder. Usually it is accomplished by the following two methods.

21
� Opening the intake valve in the exhaust stroke to allow a portion of exhaust
gas flow into intake port so it can be sucked back into cylinder in the
following intake stroke. (It is rarely used because of the plastic intake
manifold and port fuel injection (PFI) on the gasoline engine.)
� Opening the exhaust valve in the intake stroke to suck a porting of exhaust
gas back into cylinder.[46-48]
This strategy requires the valvetrain system to provide much more complex valve lift
profiles, typically either the intake or exhaust valve needs to open twice with one
engine cycle or remain open within the gas-exchange period. Firstly this strategy led
to the increase in the difficulty of the engine control. Secondly, for double-open
valve case, the requirement of valvetrain response is doubled. For the extended valve
opening case, there is a risk of valve-piston contact. Furthermore, the cylinder-to-
cylinder variation of air and rebreathed exhaust gas increases in the multi-cylinder
engine.
2. Exhaust gas trapping:
Trapping exhaust gas in the cylinder by earlier closing of the exhaust valve is also a
way to internally recirculate exhaust gas. In this case, the intake valve open timing
should be retarded in order to minimize the pumping loss during the gas exchange
process. By this way, instead of normal positive valve overlap, a negative valve
overlap (NVO) is formed to retain the hot burnt gas in the cylinder, which is used as
hot source to heat the fresh charge in next cycle. With the aid of heat from residual
gas, the air fuel mixture could auto-ignite around the end of compression stroke.
Hence, this approach is also known as NVO or residual gas trapping strategy. It can
be realised by the conventional cam driven valvetrain with a modified cam profile,
where the maximum lift is lower and opening duration is shorter than that of original
valve profiles, as shown in Figure 2.9.

22
Figure 2.9 Valve Lift Profiles for CAI Operation [49]
It was the first time that CAI was achieved by means of exhaust gas trapping via NVO by
Willand [49]. By reducing the valve opening duration, the exhaust gas that was trapped
in the cylinder in the exhaust stroke was increased to 40%, which initiated CAI
combustion in the next cycle. Later on, Kontarakis demonstrated stable CAI combustion
on a single cylinder four-stroke unthrottled gasoline engine in the speed range from 1300
rpm to 2000rpm, IMEP range from 2.5bar to 3.6bar and lambda range from 0.95 to 1.1.
[50] It was found that fuel consumption can be improved but lambda range for stable
CAI combustion was relatively narrow.
Systematic research of CAI combustion with exhaust gas trapping strategy has been
carried out at Brunel since the late 1990s. The effect of residual gas on CAI combustion
and engine emissions was analysed and summarised as heating, dilution, heat capacity
and chemical effects [51]. The results showed that the heating effect of residual gas had
the largest effect in promoting CAI which was slightly delayed by the increased heat
capacity. The combustion duration also increased under the combined effect of increased
heat capacity and dilution. The dilution effect reduced the peak pressure rising rate,
particularly when residual gas fraction was over 40%. In 2001, Li, et al demonstrated the
CAI operation on Ford 1.7L Zetec-SE 16V 4-cylinder engine through the NVO method
using the variable cam timing (VCT) and lower lift camshafts. The maximum BMEP
achieved with CAI operation was 4bar. At part load, BSFC was reduced by up to 30%
and NOx reduced up to 99%, compared to that with SI operation [52]. However, the CAI
range was limited.
Negative Valve Overlap

23
Apart from what was previously mentioned, there were a few other approaches to
achieve CAI combustion, such as pulsed flame jet [53] and laser induction [54]. However,
these can be demonstrated only in a laboratory setting and is not feasible in production at
this stage.
In summary, exhaust gas trapping has been considered as the most feasible approach to
product gasoline CAI engine. [55] In the meantime, this approach can be used under
stoichiometric conditions so that it is compatible with a 3-way catalyst which is a mature,
highly efficient catalytic after-treatment widely used on modern gasoline vehicles.
Nevertheless, internal EGR achieved via VVA is a relatively simple and more practical
approach to CAI in gasoline engines, as it can be adapted for not only steady operating
conditions but also transient operating conditions.
2.3.2 Advantages and Challenges of CAI combustion in four-stroke
gasoline engines
When compared with SI combustion operation, the CAI combustion mode in a gasoline
engine has following advantages [56]:
1) High thermodynamic efficiency:
As CAI takes place at multiple points in the combustion chamber, the heat release
rate is higher, which is closer to an ideal constant volume heat release process.
Secondly, the CAI combustion temperature is lower as the combustion takes place
without significant flame propagation. Therefore, the thermodynamic efficiency of
CAI engines can be as similar to that of diesel engines.
2) Low fuel consumption:
As the load of CAI engines are no longer controlled by throttle, it minimises the
pumping losses at part load conditions and is capable of decreasing fuel consumption
by 15% to 20%, compared to a conventional gasoline engine.
3) Low cyclic variation:

24
The ignition process of SI combustion is more sensitive to air flow and fuel
distribution in the combustion chamber. Cycle to cycle flow variation is known to
cause SI combustion to vary from cycle to cycle. When the thermal conditions are
homogeneous during CAI combustion, the ignition starts at multiple sites and leads to
rapid heat release process that is less prone to flow structure or local turbulence.
4) Low emissions:
The NOx emission in CAI combustion is typically more than 90% lower than the SI
combustion, due to low temperature heat release reactions of diluted mixture.
The main challenges facing gasoline CAI combustion include [57-60]:
1) Ignition timing and combustion phase control
On the conventional gasoline engine, ignition timing is controlled by spark timing
and on diesel engine ignition timing is controlled by fuel injection timing. However,
on CAI engine, it is much more difficult to control the ignition timing as cylinder
temperature, pressure, and composition of the mixture all indirectly control auto-
ignition timing and combustion process. So ignition timing control is one of the
biggest challenges of CAI engines. Also, the change of engine load output requires
altering fuel injection quantity and fuel concentration in the cylinder correspondingly.
In order to keep the proper ignition timing, the adjustment of cylinder temperature
history is necessary. On the other hand, the variation in engine speed changes the
chemical reaction accumulated time for the mixture to auto-ignite, resulting in the
change in ignition phase corresponding to crank angle. This also must be
compensated by changing cylinder temperature history. Christensen [58] also
pointed out that it was necessary to take many effects into account for CAI ignition
timing control, such as compression ratio, intake temperature, intake manifold
pressure, fuel property, air fuel ratio, EGR rate, engine speed, and coolant
temperature. In case of GDI engine, injection timing should also be considered for
ignition timing control. In case of CAI engine equipped with VVA system, it is also
necessary to have more precise valve events collaborative adjustment [61-64].

25
2) CAI operating range extension
As stated previously, CAI combustion is a premixed mixture compression ignition
process and combustion takes place simultaneously throughout combustion chamber,
which leads to a more rapid combustion rate compared to that of SI and CI
combustion. Knock is more likely to occur at high load operating conditions due to
the increased CAI combustion rate. The higher cylinder pressure rise rate can lead to
higher mechanical load and heat load, which can cause engine damage in the worst
cases. Meanwhile, the engine noise and NOx emissions reach unacceptable levels.
On the other hand, as CAI achieved by internal EGR requires trapping a large
amount of exhaust gas in the cylinder, the engine high load output is limited. As a
result, to extend the high load output of CAI engines is another challenge. [36, 42, 65]
When burning high octane fuel at low load and speed, lower combustion reaction
rates occur because of the presence of a high concentration of residual gasses. This
leads to low charge temperature and unstable ignition conditions. This is the cause of
insufficient combustion in the cylinder and the formation of unburnt hydrocarbon.
Therefore, misfire often occurs at low load and idle operations in CAI engines. The
excessively rich mixture or high EGR rates form the misfire limit of CAI. [36]
Li J. [52] found the upper load boundary of CAI engine operating range could be
split into knock limit and gas-exchange limit, which is caused by the use of low lift
cam to trap residual gas in the cylinder. At high speeds and high loads, there was
insufficient fresh charge going into the cylinder during gas-exchange process.
Furthermore, at low loads, too high of residual gas fraction and too low of residual
temperature led to the fact that mixture cannot reach auto-ignition conditions and
caused misfire at low load CAI operating boundary.
In summary, gasoline CAI engines suffer from too narrow of an operating range and
cannot meet the demand of whole vehicle driving cycles. This is another key issue
facing mass production of CAI technology.
3) Cold start

26
In the internal EGR approach to CAI combustion, the combustible mixture needs to
be heated by the exhaust gas from previous cycles. At engine cold start, without
heating from exhaust gas, the mixture temperature is too low during the compression
stroke to initiate auto-ignition. It is very difficult to start engine, especially when the
combustion chamber surface is cold.
Due to the presence of the above issues, CAI technology has not been implemented on
production engines. Therefore, in order to advance the process of CAI technology mass
production, CAI researchers must raise practical solutions to these challenges.
2.3.3 Two-stroke CAI
Running CAI in two-stroke cycles is not a new idea, although most research on CAI
combustion has been carried out on the four-stroke engine in the last decade [31, 56] due
to the dominance of four-stroke engines.
In order to overcome the partial burn and misfire of spark ignited mixture at part load in
the conventional two-stroke engine [11], CAI combustion was first achieved and applied
to some two-stroke engines in the late 1970s [33]. In the port scavenging two-stroke
engine, its poor scavenging was utilised to obtain CAI combustion by means of a large
quantity of hot residual gases [34]. Later on, Durret tried to apply CAI combustion to a
DI two-stroke engine while the residual gas was trapped using a butterfly exhaust
throttling valve [66] and a transfer port throttling [67]. Then the prototype two-stroke
CAI ported DI engine was built and showed significant reduction in NOx emissions and
fuel consumption compared to its four-stroke counterpart of equivalent power output [68].
In parallel, CAI operation was demonstrated on a two-stroke ported motorcycle engine
by means of residual gas trapping through a variable exhaust port timing and exhaust
throttling [69]. Then its first industrial application was in Japan in 1996 and in Europe in
1998 [31]. In addition, research was carried out on CAI with different fuels in two-stroke
ported engines [70, 71].
It was not until the 2/4SIGHT concept (two-stroke / four-stroke switchable engine) in
2003 that CAI was achieved on a poppet valve engine running two-stroke cycle but

27
within a relatively limited operating range [72, 73, and 22]. Apart from this work, very
little studies were carried out on two-stroke CAI in poppet valve engines. The advantages
of poppet valve two-stroke engine have been stated in previous sections. In 2007, Kim
compared the four-stroke CAI and two-stroke CAI operation in a poppet valve engine
equipped with electromagnetic valvetrain [74]. Although the results showed CAI
operating range was extended in two-stroke cycles, two-stroke CAI didn’t exhibit
advantage compared to the four-stroke exhaust gas rebreathing CAI operation. However,
detailed investigations and analysis were not carried out.
2.4 Summary
This chapter briefly described the development history of vehicles and engines. From the
developing trend of the emission legislations, it can be seen that there has been the
demand for the automotive engine to output higher power but lower emissions while
consuming less fuel. It is this motivation that is pushing the evolution of the engine
technologies.
The invention and development of new technologies will promote the progress of other
relevant technology. This chapter highlighted some internal combustion technologies that
are relevant to this work, including two-stroke cycles, four-stroke cycles, variable valve
actuation, direct injection, engine downsizing and boosting technologies.
In order to break through the efficiency and emission limits of conventional gasoline and
diesel engines, a new combustion mode of CAI was introduced. Literature survey of the
research on CAI combustion highlighted its characteristics and advantages, the approach
to achieve CAI in the engine, the challenges of implementing CAI in product engines and
the history of the research of CAI on two-stroke and four-stroke engines. In particular, it
has identified that systematic studies on the operation of a two-stroke direct injection
engine with inlet and exhaust valves should be carried out to explore the synergy of such
an engine design and the autoignition combustion process for maximum benefit in fuel
economy and emission reductions.

28
Chapter 3
Experimental Facilities

29
Chapter 3 Experimental Setup and Test Facilities
3.1 Introduction
This chapter describes the experimental setup and test facilities used to obtain all
measurements and data. The experimental setup in this work composes of a single
cylinder engine, the engine testbed, supercharging facility, measurement devices and a
data acquisition system. The schematic of complete setup is shown in Figure 3.1.
Figure 3.1 Schematic of Experimental Setup
3.2 Camless two/four-stroke switchable DI engine and the valve train
system
3.2.1 Single Cylinder Engine
A single cylinder engine was designed and commissioned to operate in either four-stroke
or two-stroke cycles through an electrohydraulic valvetrain system. The engine

30
comprises of a standard Ricardo single cylinder research engine crankcase and a special
designed cylinder head to accommodate 4 sets of electrohydraulic valve actuation
devices. The camless two/four-stroke switchable DI engine is shown in Figure 3.2, of
which the specifications are shown in Table 3.1. The engine is mounted on a seismic
block to damp out the first order vibration and driven by an AC motor so that both
motored and fired operation could be performed. The coolant and oil are supplied by
fully automated coolant and oil conditioning circuits.
Figure 3.2 Camless Two/Four-stroke Switchable DI Engine
Table 3.1Engine Specifications
Bore × Stroke 81.6mm×66.94mm
Swept volume 0.35L
Compression ratio 11.78:1
Combustion chamber Pent roof / four valves
Valve train Electro-hydraulic actuation
Fuel injection Side Direct injection
Max speed 6500 rpm
Max peak cylinder pressure 120 bar
Intake port Vertical
Cylinder head
Exhaust port
Top entry intake port
Electro-hydraulic
valve actuator
Intake plenum
DI injector

31
As the engine is designed for two-stroke operation, two individual vertical intake ports,
as shown in Figure 3.3, are adopted in the cylinder head design to produce reverse tumble
flow[22, 75]. This forces air to move in an anti-clock wise pattern away from the exhaust
valves and hence provides higher scavenging efficiency. The scavenging process and its
related air short-circuiting issue will be discussed in detail in Chapter 4.
Figure 3.3 Vertical Intake Port Design
Figure 3.4 shows the combustion chamber and piston crown design. In order to increase
the exhaust flow at boosted conditions and improve gas exchange efficiency, the two
exhaust ports are designed larger than intake ports. The injector is located below the two
intake valves. In order to allow intake and exhaust valves to open at 3.5mm lift at TDC
for extreme operating strategies while keeping the high compression ratio at 11.78, four
valve pockets were designed on the piston crown.
Top entry intake port Spark plug

32
Figure 3.4 Combustion Chamber and Piston Crown
3.2.2 Electrohydraulic Valvetrain System
An electro hydraulic valvetrain system is mounted on the cylinder head to enable
independent control of the valve timings and lifts. Each valve is attached to an
electrohydraulic actuator which allows valve motion to vary with engine speed to meet
set limits at every speed and position. The valve is screwed in a plunger in the actuator. A
fast response Moog servo valve is mounted on the side of the actuator and switches the
high pressure hydraulic oil circuit. The hydraulic oil pushes the plunger up and down in
the cylinder of the actuator. The maximum allowable peak valve velocity is about 4.5 m/s.
The variable valve lift range is from 0 to 9.5mm. The valve lift is measured by a Linear
Variable Differential Transformer (LVDT) Positional feed-back from the plunger and
engine valve assembly is continually provided by the LDTV, which allows actual profiles
to be continually monitored and corrected from cycle-to-cycle, to ensure accuracy and
repeatability. The valve lift profile during the valve train test in four-stroke operation at
engine speed from 1000rpm to 6500rpm is shown in Figure 3.6.
Intake valve pocket Spark plug Injector

33
Figure 3.5 Electrohydraulic Valve Actuator and its Cross Section Drawing
Figure 3.6 Valve Lift Profiles in Four-stroke Operation
The high-pressure oil is supplied by a hydraulic pump unit shown in Figure 3.7. It
comprises of a variable delivery piston hydraulic pump rated at 18.5KW and 34l/min
delivery at 280bar. It is equipped with 3 micron on-line and 10 micron off-line filtration
system, using ISO 32 hydraulic oil from a 225l oil tank supplied by DGB Hydraulics Ltd.
It includes a 10l bladder accumulator to maintain pressure during a power cut out and a
load control valve powered by UPS. Feeds and drain manifolds are mounted on the
engine with oil pressure sensor incorporated into feed manifold.
0
1
2
3
4
5
6
7
8
9
10
0 60 120 180 240 300 360 420 480 540 600 660 720
Crank Angle [deg]
Lif
t [m
m]
Inlet 1000 rpmExhaust 1000 rpmInlet 1500 rpmExhaust 1500 rpmInlet 2000 rpmExhaust 2000 rpmInlet 2500 rpmExhaust 2500 rpmInlet 3000 rpmExhaust 3000 rpmInlet 3500 rpmExhaust 3500 rpmInlet 4000 rpmExhaust 4000 rpmInlet 4500 rpmExhaust 4500 rpmInlet 5000 rpmExhaust 5000 rpmInlet 5500 rpmExhaust 5500 rpmInlet 6000 rpmExhaust 6000 rpmInlet 6500 rpmExhaust 6500 rpm
IntakeExhaust
Hydraulic actuator High speed solenoid valve LVDT sensor Plunger

34
Figure 3.7 Hydraulic Pump Unit
Each valve actuator is controlled by an individual control circuit. So there are four sets of
control circuits in the valve control unit (VCU) as shown in Figure 3.8. The hydraulic
valve train does not have a physical cam ramp to control opening and closing events. In
order to protect the valve and valve seat, a ‘soft-landing’ strategy is incorporated in the
valve control program, which also limits seating velocity at 0.32mm lift to the velocity of
0.009mm/deg CA which is equivalent to 0.054 m/s @ 1000rpm, 0.243 m/s @4500rpm
and 0.351 m/s @6500rpm.
Figure 3.8 Valve Control Unit
Driven motor High pressure pump Oil tank Control Unit
4 individual control circuits

35
3.2.3 Fuelling System
The gasoline fuel supply and injection system comprises of a direct gasoline injector
installed on the side of combustion chamber below the two intake valves, a low-pressure
fuel pump, a high-pressure fuel pump, a low pressure regulator, a high pressure relief
valve, a common rail and a fuel heat exchanger, as shown schematically in Figure 3.9.
Fuel is supplied from a 25 litre tank mounted on the test cell wall and pressurised by a
low-pressure pump to 3.5bar and then pumped to 100bar by a high pressure pump before
flowing into the common rail. When ethanol blended fuel is used, it is first pre-mixed and
then poured into the tank. The low-pressure pump keeps circulating the fuel in the tank to
prevent separation of the fuel blends. The high-pressure pump is electrically driven by a
fixed speed AC electric motor and the fuel pressure is monitored by the ECU using a fuel
rail pressure sensor and regulated by a high-pressure relief valve, set at 100bar. A heat
exchanger is used to remove the excess heat from the pressurised-fuel return in order to
maintain a constant fuel temperature. An instantaneous fuel flow meter is installed
between the high pressure fuel pump and injector for the measurement of fuel flow rate.
Figure 3.9 Fuel Supply Circuit Diagram

36
The fuel is injected by a Denso GDI injector mounted under the intake port at an
injection pressure of 100bar. The GDI injector is the second generation solenoid GDI
injector with a double slit nozzle and is used on Lexus IS series cars since 2007. The
injector and its spray pattern are shown in Figure 3.10 [76]. This is designed to form a
double thin fan shape spray in the cylinder, as shown in Figure 3.11. The injection mass
flow rate was calibrated at the injector pressure of 120bar and 150bar by engine supplier,
as shown in Figure 3.12.
Figure 3.10 Double Slit Solenoid GDI Injector and its Spray Pattern
Figure 3.11 Double-fan Spray in Combustion Chamber
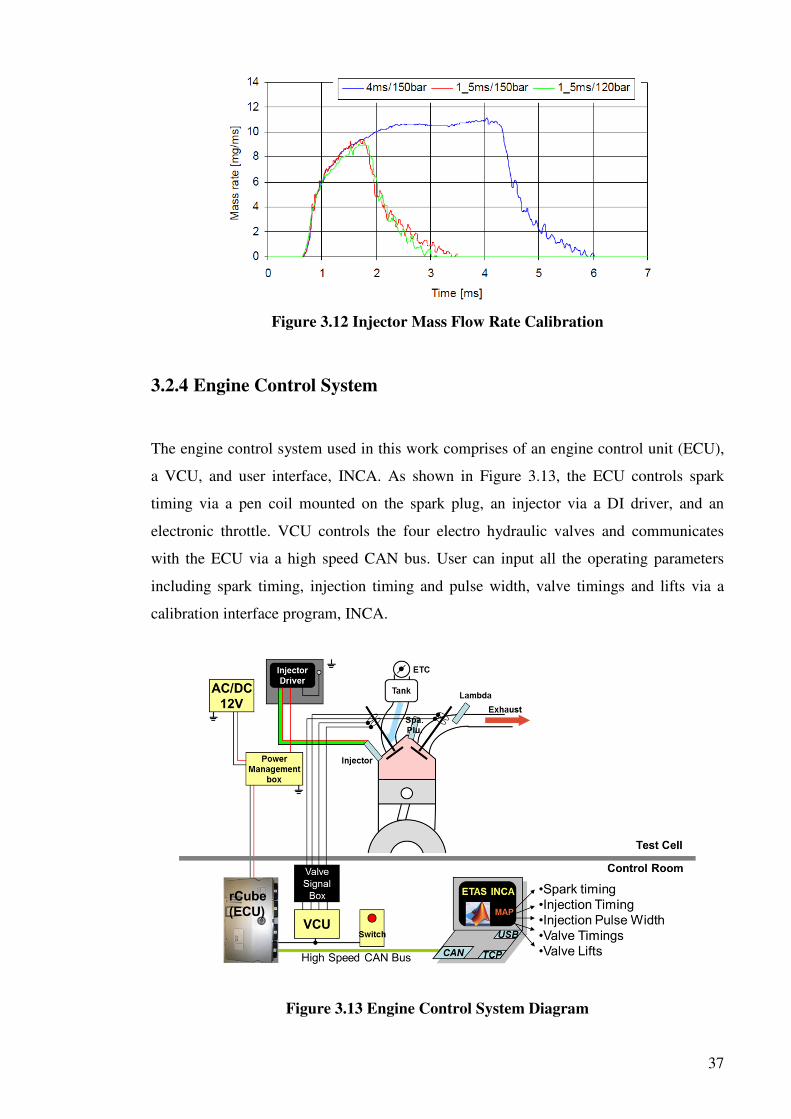
37
Figure 3.12 Injector Mass Flow Rate Calibration
3.2.4 Engine Control System
The engine control system used in this work comprises of an engine control unit (ECU),
a VCU, and user interface, INCA. As shown in Figure 3.13, the ECU controls spark
timing via a pen coil mounted on the spark plug, an injector via a DI driver, and an
electronic throttle. VCU controls the four electro hydraulic valves and communicates
with the ECU via a high speed CAN bus. User can input all the operating parameters
including spark timing, injection timing and pulse width, valve timings and lifts via a
calibration interface program, INCA.
Figure 3.13 Engine Control System Diagram

38
Figure 3.14 shows the INCA interface where the user can monitor engine operating
conditions and input engine control parameters. In the ECU, there are 4 sets of engine
control parameter maps, which are for four-stroke SI, four-stroke CAI, two-stroke SI and
two-stroke CAI operations. All sets of the maps are switchable when engine is running
for mode switching tests. The two intake and two exhaust valves can be operated
individually, in which more complex valve events can be performed and more advanced
engine operating mode can be achieved. For example, for exhaust gas rebreathing CAI
operation, one exhaust valve can open and close as normal and another exhaust valve can
open during the intake stroke, so that the exhaust gas can be sucked back into cylinder for
initiating CAI combustion in the next cycle.
Figure 3.14 INCA Interface
The most common valve profiles for two-stroke SI and CAI operation are illustrated in
Figure 3.15. In two-stroke SI operation, in order to make use of the momentum of the
fresh charge and achieve the post-scavenging, the exhaust valve closes after the intake
valve close. In two-stroke CAI operation, in order to trap more burnt gas in the cylinder,
both the intake and exhaust valve durations are shortened. The amount of the residual gas
is controlled principally by the exhaust valve closure and varied depending on the
requirement of the operation conditions. In two-stroke operations, fuel injection is timed

39
to take place immediately after the valve closure in order to maximize the period of
evaporation and atomization.
Figure 3.15 Sketch of Valve Profiles for Two-stroke SI and CAI Operation
3.3 Dynamometer System
The dyno system used in this work is supplied by CP engineering and comprises an AC
motor, an inverter, a coolant and oil conditioning circuit and a remote control PC with an
operating software. The AC motor shown in Figure 3.16 is rated at 40KW power and
6000rpm maximum speed capable of motoring and regeneration modes. A coolant and
oil conditioning circuit regulates coolant temperature and oil pressure and temperature.
The oil pump was employed to supply pressurised oil of 3.5bar to the engine.
Figure 3.16 AC Dynamometer and Inverter
AC Motor Propshaft
ABB Inverter
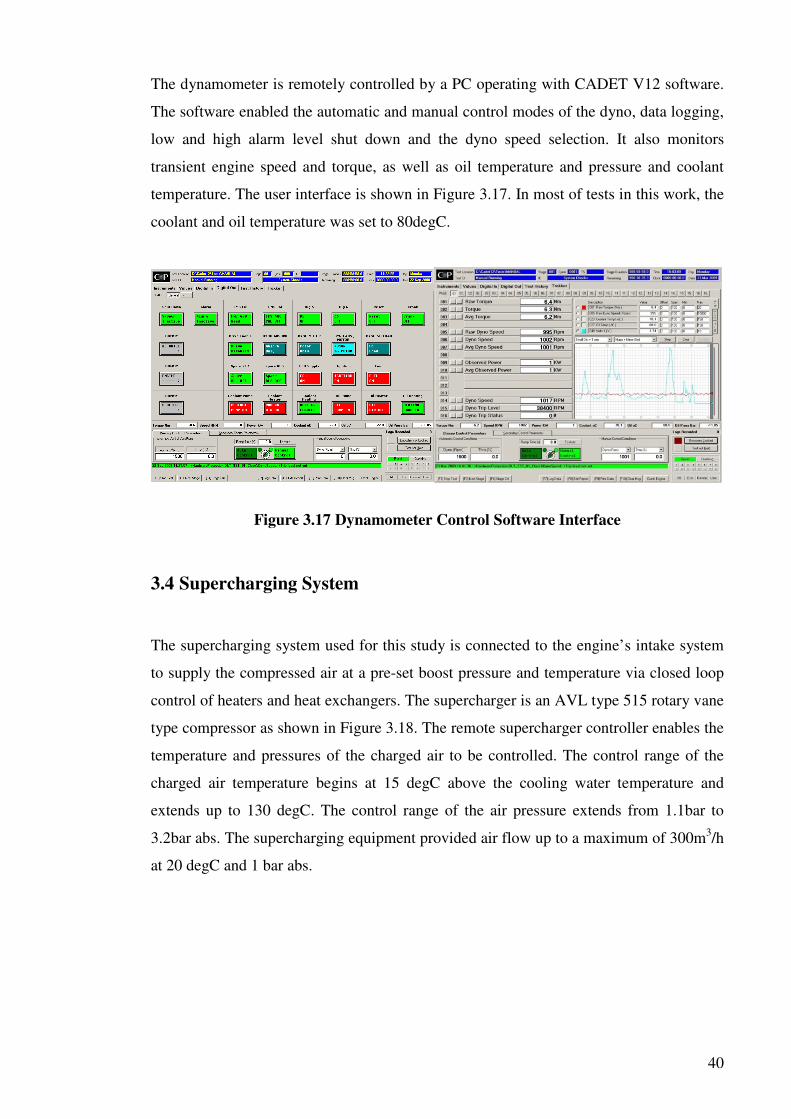
40
The dynamometer is remotely controlled by a PC operating with CADET V12 software.
The software enabled the automatic and manual control modes of the dyno, data logging,
low and high alarm level shut down and the dyno speed selection. It also monitors
transient engine speed and torque, as well as oil temperature and pressure and coolant
temperature. The user interface is shown in Figure 3.17. In most of tests in this work, the
coolant and oil temperature was set to 80degC.
Figure 3.17 Dynamometer Control Software Interface
3.4 Supercharging System
The supercharging system used for this study is connected to the engine’s intake system
to supply the compressed air at a pre-set boost pressure and temperature via closed loop
control of heaters and heat exchangers. The supercharger is an AVL type 515 rotary vane
type compressor as shown in Figure 3.18. The remote supercharger controller enables the
temperature and pressures of the charged air to be controlled. The control range of the
charged air temperature begins at 15 degC above the cooling water temperature and
extends up to 130 degC. The control range of the air pressure extends from 1.1bar to
3.2bar abs. The supercharging equipment provided air flow up to a maximum of 300m3/h
at 20 degC and 1 bar abs.

41
Figure 3.18 AVL Supercharger and its Remote Controller
3.5 Measurement System
The measurement system includes in-cylinder pressure measurement, instantaneous
intake and exhaust pressure, steady temperature measurement, air and fuel flow rate
measurement, linear lambda measurement and exhaust emissions analysis, as shown in
Figure 3.1.
a) In-cylinder pressure transducer and charge amplifier
The instantaneous in-cylinder pressure was measured by a water cooled piezoelectric
pressure transducer (Kistler 6061B) with a measurement range of 0-250 bar gauge and
sensitivity of -25 PC/bar installed on the cylinder head. The sensor outputs a charge
signal which is converted into a voltage signal by a charge amplifier (Kistler Type 5011),
as shown in Figure 3.19.
Figure 3.19 Kistler 6061B Pressure Transducer and 5011A Charge Amplifier

42
b) Intake and Exhaust Pressure and Temperature
Both the instantaneous intake and exhaust pressures were measured by two Kistler piezo
resistive pressure transducers installed in the intake runner and exhaust runner
respectively, as shown in Figure 3.20. The intake pressure transducer, type 4007BA20F,
can measure up to 20bar absolute pressure and is capable of continuous high-temperature
operation up to 200 degC. It is connected to a Kistler amplifier, Type 4618AO with
pressure and temperature output. The exhaust pressure transducer, type 4007BA5F, can
measure absolute pressure up to 5bar. The exhaust pressure transducer is mounted in a
cooling adaptor, type 7525A2, to prevent the damage from the high exhaust-gas
temperature.
Figure 3.20 Kistler Type 4007B Piezo-resistive Pressure Transducer and its
Installation for Instantaneous Intake and Exhaust Pressure Measurement
Intake and exhaust temperature are measured by a standard K- type thermocouples at
intake manifold and exhaust port.
c) Fuel flow meter
The fuel flow rate is measured by a Coriolis mass flow meter, type PROMASS 83A,
supplied by Endress Hauser at high pressure line before common rail. The flow meter

43
shown in Figure 3.21 must be installed at the lowest level of the whole fuelling system to
avoid the bubbles coming into it and affect the reading. It outputs frequency and current
signals. In this work the current signal is converted into a voltage signal and then logged
by the data acquisition system.
Figure 3.21 Coriolis Mass Flow Meter
d) Intake air flow meter
A laminar air flow meter is installed in the engine’s intake system to measure the intake
mass flow rate. The air flow meter shown in Figure 3.22, type HFM-200 LFE, is supplied
by Teledyne Hastings Instruments and Chell Instruments with the measuring range of 0-
1500 standard litre per minute and measuring uncertainty of 0.73%.
Figure 3.22 Laminar Air Flow Meter

44
e) Lambda sensor
The air fuel ratio for this study is measured by a wide band lambda sensor (Bosch UEGO
LSU4.0) in the exhaust pipe.
f) Gaseous emission analyser
The exhaust emissions are analysed by a Horiba 7170DEGR gas analyser system which
sampled the exhaust gases from the exhaust manifold. The concentration of CO, CO2, O2,
THC and NOx in the exhaust gas are analysed and outputted via LAN port. The readings
are logged on cycle basis and averaged over 100 consecutive engine cycles.
It is worth pointing out that the C, H, O atom number ratio should be reset in AFR set
menu when different fuel is used. Table 3.2 and Table 3.3 show the fuel property of E15
and E85 respectively and the calculations used for working out C, H, O atom number
ratio.
Table 3.2 E15 Fuel Properties
Fuel Ethanol Gasoline E15
Volume [ml] 15 85 98.70
Density [g/ml] 0.789 0.72 0.74
Weight [g] 11.835 61.2 73.035
C H O C H O C H O
Atom number 2 6 1 8.26 15.5 0 6.22 12.41 0.3
Mole number 0.257 0.534 0.79
LHV [kJ/g] 26.9 43 40.39
A/F 8.9955 14.603 13.69

45
Table 3.3 E85 Fuel Properties
Fuel Ethanol Gasoline E85
Volume [ml] 85 15 99.83
Density [g/ml] 0.789 0.72 0.78
Weight [g] 67.065 10.8 77.865
C H O C H O C H O
Atom number 2 6 1 8.26 15.5 0 2.38 6.577 0.9
Mole number 1.4579 0.0942 1.55
LHV [kJ/g] 26.9 43 29.133
A/F 8.996 14.60 9.77
3.6 Data Acquisition System
All the experimental test data is analysed and logged by an in-house data acquisition
system, which is developed at Brunel University by the author.
a) Hardware
The hardware connection is shown in Figure 3.23. A high speed A/D card and a multi-
serial card are connected to a PC via USB port. The Horiba Emission analyser is
connected to the same PC via LAN port and its communication protocol is TCP and UDP.
The ECU is connected to the PC via PCMCIA port. Therefore, the data logged from
every connection can be synchronised on the cycle basis in the software.
The high speed card used for this study is a National Instrument (NI) USB-6353 high
speed A/D card with 32 -10~ +10V A/D channels and external clock trigger function, as
shown in Figure 3.24. The maximum sampling speed is 1Mega samples per second. In
this study, only 18 channels are used and the channel definition is shown in Table 3.4.
An encoder with the resolution of 1 pulse per CA is coupled to the engine crankshaft and
produces the crank angle signal (TTL) and TDC reference signal (one pulse per
revolution). The valve lift signal from LVDT sensors is converted into single ended
voltage by an amplifier and connected to the A/D card. The lambda sensor signal is
conditioned and digitalised by a Motec Unit and sent to multi-serial card at the rate of

46
20Hz. The thermocouple signal has to be converted by a thermocouple conditioner
shown as green box in Figure3.24 before it can be logged by the A/D card.
Figure 3.23 Diagram of Data Acquisition System

47
Figure 3.24 DAQ Card
Table 3.4 Channel Definition in DAQ Card
Channel No. Signal Name
1 Exhaust valve 1 lift
2 Exhaust valve 2 lift
3 Intake valve 1 lift
4 Intake valve 2 lift
5 In-cylinder pressure
6 TDC reference
7 Intake pressure
8 Exhaust pressure
9 Injection
10 Spark
11 Torque
12 Speed
13 Fast UEGO
14 Air flow rate
15 Fuel flow rate
16 Fast CO2
17 Intake temperature
18 Exhaust temperature

48
b) Software
A ‘Transient Combustion Analyser’ programme was developed by the author. In addition
to data logging, the software performs on-line calculation and display of the heat release,
combustion characteristics, fuel consumption, specific emissions and efficiencies, as
shown in Figure 3.25.
Figure 3.25 Transient Combustion Analyser Panel
The program interface is developed in GUI Matlab and the relevant calculations are
coded using ‘m code’ due to the advantage of large matrix calculation in Matlab. Only
the data called from low level A/D card buffer is through NI DAQmax.
The cylinder pressure transducer is a piezoelectric sensor, which outputs a charge
referenced to an arbitrary ground and then the charge signal is converted into a voltage
signal by a charge amplifier. The relative cylinder pressure must be then converted into
an absolute pressure. The conversion process usually is referred to as ‘pegging’. In this
work, the in-cylinder pressure signal is pegged on the intake abs pressure [77]. This
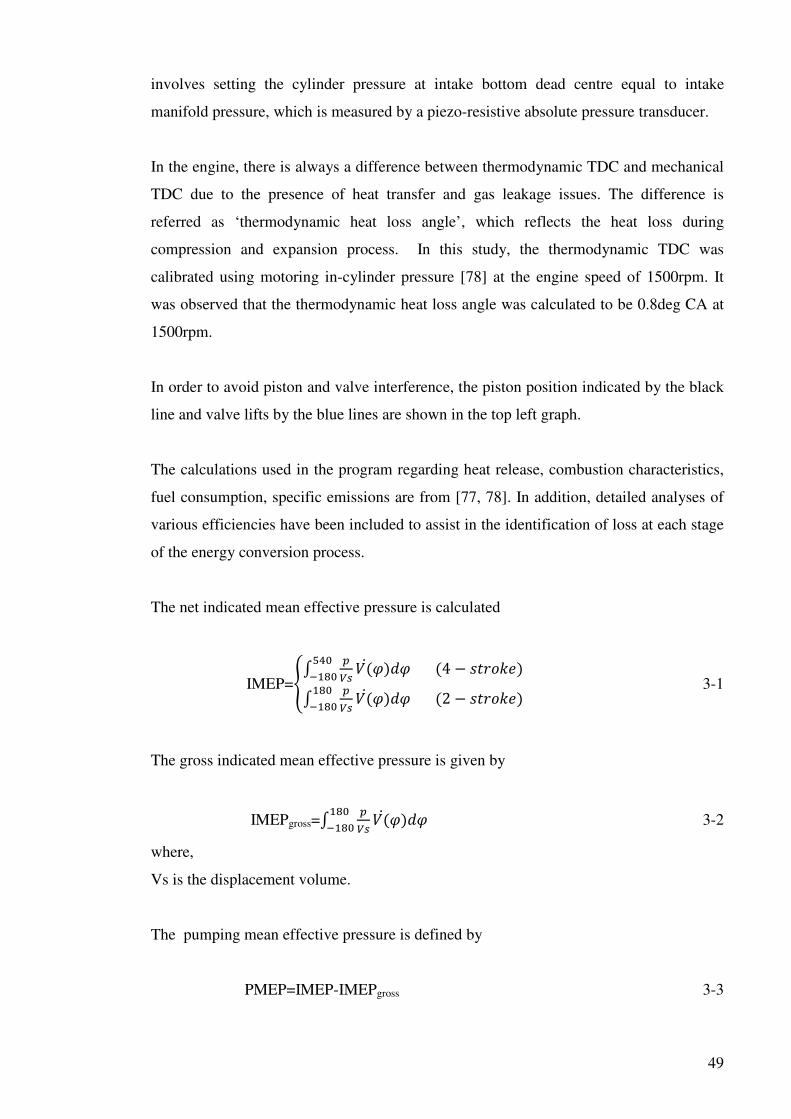
49
involves setting the cylinder pressure at intake bottom dead centre equal to intake
manifold pressure, which is measured by a piezo-resistive absolute pressure transducer.
In the engine, there is always a difference between thermodynamic TDC and mechanical
TDC due to the presence of heat transfer and gas leakage issues. The difference is
referred as ‘thermodynamic heat loss angle’, which reflects the heat loss during
compression and expansion process. In this study, the thermodynamic TDC was
calibrated using motoring in-cylinder pressure [78] at the engine speed of 1500rpm. It
was observed that the thermodynamic heat loss angle was calculated to be 0.8deg CA at
1500rpm.
In order to avoid piston and valve interference, the piston position indicated by the black
line and valve lifts by the blue lines are shown in the top left graph.
The calculations used in the program regarding heat release, combustion characteristics,
fuel consumption, specific emissions are from [77, 78]. In addition, detailed analyses of
various efficiencies have been included to assist in the identification of loss at each stage
of the energy conversion process.
The net indicated mean effective pressure is calculated
IMEP=�� ����(� )�(4 − ������)�������� ����(� )�(2 − ������)������� 3-1
The gross indicated mean effective pressure is given by
IMEPgross=� ����(� )�������� 3-2
where,
Vs is the displacement volume.
The pumping mean effective pressure is defined by
PMEP=IMEP-IMEPgross 3-3
50
and the
gas exchange efficiency= IMEPgross / IMEP . 3-4
The combustion efficiency is defined as the ratio of the heat released from the fuel to the
chemical energy of the fuel,
η��� !�"#�$ = &'()*+, = 1 − ./0∗23�/04.5/∗23�5/6!7898�:;<"7∗23� 3-5
where,
Q1 is the heat released by fuel
Efuel is the chemical energy of fuel
GCO is CO emission mass flow rate =>��? is the low heat value of CO, 10.1 [kJ/g]
GHC is HC emission mass flow rate =>�3� is the low heat value of HC, 43 [kJ/g]
LHV is Low heat value of fuel
The thermodynamic efficiency is defined as the ratio of the gross work of the cycle to the
heat leased by fuel,
η@A7;��BC$<�#D = EFGHII&' = JK(LFGHII∗�I6!7898�:;<"7∗23�∗M/HNO*IPQHR 3-6
where,
WGross is the gross work of the cycle
IMEPGross is the gross indicated mean effective pressure
Vs is the displacement volume
The indicated efficiency is defined as the ratio of the gross work of the cycle to the
chemical energy of fuel, and its formula is:
ηJ$B#D<"7B = EFGHII()*+, = η@A7;��BC$<�#D ∗ η��� !�"#�$ 3-7

51
The compression work consumed by the supercharger is calculated as follows,
Wc=ST�UV�W�X�� ∗ YZ ∗ [1 ∗ \(L]L�)^_'^ − 1`/aD/a�7DA<$#D<8 3-8
where,
For the air, Cp=1.012 J/(g.K) [78] c = 1.4
Compressor efficiency aD = 60% [78]
Compressor Mechanical efficiency a�7DA<$#D<8 = 90% [78]
T1 Supercharger inlet temperature
P1 Supercharger inlet pressure
P2 Supercharger outlet pressure
Finally, the overall mechanical efficiency is determined by
ηmech= ( BMEP- Wc / Vs ) / IMEP 3-9
which includes the additional compression work required by a supercharger.
3.7 Summary
This chapter presented the details of the 2/4-stroke GDI engine and its relevant hydraulic
valve system, fuelling system and control system used during all the experimental tests.
This is followed by the dyno system and supercharging system used to serve the engine.
The operating principle of all the main sensors and analysers was explained. In the last
section, the in-house data acquisition system and the parameter definition and
calculations were also explained.

52
Chapter 4
Cycle-resolved Air Short-circuiting and Residual Gas
Measurement

53
Chapter 4 Cycle-resolved Air Short-circuiting and Residual
Gas Measurement
4.1 Introduction
This chapter introduces the air short-circuiting phenomenon in two-stroke engines which
has a strong impact on the engine combustion, performance and emissions. This is
followed by the development and application of the methods to detect and measure the
air short-circuiting on a cycle-resolved basis. In order to measure the residual gas fraction
in a two-stroke engine and investigate the effect of residual gas fraction on CAI
combustion and engine performance, a cycle-resolved residual gas measurement
technique is implemented and applied to the single cylinder engine.
4.2 Air Short-circuiting in Two-stroke Engines and its Measurement
In a typical two-stroke engine, there is a significant overlap between the intake and
exhaust processes, as shown in Figure 2.1, during which the burnt gases can be
scavenged from the cylinder by fresh charge. As a result, some of the fresh charge can
pass directly across the combustion chamber and into the exhaust port during the overlap
period, as shown in Figure 4.1. This phenomenon is referred to as air short-circuiting and
its presence in the two-stroke engine operation can lead to a number of drawbacks,
including
1) Reduction in scavenging efficiency and increase in the gas exchange loss.
2) Increase in fuel consumption and uHC emissions in port fuel injection engines
and carburetted engines.
3) False reading of the relative air to fuel ratio (lambda) in the exhaust pipe and fuel
rich combustion, accompanied with higher fuel consumption and higher
emissions.
4) Reduction in the conversion efficiency of a three-way catalyst.

54
Figure 4.1 Short-circuiting of the Fresh Air during Scavenging Process
In the history of developing and improving two-stroke engines, researchers had long
recognised the issue of short-circuiting during the scavenging process in two-stroke
engines and resolved to measure short-circuiting and scavenging efficiency through
liquid simulation techniques [79, 80] in the model engine and gas visualization
technology in the motored engine operations [81, 82]. Although some other methods for
the measurement of the scavenging efficiency of the port scavenged two-stroke engine
had also been attempted [83-85], the first widely used experimental method to measure
the short-circuiting was proposed by Jante [86] using the distribution of the gas velocity
measured by the pitot tubes first in motored conditions, and then it was further developed
for measurement under firing conditions [87]. Another experimental method for
determining the scavenging efficiency using the measurement of the oxygen
concentration was postulated in the late 1940s [88]. Based on this method, the
scavenging flow was further assessed by the measurement of scavenging, trapping and
charging efficiency as a function of scavenge ratio [89]. Then the efficiencies of loop,
cross, and uniflow scavenging were compared using this parameter [90].
4.3 Cycle-resolved Air Short-circuiting Measurement by Fast UEGO
In the tailpipe, the short-circuiting rate (yshort) can be defined as the ratio of the mass flow
of short-circuited air to the mass flow of the exhaust gas, as shown in equation (4-1).

55
i�A�;" = jIj+ 4-1
where:
As: Mass flow rate of short-circuited air
Ae: Mass flow rate of exhaust gas
According to the mass conservation equation (4-2),
kl = km + ko + kp 4-2
where:
Ac: Mass flow rate of the combusted air
Af: Mass flow rate of fuel
yshort can be represented by equation (4-3).
qmrstu = kmkm4ko4kp 4-3
Unless the instantaneous mass flow rate, As, is measured directly in the exhaust, the
short-circuiting rate cannot be calculated from equation (4-3).
Since it is known that the short-circuited air coming into the exhaust pipe dilutes the
exhaust gases and also causes an increase in oxygen concentration. In this case, the
widely used oxygen sensor on the exhaust pipe cannot accurately reflect the lambda
value. Equation (4-4) and (4-5) show the difference between the measured lambda in the
tailpipe (v"�) and the actual lambda in the engine cylinder (vD).
wux = km4kokp /kyzmus{or{s|lut{o 4-4
wo = kokp /kyzmus{or{s|lut{o 4-5
where, kyzmus{or{s|lut{o is the stoichiometric air to fuel ratio.

56
By substituting equation (4-4) and (4-5) into equation (4-3), short-circuiting rate can be
presented as a function of v"� and vD, as shown in equation (4-6)
qmrstu = wux�wowux4kyzmus{or{s|lut{o_} 4-6
The exhaust lambda ( v"�) can be measured by a standard lambda sensor in the exhaust
pipe. The in-cylinder lambda (vD) can be measured from exhaust port close to cylinder. If
the exhaust gas is sampled before intake process begins, the measured lambda will be the
same as the in-cylinder lambda (vD). When fresh air comes into and across the cylinder,
the lambda value will start to increase because of the dilution effect of the fresh air, as
shown in Figure 4.2.
Figure 4.2 Lambda Variations during Scavenging Process
In order to obtain the lambda variation against crank angle, the standard wide band
lambda sensor was modified. Firstly, the two original protection caps were removed as
shown in Figure 4.3. Then the sensor was fitted into a fast sampling head to increase the
speed of delivery of the sampled gas from exhaust port to the modified lambda sensor, as
shown in Figure 4.4. Figure 4.5 shows the structure of the fast sampling head. In the fast
sampling head, there are two chambers: constant pressure chamber and lambda sensor
chamber. The pressure in the two chambers is kept constant by the two vacuum
regulators to stabilise the sample flow and eliminate the exhaust pulsation effect. The
pressure in the constant pressure chamber is 0.7bar absolute and the pressure in the
lambda sensor chamber is 0.65bar absolute. Between the two chambers there is a
EVO
Exhaust valve
Intake valve
BDC
IVO
Crank Angle
w

57
capillary with 0.12mm inner diameter, which assures the steady sample flow stream
towards the lambda sensor orifice and minimises the measuring error caused by the
fluctuation of the sample flow.
Figure 4.3 Modified Wide Band Lambda Sensor
Figure 4.4 Installation of Modified Lambda Sensor in a Fast Sampling Head
Sensor Cover
Lambda sensor orifice
Fast sampling head Capillary

58
Figure 4.5 Sketch of the Structure of the Fast Sampling Head
In order to catch the first portion of the exhaust gas which has the same oxygen
concentration as the in-cylinder burned gas, the exhaust gas must be sampled very close
to the exhaust valve before it mixes with the exhaust gases from the previous cycle in the
exhaust port. A thin sampling probe was made and positioned in the exhaust port, as
shown in Figure 4.6. In addition to the fast lambda sensor, a standard lambda sensor is
also required to measure the averaged lambda in the exhaust pipe. The installation of the
fast and standard lambda sensors is shown in Figure 4.7.
Figure 4.6 Sketch of the Installation of the Sampling Probe
Sampling probe

59
Figure 4.7 Installation of the Fast UEGO and Standard Lambda Sensors
Figure 4.8 shows the time-resolved fast lambda output at 1500rpm. As expected, the
lambda curve has a valley in each engine cycle. The lowest value in the valley reflects
the cylinder lambda of this engine cycle, although there is an approximately 40ms delay
from the Exhaust Valve Open (EVO) to the start of the drop on the lambda signal. The
delay includes the time that exhaust gas travels from the cylinder into exhaust port and
then through the sampling probe into the fast UEGO sample head, and eventually reaches
the orifice on the UEGO sensor, and the time the UEGO sensor converts the oxygen
concentration into a current signal. By this method the cylinder lambda can be identified
and thus the short-circuiting rate in each single engine cycle can be calculated via
Equation (4-6).
550 600 650 700
0
10
20
30
40
50
60
70
80
Cylin
de
r P
ressure
[b
ar]
Time [ms]
Cylinder Pressure1500 rpm
3.6 bar IMEP
EVO
Cylinder Lambda
1.20
1.25
1.30
1.35
1.40
1.45
1.50
1.55
1.60
Fast Lambda
Fa
st
Lam
bd
a
40ms
delay
Figure 4.8 In-cylinder Pressure and Fast Lambda VS Time
Exhaust Port
Standard
Lambda Sensor
Fast Lambda Sensor

60
4.4 Cycle-resolved Air Short-circuiting Measurement by Fast NDIR
An alternative method for measurement of the cycle-resolved short-circuiting rate in a
firing two-stroke engine is also proposed and tested. It is based on the measurement of
CO2 concentrations in the intake and exhaust, as given in Equation (4-7) [91].
qmrstu = [���]��[���]ux[���]��[���]� 4-7
where:
[CO2]b: CO2 concentration in the cylinder after combustion
[CO2]tp: CO2 concentration in the tailpipe
[CO2]a: CO2 concentration in the intake
In this case, the [CO2]tp and [CO2]a can be measured directly by the standard emission
analyser from the exhaust pipe and intake pipe respectively. Ideally, [CO2]b should be
measured via a fast acting in-cylinder sampling valve right after combustion but before
exhaust valves open during the expansion stroke. On a four-valve modern gasoline
engine of a small displacement volume, there is no extra space to mount the in-cylinder
sampling valve in the cylinder head.
Instead, [CO2]b can be measured from the exhaust port close to the exhaust valves. When
the exhaust gas is sampled before the intake process begins, the measured CO2
concentration will be the same as that in the cylinder after combustion. But the CO2
concentration will be diluted by the short-circuited air during the overlap period of the
intake and exhaust processes. Figure 4.9 shows schematically the temporal CO2
concentration in the exhaust port during the exhaust process of the two-stroke operation,
together with the valve timing diagram of the two-stroke operation. When the exhaust
valves open, there will be a rapid rise in the CO2 concentration from A to B as the first
portion of the burnt gas comes out of the cylinder. After reaching its maximum, CO2
concentration will remain constant in the period between B to C until the intake valves
open. As soon as the short-circuiting of fresh air into the exhaust occurs, the exhaust gas
will be diluted and the CO2 concentration will start to fall, as indicated by the period
from C to D. The CO2 concentration between B and C can thus be considered as [CO2]b.

61
Figure 4.9 Variation of the CO2 concentration at the Back of Exhaust Valve
In this work, the same sampling probe was used as shown in Figures 4.6 and 4.7. A fast
response CO2 analyser type NDIR500 from Cambustion Ltd was used to measure the
instantaneous CO2 concentration through the sampling probe.
4800 4840 4880 4920 4960 50000
10
20
30
40
50
60
Response time
40 ms
EVO
In-c
ylin
de
r P
ressure
(bar)
t (ms)
In-cylinder Pressure
Stop Injection
7.0
7.5
8.0
8.5
9.0
9.5
10.0
CO2
CO
2 [
%]
Figure 4.10 In-cylinder Pressure and CO2 Concentration Vs Time
In order to obtain the cycle-resolved measurement, the response speed of the CO2
analyser is essential to obtain the instantaneous [CO2]b for calculating the short-
circuiting rate through equation (4.7). The CO2 measurement delay time of the whole
system, including the time for the sampled gas going through the sampling probe and the
exhaust gas travelling from the exhaust valve to the sampling probe, was investigated by
simply switching off the injection in a cycle. The in-cylinder pressure and the CO2
EVO
Exhaust valve
Intake valve
BD
C
[CO
2]
%
IVO
A
B C
D
Crank Angle

62
concentration were logged simultaneously and shown in Figure 4.10. The injection was
switched off in the cycle at 4920ms, where no combustion took place. The response time
of the fast CO2 measurement system was then estimated from the exhaust valve opening
time to the sudden drop of the CO2 concentration, which was measured at approximately
40ms.
An example of the actual sample measurement taken at the operation condition shown in
Table 4.1 is given in this section.
Table 4.1 Sample Operating Condition
Engine speed 1500rpm
Engine load IMEP=3.245bar
Intake pressure 1.17bar abs
Exhaust Lambda 1.02
Injection timing -140 deg ATDC
Injection duration 1.00 ms
CO2 concentration in tailpipe measured by Horiba 7170DEGR
CO2tp=11.214%
CO2 concentration in intake manifold
CO2a=0.04%
Figure 4.11 shows the CO2 concentration measured by the Fast NDIR500 analyser over
100 consecutive cycles. It can be seen that there is a noticable rise after exhaust valve
opens followed by a constant valve lift for 30/40 degree crank angles. The sampling
window was thus chosen as from 250 to 275 deg ATDC.
By averaging CO2 concentration in the sampling window, the CO2b can be obtained in
each engine cycle and is shown in Figure 4.12. As the CO2 concentration in the tailpipe
(CO2tp) is 11.214% and the CO2 concentration in the intake manifold is 0.04%,
according to Equation 4-7, the short-circuiting rate for each cycle can be calculated and is
also shown in Figure 4.12. By averaging over 100 consecutive cycles, the averaged short-
circuiting rate at this operating condition is determined to be 2.79%, where the CoVyshort
is 20.57% .

63
0 90 180 270 3609.5
10.0
10.5
11.0
11.5
12.0
12.5
Intake ValveCO
2 c
oncentr
ation (
%)
Crank Angle (deg ATDC)
Exhaust Valve
Sampling Window
0
2
4
6
8
10
Valv
e L
ift (m
m)
Figure 4.11 Time-resolved CO2 Concentration over 100 Consecutive Engine Cycles
0 20 40 60 80 10010.0
10.5
11.0
11.5
12.0
12.5
13.0
CO
2b (
%)
Cycle number
CO2b
0
2
4
6
8
10
Yshort
Ysho
rt (
%)
Figure 4.12 CO2b and Yshort in 100 Consecutive Engine Cycles
Once the short-circuiting rate is identified, the in-cylinder lambda can be calculated using
equation (4-8).
wo = �kyzmus{or{s|lut{o∙wux4}�(}�qmrstu)�}kyzmus{or{s|lut{o 4-8

64
4.5 Cycle-resolved Residual Gas Measurement by Fast NDIR
Often, internal exhaust gas recirculation (EGR) is used instead of external EGR in
modern gasoline engines with variable valve timing (VVT) devices for better transient
performance and reduced accessories. The amount of residual gas retained within the
cylinder is important because, apart from suppressing NOx formation, it also increases
the engine’s susceptibility to knock at full-load and, to some extent, aids fuel
vaporisation (which is especially of interest to reduce particulate emissions during DI
gasoline engine warm-up).
An accurate prediction of residual burned gas within the combustion chamber is
important to quantify for development of modern engines, especially so for those with
internally recycled burned gases and CAI operations. Especially in two-stroke engines,
the gas exchange process is assessed by the scavenging efficiency and trapping efficiency
[14].
When considering CO2 as the tracing gas, the RGF value can be calculated from the ratio
of CO2 concentration during compression ([CO2] in) to that in exhaust stroke ([CO2] ex).
[91]
z�y = [���]{�[���]l� × }��% 4-9
The CO2 concentration in the exhaust can be measured by a standard emission analyser
from the exhaust pipe.
In order to sample the gas in the cylinder while engine is operating with combustion, the
original spark plug was replaced by an offset electrode spark plug and sample probe
combination as shown in Figure 4.13. The ignition coil used was the original production
‘pencil’ type coil. A Cambustion NDIR 500 fast CO2 analyser was configured for in-
cylinder sampling and was connected to the sampling probe for instantaneous CO2
concentration measurement, drawing its sample from the plug’s electrode location. The
output CO2 signal was logged simultaneously with in-cylinder pressure.

65
Figure 4.13 Spark Plug and Sample Probe Combination and its Installation on the
Engine
560 580 600 620 640 660 680 700
0
10
20
30
40
50
60
70
80
Cylin
der
Pre
ssure
[bar]
Time [ms]
Cylinder Pressure1500 rpm
Short-circuiting rate = 34%
0
2
4
6
8
10
12
14
[CO2]ex
[In-cylinder CO2]
[In-c
ylin
der
CO
2] [%
]
17 ms
delay
[CO2]in
Figure 4.14 In-cylinder Pressure and CO2 Concentration Vs Time
Figure 4.14 shows the variation of in-cylinder CO2 concentration and pressure trace when
the engine was running in two-stroke CAI operation at 1500rpm. The peak cylinder
pressure is associated with the compression and combustion processes. Initially, the in-
cylinder CO2 concentration stays at a constant value of about 9.5% (similar to the exhaust
CO2 concentration) but with a short-duration fall corresponding to the opening of the
exhaust valve before it recovers to the exhaust CO2 concentration. The CO2 minima
every 360CAD corresponds to the trapped CO2 within the burned gas measured during
the latter part of the compression stroke. Figure 4.14 shows this to be approximately 3%
CO2. The interval during which this gas is available to the fast NDIR is short and the

66
next combustion event rapidly presents new burned gas concentrations to the analyser
resulting in the rapid increase to around 9% CO2 once again. The data shown in Figure
4.14 has not been corrected for transport delay which will be discussed later. In order to
explain such variations in the in-cylinder CO2 concentration, it is important to understand
the mixture formation process as well as the fluid transfer process involved in the
sampling process. During the intake process, the residual burned gas is diluted with fresh
air entering the cylinder, hence the CO2 concentration decreases and reaches its minimum
at the end of the intake process. Since the sampling probe was placed next to the spark
plug, the burned gas is compressed into the sampling probe as soon as the combustion
starts, which causes the CO2 concentration to rise rapidly. However, after the gas enters
the sampling probe, it takes a finite amount of time to reach the NDIR detector of the fast
CO2 analyser, where the gas is registered and analysed. The in-cylinder CO2
concentration curve is shifted from the pressure curve. The CO2 signal delay in the
sampling system counted from the peak pressure to the sudden increase in CO2
concentration is about 17ms.
According to above analysis, the cycle resolved RGF is determined by the quotient of the
minimum and maximum value of in-cylinder CO2 concentration measured during the
firing cycle as shown in Figure 4.14.
4.6 Summary
The present chapter describes the ‘air short-circuiting’ phenomenon that commonly
occurs during the scavenging process in two-stroke engines. In order to detect and
quantify the short-circuiting rate, two cycle-resolved methods are proposed and evaluated.
The first one is based on oxygen concentration measurement via a low cost modified fast
lambda sensor and the other is based on the CO2 concentration measurement via the
NDIR fast CO2 analyser. In addition, a cycle resolved residual gas fraction method is
also described in this chapter. The impact of short-circuiting on engine performance,
combustion and emissions will be discussed in Chapter 5.

67
Chapter 5
Two-Stroke CAI Operation

68
Chapter 5 Two-Stroke CAI Operation
5.1 Introduction
Two-stroke CAI combustion was accomplished by means of residual gas trapping via
reduced overlap between exhaust and intake valve openings. In order to utilise the widely
used 3-way catalyst on the production engine, the engine experiments were carried out at
exhaust lambda 1. The operating range of two-stroke CAI will be presented and
discussed in this chapter. The effect of spark ignition and boost pressure will then be
analysed. The specific fuel consumption and emissions results from the two-stroke
poppet valve engine operation will be shown. These results will also be compared with
engine baseline in Chapter 6. Its lean operation under boosted conditions will be
discussed in Chapter 8.
5.2 Two-stroke CAI Combustion at Lambda 1.0
As explained in Chapter 2, in the four-stroke engine operating in CAI mode by means of
residual gas trapping, the exhaust gas was trapped in the cylinder by closing exhaust
valve earlier. When the engine runs natural aspirated, the engine output load is mainly
controlled by the exhaust valve closing timing, as the amount of fresh charge sucked into
the cylinder in each cycle is determined by how much exhaust gas was trapped in the
cylinder in the last cycle. Therefore, it’s necessary that the engine has variable valve
timing.
However, in two-stroke engine operating in CAI mode by means of residual gas trapping,
the variable valve timing is less necessary to engine load control, as it is controlled by
scavenging ratio, namely boosted pressure. During the scavenging process, the fresh
charge not only displaces the exhaust gases but also mixes with them at the same time.
Therefore, the residual gas is retained in the cylinder because of insufficient scavenging.
In order to reduce the scavenging ratio and retain the residual gas in the cylinder, the
intake and exhaust valve opening duration was shortened to 60 deg CA and lift was
shortened to 7mm at 1000rpm. The Exhaust Valve Open (EVO) and Intake Valve Close
(IVC) were fixed symmetric to BDC and the valve overlap was kept at 40 deg CA at
1000rpm so the engine load and scavenging can be individually controlled by the

69
boosting pressure. This strategy can be further transplanted onto the product two-stroke
engine with a cam driven valvetrain.
The DI timing was set at 140 deg CA BTDC, which is just after the IVC timing to avoid
the fuel being injected onto the back of intake valves, and is also the earliest feasible
timing for homogeneous air fuel mixture. The injection pressure was maintained 100bar
throughout the study.
When running the tests, the coolant and oil were pre-heated and their temperature was
kept at 80 degC through an individual coolant and oil conditioning unit. In the starting
process, the engine was motored by the AC dyno to a certain speed before turning on the
spark and injection.
5.2.1 Operating Range
The operating range of the two-stroke CAI in terms of engine speed and load was
investigated on the camless GDI engine. Experiments were carried out by varying the
engine speed from 800 rpm to 3000rpm at different engine loads. As shown in Figure
5.1, the operating range of CAI combustion is enveloped by 3 limits, (i) the knock limit
on the low speed high load boundary, (ii) the gas exchange limit on the high speed and
high load boundary and (iii) the misfire limit on the low load boundary. The knock limit
is defined by the threshold of the in-cylinder pressure rise rate. The misfire limit is
defined by the operating condition when the engine operation became intermittent due to
large number of misfiring cycles. Based on the previous study [92], the maximum rate of
pressure rise dP /dCA was limited to 5 bar/CA in order for the engine to operate with
similar noise levels to the SI engine. At each engine speed the engine load was varied
from low to high by increasing the intake pressure and hence the scavenging rate in the
two-stroke engine operation. The intake pressure distribution over the operation range is
shown in Figure 5.3a. It should be pointed out that the maximum IMEP on this two-
stroke engine with CAI operation is 7.8bar at 1500rpm, which is equivalent to 15bar
IMEP for a four-stroke engine. It is expected that the upper load region can be further
expanded with lean boost and/or external EGR as well as optimized valve timings.
Because the valves are operated independently from the engine’s own rotation by the
electro-hydraulic actuation, for a given intake and exhaust valve profiles, the opening

70
durations remain constant in ms but they will become less in terms of deg CA as the
engine speed increases. In addition, due to the finite opening and closing speeds of the
electro-hydraulic valves, the valves cannot reach their maximum lift at 1500rpm and
above in the two-stroke mode, as shown in Figure 5.2. Although the valve durations were
increased at higher engine speed operations to compensate for the reduction in air flow
rate caused by the reduced valve lift, it is still not sufficient for high load operation. This
is the main cause of the presence of the gas exchange limit formed on the operating range
envelop.
500 1000 1500 2000 2500 30000
1
2
3
4
5
6
7
8
Spark assisted
Gas exchange limit
Knock limit
IME
P_n
et
(bar)
Speed (r/min)
Misfire limit
CAI
Figure 5.1 Operating Range for Two-stroke CAI Operation with Exhaust Lambda
1.0
90 120 150 180 210 240 270
0
1
2
3
4
5
6
7
1500rpm
3000rpm
Va
lve
lift
(mm
)
Crank Angle (deg)
Intake Valve
Exhaust Valve
800rpm
Figure 5.2 Valve Profiles at 800rpm, 1500rpm and 3000rpm

71
It also can be seen from Figure 5.1 that the operating range comprises of pure CAI from
almost idle operations to part load conditions from 800rpm to 3000rpm and spark
assisted CAI operation at both higher load and idle regions. Although there was no
noticeable effect of spark ignition seen on the combustion process within the CAI
operating range, the spark was kept on but the spark timing was set at TDC. The pure
CAI operating zone is sandwiched by 2 regions of the spark assisted CAI operation,
where the combustion cannot continue without spark. However, the effects of the spark
on the spark assisted CAI operation zone at higher load and idle conditions are different,
which can be seen from the spark timing distribution over the operating range in Figure
5.3b. In the high load spark assisted CAI operation, as the thermal load increased with
the engine load, combustion became faster and the pressure rise rate was greater. The
spark timing was thus retarded to prevent knock. In the spark assisted CAI operation at
idle, the spark timing was advanced before TDC to help to stabilize the combustion
process.
a) b)
1.0
51.1
1.1
1.2
1.2
1.2
1.3
1. 3
1.3
1.4
1.4
1.4
1.5
1.5
IME
P [
bar]
Speed [rpm]
Intake Pressure [bar]
500 1000 1500 2000 2500 30000
2
4
6
8
-8 -6-4 -2
0
0
246
IME
P [
ba
r]
Speed [rpm]
SparkTiming [degBTDC]
500 1000 1500 2000 2500 30000
2
4
6
8

72
c) d)
Figure 5.3 Intake Pressure, Spark Timing, Combustion Duration and CA50 over
the Operating Range
5.2.2 Performance and Emissions at exhaust lambda 1.0
Figure 5.3c shows the combustion duration over the CAI operating range, which in this
paper is defined as the deg CA from 10% mass fraction burnt to 90% mass fraction burnt.
It can be seen that the combustion speed was the highest at low speed mid-load operation
in the pure CAI operation zone, where the combustion duration was less than 8 CA.
When the engine speed increased, the combustion speed increased but the combustion
duration in deg CA increased by a few degrees. At low load operation, the combustion
duration became longer because the combustion process was slowed down due to
dilution by the large amount of the residual gases, of which the quantity was mainly
determined by the intake pressure and air flow rate. In the spark assisted CAI operation
above the pure CAI operation range, the combustion duration was longer and the heat
release process was slower due to retarded combustion phasing of CA50 as shown in
Figure 5.3d, the crank angle at which 50% mass fraction is burnt. It is noted that at the
higher load region of low engine speeds, although the combustion phase was retarded to
16 or 18 degree ATDC, the combustion speed was still high enough to cause excessive
pressure rise due to insufficient dilution effect of less residual gas at lower engine speed.
Therefore, it is envisaged that the upper load region can be extended further by
introducing leaner mixture at higher boost and/or externally cooled EGR. The results
shall be presented in a future publication.
88
8
8
10
10
10
10
10
12
1212
12
1212
12
1414
14
14
14
14
16
16
16
16
18
IME
P [
bar]
Speed [rpm]
Combustion Duration [degCA]
500 1000 1500 2000 2500 30000
2
4
6
8
22
4
4
4
4
6
6
66
8 8
1010
1212
14
1616
18
IME
P [
bar]
Speed [rpm]
CA50 [degATDC]
500 1000 1500 2000 2500 30000
2
4
6
8

73
Figure 5.4a shows the Indicated Specific NOx (ISNOx) emission values over the CAI
operating range. It can be seen that the NOx emissions under pure CAI operation were
below 2g/KWh due to the dilution of the large amount the residual gas in the cylinder.
When the load increased and the operating mode transferred from pure CAI to spark
assisted CAI, more NOx emissions were produced because of the reduction in the
residual gas fraction and the increase in the in-cylinder temperature. At the knock limit
boundary, the NOx emissions increased to 6 g/kWh.
Figure 5.4b shows the distribution of Indicated Specific CO (ISCO) emission over the
CAI operating range. It can be seen that the CO emission was very high and its value
tended to be higher at higher load and higher speed where the intake pressure was higher
as shown in Figure 5.4a. Such results are likely to be caused by the air short-circuiting
prevalent in the two-stroke operation. During the gas exchange process in the two-stroke
engine operation, there is a valve overlap when both of the intake and exhaust valves are
open to achieve the scavenging. During this period, a portion of the intake fresh air can
flow across the combustion chamber and into the exhaust directly. The portion of the
fresh air dilutes the exhaust gas and leads to the measurement of the air to fuel ratio in
the exhaust pipe to be leaner than the actual air to fuel ratio of the in-cylinder mixture.
Therefore, the mixture in the cylinder during the combustion process is richer than that
measured from the exhaust pipe. Figure 5.5 shows the effect of the short-circuiting on the
relative air to fuel ratio (Lambda). The in-cylinder lambda (Lambdac ) was derived from
the measurement of instantaneous CO2 concentration in the exhaust port with a fast
response Cambustion CO2 analyser as to be described in Chapter 4, whereas the lambda
in the tailpipe(Lambdatp) was measured by a lambda sensor. It can be seen that the short-
circuiting rate increased with the intake pressure for the fixed valve timings. As a result,
the in-cylinder lambda (Lambdac) became increasingly richer while the lambda in the
tailpipe (Lambdatp) was ketp at 1. Thus the CO emissions would be expected to increase
with the intake pressure when the exhaust lambda signal is used as a feedback for the air
fuel ratio control on the two-stroke engine.

74
a) b)
c) d)
Figure 5.4 ISNOx, ISCO, ISHC, and Exhaust Temperature over the Operating
Range
Figure 5.4c shows the distribution of Indicated Specific uHC (ISHC) emissions over the
CAI operating range. The value varied from 10 g/kWh to 60 g/kWh depending on the
engine load. The high values of uHC emission were caused by richer mixture whilst the
exhaust lambda was maintained at 1.0 because of the short-circuiting process discussed
above. Since the oxidation rate of the uHC during the combustion process in the cylinder
is mainly determined by the in-cylinder temperature. When in-cylinder temperature
increases, more uHC is converted to the CO2 and H2O. Therefore, the distribution of the
uHC emission is much related to that of the exhaust temperature, as shown in Figure 5.4d.
0.10.1
0.20.2
0.4 0.40.6 0.60.8 0.8
1
1
2 2 23
4
4
5
56
IME
P [
ba
r]
Speed [rpm]
ISNOx [g/KWh]
500 1000 1500 2000 2500 30000
2
4
6
8
80
10
0
100
12
0 120
120
140
14
0
14
0
14
0
14
0
1401
60
16
0
160
16
0
18
0
18
0
18018
0
20
0
200200
22
0
IME
P [
ba
r]
Speed [rpm]
ISCO [g/KWh]
500 1000 1500 2000 2500 30000
2
4
6
8
10
15
15
15
20
20
2030 3040 4060
IME
P [
bar]
Speed [rpm]
ISHC [g/KWh]
500 1000 1500 2000 2500 30000
2
4
6
8
200 200
250
300
300
35
0350
350
40
0
400
400
45
0
450
450IME
P [
ba
r]
Speed [rpm]
ExhaustTemp [degC]
500 1000 1500 2000 2500 30000
2
4
6
8

75
1.0 1.1 1.2 1.3 1.4 1.5 1.60.85
0.90
0.95
1.00
1.05
1.10
1.15
1.20
La
mbd
atp,
Lam
bd
ac
Intake Pressure (bar)
Lambdatp
Lambdac
0
2
4
6
8
10
12
Sho
rt-c
ircu
itin
g r
ate
(%
)
Short-circuiting rate (%)
Figure 5.5 Effect of Short-circuiting on the Measurement of Lambda at 1500rpm
Figure 5.6 shows the distribution of Indicated Specific Fuel Consumption (ISFC) over
the operating range. Within the pure CAI operating range, the ISFC varied from 270
g/kWh to 320 g/kWh depending on the engine load. Above the pure CAI operation, the
fuel consumption increased with engine load because of the delayed combustion and too
rich mixture caused by the short-circuiting stated above.
Figure 5.6 ISFC over the Operating Range
27
0
270
280
280280
280
290
290
290
290
30
0
300 300
32
0
320
34
0
340360
IME
P [
bar]
Speed [rpm]
ISFC [g/KWh]
500 1000 1500 2000 2500 30000
2
4
6
8

76
5.3 Short-circuiting Effects on Two-stroke CAI Combustion and
Emissions
The effect of the air flow rate on the short-circuiting was investigated by changing the
boost pressure and hence the engine power output. Figure 5.7 compares the concentration
of CO2 sampled at the exhaust valve under different load conditions over two engine
cycles. It can be seen that the variation of the CO2 concentration, within one engine cycle
between 40ms at 1500rpm in the two-stroke mode, increases with engine load. This
indicates that the short-circuiting rate becomes higher when the boost pressure and
engine load increase. Figure 5.8 shows the corresponding short-circuiting rate calculated
using Eq.4.7. More detailed information on the actual measurements and data processing
is given in Chapter 4. In the two-stroke CAI mode, the engine load is mainly determined
by the intake pressure when the valve timings and lambda are fixed. It can be seen that
the short-circuiting rate increases in proportion to the intake pressure. This can be readily
explained by the fact that at higher boost pressures, higher air flow velocity causes more
air to flow from the near side of the intake valves directly across the combustion chamber
to the exhaust valves and the exhaust port. When the intake pressure was varied from
1.06bar to 1.38bar, the IMEP increased from 1.16bar to 5bar. At low load operation, the
intake air flow rate curve follows the IMEP curve and the short-circuiting rate is below
5%. When the IMEP is over 4bar, the difference between the IMEP and air flow rate
becomes bigger, indicating a portion of the intake air didn’t participate in the combustion
and entered the exhaust pipe directly. In this case, the short-circuiting rate is over 5%.
The dispersion of the short-circuiting rate shown in Figure 5.8 indicates that the cycle-to-
cycle variation of the short-circuiting rate increases with the air flow rate.
8520 8540 8560 8580 8600 86209.5
10.0
10.5
11.0
11.5
12.0
12.5
13.0
IMEP= 3.25 bar
IMEP= 5.00 barCO
2 (
%)
t (ms)
IMEP= 1.16 bar
Figure 5.7 CO2 Concentration at the Exhaust Valve at 1500rpm Vs Time

77
1.05 1.10 1.15 1.20 1.25 1.30 1.35 1.400
1
2
3
4
5
6
IME
P (
ba
r)
Intake Pressure (bar)
IMEP
0
1
2
3
4
5
6
7
8
9
10
11
Sho
rtcir
cu
it r
ate
(%
)
Shortcircuit rate
0.00
0.02
0.04
0.06
0.08
0.10
0.12
0.14
0.16
0.18
0.20
Air f
low
rate
(g
/cycle
) Air flow rate
Figure 5.8 IMEP, short-circuiting rate and air flow rate at 1500rpm VS. intake
pressure
Because of the dilution of the exhaust gas by the short-circuited air, measurements of the
relative air-fuel ratio by a lambda sensor will be adversely affected. In order to
investigate the effect of the short-circuiting on the exhaust lambda measurement, further
engine tests were carried out at constant load (3.6bar IMEP) and speed (1500rpm) with
the same valve timings shown in Figure 5.2. The exhaust lambda value was varied from
1.0 to 1.44 by increasing the intake pressure and reducing the fuelling rate, as shown in
Figure 5.9.
1.0 1.1 1.2 1.3 1.4 1.51.16
1.18
1.20
1.22
1.24
1.26
Inta
ke
Pre
ssu
re (
bar)
Exhaust lambda
Intake pressure
8.0
8.2
8.4
8.6
8.8
9.0
9.2
Fuelling rate
Fue
llin
g r
ate
(m
g/c
ycle
)
Figure 5.9 Intake Pressure and Fuelling Rate Vs Lambdatp

78
3.0 3.5 4.0 4.5 5.0 5.50.9
1.0
1.1
1.2
1.3
1.4
1.5
Lam
bda
tp, L
am
bda
c
Short-circuiting rate (%)
Lambdatp
Lambdac
Figure 5.10 Effect of Short-circuiting on the Difference between the Measured
Exhaust Lambda and In-cylinder Lambda Values
In order to work out the relative air to fuel ratio in the cylinder, Equations 4-6 can be
rearranged so that the in-cylinder lambda (vD ) can be worked out from the Lambda
sensor’s reading and the short-circuiting rate, Equation 4-8.
Figure 5.10 plots the lambdac and lambdatp as a function of the short-circuiting rate. It
can be seen that the in-cylinder lambda value was always lower than the exhaust lambda
due to the presence of additional short-circuited air in the exhaust. In addition, when the
measured exhaust lambda was 1, the in-cylinder lambda value was about 0.96 at this
operation condition. This explains the high CO and uHC emissions seen in Figure 5.11
when the closed-loop controlled stoichiometric operation was adopted at this operating
point. The stoichiometric combustion took place when the exhaust lambda was 1.04.
This is further supported by the measured CO2 concentration in the exhaust shown in
Figure 5.12, which peaked at around the exhaust lambda value of 1.07. CO and HC
emissions reached their lowest value at the exhaust lambda of 1.14 and the calculated in-
cylinder relative air to fuel ratio of 1.1. It is interesting to note that both the maximum
NOx concentration in Figure 5.11 and the highest combustion efficiency in Figure 5.13
occurred at the in-cylinder lambda value of 1.1. In addition, it is noted that the shortest
combustion duration or the fastest combustion took place with the relative leaner air fuel
mixture as well. In theory, if the mixture were homogeneous, one would expect the
maximum combustion efficiency with stoichiometric mixture and that the maximum

79
flame speed with slightly rich mixture. However, both the combustion efficiency and
flame speed reached their maximum with an overall leaner mixture in the current
experiments. Thus it indicates that stratified charge combustion could have taken place in
the cylinder with stoichiometric mixture in most regions, due to the fact that there may
not be enough time to form a homogeneous mixture when the injection took place during
the compression stroke after the closure of the intake valves.
1.0 1.1 1.2 1.3 1.4 1.5
1000
10000
CO
(pp
m)
Exhaust Lambda
CO
3500
4000
4500
5000
HC
HC
(pp
m)
50
100
150
200
250
300
NOx
NO
x (
pp
m)
Figure 5.11 Effect of Lambda on CO, HC and NOx Emissions
1.0 1.1 1.2 1.3 1.4 1.5
9.5
10.0
10.5
11.0
11.5
12.0
12.5
13.0
13.5
CO
2 (
%)
Exhaust Lambda
Figure 5.12 Effect of Lambda on CO2 Emissions

80
1.0 1.1 1.2 1.3 1.4 1.5
90
91
92
93
94
95
96
97
Com
b.E
ffi. (
%)
Exhaust Lambda
Figure 5.13 Effect of Lambda on Combustion Efficiency
1.0 1.1 1.2 1.3 1.4 1.5
4
6
8
10
12
14
16
18
20
22
Co
mb_
du
ra (
deg
CA
)
Exhaust Lambda
Figure 5.14 Effect of Lambda on Combustion Duration
The main findings of this section can be summarised as follows:
1) The results at constant engine speed shows that the short-circuiting rate increased
from 1% at minimum load to about 8% at 5 bar IMEP when the boost pressure was
increased from 1.05 bar to 1.4 bar.
2) The measured short-circuiting rate was then used to determine the in-cylinder relative
air to fuel ratios from the lambda sensor readings. At 3.6 bar IMEP at 1500rpm, the
difference between the exhaust lambda and the in-cylinder lambda remained
relatively constant at 0.4 when the boost pressure was increased from 1.17bar to
1.25bar.

81
3) The combustion and emission results show that maximum combustion efficiency and
lowest CO and uHC emissions occurred with a relatively lean overall in-cylinder
mixture, indicating the presence of stratified charge combustion whilst the maximum
CO2 concentration was obtained with a stoichiometric in-cylinder mixture.
5.4 Summary
In this chapter, two-stroke CAI combustion was studied at exhaust lambda 1. It is
demonstrated that a wider range of CAI operation could be achieved at engine speeds
from 800rpm to 3000rpm and with engine load from idle to 7.8bar IMEP, which is
equivalent to 15.6 bar IMEP on the four-stroke operation. In the CAI operational range,
the NOx emission was very low and the specific fuel consumption was also low. Due to
the short-circuiting, the in-cylinder mixture was too rich for complete combustion when
the exhaust lambda was controlled at 1.0 and hence higher CO and uHC emissions were
observed.
The air short-circuiting rate was quantified and used to determine the in-cylinder relative
air to fuel ratios from the lambda sensor readings. The combustion and emission results
show that maximum combustion efficiency and lowest CO and uHC emissions occurred
with a relatively lean overall in-cylinder mixture whilst the maximum CO2 concentration
was obtained with a stoichiometric in-cylinder mixture.

82
Chapter 6
Further Analysis of two-stroke CAI Combustion and
Comparison with other Combustion modes

83
Chapter 6 Further Analysis of Two-stroke CAI Combustion
and Comparison with other Combustion Modes
6.1 Introduction
Since direct injection was used, the injection timing would affect the mixture formation
and subsequent combustion, in the first part of this chapter the effect of injection timing
is discussed on CAI combustion during two-stroke and four-stroke operations. In order to
evaluate its relative merits, the performance and emissions of the two-stroke CAI
combustion operation was compared with several other four-stroke combustion modes.
6.2 Injection Timing Effects on CAI Combustion
Effects of the injection timing were investigated and analysed for the three CAI
combustion modes in terms of combustion, performance and emissions. The CAI
combustion operation was realised by means of three different operating strategies, as
shown in Figure 6.1. The valve timings and maximum valve lift and other engine
operating conditions are given in Table 6.1. They are four-stroke Negative Valve Overlap
(NVO) CAI operation, four-stroke exhaust rebreathe CAI operation and two-stroke CAI
operation.
Case 1: Four-stroke NVO CAI operation
In four-stroke NVO CAI operation mode, the burnt gases are trapped in the cylinder by
earlier closure of exhaust valves. To avoid the backflow of the burnt gases entering the
intake port, the intake valve opening time is retarded so that it is symmetric to the
exhaust valve closing time on the gas exchange TDC. For homogeneous mixture
operation, the injection timing can be altered from exhaust valve closure to intake valve
closure, as shown in Figure 6.2.

84
Figure 6.1 Valve Timings for Four-stroke and Two-stroke CAI Operations
Table 6.1 Valve Timings and Lifts for each Operating Mode
Mode IVO IVC EVO EVC IVL EVL
4strNVO 100deg
ATDC
0deg
ABDC 10deg BDC 100deg BTDC
5.5mm 7.8mm
4strReB 5deg
BTDC
80deg
BBDC
Valve1 Valve2 Valve1 Valve2 6.0mm 7.8mm /
8.0mm 10deg
BDC
45deg
ATDC
0deg
ATDC
0deg
ABDC
2strCAI 17deg
BBDC
60deg
ABDC 40deg BBDC 12deg ABDC
4.0mm 3.8mm
TD BDBD
1) 4-stroke Negative Valve
TD BDBD
2) 4-stroke Exhaust Rebreathe
BD TDTD
3) 2-stroke CAI
Exhaust valve 1
Exhaust valve 2
Intake valve 1
Intake valve 2

85
-180 0 180 360 5400
5
10
15
20
25
30
35
40 In-cylinder Pressure
Injection
In-c
ylin
der
Pre
ssure
(bar)
Crank Angle (deg.)
0
2
4
6
8
10
12
14 Intake Valve Lift
Exhaust Valve Lift
Lift
(mm
)
Figure 6.2 Injection Timing in Four-stroke NVO CAI Operation
Case 2: Four-stroke exhaust rebreathe CAI operation
Another way to recirculate exhaust gases in the four-stroke operation is to suck back the
exhaust gases from the exhaust ports by reopening the exhaust valve during the intake
stroke. As the electro-hydraulic valve train system installed on the engine allows
independent valve control, exhaust valve 1 is actuated to open as normal and exhaust
valve 2 is delayed to open during the intake stroke in order to suck the exhaust gas back
into the cylinder. In this operation mode, the injection timing is varied from the exhaust
valve 1 closure to the intake valve closure, as shown in Figure 6.3.
-180 0 180 360 5400
5
10
15
20
25
30
35
40 In-cylinder Pressure
Injection
In-c
ylin
der
Pre
ssure
(bar)
Crank Angle (deg.)
0
2
4
6
8
10
12
14
16
18
Exhaust Valve 1
Exhasut Valve 2
Intake Valve
Lift
(mm
)
Figure 6.3 Injection Timing in Four-stroke Exhaust Rebreathe CAI Operation

86
Case 3: two-stroke CAI operation
As discussed in Chapter 5, in order to retain a portion of the exhaust gases in the cylinder
to achieve two-stroke CAI combustion, the exhaust valve closure is advanced. The
injection timing is varied from the exhaust valve closure (-150deg ATDC) to the intake
valve closure (-100deg ATDC), as shown in Figure 6.4.
-180 0 1800
5
10
15
20
25
30
35
40 In-cylinder Pressure
Injection
In-c
ylin
der
Pre
ssu
re (
bar)
Crank Angle (deg.)
0
2
4
6
8
10
12
14 Exhaust Valve
Intake Valve
Lift
(mm
)
Figure 6.4 Injection Timing in Two-stroke CAI Operation
6.2.1 Effect of Injection Timings on the Air Flow Rate
In Figure 6.5, the measured air flow rate, denoted by the square symbols, is plotted as a
function of the fuel injection timing for the four-stroke NVO CAI operation. The pink
line at the bottom-left of the graph is the last part of the exhaust valve lift curve. The
intake valve lift curve is located around 490deg ATDC. It is noted that the air flow rate
decreases as the injection timing is retarded towards TDC during the negative valve
overlap period and then rises after TDC to reach another peak at 440deg ATDC.

87
Figure 6.5 Effect of Injection Timing on Intake Air Flow Rate in Four-stroke NVO
CAI Operation (1500rpm, Lambda=1)
It is known that when liquid fuel is injected directly into the cylinder, its evaporation
cools down the charge and brings down the gas temperature. This so-called charge
cooling effect is expected to increase the air flow rate into the cylinder. When fuel is
injected earlier in the NVO period, there is more time for the liquid fuel to evaporate and
hence a greater charge cooling effect to reduce the cylinder charge temperature and
pressure. In turn, this will lower the pressure at IVC so that more air can be inducted into
the cylinder. If this is the sole reason, one would expect a monotonic decrease in air flow
rate with retarded injection timing during the NVO period. However, the presence of the
significant dip in the air flow rate at TDC suggests that a more dominant process has
taken place. As described in Chapter 3, the Denso high pressure fuel injector is located
below the two inlet valves and it is characterized with a fan shaped fuel spray. At TDC,
some of the liquid fuel will reach the piston surface and form liquid film on the piston
top that will not participate in the evaporation and hence charge cooling process as much
as the air borne fuels. Hence the temperature and pressure at the subsequent IVC timing
will be higher, hindering the air flow into the cylinder. This phenomenon remains
dominant until 440deg ATDC, when the charging cooling effect becomes dominant again.
As a result, during the intake process when the intake valves are open the air flow rate
drops with retarded injection timing as less time is available for evaporation and hence
0
1
2
3
4
5
6
7
8
9
10
Valv
e L
ift
(mm
)
240 260 280 300 320 340 360 380 400 420 440 460 480 500 520 540 560
0.075
0.08
0.085
0.09
0.095
0.1
0.105
0.11
0.115
0.12
InjTiming (deg CA ATDC)
AirF
low
Rate
(g/c
ycle
)
TDC
Cooling Effect (Expected)
Wetting Effect
Air Flow Rate Intake Valve
Exhaust Valve

88
charge cooling to take place. Impingement from the high pressure fuel injection is
responsible for the sudden decrease in the air flow rate.
Figure 6.6 shows the effect of injection timing on the intake air flow rate in the four-
stroke exhaust rebreathe CAI operation. The red line on the left is the first exhaust valve
lift curve and the pink line on the right shows the second exhaust valve opening duration
and timing. In this case, the intake air flow doesn’t change as much as that during NVO
CAI operation. The reason is that the intake air flow rate is much less affected by the
amount of residual gases, as the recirculated exhaust gases come into the cylinder
through the second exhaust valve towards the end of the intake process. Therefore, the
in-cylinder temperature and pressure during the exhaust rebreathing period have little
effect on the intake air flow rate. In addition, as fuel is injected into the fresh air at
ambient temperature, the fuel evaporation process is much slower and hence less charge
cooling takes place during the intake process. In addition, since the fuel injection take
place after TDC, the liquid fuel impingement is absent.
240 260 280 300 320 340 360 380 400 420 440 460 480 500 520 540 560
0.070
0.075
0.080
0.085
0.090
0.095
0.100
0.105
0.110
0.115
0.120
Intake Valve Exhaust Valve 2
Air
Flo
w R
ate
(g
/cycle
)
InjTiming (degATDC)
AirFlowRate
Exhaust Valve 1
0
2
4
6
8
10
Valv
e L
ift (m
m)
Figure 6.6 Effect of Injection Timing on Intake Air Flow Rate in Four-stroke
Exhaust Rebreathe CAI Operation (1500rpm, Lambda=1)
In Figure 6.7, it can be seen that during the two-stroke CAI operation mode, the exhaust
valves are shown to close around -150deg ATDC and the intake valves remain open until

89
-100deg ATDC. The air flow rate decreases slightly as the fuel injection is retarded from
EVC at -150deg ATDC as the amount of charging cooling is reduced with less time
available during the intake process. Since some of the fuel is injected into the hot
residual gases as well as the fresh air, the fuel evaporation is faster than the four-stroke
exhaust rebreathing CAI operation but less than that of the four-stroke NVO CAI
condition. As a result, the charge cooling effect lies between the four-stroke NVO CAI
mode and four-stroke exhaust rebreathe CAI mode.
-180 -160 -140 -120 -100 -80 -60
0.07
0.08
0.09
0.10
0.11
0.12
Intake Valves
Air
Flo
w R
ate
(g
/cycle
)
InjTiming (degATDC)
AirFlowRate
Exhaust Valves
0
1
2
3
4
5
6
7
8
9
10
Va
lve
Lift (m
m)
Figure 6.7 Effect of Injection Timing on the Intake Air Flow Rate in Two-stroke
CAI Operation (1500rpm, Lambda=1)
6.2.2 Effect of Injection Timings on Emissions
Due to the dilution of the large amount of exhaust gases in the combustion process, the
measured NOx emissions are very low and below 100ppm. However, CO and HC
emissions are high and vary significantly with injection timings. As shown in Figure 6.8
and Figure 6.9, CO and HC follow the same trend with the injection timing during the
four-stroke NVO CAI operation. The CO and HC emissions reach a peak at TDC
because of the liquid fuel impingement. The second peak at IVC is likely a result of the

90
interaction of the intake flow and the spray. As explained in Chapter 3, the engine is
designed with vertical intake ports so that a reversed tumble flow can be formed to avoid
short-circuiting during two-stroke operation. When the fuel injection timing coincides
with the opening of the intake valves, the fuel spray is subject to incoming air flows at
high speeds and deflected towards the piston, hence liquid impingement occurs on the
piston crown. The rise in the CO and HC emissions with injection timing during the
compression stroke is caused by the inhomogeneous mixtures due to insufficient mixing
time of later injections.
In comparison, there are less HC and CO emissions from the four-stroke exhaust
rebreathe CAI operation. Since the gas motion is more vigorous in exhaust rebreathe CAI
operation c.f. four-stroke NVO CAI operation, the mixing process is largely improved.
So the CO emission is lower even when the fuel is injected onto the piston crown, as
shown in Figure 6.10. However, some of the fuel film on the piston crown still cannot be
burned and leads to the high HC emissions evident in Figure 6.11. The peak in CO
emissions at the latest injection, when the second exhaust valve opens, could be caused
by the fuel injection into the recirculated exhaust gases, which results in incomplete
combustion.
240 260 280 300 320 340 360 380 400 420 440 460 480 500 520 540 560
0
5000
10000
15000
20000
25000
Intake Valve
CO
(p
pm
)
InjTiming (degATDC)
CO
Exhaust Valve
0
2
4
6
8
10
Va
lve
Lift (m
m)
Figure 6.8 Effect of Injection Timing on CO Emissions in Four-stroke NVO CAI
Operation (1500rpm, Lambda=1)

91
240 260 280 300 320 340 360 380 400 420 440 460 480 500 520 540 560
6000
8000
10000
12000
14000
16000
18000
Intake Valve
HC
(p
pm
)
InjTiming (degATDC)
HC
Exhaust Valve
0
2
4
6
8
10
Va
lve
Lift (m
m)
Figure 6.9 Effect of Injection Timing on HC Emissions in Four-stroke NVO CAI
Operation (1500rpm, Lambda=1)
In the two-stroke CAI operation mode, the injection timing is retarded to the compression
stroke to avoid fuel short-circuiting. Compared with the four-stroke operation modes, the
fuel has less time to evaporate and atomize, resulting in the poor mixing and subsequent
too rich combustion at some spots in the combustion chamber. This is reflected in the
higher CO and HC emission data shown in Figure 6.12 and 6.13. As the injection timing
is further retarded, the shorter mixture preparation time becomes, and higher HC and CO
emissions result.
6.2.3 Effect of Injection Timing on CAI Combustion Process
Injection timing also affects the CAI combustion process through the charge cooling
effect, piston wetting effect and mixing. In order to analyse the combustion process, the
combustion parameters, such as CA10 (10% mass fraction fuel burnt crank angle), CA50
(50% mass fraction of fuel burnt crank angle) and CA10-90 (crank angles from 10% to
90% mass fraction fuel burnt), were calculated from the in-cylinder pressure and
analysed for different injection timings in 3 CAI operation modes.

92
240 260 280 300 320 340 360 380 400 420 440 460 480 500 520 540 560
4000
5000
6000
7000
8000
Intake Valve
Exhaust Valve 2
CO
(p
pm
)
InjTiming (degATDC)
CO
Exhaust Valve 1
0
2
4
6
8
10
Valv
e L
ift (m
m)
Figure 6.10 Effect of Injection Timing on CO Emissions in Four-stroke Exhaust
Rebreathe CAI Operation (1500rpm, Lambda=1)
240 260 280 300 320 340 360 380 400 420 440 460 480 500 520 540 560
9000
9500
10000
10500
11000
Intake Valve
Exhaust Valve 2
HC
(pp
m)
InjTiming (degATDC)
HC
Exhaust Valve 1
0
2
4
6
8
10
Va
lve
Lift (m
m)
Figure 6.11 Effect of Injection Timing on HC Emissions in Four-stroke Exhaust
Rebreathe CAI Operation (1500rpm, Lambda=1)

93
-180 -160 -140 -120 -100 -80 -60
10000
12000
14000
16000
18000
20000
22000
24000
26000
28000
30000
Intake ValveC
O (
pp
m)
InjTiming (degATDC)
CO
Exhaust Valve
0
1
2
3
4
5
6
7
8
9
10
Va
lve L
ift (m
m)
Figure 6.12 Effect of Injection Timing on CO Emissions in Two-stroke CAI
Operation (1500rpm, Lambda=1)
-180 -160 -140 -120 -100 -80 -60
4000
4200
4400
4600
4800
5000
5200
5400
5600
5800
6000
Intake Valve
HC
(p
pm
)
InjTiming (degATDC)
HC
Exhaust Valve
0
1
2
3
4
5
6
7
8
9
10
Va
lve
Lift (m
m)
Figure 6.13 Effect of Injection Timing on HC Emissions in Two-stroke CAI
Operation (1500rpm, Lambda=1)
Figure 6.14a shows the effect of injection timing on CA10, the start of combustion
process, in the four-stroke NVO CAI operation mode. When fuel is injected around

94
360deg ATDC (gas exchange TDC), the start of combustion is retarded due to the
contribution of the piston wetting effect as first mentioned above. However, looking at
the CA10-90 shown in Figure 6.14b, which indicates the combustion duration, it can be
found that the combustion speed is faster when fuel is injected around the gas exchange
TDC because of the heating effect of the residual gas, since the intake air flow rate drops
and residual gas fraction increases when the injection timing is around gas exchange
TDC, as shown in Figure 6.5.
In the four-stroke exhaust rebreathe CAI operation, the injection timing has less effect on
start of combustion as the wetting effect becomes weaker in front of the higher air motion
in the cylinder, but the later injection of the fuel leads to the longer combustion duration
due to the fuel injection into the recirculated exhaust gases, as shown in Figure 6.15.
240 260 280 300 320 340 360 380 400 420 440 460 480 500 520 540 560
-5
-4
-3
-2
-1
0
1
Intake Valve
CA
10
(d
eg
AT
DC
)
InjTiming (degATDC)
CA10
Exhaust Valve
Wetting effect
0
2
4
6
8
10
Va
lve
Lift (m
m)
a)

95
240 260 280 300 320 340 360 380 400 420 440 460 480 500 520 540 560
14
16
18
20
22
24
26
28
30
Intake Valve
CA
10
-90
(d
eg
CA
)
InjTiming (degATDC)
CA10-90
Exhaust Valve
0
2
4
6
8
10
Va
lve
Lift (m
m)
b)
Figure 6.14 Effect of Injection Timing on CA10 and CA10-90 in Four-stroke NVO
CAI Operation
240 260 280 300 320 340 360 380 400 420 440 460 480 500 520 540 560
-6
-5
-4
-3
-2
-1
0
1
2
3
4
Intake Valve
Exhaust Valve 2
CA
10
(d
eg
AT
DC
)
InjTiming (degATDC)
CA10
Exhaust Valve 1
0
2
4
6
8
10
Va
lve
Lift (m
m)
a)

96
240 260 280 300 320 340 360 380 400 420 440 460 480 500 520 540 560
16
18
20
22
24
26
28
30
Intake Valve
Exhaust Valve 2
CA
10
-90 (
de
g C
A)
InjTiming (degATDC)
CA10-90
Exhaust Valve 1
0
2
4
6
8
10
Valv
e L
ift (m
m)
b)
Figure 6.15 Effect of Injection Timing on CA10 and CA10-90 in Four-stroke
Exhaust Rebreathe CAI Operation
In two-stroke CAI operating mode, the combustion process is mainly determined by the
extent of the air fuel mixing process, as the fuel has less time to evaporate and mix with
the air in the cylinder when injection is in the compression stroke. As shown in Figure
6.16a, the later the fuel is injected, the more retarded the combustion phasing as
represented by CA50. The retard in the combustion phase also results in the longer
combustion duration shown in Figure 6.16b. Even when the spark was switched on to
bring the combustion phase forward and the injection timing at –100deg ATDC, the
combustion speed was hardly affected.

97
-180 -160 -140 -120 -100 -80 -60
5
6
7
8
9
10
Intake Valve
CA
50 (
deg A
TD
C)
InjTiming (degATDC)
CA50
Exhaust Valves
Spark Timing
-10 deg ATDC
0
1
2
3
4
5
6
7
8
9
10
Va
lve L
ift (m
m)
a)
-180 -160 -140 -120 -100 -80 -60
4
6
8
10
12
14
16
18
20
Intake Valve
CA
10
-90
(d
eg
CA
)
InjTiming (degATDC)
CA10-90
Exhaust Valves
0
1
2
3
4
5
6
7
8
9
10
Va
lve
Lift (m
m)
b)
Figure 6.16 Effect of Injection Timing on CA50 and CA10-90 in Two-stroke CAI
Operation
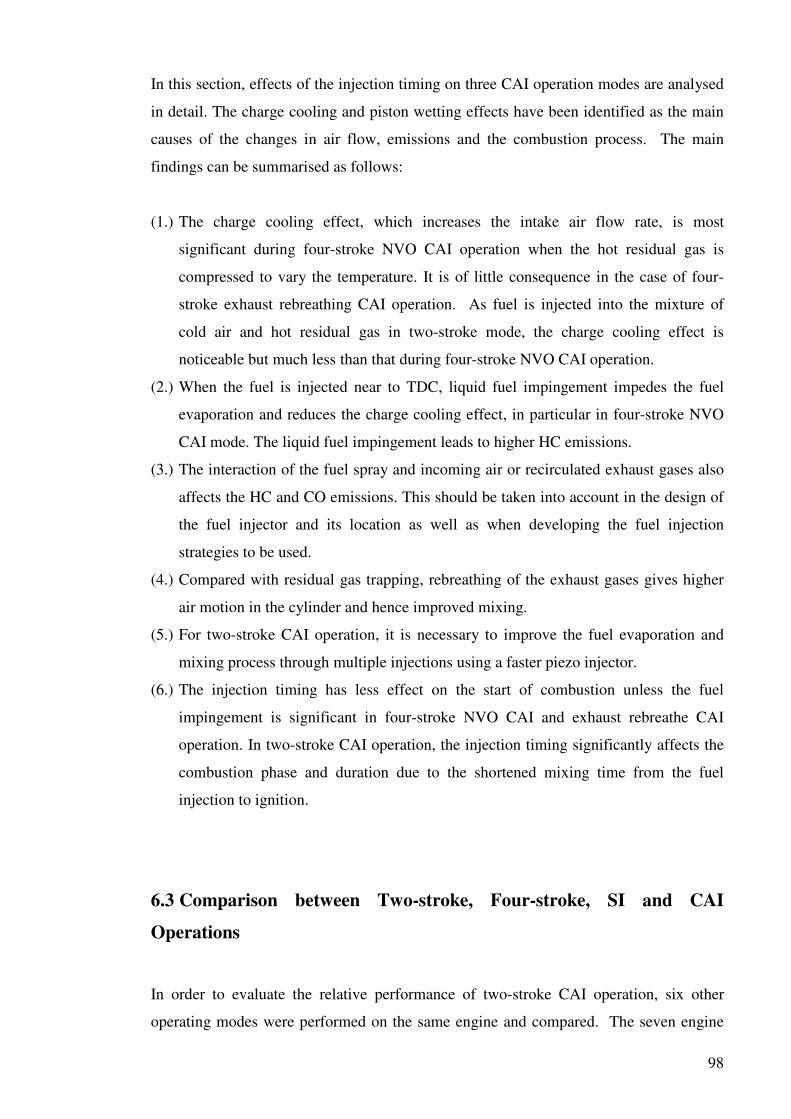
98
In this section, effects of the injection timing on three CAI operation modes are analysed
in detail. The charge cooling and piston wetting effects have been identified as the main
causes of the changes in air flow, emissions and the combustion process. The main
findings can be summarised as follows:
(1.) The charge cooling effect, which increases the intake air flow rate, is most
significant during four-stroke NVO CAI operation when the hot residual gas is
compressed to vary the temperature. It is of little consequence in the case of four-
stroke exhaust rebreathing CAI operation. As fuel is injected into the mixture of
cold air and hot residual gas in two-stroke mode, the charge cooling effect is
noticeable but much less than that during four-stroke NVO CAI operation.
(2.) When the fuel is injected near to TDC, liquid fuel impingement impedes the fuel
evaporation and reduces the charge cooling effect, in particular in four-stroke NVO
CAI mode. The liquid fuel impingement leads to higher HC emissions.
(3.) The interaction of the fuel spray and incoming air or recirculated exhaust gases also
affects the HC and CO emissions. This should be taken into account in the design of
the fuel injector and its location as well as when developing the fuel injection
strategies to be used.
(4.) Compared with residual gas trapping, rebreathing of the exhaust gases gives higher
air motion in the cylinder and hence improved mixing.
(5.) For two-stroke CAI operation, it is necessary to improve the fuel evaporation and
mixing process through multiple injections using a faster piezo injector.
(6.) The injection timing has less effect on the start of combustion unless the fuel
impingement is significant in four-stroke NVO CAI and exhaust rebreathe CAI
operation. In two-stroke CAI operation, the injection timing significantly affects the
combustion phase and duration due to the shortened mixing time from the fuel
injection to ignition.
6.3 Comparison between Two-stroke, Four-stroke, SI and CAI
Operations
In order to evaluate the relative performance of two-stroke CAI operation, six other
operating modes were performed on the same engine and compared. The seven engine

99
operating modes, including: four-stroke throttle-controlled SI, four-stroke intake valve
throttled SI, four-stroke positive valve overlap SI, four-stroke negative valve overlap
CAI, four-stroke exhaust rebreathing CAI, two-stroke CAI and two-stroke SI, were
achieved through different combinations of valve timings and durations Their
performance and emission characteristics were analysed and compared at a typical engine
calibration operating condition of 1500rpm and 3.6bar IMEP in four-stroke or 1.8bar
IMEP in two-stroke.
6.3.1 Operating modes
Figure 6.17 and Table 6.2 shows the valve timings and injection timings used in different
operating modes. In addition, during the four-stroke mode operations, the supercharger
was turned off and the intake air was drawn from ambient. For the two-stroke mode
operations, the compressed air supply from the supercharger was connected to the intake
system to provide the boost air.
Mode 1: Four-stroke throttle-controlled SI mode
This is the conventional spark ignition mode used in the production gasoline engines.
Engine load is controlled by the throttle opening, and its combustion process is initialized
by the spark discharge followed by flame propagation. The engine was operated in this
mode to obtain the baseline data. At part load, the partially closed throttle results in
significant increase in the pumping loss, the main cause for the poor fuel economy of
current SI gasoline engines. In this engine operation mode, the fuel was injected earlier
in the intake stroke to obtain a homogeneous mixture. To prevent wetting the piston
crown, the start of injection timing used in this paper was set to 300 deg. CA before
combustion TDC.
Mode 2: Four-stroke intake valve throttled SI mode
In order to reduce the pumping loss caused by the partially closed intake throttle at part
load, intake valve opening duration can be used to regulate the amount of air into the
cylinder with Wide Open Throttle (WOT). In this work, the intake valve opening (IVO)
was fixed at normal timing and the IVC was varied to throttle the intake air flow.

100
Mode 3: Four-stroke positive valve overlap SI mode
In this case, IVO takes place before TDC and EVC after TDC to create a positive overlap
between the intake and exhaust valve opening periods. As the intake valve opens in the
exhaust stroke, a portion of exhaust gas enters the intake port and will sucked back into
the cylinder in the intake stroke. The exhaust valve closes after TDC so that some
exhaust gas will be sucked back into the cylinder. In this work, the intake and exhaust
valve lifts were reduced to 3mm to avoid contact of the piston and valves around the gas
exchange TDC. The intake throttle was used as the principal means to control the engine
load but it was adjusted to a wider opening position than that of four-stroke throttle-
controlled SI operation in order to inhale the correct amount of air in the cylinder with
the recycled exhaust gas present.
Mode 4: Four-stroke negative valve overlap CAI mode
Another way to obtain internal EGR is to trap a portion of the burnt gas in the cylinder by
earlier closing of the exhaust valve. To minimize backflow the intake valve then opens
later. A negative valve overlap period is formed and the residuals are recompressed
around the gas exchange TDC. In this case, intake air flow rate is dependent on the
amount of the trapped residuals, which can be controlled by varying exhaust valve
closing. Therefore, the throttle can be kept wide open and hence the pumping losses are
reduced. As the exhaust valve closes earlier, the fuel injection timing can be advanced
into the exhaust stroke for better evaporation and atomization. In this work, the start of
fuel injection timing was fixed at 440deg CA before combustion TDC.
Mode 5: Four-stroke exhaust rebreathe CAI mode
Another way to obtain the internal EGR is to secondarily open the exhaust valve during
the intake stroke, so a portion of the exhaust gas can be sucked back into the cylinder
from the exhaust manifold. This increases the challenge to the valve system as the
exhaust valve needs to open twice within one engine cycle. To achieve this valve event,
in this work, the two exhaust valves were actuated individually. One exhaust valve
opened as normal and the other one in the intake stroke. The air flow rate in this mode
was also controlled by the intake valve duration with WOT.

101
Mode 6: Two-stroke CAI mode
When both of the intake and exhaust valves open twice around each BDC within 720 deg.
CA, the engine operation mode becomes two-stroke operation. On the poppet-valve
engine, owing to the characteristic of the incomplete scavenging in two-stroke mode, a
large amount of the residual gases is trapped in the cylinder when the exhaust valve
closes earlier. In this mode the engine load was determined by the boost pressure. Fuel
was injected after the exhaust valve closing and before the intake valve closing for better
mixing through longer mixture preparation period and the interaction between the intake
air and fuel injection. The start of injection timing was set to 140deg CA BTDC.
Mode 7: Two-stroke SI mode
As a basis for comparison, two-stroke SI mode was also studied in this work. It was
realised by extended exhaust period to maximise the scavenging efficiency. Engine load,
similar to two-stroke CAI mode, was also determined by the boost pressure. As less burnt
gas was retained in the cylinder, the boost pressure requirement was reduced at the same
engine load compared to the two-stroke CAI mode.
In order to compare the results in different operating modes, the engine was operated at a
common operating condition of 1500rpm 3.6bar IMEP. All the equations used to
calculate efficiencies are shown in Chapter 3.6. The pressure-volume diagrams at this
load are shown in Figure 6.18 for the seven operating modes.

102
Figure 6.17 Valve Timings and Injection Timings for the 7 Operating Modes
2) 4-stroke Intake valve throttled SI
TDC BDC BDC 1) 4-stroke Throttle-controlled SI
TDC BDC BDC
TDC BDC BDC
3) 4-stroke Positive Valve Overlap SI
TDC BDC BDC
4) 4-stroke Negative Valve Overlap CAI
TDC BDC BDC
5) 4-stroke Exhaust Rebreathe CAI
BDC TDC TDC 6) 2-stroke CAI
BDC TDC TDC
7) 2-stroke SI
Exhaust valve 1
Exhaust valve 2
Intake valve 1
Intake valve 2
Injection Timing

103
Table 6.2 Valve Timings for each Operating Mode
Mode IVO IVC EVO EVC
4strThrSI 5deg
BTDC
0deg
ABDC 10deg BDC 0deg ATDC
4strIVLSI 5deg
BTDC
100deg
BBDC 10deg BDC 0deg ATDC
4strPVOSI 30deg
BTDC
0deg
ABDC 10deg BDC 25deg ATDC
4strNVO 100deg
ATDC
0deg
ABDC 10deg BDC 100deg BTDC
4strReB 5deg
BTDC
80deg
BBDC
Valve1 Valve2 Valve1 Valve2
10deg
BDC
45deg
ATDC
0deg
ATDC
0deg
ABDC
2strCAI 17deg
BBDC
60deg
ABDC 40deg BBDC 12deg ABDC
2strSI 40deg
BBDC
40deg
ABDC 60deg BBDC 60deg ATDC
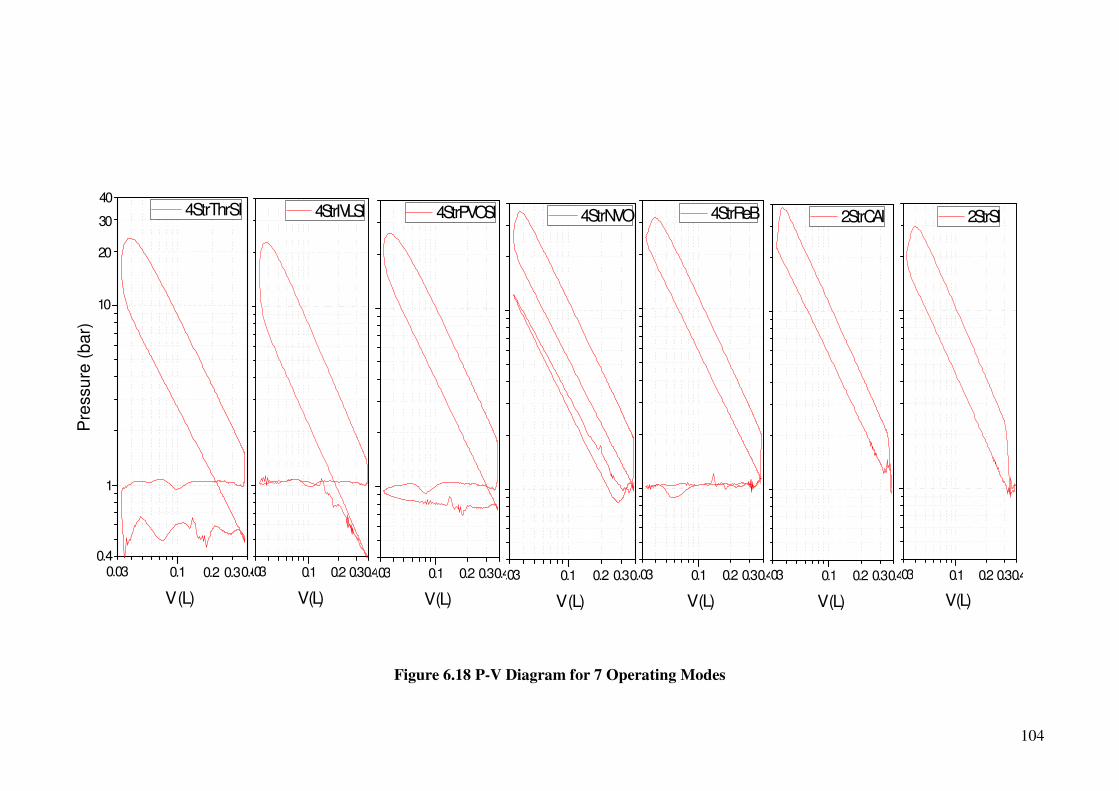
104
0.03
40
30
20
0.2 0.30.40.10.4
1
Pre
ssu
re (
bar)
V (L)
4StrThrSI
10
0.03
40
0.2 0.30.40.10.4
V (L)
4StrIVLSI
0.03
40
0.2 0.30.40.10.4
V (L)
4StrPVOSI
0.03 0.2 0.30.40.1
V (L)
4StrNVO
0.03 0.2 0.30.40.1
V (L)
4StrReB
0.03 0.2 0.30.40.1
V (L)
2StrCAI
0.03 0.2 0.30.40.1
V (L)
2StrSI
Figure 6.18 P-V Diagram for 7 Operating Modes

105
6.3.2 Gas Exchange Efficiency
As mentioned previously, in conventional throttle controlled SI mode, high pumping
work occurs as a vacuum is created in the intake system at part-load due to the partially
closed throttle. To quantify the pumping work in the seven operating modes, PMEP was
calculated from the in-cylinder pressure data during the gas exchange process. As shown
in Figure 6.19, when the throttle is replaced by the intake valve to control the engine load,
PMEP is reduced by 0.2bar, which contributes 4% gain in gas exchange efficiency as
shown in Figure 6.20. The PMEP is further reduced by allowing the exhaust gas to be
sucked back into the cylinder in the four-stroke positive valve overlap SI mode. In four-
stroke negative valve overlap mode, PMEP slightly increases due to the heat loss during
the recompression process. The PMEP of the four-stroke exhaust rebreathe mode is the
lowest because of almost zero intake and exhaust pressure difference. Therefore, the gas
exchange efficiency is nearly 100% in this mode. In two-stroke operation modes, the
pumping loss during the gas exchange process is zero, but the energy consumed by the
supercharger is calculated and included in the Friction Mean Effective Pressure (FMEP)
shown in the section of mechanical efficiency and Brake Specific Fuel Consumption
(BSFC).
4strThrSI 4strIVLSI4strPVOSI 4strNVO 4strReB 2strCAI 2strSI
0.0
-0.1
-0.2
-0.3
-0.4
-0.5
PM
EP
(b
ar)
Mode
Figure 6.19 PMEP of the 7 Operating Modes

106
4strThrSI 4strIVLSI 4strPVOSI 4strNVO 4strReB 2strCAI 2strSI
80
82
84
86
88
90
92
94
96
98
100
GasE
x.E
ffi. (
%)
Mode
Figure 6.20 Gas Exchange Efficiency of the 7 Operating Modes
6.3.3 Combustion Efficiency
Comparison of the combustion efficiency, which is calculated from the fuelling rate and
emissions data, reflects the quality of the mixing and atomization of the fuel in the
cylinder before ignition. From Figure 6.21, it can be seen that the combustion efficiency
of four-stroke intake valve throttled SI is lower than that of the other four four-stroke
modes probably due to the worse atomization in the low in-cylinder temperature caused
by the expansion after the intake valve closing in the intake stroke. In four-stroke exhaust
rebreathe mode, the exhaust gas comes back in the cylinder during the intake stroke. This
upset the air motion and mixing process in the cylinder and made the combustion
efficiency the second lowest in four-stroke modes. Combustion efficiency of the four-
stroke negative valve overlap is the highest because of the better and longer mixing and
atomization since the fuel is injected in the exhaust stroke. The high temperature of the
trapped residual and the recompression process helps mixing and atomization. In two-
stroke SI mode, the combustion efficiency is the lowest due to the shortened time of
evaporation, as the start of injection timing is retarded to 140 deg. CA BTDC. The high
CO emissions, shown in Figure 6.26, in two-stroke mode reflects that diffusion
combustion caused by the poor mixing process takes place in the cylinder. In the case of
two-stroke CAI mode more burnt gas is retained in the cylinder, which gives higher in-

107
cylinder temperature and helps the mixing process. The CO emissions are lower than that
of two-stroke SI mode.
4strThrSI 4strIVLSI4strPVOSI4strNVO 4strReB 2strCAI 2strSI
76
78
80
82
84
86
88
90
92
94
96
98
100
Co
mb
.Effi. (
%)
Mode
Comb.Effi.
Figure 6.21 Combustion Efficiency of the 7 Operating Modes
4strThrSI 4strIVLSI 4strPVOSI 4strNVO 4strReB 2strCAI 2strSI
1
10
100
ISC
O, IS
HC
(g
/kw
h)
Mode
ISCO
ISHC
Figure 6.22 ISCO and ISHC of the 7 Operating Modes

108
6.3.4 Thermodynamic Efficiency
Figure 6.23 shows the gross indicated thermodynamic efficiency of the seven modes,
which is calculated from the ratio of the gross work in the compression and expansion
stroke to the heat released from the combustion process. A lot of factors can affect the
thermodynamic efficiency of the internal combustion engine. In this work, it’s mainly
determined by the effective compression ratio, expansion ratio, combustion phase and
duration, specific heat ratio and heat transfer to the wall. The results show very similar
thermodynamic efficiencies between four-stroke throttle controlled SI and intake valve
throttled SI mode, since their combustion phase and duration are almost identical as
shown in Figure 6.24. In four-stroke positive valve overlap SI mode, the presence of
burnt gas slows down the flame propagation speed and hence the lower thermodynamic
efficiency. Figure 6.24 also shows that the combustion duration of four-stroke negative
valve overlap CAI and exhaust rebreathe CAI modes are shorter than that of four-stroke
SI mode, which tends to increase the thermodynamic efficiency of such operating modes
as the heat addition process becomes akin to the constant volume process. In addition,
low combustion temperature in the CAI modes also contributes to the high
thermodynamic efficiencies seen for such operations.
In two-stroke mode, the low thermodynamic efficiency is mostly caused by the low
effective expansion ratio due to the early opening of the exhaust valves. This suggests
that it may be possible to improve the thermodynamic efficiency of this two-stroke mode
by increasing the expansion process through retarded exhaust valve opening. Such
change may not be desirable for the SI combustion due to the deteriorating scavenging
process but it could be implemented for CAI combustion which relishes the presence of
hot residual gases.

109
4strThrSI 4strIVLSI4strPVOSI 4strNVO 4strReB 2strCAI 2strSI
33
34
35
36
37
38
39
40
Therm
odynam
ic E
ffic
iency (%
)
Mode
Figure 6.23 Gross Indicated Thermodynamic Efficiency of the 7 Operating Modes
4 s trT h rS I 4 s trIV L S I 4 s trP V O S I 4 s trN V O 4 s trR e B 2 s trC A I 2 s trS I
-5
0
5
1 0
1 5
2 0
2 5
3 0
3 5
4 0
CA
10
, C
A5
0, C
A9
0,
Co
mb
. D
ura
. (d
eg
CA
)
M o d e
C A 1 0
C A 5 0
C A 9 0
C o m b _ d u ra
Figure 6.24 CA10, CA50, CA90 and Combustion Duration of the 7 Operating
Modes
6.3.5 Net Indicated Efficiency

110
Combining the efficiencies above, the net indicated efficiency can be worked out and
their values are shown in Figure 6.25. Figure 6.26 shows the ISFC of the seven operating
modes, which is calculated from the ratio of fuelling rate to the indicated power.
In four-stroke modes, the net indicated efficiency of throttle controlled SI is the lowest
due to the high pumping loss and low thermal efficiency, hence the higher fuel
consumption. Intake valve throttled SI mode increases the net indicated efficiency by less
than 1% at this operating condition since the reduced pumping work is offset by the
reduction in the combustion efficiency. With reduced pumping loss, four-stroke positive
valve overlap SI mode exhibits the same indicated efficiency as four-stroke negative
valve overlap mode. Four-stroke CAI operation with exhaust rebreathing shows the
highest net indicated efficiency and thus the lowest fuel consumption, due to the absence
of pump loss and faster combustion.
In two-stroke CAI mode, the indicated efficiency is higher than that of the four-stroke
throttle control SI and intake valve throttled SI due to reduced pumping loss. Two-stroke
SI has the lowest indicated efficiency of the seven operating modes due to its low
combustion efficiency and thermodynamic efficiency.
4strThrSI 4strIVLSI4strPVOSI 4strNVO 4strReB 2strCAI 2strSI
26
27
28
29
30
31
32
33
34
35
36
Ind
icate
d E
ffic
ien
cy (
%)
Mode
Figure 6.25 Indicated Efficiency of the 7 Operating Modes

111
4strThrSI 4strIVLSI 4strPVOSI 4strNVO 4strReB 2strCAI 2strSI
230
240
250
260
270
280
290
300
310 +9%
-4%
-14%
-6%-6%
-2%IS
FC
(g
/KW
h)
Mode
Baseline
Figure 6.26 ISFC of the 7 Operating Modes
6.3.6 Emissions
CO and HC emission have been shown in Figure 6.22. From the emission data, we can
see CAI combustion generates similar CO or HC emissions to those of SI operations.
High CO and HC emissions are mainly caused by the poor mixing or substantial
diffusion combustion from any liquid fuel film on the piston crown. It is noted that as the
injection takes place earlier CO emissions tend to fall due to the longer mixing period.
There is no obvious evidence in fuel short-circuiting in the two-stroke modes as was the
case of conventional port injected two-stroke engine operations.
From the NOx emissions data shown in Figure 6.27, it can be seen that compared with
conventional throttle controlled SI combustion four-stroke intake valve throttled SI
combustion produces slightly lower NOx emissions owing to the lower in-cylinder
temperature caused by the Miller cycle. With the dilution of burnt gas in four-stroke
positive valve overlap SI, negative valve overlap CAI and exhaust rebreathe CAI, the
NOx emissions can be significantly reduced. In two-stroke SI mode, the NOx is less than
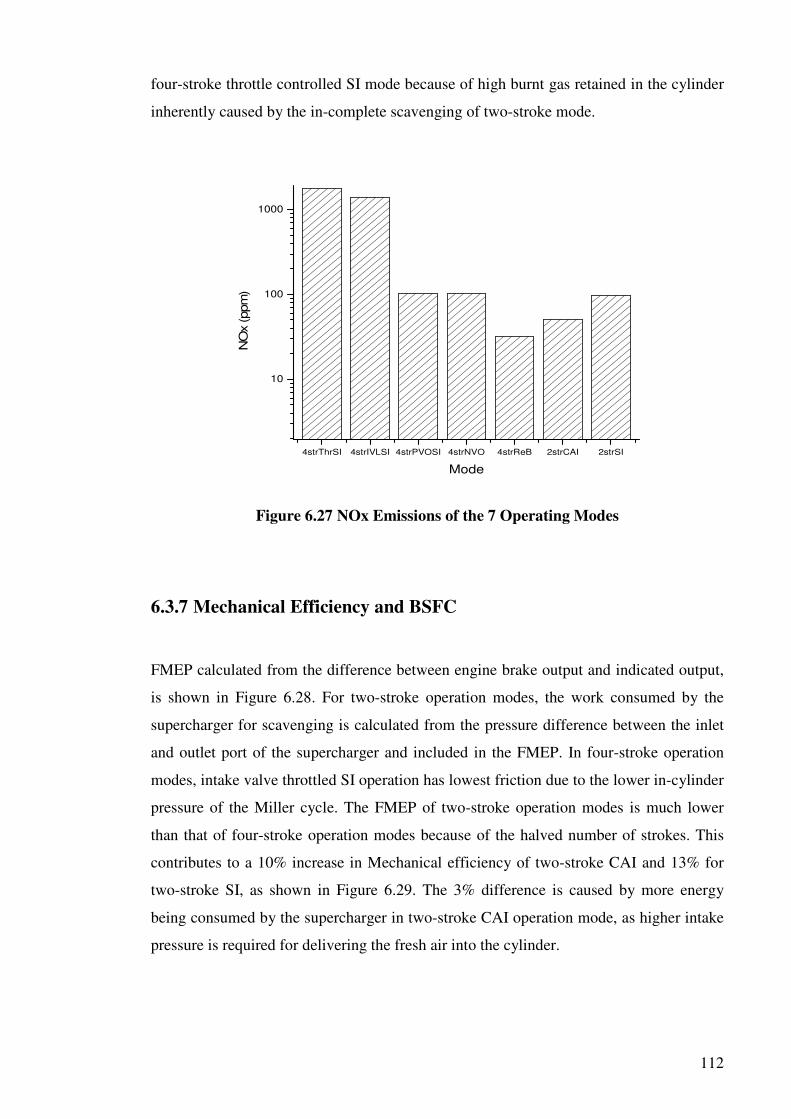
112
four-stroke throttle controlled SI mode because of high burnt gas retained in the cylinder
inherently caused by the in-complete scavenging of two-stroke mode.
4strThrSI 4strIVLSI 4strPVOSI 4strNVO 4strReB 2strCAI 2strSI
10
100
1000
NO
x (ppm
)
Mode
Figure 6.27 NOx Emissions of the 7 Operating Modes
6.3.7 Mechanical Efficiency and BSFC
FMEP calculated from the difference between engine brake output and indicated output,
is shown in Figure 6.28. For two-stroke operation modes, the work consumed by the
supercharger for scavenging is calculated from the pressure difference between the inlet
and outlet port of the supercharger and included in the FMEP. In four-stroke operation
modes, intake valve throttled SI operation has lowest friction due to the lower in-cylinder
pressure of the Miller cycle. The FMEP of two-stroke operation modes is much lower
than that of four-stroke operation modes because of the halved number of strokes. This
contributes to a 10% increase in Mechanical efficiency of two-stroke CAI and 13% for
two-stroke SI, as shown in Figure 6.29. The 3% difference is caused by more energy
being consumed by the supercharger in two-stroke CAI operation mode, as higher intake
pressure is required for delivering the fresh air into the cylinder.

113
4strThrSI 4strIVLSI4strPVOSI 4strNVO 4strReB 2strCAI 2strSI
-0.5
-0.6
-0.7
-0.8
-0.9
-1.0
-1.1
-1.2
-1.3
-1.4
FM
EP
(b
ar)
Mode
Figure 6.28 FMEP of the 7 Operating Modes
4strThrSI 4strIVLSI4strPVOSI 4strNVO 4strReB 2strCAI 2strSI
50
55
60
65
70
75
80
Mech
.Effi. (
%)
Mode
Figure 6.29 Mechanical Efficiency of the 7 Operating Modes
Figure 6.30 shows the BSFC in the seven operating modes, which is calculated from the
ratio of the fuelling rate to the brake power obtained from the engine crankshaft. This
reflects the total fuel consumption after taking the friction loss and the supercharger
power into account. Now the two-stroke CAI operation mode has the best fuel economy
and reduces the fuel consumption by 19% compared with four-stroke throttle controlled
SI operation mode.
114
4strThrSI 4strIVLSI4strPVOSI 4strNVO 4strReB 2strCAI 2strSI
280
300
320
340
360
380
400
420
440
460
-9.9%
-19%
-11.9%
-4.9%-6.5%
-2.7%
BS
FC
( g
/kW
h )
Mode
Baseline
Figure 6.30 BSFC of the 7 Operating Modes
The main findings of this section can be summarised as follows:
1. Four-stroke throttle controlled SI operating mode has the highest pumping loss due
to the partially closed throttle. Four-stroke exhaust rebreathe CAI operating mode
has the lowest pumping loss because of recirculating the exhaust gases during the
intake stroke.
2. Four-stroke throttle controlled SI, positive valve overlap SI and NVO CAI have the
higher combustion efficiency. Two-stroke SI has the lowest combustion efficiency.
3. Four-stroke exhaust rebreathe CAI has the highest indicated efficiency due to the
lowest pumping losses and higher thermodynamic efficiency caused by the shorter
combustion duration. Two-stroke SI has the lowest indicated efficiency due to the
low combustion efficiency and thermodynamic efficiency.
4. Two-stroke operating modes produce more CO emissions due to shortening the
mixing process. Without the dilution of exhaust gases, four-stroke throttle controlled
SI and intake valve throttled SI combustion produce more NOx emission.
5. Two-stroke CAI operating mode provides the lowest fuel consumption due the low
friction loss.

115
6.4 Summary
In this chapter, the effect of direct fuel injection timing on engine performance,
combustion and emissions was investigated in 3 CAI operating modes. The charge
cooling effect of direct fuel injection is most significant during four-stroke NVO CAI
operation. Its effect is also noticeable in two-stroke CAI operation but negligible in four-
stroke exhaust rebreathing CAI operation. The injection timing has less effect on the
start of combustion unless the fuel impingement is significant in the four-stroke NVO
CAI and exhaust rebreathe CAI operation. In the two-stroke CAI operation, the injection
timing significantly affects the combustion phasing and duration due to the shortened
mixing time from the fuel injection to ignition.
For further estimating two-stroke CAI operation, 7 operating modes were performed on
the same engine, including either two-stroke or conventional four-stroke engine
operations. It is found that the two-stroke CAI operation mode incurs the lowest fuel
consumption at the part-load condition tested.
116
Chapter 7
Ethanol Blends CAI in Two-stroke Operation

117
Chapter 7 Ethanol Blends CAI in Two-stroke Operation
7.1 Introduction
In this chapter, CAI combustion with ethanol blended gasoline is demonstrated over
different engine speed and load conditions in the two-stroke poppet valve DI engine.
Detailed analysis of effect of ethanol on combustion process, emissions and efficiencies
are performed and presented when the engine was operated with measured exhaust
lambda at 1.0.
7.2 Ethanol Content Effects on CAI Combustion and Emissions
In order to compare the results between burning pure gasoline and ethanol blended
gasoline, the engine test conditions were kept the same as that explained in Chapter 5.
The experiments were performed with E15 (15% ethanol in gasoline by volume) and E85
(85% ethanol in gasoline by volume) while the valve timings, boost pressure, injection
timing, and spark timing were all kept the same, only the injection duration were changed
to keep the exhaust lambda 1.0 while injecting ethanol blended fuels.
First of all, the ethanol content effect on CAI combustion process was investigated.
Figure 7.1 shows 50% mass fraction burnt crank angle (CA50) as a function of the
engine load, IMEP, at 2000rpm with gasoline, E15 and E85. It can be seen that the
combustion phase was retarded with increasing engine load in most cases. As explained
previously, load in the two-stroke CAI operation was determined by the scavenging rate.
As the load increased, there was more fresh charge but less residual gas trapped, resulting
in the lower in-cylinder temperature. Therefore, the start of autoignition combustion was
delayed until the charge temperature was compressed to the autoignition temperature. At
the highest load conditions, autoignition could not start and spark ignition was introduced
at 8 deg after TDC to initiate the combustion process. At the low load conditions, the
start of combustion for E15 and E85 advanced slightly as the load was changed from 1
bar IMEP to 2 bar IMEP. At such low load, the largest amount of burned gas was
trapped and the burned gas temperature was at their lowest value. In addition, there was a
relative large percentage of unburned or partially burned fuel in the trapped charge which

118
could contribute to the autoignition chemistry leading to the start of the high temperature
combustion reactions. Since the autoignition process is affected by the charge dilution,
temperature, and chemical species in the cylinder charge, the small changes observed
could have been caused by any of these factors.
As shown in Figure 7.2, the combustion duration of all three fuels initially decreased
with load due to smaller dilution effect by the reduced amount of burned gas trapped in
the cylinder at higher load. Beyond 4.2 bar IMEP, E15 and E85 showed increased
combustion duration. At such high load conditions, spark ignition was critical to initiate
the combustion process in the form of flame propagation. Because of the relatively high
temperature of the end gas region, multiple autoignition combustion would take place in
conjunction with the flame propagation. This can be illustrated by the mass fraction
burned curves at 4.2 bar and 6.6 bar IMEP values for E85 plotted in Figure 7.3. It can be
seen that the heat release process is characterised by a relatively slow first part and then
followed by a faster second part. As previous studies have shown [93, 94], the two stage
heat release process was a result of the hybrid combustion of flame propagation and
multiple autoignition burning in the spark assisted CAI region. As the load increased
beyond 4.2 bar IMEP, flame propagation became dominant over the multiple autoignition
combustion and accounts for a greater part of the combustion and heat release process,
resulting in an increase in the overall combustion duration.
0 1 2 3 4 5 6 7 80
2
4
6
8
10
12
14
CA
50 [de
g C
A]
IMEP [bar]
Gasoline
E15
E85
Figure 7.1 CA50 in Two-stroke CAI Operation at 2000rpm

119
0 1 2 3 4 5 6 7 8
8
12
16
20
24
CA
10
-90
[d
eg
CA
]
IMEP [bar]
Gasoline
E15
E85
Figure 7.2 CA10-90 in Two-stroke CAI Operation at 2000rpm
-30 -20 -10 0 10 20 30 40 50 600
10
20
30
40
50
IMEP = 6.6 bar
He
at
Re
lea
se
Rate
[J/d
eg
CA
]
Crank Angle [deg ATDC]
Heat Release Rate
0
20
40
60
80
100
Mass Fraction Burnt
Ma
ss F
ractio
n B
urn
t [%
]
0
10
20
30
40
50
IMEP = 4.2 bar
0
20
40
60
80
100
Figure 7.3 Heat Release Rate and Mass Fraction Burnt of E85 at 2000rpm
Figure 7.4 shows the unburned hydrocarbon (uHC) emissions as a function of engine
output at 2000rpm. The presence of ethanol reduced the uHC emissions throughout the
load range. E85 produced about 50% less uHCs than gasoline due to the oxygen in the
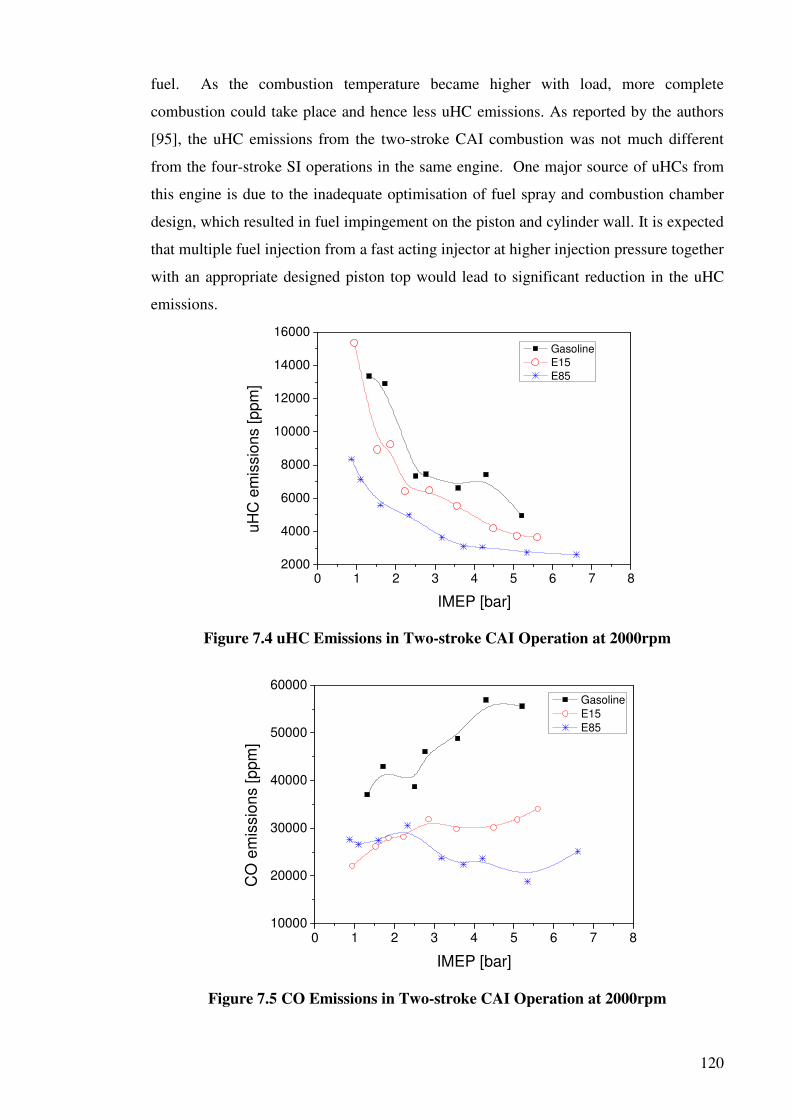
120
fuel. As the combustion temperature became higher with load, more complete
combustion could take place and hence less uHC emissions. As reported by the authors
[95], the uHC emissions from the two-stroke CAI combustion was not much different
from the four-stroke SI operations in the same engine. One major source of uHCs from
this engine is due to the inadequate optimisation of fuel spray and combustion chamber
design, which resulted in fuel impingement on the piston and cylinder wall. It is expected
that multiple fuel injection from a fast acting injector at higher injection pressure together
with an appropriate designed piston top would lead to significant reduction in the uHC
emissions.
0 1 2 3 4 5 6 7 82000
4000
6000
8000
10000
12000
14000
16000
Gasoline
E15
E85
uH
C e
mis
sio
ns [ppm
]
IMEP [bar]
Figure 7.4 uHC Emissions in Two-stroke CAI Operation at 2000rpm
0 1 2 3 4 5 6 7 810000
20000
30000
40000
50000
60000
CO
em
issio
ns [p
pm
]
IMEP [bar]
Gasoline
E15
E85
Figure 7.5 CO Emissions in Two-stroke CAI Operation at 2000rpm

121
The CO emission results in Figure 7.5 show that E15 and E85 fuels produce less CO
emissions, particularly at high load conditions, because of the more effective oxidation
reactions of oxygenated ethanol. It is noted that gasoline produced significantly more CO
at higher load whilst the CO emissions from E15 and E85 fuels remained relatively
insensitive to the load. In order to explain the results, it is necessary to understand the air
short-circuiting and its effect on in-cylinder air/fuel ratio. As described in Chapter 5,
there was an overlap period between the intake process and exhaust process in the two-
stroke CAI mode operation. During this overlap period, it is likely that a fraction of air
could flow directly out of the exhaust valves, a phenomenon known as air short-
circuiting. As shown in Figure 5.8, the short-circuiting rate increased with the engine
load or boost pressure, combustion took place with richer fuel and air mixture at higher
load, resulting in higher CO emissions with gasoline as shown in Figure 7.5. When
ethanol was introduced, the stoichiometric air to fuel ratio decreased. Hence less air at
lower boost pressure was needed, reducing the short-circuiting rate. At low loads, the
effect of ethanol on improving CO emissions becomes less significant because of the
lower short-circuiting rate and lower combustion temperature of ethanol.
Figure 7.6 shows the NOx emissions in the two-stroke CAI operation fuelled with
gasoline, E15 and E85 at an engine speed of 2000rpm. E85 reduced NOx emissions at
high loads mainly due to the cooling effect of ethanol. However, this effect became less
significant at low loads as the combustion temperature and NOx emission were very low
(less than 100ppm).
0 1 2 3 4 5 6 7 80
50
100
150
200
250
300
NO
x e
mis
sio
ns [ppm
]
IMEP [bar]
Gasoline
E15
E85
Figure 7.6 NOx Emissions in Two-stroke CAI Operation at 2000rpm

122
7.3 Ethanol Content Effects on Two-stroke CAI Operating Range
The load-speed operating range of two-stroke pure CAI of gasoline, E15 and E85 was
investigated when the exhaust lambda was set to 1.0. The operating ranges of CAI
combustion are shown in Figure 7.7. The engine speed was varied from 800rpm to
3000rpm, and the load was varied from the minimum to the maximum by adjusting the
intake pressure. With the same valve timings, by increasing the intake pressure, more
fresh air is inducted and more exhaust gases are displaced, resulting higher power output.
The pure CAI operation is defined as operational conditions where spark ignition doesn’t
have any effect on the combustion phase. At low load operation, the boost pressure was
lower, less exhaust gas was scavenged. The very high residual gas fraction led to
unstable combustion and misfire, which limited the operation range at low load boundary.
It is noted that at low speed, the more ethanol was blended in the gasoline, the more
difficult the mixture could get auto ignited due to the low mixture temperature caused by
the charge cooling effect of ethanol injection. Therefore, the low load boundary of E85
occurred at higher IMEP values than that of gasoline and E15 at 800rpm. When the
engine speed increased, the difference in the low load CAI limits between gasoline and
its mixture with ethanol disappeared because of the reduced heat loss and higher thermal
loading at higher engine speeds.
500 1000 1500 2000 2500 30000
1
2
3
4
5
6
7
8
9
Gas exchange limit
Knock limit
Misfire limit
Gasoline
E15
E85
IME
P [bar]
Speed [rpm]
Pure CAI
Figure 7.7 Operating Range of Two-stroke CAI Fuelled with Gasoline, E15 and E85

123
At 1000 rpm, when IMEP was over 5.3bar, combustion became very rapid and the rate of
pressure rise exceeded the pre-defined knock limit of 5bar/CA. This is because the
combustion process was accelerated due to the higher in-cylinder temperature and less
dilution of the residual gases at higher load conditions, as shown in Figure 7.8. It can be
seen that the knock limit was extended by 0.7bar to 6.2 bar IMEP when blending 15%
ethanol in gasoline. E85 further extended the load range by 3bar to 8.5 bar IMEP. This is
a result of slower heat release rate of ethanol than gasoline, as shown in Figure 7.9. In the
case of gasoline, the upper load boundary moved up slightly as the engine speed was
changed from 800rpm to 1000rpm, as to be explained later.
-180 -120 -60 0 60 120 1800
10
20
30
40
In-c
ylin
der
Pre
ssure
[bar]
Crank Angle [deg ATDC]
IMEP 1.15bar
IMEP 3.24bar
IMEP 5.29bar
1000rpm
Exhaust Lambda 1
Gasoline
0
20
40
60
80
100
IMEP 1.15bar
IMEP 3.24bar
Heat R
ele
ase R
ate
[J/d
eg C
A]
IMEP 5.29bar
Figure 7.8 In-cylinder Pressure and Heat Release Rate at 1000rpm and Different
Loads
-30 -20 -10 0 10 20 30 40 50 600
10
20
30
40
50
60
Heat R
ele
ase R
ate
[J/d
eg C
A]
Crank Angle [deg ATDC]
Gasoline
E15
E85
1000rpm
IMEP 5.3bar
Exhaust Lambda 1
Figure 7.9 Heat Release Rate of Gasoline, E15 and E85 at 1000rpm and 5.3bar
IMEP

124
For all three fuels, it is noted that the upper load limits would fall with the engine speed.
For gasoline and E15, this occurred at 2000rpm and 1500rpm respectively, whilst E85
fuel exhibited continued decrease in the upper load limit of CAI operation with the
engine speed. This can be explained by the flow characteristics of the camless valve
actuation system. Because the valves were operated independently from the engine’s
own rotation by the electro-hydraulic actuation, for a given intake and exhaust valve
profile, the valve opening durations remained constant in mille-seconds but they became
less in terms of crank angles as the engine speed increased. In addition, due to the finite
opening and closing speeds of the electro-hydraulic valves, the valves could not reach
their maximum lift at 1500rpm and above in the two-stroke mode. Although the valve
durations were increased at higher engine speed operations to compensate for the
reduction in the air flow rate caused by the reduced valve lift as shown in Figure 5.2, it is
still not sufficient for the high load operation. This resulted in the gas exchange limit at
higher speeds on the CAI operating range. Because ethanol has a lower stoichiometric air
fuel ratio than gasoline, the addition of ethanol reduced the amount of air required for
combustion and hence could produce more output for the same amount of air trapped in
the cylinder than gasoline. This is illustrated by the air flow rate values for gasoline
(Figure 7.10a), E15 (Figure 7.10b), and E85 (Figure 7.10c). Therefore, at 3000rpm, E15
extended the gas exchange limit by half bar IMEP and E85 1.5bar IMEP, compared with
gasoline CAI operating range.
a) Gasoline b) E15
0.1 0.1
0.15
0.15
0.2
IME
P [
bar]
Speed [rpm]
500 1000 1500 2000 2500 30000
2
4
6
8
0.05
0.1 0.1
0.15 0.15
0.2
IME
P [
bar]
Speed [rpm]
500 1000 1500 2000 2500 30000
2
4
6
8

125
c) E85
Figure 7.10 Air Flow Rate [g/cycle] over Two-stroke CAI Operating Range
7.4 Ethanol Content Effects on Efficiencies of Two-stroke CAI
Operation
In order to compare the fuel economy and take into account of the different calorific
values of gasoline and ethanol, combustion efficiency, thermodynamic efficiency and
indicated fuel conversion efficiency are calculated and analysed for gasoline and its
blends with ethanol.
Figure 7.11 shows their combustion efficiency values in the two-stroke CAI operation at
2000rpm. It can be seen that the combustion efficiency is relatively low on this engine
due to the rich air/fuel mixture in the cylinder caused by the short-circuiting of the air
and non-optimized injection system, as mentioned above. However, compared with
gasoline, the combustion efficiency was improved by 3-5% by blending 15% ethanol in
the gasoline. Further increasing ethanol concentration to 85% in the fuel could further
improve the combustion efficiency at high load operation, but at low load operation the
low temperature of the mixture caused by the higher latent heat value of ethanol led to
lower combustion efficiency. This is also reflected by the higher CO emissions of E85 at
low load shown in Figure 7.5.
0.05
0.1 0.1
0.150.15
0.2 0.2
0.25
IME
P [
bar]
Speed [rpm]
500 1000 1500 2000 2500 30000
2
4
6
8

126
0 1 2 3 4 5 6 7 870
75
80
85
90
95
100
Co
mb
ustio
n E
ffic
ien
cy [
%]
IMEP [bar]
Gasoline
E15
E85
Figure 7.11 Combustion Efficiency in Two-stroke CAI Operation at 2000rpm
The best thermodynamic efficiency was obtained with E85 at high load operation, shown
in Figure 7.12. This was the result of optimised combustion phasing as shown in Figure
7.1 and reduced heat loss during the combustion process because of the lower charge and
combustion temperature of ethanol. The presence of ethanol had little effect at low load
operations.
0 1 2 3 4 5 6 7 825
30
35
40
45
50
Th
erm
odyna
mic
Effic
iency [%
]
IMEP [bar]
Gasoline
E15
E85
Figure 7.12 Thermodynamic Efficiency in Two-stroke CAI Operation at 2000rpm

127
Figure 7.13 shows the combined effect of combustion efficiency and thermal efficiency,
as measured by the indicated fuel conversion efficiency. At 5bar IMEP and 2000rpm, the
indicated efficiency can be improved by 5% with E85 and 2% with E15.
0 1 2 3 4 5 6 7 820
25
30
35
40
Indic
ate
d E
ffic
iency [%
]
IMEP [bar]
Gasoline
E15
E85
Figure 7.13 Indicated Fuel Conversion Efficiency in Two-stroke CAI Operation at
2000rpm
7.5 Summary
In this Chapter, CAI combustion of gasoline with ethanol was suited over a wide range of
speed and load when the exhaust lambda was set to 1.0. Their combustion and heat
release characteristics, emissions, and their combustion and thermodynamic efficiencies
were determined and analysed. The results show that
(i) The presence of ethanol allowed CAI combustion to be extended to higher load
conditions. In the case of E85 the maximum IMEP of 8.4bar was obtained at
800rpm. Further improvement in the high load range at higher engine speeds can
be achieved with a faster camless system or mechanical camshafts.
(ii) CO, uHC and NOx emissions are significantly reduced by injecting ethanol
blended fuels. E85 has greater effect on the emission reduction than E15.

128
(iii)Both combustion efficiency and thermodynamic efficiency are improved by the
presence of ethanol because of the optimum combustion phasing and lower heat
loss. E85 improved indicated fuel conversion efficiency by over 5% at 2000rpm.

129
Chapter 8
Lean Boost CAI Operation

130
Chapter 8 Lean Boost CAI Operation
8.1 Introduction
One of the key issues associated with the two-stroke cycle is the short-circuiting
phenomenon, in which some of the intake air or air fuel mixture can flow directly into the
exhaust port during the scavenging process [95]. Although the fuel short-circuiting issue
can be solved by direct fuel injection into the cylinder, the air short-circuiting cannot be
completely eliminated. The short-circuited air can skew the reading of the lambda sensor
in the exhaust pipe, resulting in an enriched in-cylinder air and fuel mixture. In order to
correct for the over-rich mixture combustion, further engine experiments were conducted
without the constraint of constant lambda value measured in the engine exhaust.
In this Chapter, the engine performance, combustion and emission characteristics with
the lean boost strategy will be presented and analysed. The effect of valve timing on
residual gas fraction, in-cylinder lambda, effective expansion ratio, and effective
compression ratio is discussed. The effect of ethanol content on CAI combustion is given.
Significant improvements in combustion efficiency and fuel conversion efficiency as
well as large reductions in CO and uHC emissions are achieved by lean boost and
optimised valve timings.
8.2 Intake Pressure Effects on In-cylinder Lambda and Trapping
Efficiency
In order to achieve the two-stroke cycle operation, compressed air is required to achieve
the scavenging process during the valve overlap period. Figure 8.1 shows the intake
pressure values for exhaust lambda 1 and lean boost CAI operations as well as their
operational range. At each engine speed the engine load was varied from low to high by
increasing the intake pressure and hence the scavenging rate in the two-stroke engine
operation. The two-stroke CAI combustion was achieved over the engine speed range
from 800 rpm to 3000rpm. The CAI combustion is enveloped by 3 limits, (i) the knock
limit on the low speed high load boundary on the top left region, (ii) the gas exchange
limit on the high speed and high load boundary in the top right region, and (iii) the
misfire limit on the low load boundary at the bottom. The knock limit is defined by the

131
threshold of the in-cylinder pressure rise rate. According to [92], the maximum rate of
pressure rise dP/dCA was limited to 5bar/CA in order for the engine to operate with
similar noise levels to the production gasoline engine. The misfire limit is defined by the
operation condition when the engine operation became intermittent due to large number
of misfiring cycles. It should be pointed out that the maximum IMEP on this two-stroke
engine with CAI operation is 7.8bar at 1500rpm, which is equivalent to 15.6 bar IMEP
on the four-stroke engine.
Because the valves were operated independently from the engine’s own rotation by the
electro-hydraulic actuation, for a given intake and exhaust valve profiles, the opening
durations remained constant in milliseconds but the number of crank angles became less
as the engine speed increased. In addition, due to the finite opening and closing speeds of
the electro-hydraulic valves, the valves could not reach their maximum lift at 1500rpm
and above in the two-stroke mode. Although the valve durations were increased at higher
engine speed operations to compensate for the reduction in the air flow rate caused by the
reduced valve lift, it is still not sufficient for the high load operation. This is the main
cause to the presence of the gas exchange limit formed on the operating range envelop.
The engine load was regulated by the intake pressure in both the exhaust lambda 1 mode
and lean boost mode. The boost pressure in the lean boost mode was selected at each
operating point to give the minimum indicated fuel consumption. As Figure 8.1 shows,
higher intake pressure was required in the lean boost mode in order to allow more
exhaust gas to be scavenged. In addition, the difference in intake pressures between the
exhaust lambda 1 mode and lean boost operation becomes more pronounced at higher
load. For example, the intake pressure difference at 1000rpm 2bar IMEP was about
0.25bar and it increased to 0.77bar at 7bar IMEP. This can be understood by considering
the results shown in Figure 8.2, which shows the effect of boost pressure on the
scavenging efficiency, residual gas fraction, and in-cylinder and exhaust Lambda values
during the lean boost operations at 1000rpm. It can be seen that higher boost reduced the
residual gas fraction and hence resulted in better scavenging process. But the
improvement in the scavenging process was achieved at the expense of reduced trapping
efficiency and higher air short-circuiting rates. As a result, the lambda measured in the
exhaust increased from 1.08 to 1.7 whilst the lambda in the cylinder remained at slightly
richer than 1 when the intake pressure was increased from 1.2 bar to 2.2 bar.

132
a) Exhaust lambda 1 b) Lean boost
Figure 8.1 CAI Operating Range and Intake Pressure Contours
Figure 8.2 Effect of Intake Pressure on the Scavenging Process with Lean Boost at
1000rpm
Since the boost pressure was adjusted for best fuel conversion efficiency at each
operating point, the in-cylinder lambda values were not directly controlled but
determined by the boost pressure and the trapping efficiency. It can be seen in Figure 8.3
that the in-cylinder lambda values throughout the operating range were all close to one
whilst the exhaust lambda value increased with load due to higher air short-circuiting
1.0
51.1
1.1
1.2
1.2
1.2
1.3
1. 3
1.3
1.4
1.4
1.4
1.5
1.5
IME
P [
bar]
Speed [rpm]
Intake Pressure [bar]
500 1000 1500 2000 2500 30000
2
4
6
8
1.3
1.3
1.5
1.5
1.7
1.7
1.9
1.9
2.1
2.1
2.3
IME
P [
bar]
Speed [rpm]
Intake Pressure [bar]
500 1000 1500 2000 2500 30000
2
4
6
8
1.2 1.4 1.6 1.8 2.0 2.240
50
60
70
80
90
100
Tra
ppin
g E
ffic
ien
cy ,
Resid
ual G
as F
ractio
n [
%]
Intake Pressure [bar]
Trapping Efficiency
Residual Gas Fraction
1000 rpm
0.8
1.0
1.2
1.4
1.6
1.8
2.0 Exhaust Lambda
In-cylinder Lambda
Exh
au
st
Lam
bda
, In
-cylin
der
La
mbd
a
knockinflow restriction
misfire

133
rates. In addition, it is noted that the best fuel conversion efficiency at the low speed and
low load region was obtained with slightly fuel rich mixtures, which provided better
ignitibility and faster combustion speed in order to maintain combustion stability and
reduce the cycle to cycle variation. At higher load operations, combustion noise became
the major issue due to earlier and faster heat release rate. In order to retard the
combustion phase and reduce the combustion speed, the in-cylinder lambda was set
slightly greater than 1 as a trade-off between the thermodynamic efficiency and
combustion noise.
a) In-cylinder lambda b) Exhaust lambda
Figure 8.3 In-cylinder Lambda and Exhaust Lambda Values of Lean Boost
Operations
8.3 The Effects of Valve Timing on Two-stroke Lean Boost CAI
The initial and boundary conditions of CAI combustion are determined by the gas
exchange process and subsequent mixing process in the compression stroke in the two-
stroke engine. Apart from pressure difference between engine inlet and exhaust ports,
valve timings also strongly affect the gas exchange process. In order to understand the
how the initial and boundary conditions affect CAI combustion, the effects of valve
timing were investigated at three typical operating conditions: IMEP=2.2bar at low load
boundary of CAI, IMEP=5.0bar at middle load condition of pure CAI, IMEP=7.8bar at
high load boundary of spark-assisted CAI. The other engine operating parameters are
given in Table 8.1. It can be seen in this table that the exhaust lambda increased with load
due to the air short-circuiting issue explained previously. At high load, the valve timing
0.9
8
0.9
8 0.9
8
0.9
8
1
1
1
1
1.0
2
1.02
1.02
1.02
1.0
5
1.05
1.05
1.05
IME
P [
bar]
Speed [rpm]
In-cylinder Lambda
500 1000 1500 2000 2500 30000
2
4
6
8
1.2
1.2
1.2
1.3
1.3
1.4
1.4
1.4
1.5
1.5
1.5
1.5
1.6
1.6
1.6
1.6
1.7
IME
P [
bar]
Speed [rpm]
Exhaust Lambda
500 1000 1500 2000 2500 30000
2
4
6
8

134
variable range is smaller than that at low load because valve timings have more impact
on gas exchange process at higher intake pressure and the CAI combustion is more
sensitive to lambda, where lowering lambda would cause knocking combustion and
higher lambda would lead to misfire.
Table 8.1 Operating Parameters for Valve Timing Effect Tests
Speed IMEP
Intake
Pressure
Exhaust
Lambda
Spark
Timing IVO IVC EVO EVC
rpm bar bar deg CA ATDC
1500
2.2 1.2
0.96 ~
1.16
N/A
157 ~ 171 -148 140 -176
1.02 ~
1.16 161
-154 ~ -
143 140 -176
0.99 ~
1.14
161 -148
132 ~
145 -176
0.95 ~
1.15 161 -148 140
-185 ~ -
171
5 1.4
1.17 ~
1.24
N/A
150 ~ 161 -145 140 -172
1.16 ~
1.19 161
-154 ~ -
132 140 -172
1.17 ~
1.28
161 -145
142 ~
138 -172
1.19 ~
1.36 161 -145 140
-172 ~ -
169
7.8 1.8
1.48 ~
1.51 -13 161 ~ 164 -136 140 -163
1.50 ~
1.54 -15 161
-136 ~ -
131 140 -163
1.47 ~
1.60
-19 ~ -
10 161 -136
144 ~
138 -163
1.51 ~
1.70
-22 ~ -
15 161 -136 140
-163 ~ -
158
8.3.1 Effect of EVO
As the gas exchange process begins at the exhaust valve opening (EVO), the effect of
EVO was firstly investigated. During the two-stroke operation, the exhaust valve opens
towards the end of the expansion stroke before BDC. Therefore, the effective expansion
ratio of the burnt gas in the cylinder is shorter than the engine geometric expansion ratio.

135
As shown in Figure 8.4a, the cylinder pressure started dropping when exhaust valves
opened. The earlier the exhaust valves opened, the smaller the expansion work due to the
pressure drop after EVO. Figure 8.4b shows the relationship between the effective
expansion ratio (EER) and EVO, when EVO was varied from 132 deg ATDC to 145 deg
ATDC.
0.20 0.25 0.30 0.35 0.40
1
2
3
Cylin
de
r P
ressure
[b
ar]
V [L]
EVO 142 deg ATDC
EVO 141 deg ATDC
EVO 140 deg ATDC
EVO 139 deg ATDC
EVO 138 deg ATDC
EVO
130 135 140 145
10.3
10.4
10.5
10.6
10.7
10.8
10.9
11.0
11.1
IMEP 2.2bar
IMEP 5bar
IMEP 7.8bar
EE
REVO (degATDC)
a) P-V Diagram b) Effective Expansion Ratio
130 135 140 145
32
33
34
35
36
37
38
39
40
41
IMEP 2.2bar
IMEP 5bar
IMEP 7.8bar
Th
er.
Eff
i. (
%)
EVO (degATDC) 130 135 140 145
27
28
29
30
31
32
33
34
35
36
37
38
IMEP 2.2bar
IMEP 5bar
IMEP 7.8bar
Indic
.Effi. (
%)
EVO (degATDC)
c) Thermodynamic Efficiency d) Indicated Efficiency
130 135 140 145
1.0
1.1
1.2
1.3
1.4
1.5
1.6 IMEP 2.2bar
IMEP 5bar
IMEP 7.8bar
Exhau
st La
mbda
EVO (degATDC) 130 135 140 145
0.95
0.96
0.97
0.98
0.99
1.00
1.01
IMEP 2.2bar
IMEP 5bar
IMEP 7.8bar
Cylin
de
r La
mbd
a
EVO (degATDC)
e) Exhaust Lambda f) In-cylinder Lambda
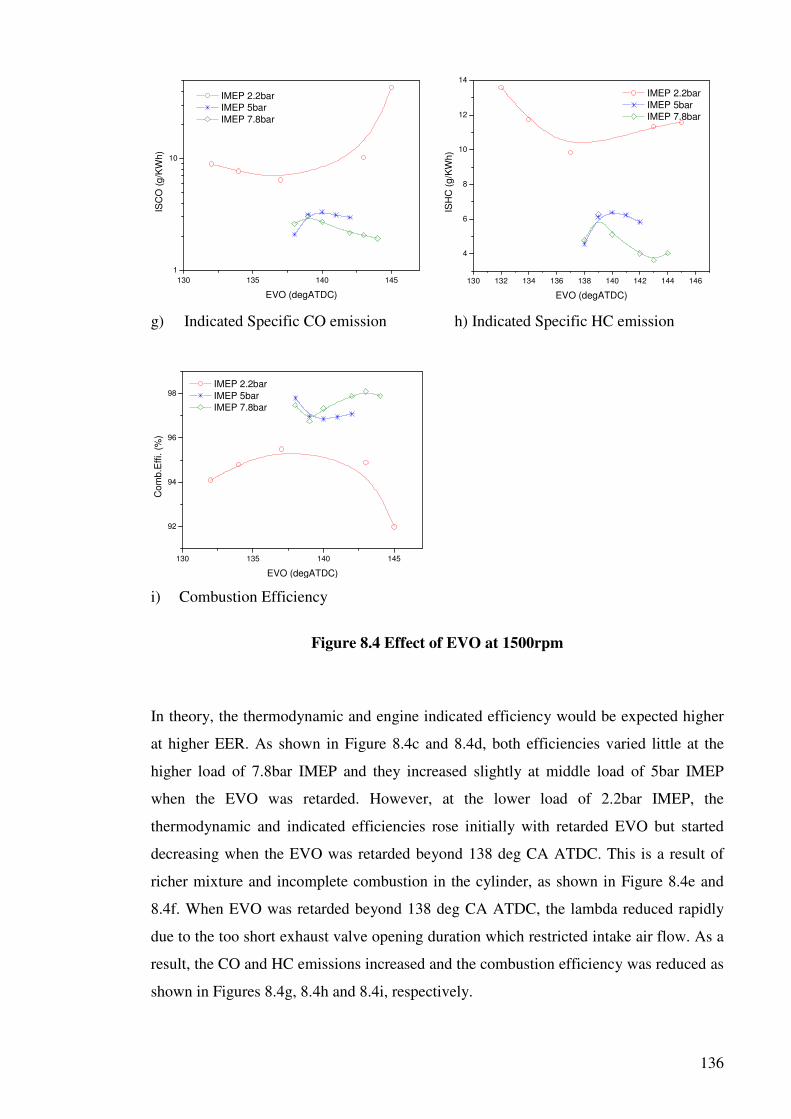
136
130 135 140 145
1
10
IMEP 2.2bar
IMEP 5bar
IMEP 7.8bar
ISC
O (
g/K
Wh)
EVO (degATDC)
130 132 134 136 138 140 142 144 146
4
6
8
10
12
14
IMEP 2.2bar
IMEP 5bar
IMEP 7.8bar
ISH
C (
g/K
Wh
)
EVO (degATDC)
g) Indicated Specific CO emission h) Indicated Specific HC emission
130 135 140 145
92
94
96
98 IMEP 2.2bar
IMEP 5bar
IMEP 7.8bar
Com
b.E
ffi. (
%)
EVO (degATDC)
i) Combustion Efficiency
Figure 8.4 Effect of EVO at 1500rpm
In theory, the thermodynamic and engine indicated efficiency would be expected higher
at higher EER. As shown in Figure 8.4c and 8.4d, both efficiencies varied little at the
higher load of 7.8bar IMEP and they increased slightly at middle load of 5bar IMEP
when the EVO was retarded. However, at the lower load of 2.2bar IMEP, the
thermodynamic and indicated efficiencies rose initially with retarded EVO but started
decreasing when the EVO was retarded beyond 138 deg CA ATDC. This is a result of
richer mixture and incomplete combustion in the cylinder, as shown in Figure 8.4e and
8.4f. When EVO was retarded beyond 138 deg CA ATDC, the lambda reduced rapidly
due to the too short exhaust valve opening duration which restricted intake air flow. As a
result, the CO and HC emissions increased and the combustion efficiency was reduced as
shown in Figures 8.4g, 8.4h and 8.4i, respectively.

137
8.3.2 Effect of IVO
In the two-stroke cycle, the scavenging process relies on the displacement of exhaust gas
by the intake air once the intake valves are open. Therefore, the effect of intake valve
opening on the gas exchange process was investigated.
The intake valve opening firstly affected the residual gas fraction, of which the
measurement method was described in Chapter 4. As shown in Figure 8.5a, the residual
gas fraction was reduced with more advanced intake valve open as the intake process
became longer. In addition, it is noted that the slopes of the curve are different at the
three conditions. At 2.2 bar IMEP when the boost pressure was lowest, a reduction in
RGF by 3% was accomplished when the inlet valves was advanced by 15 degree CAs. At
7.8bar IMEP, the 3% reduction in RGF was achieved by opening the inlet valve 5 degree
CAs earlier. At 5bar IMEP, the RGF rose rapidly when IVO was retarded beyond 160
deg ATDC, because the intake air flow was seriously restricted because of very short
intake valve opening duration. As shown in Figure 8.5b, the IVO has stronger effect on
air short-circuiting rate at low loads than high loads. If the gas exchange process in the
two-stroke operation can be considered as a mixed scavenging process of fresh air
mixing with burnt gas and fresh air displacing burnt gas, it can be seen that more fresh air
is mixed with burnt gas at high load than low load because of the high flow rate at higher
boosting pressure. The effect of IVO on air short-circuiting rates is reflected in the
difference between lambda values in the cylinder and exhaust, as shown in Figure 8.5c
&d.
150 155 160 165 170
45
50
55
60
65
70
75
80
85
IMEP 2.2bar
IMEP 5bar
IMEP 7.8bar
RG
F (
%)
IVO (degATDC)
150 155 160 165 170
0
5
10
15
20
25
30
35
40 IMEP 2.2bar
IMEP 5bar
IMEP 7.8bar
Ysho
rt (
%)
IVO (degATDC)
a) Residual Gas Fraction (RGF) b) Air Short-circuiting Rate (Yshort)

138
150 155 160 165 170
1.0
1.1
1.2
1.3
1.4
1.5
1.6 IMEP 2.2bar
IMEP 5bar
IMEP 7.8bar
Exhaust Lam
bda
IVO (degATDC) 150 155 160 165 170
0.94
0.95
0.96
0.97
0.98
0.99
1.00
1.01
IMEP 2.2bar
IMEP 5bar
IMEP 7.8bar
In-c
ylin
de
r La
mbd
a
IVO (degATDC)
c) Exhaust Lambda d) In-cylinder Lambda
150 155 160 165 170
-4
-2
0
2
4
6
8
IMEP 2.2bar
IMEP 5bar
IMEP 7.8bar
CA
10 (
deg
AT
DC
)
IVO (degATDC) 150 155 160 165 170
0
2
4
6
8
10
12
14
16
18
IMEP 2.2bar
IMEP 5bar
IMEP 7.8bar
CA
50 (
degA
TD
C)
IVO (degATDC)
e) Crank Angle at 10% MFB (CA10) f) Crank Angle at 50% MFB (CA50)
150 155 160 165 170
5
10
15
20
25
IMEP 2.2bar
IMEP 5bar
IMEP 7.8bar
CA
10-9
0 (
deg C
A)
IVO (degATDC) 150 155 160 165 170
1
10
100
IMEP 2.2bar
IMEP 5bar
IMEP 7.8bar
ISC
O (
g/K
Wh)
IVO (degATDC)
g) Crank Angle from 10% to 90% MFB (CA10-90) h) Indicated Specific CO (ISCO)

139
150 155 160 165 170
4
5
6
7
8
9
10
11
12
13
IMEP 2.2bar
IMEP 5bar
IMEP 7.8bar
ISH
C (
g/K
Wh)
IVO (degATDC) 150 155 160 165 170
0.0
0.5
1.0
1.5
2.0
2.5
IMEP 2.2bar
IMEP 5bar
IMEP 7.8bar
ISN
Ox (
g/K
Wh)
IVO (degATDC)
i) Indicated Specific HC (ISHC) j) Indicated Specific NOx (ISNOx)
150 155 160 165 170
88
90
92
94
96
98
IMEP 2.2bar
IMEP 5bar
IMEP 7.8bar
Com
b.E
ffi. (
%)
IVO (degATDC) 150 155 160 165 170
200
210
220
230
240
250
260
270
280
290
300
IMEP 2.2bar
IMEP 5bar
IMEP 7.8bar
ISF
C (
g/K
Wh)
IVO (degATDC)
k) Combustion Efficiency l) Indicated Specific Fuel Consumption
Figure 8.5 Effect of IVO at 1500rpm
As a result of the change in the air/fuel ratio and RGF in the cylinder, the start of
combustion (CA10), the combustion phasing (CA50), and combustion duration were all
affected by the IVO, as shown in Figure 8.5.e, 8.5f and 8.5g respectively. The start of
auto ignition and combustion phase took place earlier at middle and low load conditions
when the IO was advanced. At high load, as there was not enough residual gas to initiate
CAI combustion, spark-assisted CAI combustion were implemented. The advance of
CA10 was caused by advancing spark timing at higher RGF. At the highest RGF
condition at 7.8bar IMEP, CA50 started retarding and CA10-90 became much longer,
although its CA10 was advanced already, reflecting much deteriorated combustion
process and probably flame quenching before the establishment of auto ignition
temperature.

140
As shown in Figure 8.5h and 8.5k, at the lower load both CO emission and combustion
inefficiency increased rapidly as the combustible mixture became fuel rich with the most
advanced IVO. In addition, Figure 8.5h-j shows that at the higher load operation, both
CO and HC emissions increased but NOx decreased as the IVO was advanced slightly,
which could be caused by the lower charge temperature in the cylinder as more fresh air
mixed with residual gas. At the middle load of 5 bar IMEP when CAI was stable, the
effect of IVO was negligible other than at the two extreme IVOs.
8.3.3 Effect of EVC
Exhaust valve closure is also a critical control parameter for two-stroke scavenging
process, as it determines how much residual gas is trapped in the cylinder. Thus, further
experiments were carried out for a fixed EVO, IVO and IVC. As shown in Figure 8.6a
and 8.6b, the residual gas fraction was reduced and air short-circuiting rate was increased
with delayed EVC, because of longer exhaust valve opening duration. Compared with
Figure 8.5a and 8.5b, the effect of EVC was greater than that of IVO because of the fact
that most of air short-circuiting occurred in the last period of scavenging process.
Delayed exhaust valve closure allowed more refresh air passing through the cylinder into
the exhaust port without affecting the in-cylinder lambda, which was particularly
noticeable at middle and high loads as shown in Figure 8.6c and 8.6d.
-185 -180 -175 -170 -165 -160 -155
45
50
55
60
65
70
75
80
85
IMEP 2.2bar
IMEP 5bar
IMEP 7.8bar
RG
F (
%)
EVC (degATDC) -185 -180 -175 -170 -165 -160 -155
0
5
10
15
20
25
30
35
40 IMEP 2.2bar
IMEP 5bar
IMEP 7.8bar
Ysh
ort
(%
)
EVC (degATDC)
a) Residual Gas Fraction (RGF) b) Air Short-circuiting Rate (Yshort)

141
-185 -180 -175 -170 -165 -160 -155
0.9
1.0
1.1
1.2
1.3
1.4
1.5
1.6
1.7 IMEP 2.2bar
IMEP 5bar
IMEP 7.8bar
Exhau
st L
am
bda
EVC (degATDC) -185 -180 -175 -170 -165 -160 -155
0.93
0.94
0.95
0.96
0.97
0.98
0.99
1.00
1.01
IMEP 2.2bar
IMEP 5bar
IMEP 7.8bar
In-c
ylin
der
Lam
bd
a
EVC (degATDC)
c) Exhaust Lambda d) In-cylinder Lambda
-185 -180 -175 -170 -165 -160 -155
0
2
4
6
8
10
12
14
16
18
IMEP 2.2bar
IMEP 5bar
IMEP 7.8bar
CA
50 (
degA
TD
C)
EVC (degATDC)
-185 -180 -175 -170 -165 -160 -155
-4
-2
0
2
4
6
8
IMEP 2.2bar
IMEP 5bar
IMEP 7.8bar
CA
10 (
degA
TD
C)
EVC (degATDC)
Spark ON
e) Crank Angle at 10% MFB (CA10) f) Crank Angle at 50% MFB (CA50)
-185 -180 -175 -170 -165 -160 -155
5
10
15
20
25
30
IMEP 2.2bar
IMEP 5bar
IMEP 7.8bar
CA
10
-90 (
deg
CA
)
EVC (degATDC) -185 -180 -175 -170 -165 -160 -155
1
10
100
IMEP 2.2bar
IMEP 5bar
IMEP 7.8bar
ISC
O (
g/K
Wh
)
EVC (degATDC)
g) Crank Angle from 10% to 90% MFB (CA10-90) h) Indicated Specific CO (ISCO)

142
-185 -180 -175 -170 -165 -160 -155
4
6
8
10
12
14
IMEP 2.2bar
IMEP 5bar
IMEP 7.8bar
ISH
C (
g/K
Wh)
EVC (degATDC) -185 -180 -175 -170 -165 -160 -155
0.06
0.07
0.08
0.09
0.10
0.11
1.0
1.5
2.0 IMEP 2.2bar
IMEP 5bar
IMEP 7.8bar
ISN
Ox (
g/K
Wh)
EVC (degATDC)
i) Indicated Specific HC (ISHC) j) Indicated Specific NOx (ISNOx)
-185 -180 -175 -170 -165 -160 -155
88
90
92
94
96
98 IMEP 2.2bar
IMEP 5bar
IMEP 7.8bar
Co
mb
.Eff
i. (
%)
EVC (degATDC)
-185 -180 -175 -170 -165 -160 -155
200
210
220
230
240
250
260
270
280
290
300
IMEP 2.2bar
IMEP 5bar
IMEP 7.8bar
ISF
C (
g/K
Wh)
EVC (degATDC)
k) Combustion Efficiency l) Indicated Specific Fuel Consumption
Figure 8.6 Effect of EVC at 1500rpm
As shown in Figure 8.6e to 8.6f, CA10 and CA50 were delayed with extended exhaust
opening duration because of the higher air short-circuiting rate and associated cooling
effect. In order to compensate for delayed combustion by intake air charge cooling at
higher load operations, spark ignition was applied at an advanced timing. The emission
results show that both CO and HC emissions were reduced with longer exhaust opening
period at low loads when in-cylinder mixture became leaner. However, at middle and
high loads, CO and HC emissions were higher at higher air short-circuiting rate
conditions because of the lower in-cylinder temperature, which led to the significant
reduction in NOx emissions, as shown in Figure 8.6j. As a result, combustion efficiency
increased due to leaner mixture at low loads but decreased because of lower charge
temperature at high load conditions, as shown in Figure 8.6k. As long as the in-cylinder
lambda was not less than 1.0, the combustion efficiency remained higher than 95%.

143
Figure 7.3.3l shows that at low loads the fuel consumption was mainly determined by in-
cylinder lambda. At middle and high loads, the exhaust valve should be closed earlier to
minimize air short-circuiting and reduce fuel consumption.
8.3.4 Effect of IVC
The final valve timing examined was the intake valve closure while EVO, EVC and IVO
were fixed. Figure 8.7a shows how the effective compression ratio (ECR) was reduced
from 11.35 to 10.27 when IVC was retarded from -154 deg ATDC to -131 deg ATDC on
this engine. As ECR directly affects the charge temperature history in the compression
stroke, the combustion phase and combustion duration were altered. Fig.8.7b and 8.7c
show that CA50 was retarded and CA10-90 extended with lower ECR. Lower ECR also
made combustion less violent, as evidence by the maximum pressure rise rate in Figure
8.7d.
-155 -150 -145 -140 -135 -130
10.2
10.4
10.6
10.8
11.0
11.2
11.4
IMEP 2.2bar
IMEP 5bar
IMEP 7.8bar
EC
R
IVC (degATDC) -155 -150 -145 -140 -135 -130
0
2
4
6
8
10
12
14
16
IMEP 2.2bar
IMEP 5bar
IMEP 7.8bar
CA
50 (
degA
TD
C)
IVC (degATDC)
a) Effective compression ratio (ECR) b) Crank Angle at 50% MFB (CA50)
-155 -150 -145 -140 -135 -130
5
10
15
20
25
30
IMEP 2.2bar
IMEP 5bar
IMEP 7.8bar
CA
10
-90 (
deg
CA
)
IVC (degATDC) -155 -150 -145 -140 -135 -130
0
1
2
3
4
5
6
7
8
IMEP 2.2bar
IMEP 5bar
IMEP 7.8bar
Pre
ssure
ris
e r
ate
(ba
r/deg
CA
)
IVC (degATDC)
c) Crank Angle from 10% to 90% MFB (CA10-90) d) Pressure Rise Rate

144
-155 -150 -145 -140 -135 -130
1.0
1.1
1.2
1.3
1.4
1.5
1.6
IMEP 2.2bar
IMEP 5bar
IMEP 7.8bar
Exhaust Lam
bda
IVC (degATDC) -155 -150 -145 -140 -135 -130
0.97
0.98
0.99
1.00
1.01
IMEP 2.2bar
IMEP 5bar
IMEP 7.8bar
In-c
ylin
der
lam
bda
IVC (degATDC)
e) Exhaust Lambda f) In-cylinder Lambda
-155 -150 -145 -140 -135 -130
2
4
8
10
12
14
16
18
IMEP 2.2bar
IMEP 5bar
IMEP 7.8bar
ISC
O (
g/K
Wh
)
IVC (degATDC) -155 -150 -145 -140 -135 -130
4
6
8
10
12
14
IMEP 2.2bar
IMEP 5bar
IMEP 7.8bar
ISH
C (
g/K
Wh)
IVC (degATDC)
g) Indicated Specific CO (ISCO) h) Indicated Specific HC (ISHC)
-155 -150 -145 -140 -135 -130
0.0
0.2
0.4
0.6
0.8
1.0
1.2
1.4
1.6
1.8
2.0
IMEP 2.2bar
IMEP 5bar
IMEP 7.8bar
ISN
Ox (
g/K
Wh
)
IVC (degATDC)
-155 -150 -145 -140 -135 -130
1
2
3
4
5
6
9
10
IMEP 2.2bar
IMEP 5bar
IMEP 7.8bar
CO
Vim
ep
(%
)
IVC (degATDC)
i) Indicated Specific NOx (ISNOx) j) COVimep

145
-155 -150 -145 -140 -135 -130
200
210
220
230
240
250
260
270
IMEP 2.2bar
IMEP 5bar
IMEP 7.8bar
ISF
C (
g/K
Wh)
IVC (degATDC)
k) Indicated Specific Fuel Consumption (ISFC)
Figure 8.7 Effect of IVC at 1500rpm
The increase in exhaust and in-cylinder lambda at the lower load seen in Figure 8.7e and
8.7f indicated that additional air had been charged into and through the cylinder to the
exhaust. This results in the reduction in ISCO emission shown in Figure 8.7g. The
increase in ISHC emission shown in Figure 8.7h could be caused by the lower burned gas
temperature due to the delayed combustion with late IVC.
At the middle load, too much delay in IVC caused the mixture to flow back into the
intake port when the cylinder pressure was higher than the boosting pressure. Therefore,
the in-cylinder lambda started to decrease as shown in Figure 8.7f.
In addition to reduce the rate of pressure rise and combustion noise at higher load,
delayed IVC and hence lower ECR reduced the ISNOx emission. But further delay in
IVC resulted in the combustion deteriorates and higher cycle-to-cycle variation, as shown
in Figure 8.7j but IVC had little effect on ISFC. Therefore, the IVC could be used to
control CAI combustion and emissions without negative impact on fuel consumption.
8.4 Fuel Consumption and Emissions
8.4.1 Heat Release Analysis of Lean Boost Two-stroke CAI Operation

146
During the engine experiments and subsequent heat release analysis, different
combustion processes were detected as the engine load was changed. As shown in Figure
8.8, at 2.78 bar IMEP the heat release process was characterised with one peak and spark
had no effect on the ignition and heat release process, indicating the occurrence of pure
controlled autoignition combustion. As the load was increased to 5.49bar IMEP, the
cylinder pressure and heat release curves exhibited a gradual and then a sudden rise,
characteristics of the hybrid spark ignited and autoignition combustion. This is more
apparent on the mass fraction burned curve. Similar hybrid combustion processes were
also noted at the low load of 1 bar IMEP. The spark ignition during the hybrid
combustion operation was found to be a useful means to control the combustion phasing.
In the high load spark assisted CAI operation, retarded spark ignition was employed to
minimise the rate of heat release. In the spark assisted CAI operation at idle, the spark
timing was advanced before TDC to help stabilize the combustion process.
-60 -40 -20 0 20 40 600
10
20
30
40
50
60
In-c
ylin
der
Pre
ssure
[ba
r]
Crank Angle [deg ATDC]
IMEP 1.00 bar
IMEP 2.78 bar
IMEP 5.49 bar
1500rpm
0
20
40
60
80
100
120
140
Heat R
ele
ase R
ate
[J/d
eg C
A]
a) In-cylinder Pressure and Heat Release Rate
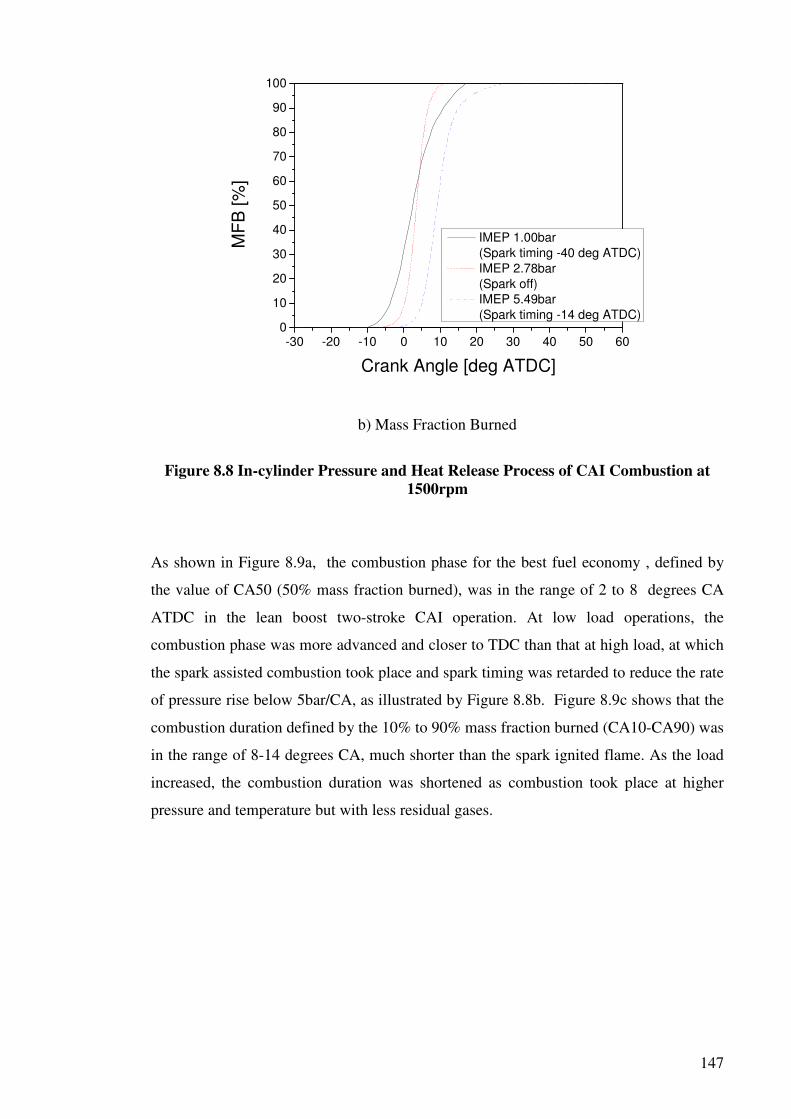
147
-30 -20 -10 0 10 20 30 40 50 600
10
20
30
40
50
60
70
80
90
100
MF
B [
%]
Crank Angle [deg ATDC]
IMEP 1.00bar
(Spark timing -40 deg ATDC)
IMEP 2.78bar
(Spark off)
IMEP 5.49bar
(Spark timing -14 deg ATDC)
b) Mass Fraction Burned
Figure 8.8 In-cylinder Pressure and Heat Release Process of CAI Combustion at
1500rpm
As shown in Figure 8.9a, the combustion phase for the best fuel economy , defined by
the value of CA50 (50% mass fraction burned), was in the range of 2 to 8 degrees CA
ATDC in the lean boost two-stroke CAI operation. At low load operations, the
combustion phase was more advanced and closer to TDC than that at high load, at which
the spark assisted combustion took place and spark timing was retarded to reduce the rate
of pressure rise below 5bar/CA, as illustrated by Figure 8.8b. Figure 8.9c shows that the
combustion duration defined by the 10% to 90% mass fraction burned (CA10-CA90) was
in the range of 8-14 degrees CA, much shorter than the spark ignited flame. As the load
increased, the combustion duration was shortened as combustion took place at higher
pressure and temperature but with less residual gases.
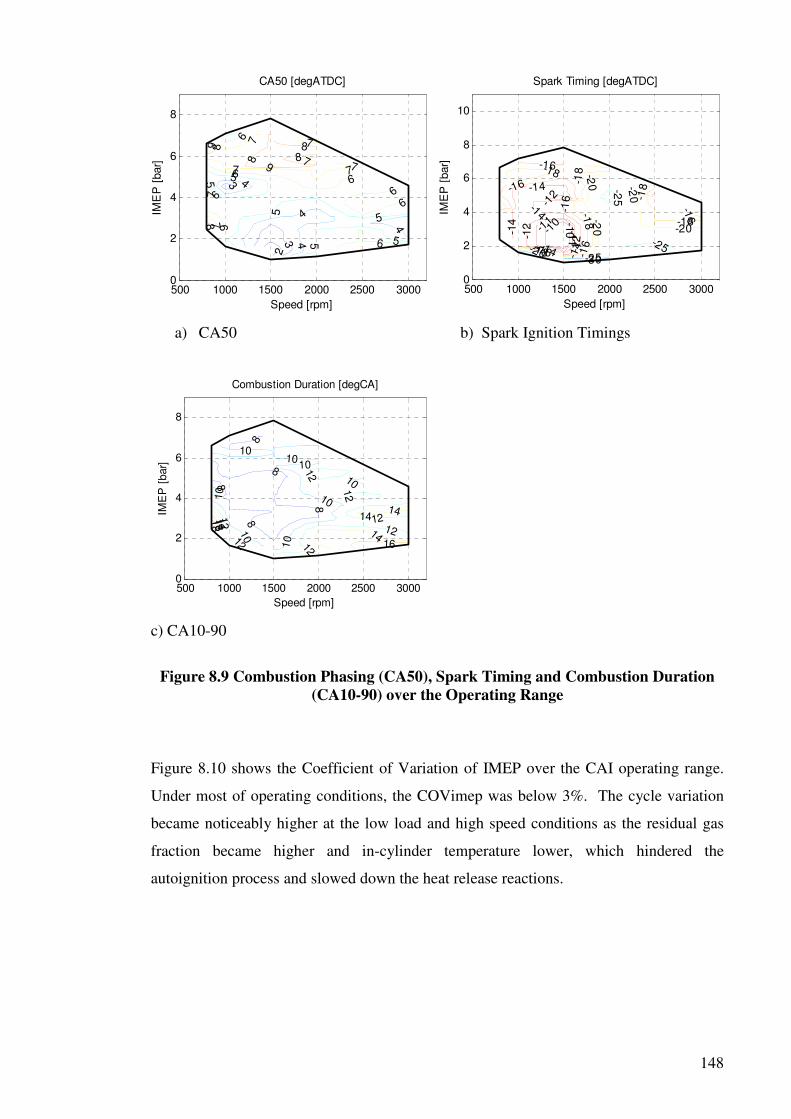
148
a) CA50 b) Spark Ignition Timings
c) CA10-90
Figure 8.9 Combustion Phasing (CA50), Spark Timing and Combustion Duration
(CA10-90) over the Operating Range
Figure 8.10 shows the Coefficient of Variation of IMEP over the CAI operating range.
Under most of operating conditions, the COVimep was below 3%. The cycle variation
became noticeably higher at the low load and high speed conditions as the residual gas
fraction became higher and in-cylinder temperature lower, which hindered the
autoignition process and slowed down the heat release reactions.
2
3
3
4
4
4
455
5
5
5 5
66
6
6
66
66
7 7
7
7
7 7
77
8
8
8 889
9IM
EP
[bar]
Speed [rpm]
CA50 [degATDC]
500 1000 1500 2000 2500 30000
2
4
6
8
-30-25
-25
-25
-20
-20
-20 -2
0
-20
-18
-18
-18
-18
-18
-18
-16
-16
-16
-16
-16
-16
-14
-14
-14
-14-14
-12
-12
-12
-11
-11 -1
0-10
IME
P [
bar]
Speed [rpm]
Spark Timing [degATDC]
500 1000 1500 2000 2500 30000
2
4
6
8
10
88
8
8
8
10
10
10
10
10
1010
10
12
12 12
1212
12
12
14
14
14141
6
16
18
IME
P [
bar]
Speed [rpm]
Combustion Duration [degCA]
500 1000 1500 2000 2500 30000
2
4
6
8

149
Figure 8.10 Coefficient of Variation (COV) of IMEP over the Lean Boost Two-
stroke CAI Operating Range
8.4.2 Emissions of Lean Boost Two-stroke CAI Operation
In order to demonstrate the benefits by lean boost operations, CO and HC emissions from
both exhaust lambda 1 and lean boosted operations are plotted in Figure 8.11 and Figure
8.12 respectively. It can be seen that the CO emission was reduced by 10 times and
unburned HC emissions by 50% by lean boost because of the reduction in the in-cylinder
air/fuel ratio and the removal of fuel rich combustion. At most of the operating
conditions, CO and HC emissions were below 10g/KWh and decreased at higher engine
load when more complete combustion took place at elevated combustion temperature.
Near the low load boundary, CO and HC emissions increased rapidly due to much lower
in-cylinder temperature and higher residual gas concentration.
As shown in Figure 8.13, NOx emissions were very low in most operating conditions.
The relatively higher NOx emission near the knock limit was reduced by 80% by lean
boost. This can be explained by the cooling effect of air short-circuiting. When fresh air
flew into and out of the cylinder, it took heat away from the cylinder wall and in-cylinder
charge. The cooling effect of air short-circuiting was reflected by the lower exhaust
temperature measured at the exhaust port, as shown in Figure 8.14.
2
2
2
2
2
2
3
3
3
3 3
3
5
5
5
7
7
7
10
1010
IME
P [
bar]
Speed [rpm]
COVimep [%]
500 1000 1500 2000 2500 30000
2
4
6
8

150
a) Exhaust lambda 1 b) Lean boost
Figure 8.11 Indicated Specific CO Emissions
a) Exhaust lambda 1 b) Lean boost
Figure 8.12 Indicated Specific HC Emissions
a) Exhaust lambda 1 b) Lean boost
Figure 8.13 NOx Emissions
80
10
0
100
12
0 120
12014
014
0
14
0
14
0
14
0
140
16
0
16
0
160
16
0
18
0
18
0
18018
0
20
0200
20022
0
IME
P [
bar]
Speed [rpm]
ISCO [g/KWh]
500 1000 1500 2000 2500 30000
2
4
6
8
4
4
4
4 4
4
6
6
6
6
8 8
8
10 10
10
20
2030
IME
P [
bar]
Speed [rpm]
ISCO [g/KWh]
500 1000 1500 2000 2500 30000
2
4
6
8
10
15
15
15
20
20
2030 3040 4060
IME
P [
bar]
Speed [rpm]
ISHC [g/KWh]
500 1000 1500 2000 2500 30000
2
4
6
8
6
6
8
8
8
8
10
10
1012 12
15
15 15 20
IME
P [
bar]
Speed [rpm]
ISHC [g/KWh]
500 1000 1500 2000 2500 30000
2
4
6
8
0.10.1
0.20.2
0.4 0.40.6 0.60.8 0
.8
1
1
2 2 23
4
4
5
56
IME
P [
bar]
Speed [rpm]
ISNOx [g/KWh]
500 1000 1500 2000 2500 30000
2
4
6
8
0.05
0.1
0.1
0.1
0.1
0.2
0.2
0.20.2
0.5
0.5
0.5
1
11
1
1
1.5
IME
P [
bar]
Speed [rpm]
ISNOx [g/KWh]
500 1000 1500 2000 2500 30000
2
4
6
8

151
a) Exhaust lambda 1 b) Lean boost
Figure 8.14 Exhaust Temperatures
8.4.3 Combustion and Engine Efficiencies in the Lean Boost Two-stroke
CAI Operation
As shown in Figure 8.15, the dramatic reduction in CO and unburned HC emissions by
lean boost is accompanied with the significant improvement in combustion efficiencies
throughout the CAI operational range. Near the low load boundary, in particular, the
combustion efficiency was increased from 74% to 94%. The most complete combustion
was seen at higher load conditions. As the load was reduced, the burned gas temperature
was insufficient high to oxidise CO and unburned hydrocarbons. However, it is noted
that there is still room for improvement in combustion efficiencies even at higher load
range, which could be achieved by improved fuel injection equipment and combustion
chamber design.
The consequence of the more complete combustion process of in-cylinder mixtures was
large reductions in indicated specific fuel consumptions in the lean boost CAI operation.
As it can be seen in Figure 8.16, the specific fuel consumption was reduced by more than
22% throughout the load and speed range. In addition, it is noted that the most dramatic
reductions in ISFC were at the high load and low load limits. Furthermore, it can be seen
that the most fuel efficient region was in the high load and high speed region where the
combustion process was most complete and CO/HC emissions were the least.
200 200
250
300
300
35
0
350
35040
0
400
400
45
0
450
450IME
P [
bar]
Speed [rpm]
ExhaustTemp [degC]
500 1000 1500 2000 2500 30000
2
4
6
8
220240
260
280
280
30
0
300
300
32
0
32
0
320
320
340
34
0
340
36
0IME
P [
bar]
Speed [rpm]
ExhaustTemp [degC]
500 1000 1500 2000 2500 30000
2
4
6
8

152
Figure 8.17 shows the residual gas concentration values measured by a Cambustion fast
CO2 analyser [96] in the operational range of the lean boost two-stroke CAI mode. Due
to the response time limit of the analyser, the results were obtained up to 1500rpm. It is
noted that the residual gas concentration varied between 40% at the high load limit to
more than 80% at the low load limit.
a) Exhaust Lambda 1 b) Lean Boost
Figure 8.15 Combustion Efficiencies
a) Exhaust Lambda 1 b) Lean Boost
Figure 8.16 Indicated Specific Fuel Consumptions
72747676
76
76
76
78
78 7
8
80
80
80
80
80
82
82
82
82
82
82
84
84
84
86
IME
P [
bar]
Speed [rpm]
Comb.Effi. [%]
500 1000 1500 2000 2500 30000
2
4
6
8
909192
92
93
93
94
94
94
9495
95
95
95
96
96
96
96
97
IME
P [
bar]
Speed [rpm]
Comb.Effi. [%]
500 1000 1500 2000 2500 30000
2
4
6
8
27
0
270
280
280280
280
290
290
290
290
30
0
300 300
32
0
320
34
0
340360
IME
P [
bar]
Speed [rpm]
ISFC [g/KWh]
500 1000 1500 2000 2500 30000
2
4
6
8
225
225
230
230
230
235
235 235
240
24
0
24
0 240260 260
26
028
0
280
IME
P [
bar]
Speed [rpm]
ISFC [g/KWh]
500 1000 1500 2000 2500 30000
2
4
6
8

153
Figure 8.17 RGF Measured by Fast CO2 Analyser at Lean Boost Operation
8.5 Effect of Ethanol Content on Two-stroke Lean Boost CAI
In order to test the lean boost CAI compatibility and investigate the ethanol content effect
on lean boost CAI, 15% ethanolled gasoline (E15) and 85% ethanolled gasoline (E85)
were tested in two-stroke lean boost CAI operation with the same control strategy used
for gasoline.
8.5.1 Operating Range
From previous results shown in Chapter 7.2, it can be seen the operating range of two-
stroke CAI is mainly presented at three engine speeds, which are 800rpm (low speed
limit), 1500rpm (low load and high load boundary) and 3000rpm (high speed limit).
Therefore, the ethanolled gasoline tests were carried out at the three speeds with the same
valve timing, injection timing and boosting pressure used for gasoline tests.
Figure 8.18 shows the operating range of two-stroke lean boost CAI when fuelling with
gasoline, E15 and E85. As discussed previously, at high loads the operation is limited by
violent combustion and too rapid heat release rate, which can be reflected by maximum
cylinder pressure rise rate. In this study, the maximum cylinder pressure rise rate is
limited at 5 bar/deg CA, no matter what fuel is used. As shown in Figure 8.19, the
45
50
55
60
70
80
IME
P [
bar]
Speed [rpm]
Measured RGF [%]
500 1000 1500 2000 2500 30000
2
4
6
8
Exceeded the response time of NDIR 500
154
pressure rise rate increases with engine load due to the increase in fuelling rate and
higher cylinder temperature at higher loads. It also can be seen that with increasing
ethanol content in the fuel, the maximum pressure rise rate reduced, in particular at
middle and high load, because of the slower burning rate of ethanol, this will be
discussed in Chapter 8.5.2. So with the same pressure rise rate limit, E15 and E85 can
reach higher load conditions.
At low loads the operation is limited by misfire and unstable combustion, which can be
reflected by cycle-to-cycle variation value, COVimep. As shown in Figure 8.20a, when
IMEP falls below 2bar at 1500rpm, COVimep increases rapidly as combustion becomes
unstable and misfire occurs in some cycles due to the large amount of trapped residual
gases and too low combustion temperature. The COVimep of gasoline fuel is the lowest.
When increasing the ethanol content in the fuel, the COVimep increases due to the slow
combustion rate of ethanol and lower cylinder temperature caused by the higher
vaporization latent heat value of ethanol. At lower speed, 800rpm, the increase in
COVimep started below 4bar IMEP as shown in Figure 8.20b. Although the COVimep
was limited at 5% throughout all the tests, the CAI combustion can reach lower load
conditions at 1500rpm compared to that at 800rpm because of shorter time for heat
transfer at higher speed. Therefore, adding the charge cooling effect of ethanol fuels, the
low load operational range becomes narrower with higher ethanol content fuels. In
addition, the reason of the increase in COVimep at high load conditions can be attributed
to the effect of air short-circuiting on combustion process as air short-circuiting rate and
its cycle-to-cycle variation are higher at high load conditions, as explained in Chapter 5.3.
As a result, the more ethanol is blended in the gasoline, the higher the upper load limit
can be extended but at the expanse of the limited low load operations.

155
500 1000 1500 2000 2500 30000
1
2
3
4
5
6
7
8
9
10
11 Gasoline Lean Boost
E15 Lean Boost
E85 Lean Boost
IME
P [bar]
Speed [rpm]
Figure 8.18 Operating Range of Two-stroke Lean Boost CAI with Gasoline, E15
and E85
0 2 4 6 8 10
0
1
2
3
4
5
6
Pre
ssure
ris
e r
ate
[ba
r / d
eg C
A]
IMEP [bar]
Gasoline
E15
E85
1500 rpm
Figure 8.19 Maximum Pressure Rise Rate at 1500rpm

156
0 2 4 6 8 10
0
1
2
3
4
5
6
CO
Vim
ep [%
]
IMEP [bar]
Gasoline
E15
E85
1500 rpm
0 2 4 6 8 10
0
1
2
3
4
5
6
CO
Vim
ep
[%
]
IMEP [bar]
Gasoline
E15
E85
800 rpm
a) 1500rpm b) 800rpm
Figure 8.20 COVimep at 1500rpm and 800rpm
8.5.2 Combustion Process
In order to analyse the combustion process of gasoline, E15 and E85, the heat release rate
and mass fraction burnt curve were calculated from cylinder pressure. Figure 8.21 shows
the cylinder pressure and heat release rate of gasoline, E15 and E85 at a typical low load
operating condition with pure CAI combustion. It can be seen that with the heating effect
of residual gas, auto-ignition started nearly at same crack angle. However, with increased
ethanol content, E85 burnt slower than E15 and gasoline. Therefore, the peak pressure of
E85 is the lowest.
-50 -40 -30 -20 -10 0 10 20 30 40 50
0
5
10
15
20
25
30
35
In-c
ylin
der
pre
ssure
[bar]
Crank Angle [deg ATDC]
Gasoline
E15
E85
IMEP 2.1 bar
1500 rpm
0
10
20
30
40
50
Heat re
lease r
ate
[J/d
eg C
A]
Figure 8.21 Cylinder Pressure and Heat Release Rate at 2.1bar IMEP and 1500rpm

157
As shown in Figure 8.22, at the higher load of 4.6bar IMEP, the heat release curve shape
changed to one with a slow slope in the first part and a steep slope in the second part,
separate by an apparent inflection at a certain crank angle. This two-stage heat release
process is typical of the spark-assisted hybrid flame and autoignition combustion [97]. At
middle to high load operation conditions, as more exhaust gases were scavenged by fresh
air and residual gas fraction reduced to a certain value that residual gas could not provide
enough heat to initiate auto-ignition, spark-assisted CAI had to be employed to stabilize
combustion in the cylinder. The first part of heat release process is the slow flame
propagation and the second part is the rapid auto-ignition at multipoint throughout
combustion chamber with the aid of further compression from the burnt gas. On the other
hand, the spark-assisted CAI operating mode allows auto-ignition timing to be controlled
for CAI engines. In order to keep the optimum combustion phase in this study, the spark
timing had to be advanced for E15 and E85 due to their slower burn rate. As shown in
Figure 8.22, although the start of ignition had been advanced 2 deg CA for E15 and 5 deg
CA for E85, their heat release process ended nearly at the same CA. Therefore, with
increased ethanol content in the fuel, the spark timing needs to be advanced more to have
the optimum combustion phase.
-50 -40 -30 -20 -10 0 10 20 30 40 50
0
10
20
30
40
50
60
In-c
ylin
der
pre
ssu
re [ba
r]
Crank Angle [deg ATDC]
Gasoline (Spark timing -16degATDC)
E15 (Spark timing -20degATDC)
E85 (Spark timing -23degATDC)
IMEP 4.6 bar
1500 rpm
0
10
20
30
40
50
60
Heat re
lease r
ate
[J/d
eg C
A]
Figure 8.22 Cylinder Pressure and Heat Release Rate at 4.6bar IMEP and 1500rpm

158
When the engine load was increased further, the combustion process turned to be SI
dominated due to the serious lack of the heat from residual gas and the cooling effect of
larger amount of blow-through fresh air, as shown in Figure 8.23. In this case, the spark
timing and combustion phase need to be further advanced for E15 and E85.
-50 -40 -30 -20 -10 0 10 20 30 40 50
0
10
20
30
40
50
60
70
80
In-c
ylin
der
pre
ssure
[b
ar]
Crank Angle [deg ATDC]
Gasoline (Spark timing -12deg ATDC)
E15 (Spark timing -15deg ATDC)
E85 (Spark timing -24deg ATDC)
IMEP 7.6 bar
1500 rpm
0
10
20
30
40
50
60
Heat re
lea
se r
ate
[J/d
eg C
A]
Figure 8.23 Cylinder Pressure and Heat Release Rate at 7.6bar IMEP and 1500rpm
Crank angle at 10% and 50% of mass fraction burnt, (CA10 and CA50), indicating Start
of combustion and combustion phase respectively, are plotted against IMEP in Figure
8.24 and 8.25 at 1500rpm. The crank angle from 10% to 90% of mass fraction burnt,
(CA10-90), indicating combustion duration is plotted in Figure 8.26. It can be seen that
at low load conditions the start of combustion and combustion phase of gasoline, E15
and E85 were nearly at the same crank angle because there was a large amount of
residual gas trapped in the cylinder which could provide enough heat to ignite the
mixture in the cylinder. When engine load increases, the combustion phase of the three
fuels has to be retarded to slower down combustion process and avoid too high pressure
raise rate. Similarly, the start of combustion of gasoline was also retarded with increased
load. And for E15 the start of combustion were remained roughly the same. But for E85

159
the start of combustion had to be advanced at middle and high load conditions, due to the
slower burning rate of ethanol. As shown in Figure 8.26, even when the combustion
phase of E15 and E85 was brought forward, their combustion duration was longer than
that of gasoline. This also explains why pressure rise rate of E15 and E85 was lower than
that of gasoline at the same load and how the engine could reach higher load operating
conditions when fuelled with E15 and E85.
0 2 4 6 8 10
-8
-6
-4
-2
0
2
4
6
8
CA
10 [deg A
TD
C]
IMEP [bar]
Gasoline
E15
E85
1500 rpm
0 2 4 6 8 10
-30
-25
-20
-15
-10
-5
0
Spa
rk T
imin
g [
deg
AT
DC
]
IMEP [bar]
Gasoline Lean
E15 Lean
E85 Lean
a) CA10 b) Spark Timing
Figure 8.24 CA10 (Start of Combustion) and Spark Timing
0 2 4 6 8 10
0
2
4
6
8
10
12
14
16
18
CA
50
[d
eg A
TD
C]
IMEP [bar]
Gasoline
E15
E85
1500 rpm
0 2 4 6 8 10
10
15
20
25
30
35
1500 rpm
CA
10
-90
[d
eg
CA
]
IMEP [bar]
Gasoline
E15
E85
Figure 8.25 CA50 Figure 8.26 CA10-90

160
8.5.3 Emissions
As presented in Chapter 7.2, the ethanol content has strong effect on the improvement of
CO, uHC and NOx emissions at exhaust lambda 1, when the in-cylinder lambda is lower
than 1 due to the air short-circuiting and ethanol. When running in the lean boost mode,
the advantage of ethanol blends fuels on emissions disappeared as there was enough
oxygen participating in combustion in the cylinder, as shown in Figure 8.27, 8.28 and
8.29. In contrary, the E15 and E85 produced more CO emissions due to the lower
combustion temperature caused by the higher vaporisation latent heat of ethanol, in
particular at low load conditions, where combustion temperature was reaching lowest
limit, as shown in Figure 8.27.
0 2 4 6 8 10
0
5
10
15
20
25
ISC
O [g
/kW
h]
IMEP [bar]
Gasoline
E15
E85
1500 rpm
Figure 8.27 Indicated Specific CO Emissions
Figure 8.28 shows Indicated Specific HC (ISHC) emissions produced by gasoline, E15
and E85 at 1500rpm. It can be seen that there was little difference in ISHC emissions
between the 3 fuels at low and middle loads. At high loads the E85 produced increasingly
higher ISHC emissions, which is due to the wall wetting effect of injection, as the
injection quantity of E85 is 1.5 times more than that of gasoline. The extra fuel impinges
onto the piston and could not completely evaporate during compression stroke. When
exhaust valve opened, the unburnt fuel went out into exhaust.

161
0 2 4 6 8 10
0
2
4
6
8
10
12
14
16
18
20
22
ISH
C [g
/kW
h]
IMEP [bar]
Gasoline
E15
E85
1500 rpm
Figure 8.28 Indicated Specific HC Emissions
As shown in Figure 8.29, ISNOx emissions from the combustion of three fuels were
similar because the NOx emission is mainly determined by combustion temperature.
When load increased, more fuel was injected in the cylinder and the heat produced by
combustion was almost the same for three fuels. Although ethanol could bring down the
combustion temperature by its higher vaporisation latent heat and slower combustion
speed, the combustion phase of E85 was advanced to achieve better fuel economy. As a
result, ISNOx emission increased with engine load and E15 and E85 produced slightly
higher NOx emissions at high loads compared to pure gasoline fuel.
0 2 4 6 8 10
0
1
2
3
4
ISN
Ox [
g/k
Wh
]
IMEP [bar]
Gasoline
E15
E85
1500 rpm
Figure 8.29 Indicated Specific NOx Emissions

162
8.5.4 Efficiencies
In order to compare the fuel economy and take into account of the different calorific
values of gasoline and ethanol, combustion efficiency, thermodynamic efficiency and
indicated fuel conversion efficiency are calculated and analysed for gasoline and its
blends with ethanol, of which the formula were presented in Chapter 3.6.
The combustion efficiency is estimated from the CO and HC emissions in the exhaust
gas and shown in Figure 8.30. It can be seen that by blending 15% ethanol in the
gasoline, the combustion efficiency is improved by 1% at middle load and high load
because of the improve oxidisation process. However, by adding 85% ethanol, the
combustion efficiency dropped back to the same level as gasoline at low and middle load
conditions, because of too low combustion temperature. At higher load operation,
combustion efficiency of E85 dropped significantly due to the wall wetting of injection
explained previously.
0 2 4 6 8 10
90
92
94
96
98
100
Com
bu
stio
n E
ffic
ien
cy [%
]
IMEP [bar]
Gasoline
E15
E85
1500 rpm
Figure 8.30 Combustion Efficiency
Figure 8.31 shows thermodynamic efficiency of three fuels at 1500rpm. It can be seen
that at middle and high loads E15 and E85 have lower thermodynamic efficiency than
gasoline, indicating their longer combustion.

163
0 2 4 6 8 10
24
26
28
30
32
34
36
38
40
42
44
46
Therm
odynam
ic E
ffic
iency [%
]
IMEP [bar]
Gasoline
E15
E85
1500 rpm
Figure 8.31 Thermodynamic Efficiency
As the product of combustion efficiency and thermodynamic efficiency, the indicated
fuel conversion efficiency is shown in Figure 8.32. It can be seen that as long as the
engine is not run with rich mixtures and the combustion phase is properly optimized, the
E15 and E85 can reach the same efficiency as gasoline.
0 2 4 6 8 10
24
26
28
30
32
34
36
38
Ind
ica
ted
Eff
icie
ncy [
%]
IMEP [bar]
Gasoline
E15
E851500 rpm
Figure 8.32 Indicated Efficiency
164
8.6 Summary
By means of fast in-cylinder and exhaust measurements, the air short-circuiting rate in
the two-stroke cycle and its effect on in-cylinder mixture strength were quantified and
analysed. It is shown that the engine was operating with a fuel rich mixture when the
lambda value determined by an exhaust oxygen sensor was set to one because of the air
short circuiting during the two-stroke cycle operation. This had led to engine experiments
with increased intake air pressure in order to compensate for the air lost through the
short-circuiting phenomenon. When the intake pressure was set to obtain the minimum
indicated specific fuel consumption, it was found
1) Two-stroke CAI combustion in the single cylinder camless engine was limited by
(i) knocking and rapid heat release rate at low speed high load operation, (ii)
partial-burn and misfire at low load operation, (iii) the restricted opening period
of the electro-hydraulic actuated intake valves at high load and higher engine
speed.
2) Pure CAI combustion took place at the part load conditions whilst hybrid spark
ignited and autoignition combustion occurred at low load and high load regions.
3) The in-cylinder air/fuel ratio was close to stoichiometric throughout the CAI
operational range with lean boost. Slightly fuel rich mixture was required to
obtain stable CAI combustion at the low load boundary.
4) The effect of valve timing on gas-exchange process and the subsequent
combustion process were investigated. EVO mainly affects the thermodynamic
efficiency through effective expansion ratio. IVC has strong effect on CAI
combustion phase and duration through effective compression ratio. IVO and
EVC are the main parameters affecting scavenging ratio, air short-circuting rate,
residual gas fraction and cylinder lambda during gas exchange process.
5) The combustion phase (CA50) varied within a range of 2-8 degree CA ATDC and
combustion duration (CA10-90) was 10-14 CAs.
6) CO emissions were reduced by 10 times and unburned HC emission by 50% by
lean boost because of the removal of fuel rich combustion. In addition, lean boost

165
led to significant reduction in NOx emissions at high load due to the air charge
cooling effect.
7) Combustion efficiencies were increased from 74% to above 94% by lean boost as
the in-cylinder lambda was increased to 1.
8) The indicated fuel consumption throughout the CAI operational range was
significantly improved by lean boost due to more complete combustion.
9) Ethanol burns slower than gasoline, so it can help extend high load operating
range limited by too high pressure rise rate. However, the slower combustion rate
leads to higher cycle-to-cycle variations and results in the loss of some low load
operating conditions where COVimep is greater than 5%.
10) Spark-assisted CAI combustion as an additional approach to control auto-ignition
timing and combustion phase of CAI was used at middle to high load operating
conditions. By this approach the combustion phase needs to be advanced with
increased ethanol content to improve the combustion speed of ethanol.
11) When lambda and combustion phase are properly optimized, the ethanol blended
in gasoline fuels, like E15 an E85, exhibited similar indicated fuel conversion
efficiency and CO, HC and NOx emissions to gasoline.

166
Chapter 9
Conclusions and Recommendation for Future Work

167
Chapter 9 Conclusions and Recommendation for Future Work
9.1 Conclusions
In this work, extensive engine experiments have been performed to determine the
operational range of CAI combustion and the optimum boosting for minimum fuel
consumption in a single cylinder gasoline direct injection camless engine operating in the
two-stroke cycle. New measurement techniques have been developed and applied to the
measurement of the air short-circuiting rate of the two-stroke cycle operation. In order to
minimise the air short-circuiting rate, the intake and exhaust valve timings were adjusted.
Lean boost was applied to the engine operation, which was found to extend the range of
CAI combustion, resulting in higher combustion and thermal efficiencies, and
significantly lower CO and HC emissions. By means of the cycle-resolved in-cylinder
measurements and heat release analysis, the improvement in combustion and thermal
efficiencies was attributed to the improved in-cylinder mixture, optimised autoignition
and combustion phasing.
Two-stroke CAI combustion was studied at exhaust lambda 1. It is demonstrated that a
wider range of CAI operation could be achieved at engine speeds from 800rpm to
3000rpm and with engine load from idle to 7.8bar IMEP, which is equivalent to 15.6 bar
IMEP on the four-stroke operation. In the CAI operational range, the NOx emission was
very low and the specific fuel consumption was also low. Due to the short-circuiting, the
in-cylinder mixture was too rich for complete combustion when the exhaust lambda was
controlled at 1.0 and hence higher CO and uHC emissions were observed.
The air short-circuiting rate was quantified and used to determine the in-cylinder relative
air to fuel ratios from the lambda sensor readings. The combustion and emission results
show that maximum combustion efficiency and lowest CO and uHC emissions occurred
with a relatively lean overall in-cylinder mixture whilst the maximum CO2 concentration
was obtained with a stoichiometric in-cylinder mixture.
The effect of direct fuel injection timing on engine performance, combustion and
emissions was investigated in 3 CAI operating modes. The charge cooling effect of direct
fuel injection is most significant during the four-stroke NVO CAI operation. Its effect is

168
also noticeable in the two-stroke CAI operation but negligible in four-stroke exhaust
rebreathing CAI operation. The injection timing has less effect on the start of
combustion unless the fuel impingement is significant in the four-stroke NVO CAI and
exhaust rebreathe CAI operation. In the two-stroke CAI operation, the injection timing
significantly affects the combustion phase and duration due to the shortened mixing time
from the fuel injection to ignition.
For further estimating two-stroke CAI operation, 7 operating modes were performed on
the same engine, including either two-stroke or conventional four-stroke engine
operations. It is found that the two-stroke CAI operation mode incurs the lowest fuel
consumption at the part-load condition tested.
Gasoline and ethanol blends were tested in two-stroke CAI combustion mode at exhaust
lambda 1. It was found a wide concentration range of ethanol in gasoline was suited over
a wide range of speed and load. The presence of ethanol allowed CAI combustion to be
extended to higher load conditions. In the case of E85 the maximum IMEP of 8.4bar was
obtained at 800rpm. CO, uHC and NOx emissions are significantly reduced by injecting
ethanol blended fuels. E85 has greater effect on the emission reduction than E15. Both
combustion efficiency and thermodynamic efficiency are improved by the presence of
ethanol because of the optimum combustion phasing and lower heat loss. E85 improved
indicated fuel conversion efficiency by over 5% at 2000rpm.
The rich in-cylinder air fuel mixture with exhaust lambda 1 operation was corrected by
using lean boost CAI operation on the two-stroke poppet valve engine. The in-cylinder
air/fuel ratio was close to stoichiometric throughout the CAI operational range with lean
boost. Slightly fuel rich mixture was required to obtain stable CAI combustion at the low
load boundary.
The effect of valve timing on gas-exchange process and the subsequent combustion
process were investigated in two-stroke lean boost CAI mode. EVO mainly affects the
thermodynamic efficiency through effective expansion ratio. IVC has strong effect on
CAI combustion phase and duration through effective compression ratio. IVO and EVC
are the main parameters affecting scavenging ratio, air short-circuiting rate, residual gas
fraction and cylinder lambda during gas exchange process. The combustion phase (CA50)
varied within a range of 2-8 degree CA ATDC and combustion duration (CA10-90) was

169
10-14 CAs. Pure CAI combustion took place at the part load conditions whilst hybrid
spark ignited and autoignition combustion occurred at low load and high load regions.
CO emissions were reduced by 10 times and unburned HC emission by 50% by lean
boost because of the removal of fuel rich combustion. In addition, lean boost led to
significant reduction in NOx emissions at high load due to the air charge cooling effect.
Combustion efficiencies were increased from 74% to above 94% by lean boost as the in-
cylinder lambda was increased to 1. The indicated fuel consumption throughout the CAI
operational range was significantly improved by lean boost due to more complete
combustion.
In lean boost CAI mode, ethanol still burns slower than gasoline, so the high load
operating range limit was extended by the reduced pressure rise rate of burning ethanol.
However, the slower combustion rate leads to higher cycle-to-cycle variations and results
in the loss of some low load operating conditions where COVimep is greater than 5%.
Spark-assisted CAI combustion as an additional approach to control auto-ignition timing
and combustion phase of CAI was used at middle to high load operating conditions. By
this approach the combustion phase needs to be advanced with increased ethanol content
to improve the combustion speed of ethanol. When lambda and combustion phase are
properly optimized, the ethanol blended in gasoline fuels, like E15 an E85, exhibited
similar indicated fuel conversion efficiency and CO, HC and NOx emissions to gasoline.
9.2 Recommendations for Future Work
9.2.1 Combustion System Improvement
From the presented results, it can be seen the current combustion system is not optimised
as evidenced by the low combustion efficiency. Further improvement in the two-stroke
cycle engine performance and emissions can be achieved by optimisation of the piston
top design and fuel injection system and injection strategy.
1) Higher injection pressure

170
The fuelling system is capable of running fuel pressure up to 150bar, but currently the
injection pressure is 100bar. The high injection pressure will provide more fine fuel
spray, which can lead to faster evaporation and form more homogeneous mixture
before ignition.
2) Multiple injections
Multiple injections should be adopted in order to shorten fuel jet penetration and
reduce wetting the piston top and cylinder wall. Also, the consequence of the
multiple injections will be a good aid to control CAI ignition and combustion
process. A piezo injector may be used to replace the current solenoid injector when
very fast response of the injector is necessary.
3) Spray guided combustion system with centrally mounted injector
Ideally, a spray guided combustion system with a centrally mounted injector next to
the spark plug would be able to minimize the wall impingement and to operate with
stratified charge combustion, which could be employed to improve the combustion
stability at low load.
9.2.2 Further Extension of CAI Operating Range by Miller Cycle
In recognition of the significant improvement on fuel economy and emissions with lean
boost CAI operation, additional research could be done at high load limit by further
retarding intake valve closure and rising boost pressure, commonly referred as Miller
cycle. When boosting pressure increases, the higher charge density will lead to a high
power output. In the meanwhile the retarded intake valve closure will lead to a lower
effective compression ratio, which is also good for avoiding knocking at high load limit.
This is a potential for further extending CAI operating range in two-stroke cycle.

171
References
1. “World Oil Outlook 2012”, Organization of the Petroleum Exporting Countries
(OPEC), 2012.
2. Environmental Protection Agency ( EPA), USA,
http://www.epa.gov/climatechange/basics/.
3. Global Comparison of Light-Duty Vehicle Fuel Economy/GHG Emissions
Standards, The International Council on Clean Transportation, August 2011.
4. “Summary of Fuel Economy Performance", National Highway Traffic Safety
Administration, USA.
5. “Pocket Guide”, European Automobile Manufacturers' Association (ACEA).
6. “The Top Runner Program”, Ministry of Economy, Trade and Industry (METI).
7. Dinsdale J., “Environmental Facts and Figures”, Environment Agency, UK.
8. “EU Emission Standards for Passenger Cars”, Dieselnet - Online information
service on clean diesel engines and diesel emissions.
9. “Cars and Light-Duty Trucks—California”, Emission Standards, US.
10. Johnson, T. V., Mobile emission control technologies in review, International
Conference on 21st Century Emissions Control technology, IMechE Conference
Transactions 2000-2, ISBN 1860583229, 2000.
11. Heywood J.B. and Sher Eran, The Two-stroke Cycle Engine: Its Development,
Operation, and Design, Taylor and Francis, 1999.
12. Dedeoglu N., Model investigations on scavenging and mixture formation in the
dual-fuel or gas engine, Sulzer Tech. Review, Vol 51, No 3, 1969.
13. Rizk W., Experimental studies of the mixing processes and flow configurations in
two-cycle engine scavenging, Proc. IMechE, Vol172, 1958.
14. Ohigashi S. and Kashiwada Y., A study on the scavenging air flow through the
scavenging ports, Bull. JSME, Vol 9, No36, 1966.
15. http://bikeadvice.in/supercharged-two-stroke-engine/
16. http://www.physics.byu.edu/faculty/rees/360/engine.jpg
17. Allen, J. and Law, D., "Production Electro-Hydraulic Variable Valve-Train for a
New Generation of I.C. Engines," SAE Technical Paper 2002-01-1109, 2002,
doi:10.4271/2002-01-1109.
18. Zhao, H.(ed.), Advanced direct injection combustion engine technologies and
development,Volume 1: Gasoline and gas engines, Woodhead publishing, DOI
10.1533/9781845697327, 2010.

172
19. Blair G.P., Design and simulation of two-stroke engines, SAE Inc, 1996.
20. Stokes, J., Hundleby, G., Lake, T., and Christie, M., "Development Experience of a
Poppet-Valved Two-Stroke Flagship Engine," SAE Technical Paper 920778, 1992,
doi:10.4271/920778.
21. Sato, K., Ukawa, H., and Nakano, M., "A Two-Stroke Cycle Gasoline Engine with
Poppet Valves in the Cylinder Head - Part II," SAE Technical Paper 920780, 1992,
doi:10.4271/920780.
22. Osborne R. J., Stokes J., Lake T. H., Carden P. J., Mullineux J. D., Helle-Lorentzen
R., Evans J. C., Heikal M. R., Zhu Y., Zhao H., Ma T., “Development of a Two-
Stroke/Four-Stroke Switching Gasoline Engine –The 2/4SIGHT Concept”, SAE
Paper 2005-01-1137, ,2005.
23. Watson N.,Janota M. S., Turbocharging the Internal Combustion Engine, Wiley-
Interscience publishing, ISBN:9780471870722, 1982.
24. BMW Mini Cooper S, Wikipedia website,
http://en.wikipedia.org/wiki/BMW_MINI_COOPER. (Accessed April, 2014).
25. Fieweger, K. ; Paffrath, H. ; Schorn, N. , Drivability assessment of an HSDI Diesel
engine with electrically assisted boosting systems, IMECH CONFERENCE
TRANSACTIONS; 1; 283-296, Turbochargers and turbocharging International
conference; 7th, Turbochargers and turbocharging. ISBN: 1860583830, 2002.
26. Kattwinkel, T., Weiss, R., and Boeschlin, J., "Mechatronic Solution for Electronic
Turbocharger," SAE Technical Paper 2003-01-0712, 2003, doi:10.4271/2003-01-
0712.
27. Shahed, S., "An Analysis of Assisted Turbocharging with Light Hybrid
Powertrain," SAE Technical Paper 2006-01-0019, 2006, doi:10.4271/2006-01-
0019.
28. Luttermann, C. and Mährle, W., "BMW High Precision Fuel Injectionin
Conjunction with Twin-Turbo Technology: a Combination for Maximum Dynamic
and High Fuel Efficiency," SAE Technical Paper 2007-01-1560, 2007,
doi:10.4271/2007-01-1560.
29. Hopmann, U. and Algrain, M., "Diesel Engine Electric Turbo Compound
Technology," SAE Technical Paper 2003-01-2294, 2003, doi:10.4271/2003-01-
2294.
30. Arsie, I., Cricchio, A., Pianese, C., De Cesare, M., and Nesci, W., "A
Comprehensive Powertrain Model to Evaluate the Benefits of Electric Turbo

173
Compound (ETC) in Reducing CO2 Emissions from Small Diesel Passenger Cars,"
SAE Technical Paper 2014-01-1650, 2014, doi:10.4271/2014-01-1650.
31. Zhao H. (ed.), HCCI and CAI engines for the Automotive Industry, Woodhead
Publishing, Cambridge, 2007.
32. Gussak, L., Turkish, M., and Siegla, D., "High Chemical Activity of Incomplete
Combustion Products and a Method of Prechamber Torch Ignition for Avalanche
Activation of Combustion in Internal Combustion Engines," SAE Technical Paper
750890, 1975, doi:10.4271/750890.
33. Onishi, S., Jo, S., Shoda, K., Jo, P. et al., "Active Thermo-Atmosphere Combustion
(ATAC) - A New Combustion Process for Internal Combustion Engines," SAE
Technical Paper 790501, 1979, doi:10.4271/790501.
34. Noguchi, M., Tanaka, Y., Tanaka, T., and Takeuchi, Y., "A Study on Gasoline
Engine Combustion by Observation of Intermediate Reactive Products during
Combustion," SAE Technical Paper 790840, 1979, doi:10.4271/790840.
35. Najt, P. and Foster, D., "Compression-Ignited Homogeneous Charge Combustion,"
SAE Technical Paper 83, 1983, doi:10.4271/830264.
36. Thring, R., "Homogeneous-Charge Compression-Ignition (HCCI) Engines," SAE
Technical Paper 892068, 1989, doi:10.4271/892068.
37. M. Stockinger,H. Schäpertöns,P.Kuhlmann, Versuchean einem
gemischansugenden Verbrennungsmotor mit Selbstzündnung, MTZ,
Motertechnisches Zeitschrift 53 (1992) pp 80-85, 1992.
38. Olsson, J., Tunestål, P., and Johansson, B., "Closed-Loop Control of an HCCI
Engine," SAE Technical Paper 2001-01-1031, 2001, doi:10.4271/2001-01-1031.
39. Aaron Oakley, Hua Zhao and Nicos Ladommatos,Experimental Studies on
Controlled Auto-ignition (CAI) Combustion of Gasoline in a 4-Stroke Engine,
SAE 2001-01-1030, 2001
40. Aaron John Oakley, Experimental Investigations on Controlled Auto-Ignition
Combustion in A Four-Stroke Gasoline Engine, PHD thesis, Department of
Mechanical Engineering, Brunel University, UK, 2001.
41. Haraldsson, G., Tunestål, P., Johansson, B., and Hyvönen, J., "HCCI Combustion
Phasing in a Multi Cylinder Engine Using Variable Compression Ratio," SAE
Technical Paper 2002-01-2858, 2002, doi:10.4271/2002-01-2858.
42. Oakley, A., Zhao, H., Ladommatos, N., and Ma, T., "Dilution Effects on the
Controlled Auto-Ignition (CAI) Combustion of Hydrocarbon and Alcohol Fuels,"
SAE Technical Paper 2001-01-3606, 2001, doi:10.4271/2001-01-3606.

174
43. Aroonsrisopon, T., Sohm, V., Werner, P., Foster, D. et al., "An Investigation Into
the Effect of Fuel Composition on HCCI Combustion Characteristics," SAE
Technical Paper 2002-01-2830, 2002, doi:10.4271/2002-01-2830.
44. Jeuland, N., Montagne, X., and Duret, P., "Engine and Fuel Related Issues of
Gasoline CAI (Controlled Auto-Ignition) Combustion," SAE Technical Paper
2003-01-1856, 2003, doi:10.4271/2003-01-1856.
45. Cairns, A. and Blaxill, H., "The Effects of Combined Internal and External Exhaust
Gas Recirculation on Gasoline Controlled Auto-Ignition," SAE Technical Paper
2005-01-0133, 2005, doi:10.4271/2005-01-0133.
46. Fuerhapter, A., Piock, W., and Fraidl, G., "CSI - Controlled Auto Ignition - the
Best Solution for the Fuel Consumption - Versus Emission Trade-Off?," SAE
Technical Paper 2003-01-0754, 2003, doi:10.4271/2003-01-0754.
47. Kaahaaina, N., Simon, A., Caton, P., and Edwards, C., "Use of Dynamic Valving to
Achieve Residual-Affected Combustion," SAE Technical Paper 2001-01-0549,
2001, doi:10.4271/2001-01-0549.
48. Wolters, P., Salber, W., Geiger, J., Duesmann, M. et al., "Controlled Auto Ignition
Combustion Process with an Electromechanical Valve Train," SAE Technical
Paper 2003-01-0032, 2003, doi:10.4271/2003-01-0032.
49. Willand, J., Nieberding, R., Vent, G., and Enderle, C., "The Knocking Syndrome -
Its Cure and Its Potential," SAE Technical Paper 982483, 1998,
doi:10.4271/982483.
50. Kontarakis, G., Collings, N., and Ma, T., "Demonstration of HCCI Using a Single
Cylinder Four-stroke SI Engine with Modified Valve Timing," SAE Technical
Paper 2000-01-2870, 2000, doi:10.4271/2000-01-2870.
51. Zhao, H., Peng, Z., Williams, J., and Ladommatos, N., "Understanding the Effects
of Recycled Burnt Gases on the Controlled Autoignition (CAI) Combustion in
Four-Stroke Gasoline Engines," SAE Technical Paper 2001-01-3607, 2001,
doi:10.4271/2001-01-3607.
52. Li, J., Zhao, H., Ladommatos, N., and Ma, T., "Research and Development of
Controlled Auto-Ignition (CAI) Combustion in a 4-Stroke Multi-Cylinder Gasoline
Engine," SAE Technical Paper 2001-01-3608, 2001, doi:10.4271/2001-01-3608.
53. Murase, E. and Hanada, K., "Control of the Start of HCCI Combustion by Pulsed
Flame Jet," SAE Technical Paper 2002-01-2867, 2002, doi:10.4271/2002-01-2867.

175
54. Weinrotter, M., Wintner, E., Iskra, K., Neger, T. et al., "Optical Diagnostics of
Laser-Induced and Spark Plug-Assisted HCCI Combustion," SAE Technical Paper
2005-01-0129, 2005, doi:10.4271/2005-01-0129.
55. Wolters, P., Salber, W., Geiger, J., Duesmann, M. et al., "Controlled Auto Ignition
Combustion Process with an Electromechanical Valve Train," SAE Technical
Paper 2003-01-0032, 2003, doi:10.4271/2003-01-0032.
56. Zhao F., Asmus T.W., Assanis D.N., Dec J.E., Eng J.A., Najt P.M., Homogeneous
Charge Compression Ignition (HCCI) Engines, Key Research and Development
Issues, SAE Publication PT-94, Soc. of Automotive Engineers, 2003.
57. U.S. Department of Energy, Energy Efficiency and Renewable Energy Office of
Transportation Technologies, Homogeneous Charge Compression Ignition (HCCI)
Technology- A Report to the U.S. Congress,April 2001.
58. Christensen, M. and Johansson, B., "Influence of Mixture Quality on
Homogeneous Charge Compression Ignition," SAE Technical Paper 982454, 1998,
doi:10.4271/982454.
59. Aceves, S., Martinez-Frias, J., Flowers, D., Smith, J. et al., "A Decoupled Model of
Detailed Fluid Mechanics Followed by Detailed Chemical Kinetics for Prediction
of Iso-Octane HCCI Combustion," SAE Technical Paper 2001-01-3612, 2001,
doi:10.4271/2001-01-3612.
60. Stanglmaier, R. and Roberts, C., "Homogeneous Charge Compression Ignition
(HCCI): Benefits, Compromises, and Future Engine Applications," SAE Technical
Paper 1999-01-3682, 1999, doi:10.4271/1999-01-3682.
61. Yap, D., Megaritis, A., Wyszynski, M., and Xu, H., "Effect of inlet valve timing on
boosted gasoline HCCI with residual gas trapping," SAE Technical Paper 2005-01-
2136, 2005, doi:10.4271/2005-01-2136.
62. Milovanovic, N., Chen, R., and Turner, J., "Influence of the Variable Valve Timing
Strategy on the Control of a Homogeneous Charge Compression (HCCI) Engine,"
SAE Technical Paper 2004-01-1899, 2004, doi:10.4271/2004-01-1899.
63. Morikawa, H. and Ishibashi, Y., "An Experimental Approach to the Controlled
Auto-Ignition," SAE Technical Paper 2007-01-0173, 2007, doi:10.4271/2007-01-
0173.
64. Ohyama, Y., "Simultaneous Control of Air/fuel Ratio and Intake, Exhaust Valve
Timing for HCCI Operation," SAE Technical Paper 2003-01-1084, 2003,
doi:10.4271/2003-01-1084.

176
65. Yelvington, P. and Green, W., "Prediction of the Knock Limit and Viable
Operating Range for a Homogeneous-Charge Compression-Ignition (HCCI)
Engine," SAE Technical Paper 2003-01-1092, 2003, doi:10.4271/2003-01-1092.
66. Duret, P., Ecomard, A., and Audinet, M., "A New Two-Stroke Engine with
Compressed-Air Assisted Fuel Injection for High Efficiency low Emissions
Applications," SAE Technical Paper 880176, 1988, doi:10.4271/880176.
67. Duret, P. ; Venturi, S. ; Carey, C. ; The IAPAC Fluid Dynamically Controlled
Automotive Two-Stroke Combustion Process, in A new generation of two-stroke
engines for the future? International seminar, 1993.
68. Duret, P. and Venturi, S., "Automotive Calibration of the IAPAC Fluid
Dynamically Controlled Two-Stroke Combustion Process," SAE Technical Paper
960363, 1996, doi:10.4271/960363.
69. Ishibashi Y and Tsushima Y, ‘A Trial for Stabilizing Combustion in Two-Stroke
Engines at Part Throttle Operation’, in Duret P, A New Generation of Two-Stroke
Engines for the Future?, IFP International Seminar, Rueil-Malmaison, Editions
Technip., 1993.
70. Iida, N., "Combustion Analysis of Methanol-Fueled Active Thermo-Atmosphere
Combustion (ATAC) Engine Using a Spectroscopic Observation," SAE Technical
Paper 940684, 1994, doi:10.4271/940684.
71. Takei, T., Iida, N., Study on autoignition and combustion completion of n-butane
in a two-stroke homogeneous charge compression ignition (HCCI) engine, SAE
paper 2002-32-1786, 2002.
72. Osborne, R., Li, G., Sapsford, S., Stokes, J. et al., "Evaluation of HCCI for Future
Gasoline Powertrains," SAE Technical Paper 2003-01-0750, 2003,
doi:10.4271/2003-01-0750.
73. Li, G., Bo, T., Chen, C., and Johns, R., "CFD Simulation of HCCI Combustion in a
2-Stroke DI Gasoline Engine," SAE Technical Paper 2003-01-1855, 2003,
doi:10.4271/2003-01-1855.
74. Kim, K., Sakai, H., Kobayashi, T., and Nakano, M., "Performance of Two/Four
Stroke Gasoline HCCI Engine with Electromagnetic Valve Train," SAE Technical
Paper 2007-01-1868, 2007, doi:10.4271/2007-01-1868.
75. Li, Z., He, B., and Zhao, H., "The Influence of Intake Port and Pent-Roof
Structures on Reversed Tumble Generation of a Poppet-Valved Two-Stroke
Gasoline Engine," SAE Technical Paper 2014-01-1130, 2014, doi:10.4271/2014-
01-1130.

177
76. Ikoma, T., Abe, S., Sonoda, Y., Suzuki, H. et al., "Development of V-6 3.5-liter
Engine Adopting New Direct Injection System," SAE Technical Paper 2006-01-
1259, 2006, doi:10.4271/2006-01-1259.
77. Zhao, H. and Ladommatos, N., Engine Combustion Instrumentation and
Diagnostics, SAE Published, 2001, ISBN: 9780768040340 0768040345.
78. Heywood, J., Internal Combustion Engine Fundamentals, McGraw-Hill
Mechanical Engineering published, 1988, ISBN-13: 978-0070286375.
79. Dedeoglu N., Model investigations on scavenging and mixture formation in the
dual-fuel or gas engine, Sulzer Tech. Review, Vol 51, No 3, 1969.
80. Rizk W., Experimental studies of the mixing processes and flow configurations in
two-cycle engine scavenging, Proc. IMechE, Vol172, 1958.
81. Ohigashi S. and Kashiwada Y., A study on the scavenging air flow through the
scavenging ports, Bull. JSME, Vol 9, No36, 1966.
82. Phatak R.G., A new method of analysing two-stroke cycle engines, PhD thesis,
Queen’s University of Belfast, May 1980.
83. Blair G.P., Ashe M.C., The unsteady gas exchange characteristics of a two-cycle
engine, SAE paper 760644, 1976.
84. Asanuma T., Yanigahara S., Gas sampling valve for measuring scavenging
efficiency in high speed two-stroke engines, SAE Transactions, Vol 70, p.420,
Paper T47, 1962.
85. Booy R.R., Evaluating scavenging efficiency of two-cycle gasoline engines, SAE
paper 670029, 1967.
86. Jante A., Scavening and other problems of two-stroke spark-ignition engines, SAE
paper 680468, 1968.
87. Blair G.P., Studying scavenge flow in a two-stroke cycle engine, SAE paper
750752, 1975.
88. Sammons H., A single-cycle test apparatus for studying loop-scavenging in a two-
stroke engine, Proc. IMechE, Vol 160, 1949, p233.
89. Sweeney M.E.G., et al, Single cycle gas testing method for two-stroke engine
scavenging, SAE paper 850178, 1985.
90. Blair G.P., Design and simulation of two-stroke engines, SAE Inc, 1996.
91. Heywood J.B. and Sher Eran, The Two-stroke Cycle Engine: Its Development,
Operation, and Design, Taylor and Francis, 1999.
92. Andreae, M., Cheng, W., Kenney, T., and Yang, J., "On HCCI Engine Knock,"
SAE Technical Paper 2007-01-1858, 2007, doi:10.4271/2007-01-1858.

178
93. Yang C, Zhao H, Megaritis T., In-cylinder studies of CAI combustion with
negative valve overlap and simultaneous chemiluminescence analysis, SAE
technical paper 2009–01-1103; 2009. doi:10.4271/2009-01-1103.
94. Zhang Y, Zhao H, Xie H, Hou S, Yang C., Characterization and heat release model
development of SI–CAI hybrid combustion and its application to a 4-stroke
gasoline engine operating with highly diluted mixtures, In: 33rd International
symposium of combustion, 3E07, Beijing (China): Tsinghua University; 2010.
95. Zhang Y,Zhao H., Measurement of short-circuiting and its effect on CAI or HCCI
combustion in a two-stroke poppet valve engine. Proc Inst Mech Eng,Part D:J
Automob Eng 2012. http://dx.doi.org/10.1177/095440701143425.
96. Zhang Y, Zhao H, Peckham M and Campbell B. Direct in-cylinder CO2
measurements of residual gas in a GDI engine for model validation and HCCI
combustion development. SAE technical paper 2013-01-1654, 2013.
DOI:10.4271/2013-01-1654.
97. Zhang, Y., Zhao, H., Xie, H., Hou, s. and Yang, C. (2010) Characterization and
heat release model development of SI-CAI hybrid combustion and its application to
a 4-stroke gasoline engine operating with highly diluted mixtures. In: 33rd
International Symposium of Combustion, Beijing, China, 1st - 6th August, 2010.

179
Appendix A – Publications related to this study
1. Yan Zhang and Hua Zhao, Optimisation of boosting strategy for controlled auto-
ignition combustion in a four-valve camless gasoline direct injection engine running
in two-stroke cycle, International Journal of Engine Research, February, 2014,
doi:10.1177/1468087413519991.
2. Yan Zhang and Hua Zhao, Investigation of combustion, performance and emission
characteristics of 2-stroke and 4-stroke spark ignition and CAI/HCCI operations in a
DI gasoline, Applied Energy, 130 (2014) 244–255.
3. Mohammed Moore Ojapah, Hua Zhao and Yan Zhang, Effects of Ethanol on
Performance and Exhaust Emissions from a DI Spark Ignition Engine with Throttled
and Unthrottled Operations, SAE Technical Paper 2014-01-1393, 2014.
4. Mohammed Moore Ojapah, Hua Zhao and Yan Zhang, Effects of Ethanol on Part-
load Performance and Emissions Analysis of SI Combustion with EIVC and
Throttled Operation and CAI Combustion, SAE Technical Paper 2014-01-1611,
2014.
5. Y Zhang and H Zhao, Lean boost CAI combustion in a two-stroke poppet valve GDI
engine, Internal Combustion Engines: Performance, Fuel Economy and Emissions,
ISBN: 978-1782421832, 2013.
6. Yan Zhang, Hua Zhao, Mohammed Ojapah and Alasdair Cairns, CAI combustion of
gasoline and its mixture with ethanol in a 2-stroke poppet valve DI gasoline engine,
Fuel, Vol. 109, 2013, Pages 661–668, http://dx.doi.org/10.1016/j.fuel.2013.03.002.
EI: 20133716739597, SCI: WOS:000320651700083
7. Zhang, Y., Zhao, H., Peckham, M., and Campbell, B., "Direct In-cylinder CO2
Measurements of Residual Gas in a GDI Engine for Model Validation and HCCI
Combustion Development," SAE Technical Paper 2013-01-1654, 2013,
doi:10.4271/2013-01-1654.
8. Ojapah M, Zhang Y and Zhao H, Part-load Performance and Emissions Analysis of
SI Combustion with EIVC and Throttled Operation and CAI Combustion, Internal
Combustion Engines: Performance, Fuel Economy and Emissions, ISBN: 978-
1782421832, 2013.
9. Ojapah, M., Zhang, Y., and Zhao, H., "Analysis of Gaseous and PM Emissions of 4-
Stroke CAI/HCCI and SI Combustion in a DI Gasoline Engine," SAE Technical
Paper 2013-01-1549, 2013, doi:10.4271/2013-01-1549.

180
10. Zhang, Y., Zhao, H., Ojapah, M., and Cairns, A., "Effects of Injection Timing on CAI
Operation in a 2/4-Stroke Switchable GDI Engine," SAE Int. J. Engines 5(2):67-75,
2012, doi:10.4271/2011-01-1773. EI: 20121414931127.
11. Y. Zhang and H. Zhao, Measurement of short-circuiting and its effect on CAI or
HCCI combustion in a two-stroke poppet valve engine, Proc Inst Mech Eng, Part D: J
Automobile Engineering, vol. 226, No. 8, pp. 1110-1118,2012,
http://dx.doi.org/10.1177/095440701143425.
12. Mohammed Ojapah, Yan Zhang, Hua Zhao, and Lionol Ganippa, Particulate matter
emission from different combustion modes in a 2/4 stroke switchable direct injection
gasoline engine, Internal Combustion Engines: Improving Performance, Fuel
Economy and Emissions, Institution of Mechanical Engineers, ISBN: 978-0-85709-
205-2, 2011.EI: 20123615398396