EXPERIMENTAL INVESTIGATION OF BOILING...
45
EXPERIMENTAL INVESTIGATION OF BOILING HEAT CONVECTION IN A FRACTURE A REPORT SUBMITTED TO THE DEPARTMENT OF PETROLEUM ENGINEERING IN PARTIAL FULFILLMENT OF THE REQUIREMENTS FOR THE DEGREE OF MASTER OF SCIENCE by Robert J. DuTeaux December 14, 1998
Transcript of EXPERIMENTAL INVESTIGATION OF BOILING...
EXPERIMENTAL INVESTIGATION OF BOILING HEATCONVECTION IN A FRACTURE
A REPORT SUBMITTED TO THE DEPARTMENT OF PETROLEUMENGINEERING IN PARTIAL FULFILLMENT OF THE
REQUIREMENTS FOR THE DEGREE OFMASTER OF SCIENCE
by
Robert J. DuTeaux
December 14, 1998

i
ABSTRACT
This report focuses on the coupling between heat conduction and heat
convection with boiling flow in a rock fracture. An experimental investigation
attemped to analyze and quantify this coupling, which can be called a boiling
convection coefficient. This coefficient is the proportionality factor between the
heat flux to a fracture surface and the temperature of the rock near a fracture as
water boils on that surface. Two types of experimental investigations, one
transient experiment with boiling on a nonporous glass surface, and one steady
state experiment with boiling on the surface of a rock from a geothermal
reservoir, were conducted. On nonporous surfaces, the heat flux described by a
boiling regime is strongly coupled to the flow regime of the fluid flowing along
that surface. However, on a porous rock surface the near-surface temperature of
the rock is prescribed by thermodynamics and controlled by measurable
parameters such as porosity and permeability. The excess temperature
associated with boiling appears to be much less coupled to the flow of fluid on
that surface. These results encourage the development of a discrete fracture
network model for a geothermal reservoir that would use a convection coefficient
for coupling conductive heat transport in unfractured rock to the convective heat
transport with fluid in fractures. Although more research is needed to construct a
model, such a model could be useful for predicting the propagation of a thermal
front associated with injection into vapor dominated reservoirs.
ACKNOWLEDGMENTS
This research was supported by DOE contract DE-FG07-95ID13370. The
support of Dr. Roland Horne in the pursuit of new approaches to challenging
problems and the freedom to pursue unexplored territory is greatly appreciated.
I am grateful also to Bill Brigham, Shaun Fitzgerald and Cengiz Satik for their
guidance. I was also honored to have the support of M-many friends, Marilou,
Michelle, Meiqing, and Martha. Thank you.

iii
TABLE OF CONTENTS
ABSTRACT ..................................................................................................................... iACKNOWLEDGMENTS .................................................................................................. iTABLE OF CONTENTS.................................................................................................. iii1 INTRODUCTION..................................................................................................... 1
1.1 Dimensional Scales.............................................................................................. 11.2 Development of a Discrete Fracture Network Model ............................................ 11.3 Two Areas of Research Required ........................................................................ 2
2 BACKGROUND ON DIMENSIONAL SCALES AND MODELING ............................ 42.1 Thermal Diffusivity ............................................................................................... 42.2 Efficiency of Heat Mining - Dimensional Scales ................................................... 52.3 Simple Analytical and Numerical Models.............................................................. 62.4 Porous Continuum Models ................................................................................... 62.5 Dual Porosity Models ........................................................................................... 7
3 BACKGROUND - BOILING CURVE, BOILING AND FLOW REGIMES................... 93.1 Nucleation and Boiling ......................................................................................... 93.2 Boiling Curves...................................................................................................... 93.3 Boiling Regimes ................................................................................................. 103.4 The Boiling Convection Coefficient .................................................................... 113.5 Flow Regimes .................................................................................................... 12
4 TRANSIENT EXPERIMENT, DESCRIPTION, DATA, AND DISCUSSION ............ 164.1 Description of Apparatus.................................................................................... 164.2 Experimental Proceedure................................................................................... 174.3 Experimental Data - Single-Phase Flow............................................................. 194.4 Experimental Data - Boiling Flow ....................................................................... 204.5 Discussion........................................................................................................... 24
5 STEADY STATE BOILING IN A POROUS ROCK FRACTURE............................. 265.1 Boiling on a Porous Rock Surface...................................................................... 265.2 Experimental Preparations ................................................................................. 265.3 Experimental Procedure ................................................................................. 285.4 Experimental Data and Observations................................................................. 295.5 Discussion.......................................................................................................... 31
6 CONCLUSIONS .................................................................................................... 357 REFERENCES ...................................................................................................... 36

1
1 INTRODUCTION
1.1 Dimensional Scales Water injected into a geothermal reservoir travels through the reservoir on a time
scale established by the mean arrival time of a tracer at a production well and on
a length scale defined by the separation distance between wells. Modeling the
time and distance scales of fluid and thermal energy transport in fractured
reservoirs, however, has been difficult because pressure and temperature
changes occur on very different dimensional scales in flowing fractures and in
unfractured rock. For example, while tracers (and therefore heat) can be
transported by fluid convection through fractures tens or even hundreds of
meters in only a few hours (Grant 1982, Horne 1982), heat flow in low
permeability unfractured rock can require on the order of 30 years to diffuse 30
meters away from a temperature perturbation (Pruess 1990). This is due to the
physical properties of rocks in fractured geothermal reservoirs which typically
have small thermal conductivities (for example see Walters and Combs 1991),
low porosity (for example see Gunderson 1991), and very small intrinsic
(unfractured matrix) permeabilities (Reed 1998). This means that the spatial and
temporal discretizations employed in a geothermal reservoir simulation designed
to model the dimensional scales of fluid and tracer transport in fractures may
have significant difficulty resolving the scale of distances associated with
diffusion phenomena that occur in unfractured rock. The characteristic time and
distance scales of transport models for fractured rock often cannot
simultaneously represent phenomena in unfractured rock with desired accuracy.
Since reinjection of thermally depleted water is common in the operation of
geothermal reservoirs around the world, the ability to model the physical
processes associated with reinjection has been an important aspect of reservoir
engineering.
1.2 Development of a Discrete Fracture Network Model One modeling approach that has been applied successfully to the simulation of
chemical transport in fractured reservoirs is to formulate a fractured network
2
model. Since chemical diffusion induced by a concentration gradient is
analogous to heat diffusion driven by a temperature gradient, it seems
appropriate to investigate the possibility of constructing a fracture network model
for a geothermal reservoir. Such a model simulates the different transport
mechanisms in fractures and unfractured matrix separately, and then couples
the two models together by describing the boundary condition between them.
Therefore fractures and matrix are modeled as discrete entities, each with their
own transport mechanisms and characteristic dimensional scales. In order to
construct such a model, a relationship that describes the coupling between
transport in fractures and the unfractured rock matrix must be developed. For
example, with chemical transport in fractured reservoirs the coupling can be
described by adsorption isotherms. This report, however, describes the research
that has been conducted to analyze and quantify the coupling between heat
conduction in rock and heat advection with fluid in a fracture. This research has
focused on the relationship between the boiling temperature near a fracture
surface and the heat flux to that surface. The proportionality factor between
these two quantities will hereafter be called a boiling convection coefficient.
1.3 Two Areas of Research Required There are two main research efforts required for developing a fractured network
geothermal model with boiling and multiphase flow: 1.) A complete mathematical
description of two phase flow (and all possible flow regimes) in a rock fracture;
and 2.) A quantification of boiling/condensing convection coefficients to quantify
the heat exchange between the rock matrix and flowing fractures. Literature on
boiling and condensation with multiphase flow in heat exchangers provides a
basis for understanding how a fractured network model could be constructed,
however, flow and boiling in rock fractures is influenced by the porous nature of
those surfaces, and further research needs to be conducted in order to
investigate these differences. While the mathematical description of multiphase
flow in fractures may be the most difficult aspect of developing a discrete fracture
model, this report concentrates primarily upon analyzing and quantifying the

3
boiling convection coefficient, with a minor analysis of multiphase flow and flow
regimes inspired by visual observations made during experiments.
4
2 BACKGROUND ON DIMENSIONAL SCALES AND MODELING
2.1 Thermal Diffusivity The characteristic dimensional scales for thermal energy transport in unfractured
rock depend upon the intrinsic permeability and thermal diffusivity of the rock.
For the heat transport in very low permeability rock, the thermal diffusivity of the
rock determines how far a temperature perturbation travels through the
unfractured reservoir in a given amount of time. Thermal diffusivity ( α ) is the
ratio thermal conductivity / volumetric heat capacity of a rock; α = k / ρ Cp, where
ρ denotes density and Cp denotes heat capacity. Thermal diffusivity is a property
that describes and couples the characteristic time and length dimensional scales
for conductive heat diffusion. Many rocks, including geothermal rocks, have
thermal diffusivities on the order of 1.0 E -6 m2/s. The Fourier number ( Fo ),
dimensionless time, is the ratio of the heat conduction rate to the rate of thermal
energy storage in a solid; Fo = ( α t ) / L2, where t denotes time and L denotes
length or distance. Setting this ratio equal to one and rearranging terms reveals
the expressions for characteristic length ( Lc ), or characteristic time, ( tc ).
Lc = √ ( α t ) or similarly, tc = L2 / α α = thermal diffusivity ( 2.1.1 )
Plugging the value of 1.0 E -6 m2/s for the thermal diffusivity of rock and the time
of 30 years into Equation 2.1.1 results in a characteristic length of about 30
meters.
Furthermore, the diffusion of hydraulic pressure and dissolved chemical species
into unfractured rock are analogous to the diffusion of heat into very low
permeability rock, and often operate on similar dimensional scales.
In unfractured rocks the intrinsic hydraulic diffusivity determines the distance a
pressure perturbation travels in a given time. Since temperature gradients drive
heat conduction, and pressure gradients drive fluid flow, the thermal and
5
hydraulic diffusivities of reservoir rocks are properties that regulate the
dimensional scales for the transport of heat and fluid. Since pressure changes
propagate quickly through fractures but slowly through a low permeability matrix,
nonequilibrium conditions of temperature and pressure in fractured rock may
persist during injection and exploitation of geothermal reservoirs. In fractured
reservoirs, the fluid velocity through the fractures can be many orders of
magnitude greater than in the unfractured rock, and because heat is convected
by the fluid in fractures, both heat and fluid travel across reservoir distances
much faster than they do in unfractured matrix rock.
2.2 Efficiency of Heat Mining - Dimensional Scales One reason for injecting thermally depleted water is to extract more of the total
heat energy of a reservoir, which is contained largely in the heat capacity of the
reservoir rock, rather than the in-situ fluid. Therefore, a consideration for the
efficiency of producing additional energy can be made that illustrates the
dimensional scales of thermal energy transport in fractured reservoirs. For
example, if the thermal time constant (characteristic time) required for heat to
diffuse from the midpoint between flowing fractures is much less than the mean
tracer residence time in an adjacent fracture, the injected fluid will extract a large
fraction of the heat available in the rock. Analysis shows that when flowing
fractures are spaced on the order of a few meters or less, the assumption of
thermodynamic equilibrium between the rock and the fluid can be justified if the
fluid velocity is not exceptionally great. In this case, a relatively uniform thermal
front will propagate spatially outward from the injection well. If, however, the
time required for thermal diffusion between fractures is much greater than the
fluid residence time in adjacent fractures, cold fluid will “finger” down the fracture
surfaces toward a production well leaving great quantities of energy in place. The
rate of propagation of a thermal front outward from an injection well, and the
fraction of total reservoir energy produced are therefore strongly dependent upon
the contrast between the velocity of flow in fractures and the rate of thermal
energy transport in the unfractured reservoir matrix.
6
2.3 Simple Analytical and Numerical Models Several significant publications develop analytic and numerical solutions for fluid
flow and heat transfer fractured rock. (for early examples see Bodvarsson 1974
and 1982, Gringarten 1975, Kuo 1975 and 1976, Weeler 1969). A relatively
simple solution for one-dimensional conduction from an infinite medium normal
to single-phase flow in a fracture is given by Carslaw and Jaeger (1959) in their
text on heat conduction. These studies illuminate the important relationships
between flow rates, thermal time constants, and characteristic dimensions, but
concern single-phase flow in only simplistic geometries. While a thorough
understanding of dimensional scales can be derived from these works, such
models are generally not a sufficient basis for making many of the operating
decisions that have to be made by reservoir engineers, and so more
sophisticated numerical models have been developed.
2.4 Porous Continuum Models Borrowing heavily from petroleum and groundwater simulation technology, the
method that has been most widely applied to commercial geothermal reservoirs
is a porous continuum approach, where the hydraulic properties of the fractures
and matrix are combined with the concept of a representative elemental volume
(REV) and simulated on a reservoir scale.
The idea of a REV is fundamental to the derivation of the continuity of mass,
momentum, and energy equations in a continuum model. This volume defines a
characteristic dimensional scale for the discretization of a simulation model.
Valid volume elements in a simulation must be as big or larger than a REV. On
the REV scale, reservoir quantities are considered uniformly distributed. That is,
any larger volume would have the same properties, but smaller volumes would
not necessarily represent reservoir properties on a simulation scale. Thus, the
standard formulation of a continuum assumes homogeneous porosity,
permeability, phase saturations, and temperature within a REV. Thus,
thermodynamic equilibrium within each volume element is assumed. The
unavoidable problem in modeling a fractured geothermal reservoir as a
7
continuum is that the REV must be larger than the spacing of major permeable
fractures in order to model permeability in a continuum. Since some geothermal
reservoirs have large scale fault-controlled permeability (for example see
Beowawe Nevada, Faulder 1997), this implies that a REV could be larger than
the injection-production well spacing. A continuum formulation, however, is the
standard model because the dynamics of fluid flow and phase transition in
porous media have a relatively broad foundation of technology, being widely
applied in the petroleum industry.
2.5 Dual Porosity Models Acknowledging the contrast in dimensional scales for fractured reservoirs has
thus led to a double porosity (dual continuum) approach for modeling such
reservoirs (Warren and Root 1963). This separates the properties of a fractured
reservoir into multiple continua. These continua include a connected continuum
representing the dimensional extent and properties of fractures, surrounding
multiple continua that represent the unfractured blocks of rock matrix. The
unfractured matrix continua have porosities, permeabilities, and other properties
that contrast with the fractured continuum. Since numerical difficulties arise
when steep temperature or pressure gradients develop between adjacent
discretized regions, the fractures are not spatially discrete. Rather, adjacent
discretized elements have intermediate properties that gradually transition from
those of the fractures to those of the matrix. This means that the two-
dimensional planar geometry of fractures must be "smeared" into three-
dimensional volumes including elements representing fractured continuum,
intermediate continua, and matrix continua.
Dual porosity models are the current industrial standard for simulating fractured
reservoirs, however, some of the fundamental physical assumptions made for
these models continue to require further scientific verification. For example, both
capillary continuity and relative permeability in fractures, which have powerful
influences in reservoir simulations, remain controversial (compare W. Chen
1987, J. Chen 1991, and Kazemi 1979 1992 to Firoozabadi 1990 and Labastie
8
1990 on capillary continuity; compare results from Corey 1954, Council 1979,
Ambusso 1996, and Fulcher 19?? on relative permeability). In continuum and
dual continuum models no physical representation of the actual geometry or
hydraulic properties of fractures is made, even though the hydraulic nature of
fractures has been shown to differ from porous media (Witherspoon 1980).
Instead, hydrologic behavior relies upon Darcy flow in porous media and upon
relative permeability curves. Furthermore, these models generally do not include
some of the potentially significant couplings between permeability and pore
pressure (Boitnott 1990, Ozdogan 1994), thermally-induced rock deformation
(Harlow 1972, Tester 1989) or mineral precipitation/dissolution (D’Amore 1983,
Robinson 1982), and do not account for the documented adsorption of injected
liquid in vapor-dominated systems (Hornbrook 1994).
With these considerations, and yet a great respect for the sophistication and
utility of modern continuum models, this research examines the possibility of
developing a more physically based model of the thermal and hydraulic behavior
of a discrete fracture.
9
3 BACKGROUND - BOILING CURVE, BOILING AND FLOW REGIMES
3.1 Nucleation and Boiling
Excess temperature, (∆Te), defined as ∆Te = Tsurface - Tsaturation, is required for the
nucleation of bubbles in a boiling process. However, the surface tension of a
fluid and the size distribution of small asperities (and their geometry) on a
surface influences the ∆Te required for nucleation. For example, very smooth
surfaces require large excess temperatures because the radii of curvature of
bubbles begin infinitely small and require very large pressure differences
between the vapor and the liquid to expand the bubbles. On rough surfaces,
bubbles may expand more easily because they begin in the sharp crevices and
expand with larger radii of curvature. In porous media, the size of the pores
relates to the thermodynamics of vaporization and the mobilization of vapor
(Udell 1982). This suggests that the boiling process begins with physical
dynamics that are specific to the fluid and the surface or pore space involved.
Although no rigorous theory exists, it is generally accepted that bubbles
departing from a surface promote the mixing of a superheated boundary layer
with the bulk fluid, and the bulk fluid displaces the volume previously occupied by
the bubble bringing cooler fluid into contact with the surface. Research has
demonstrated that the heat flux during nucleate boiling is proportional to the
nucleation site density as well as the excess temperature on a surface
(Yamagata 1955).
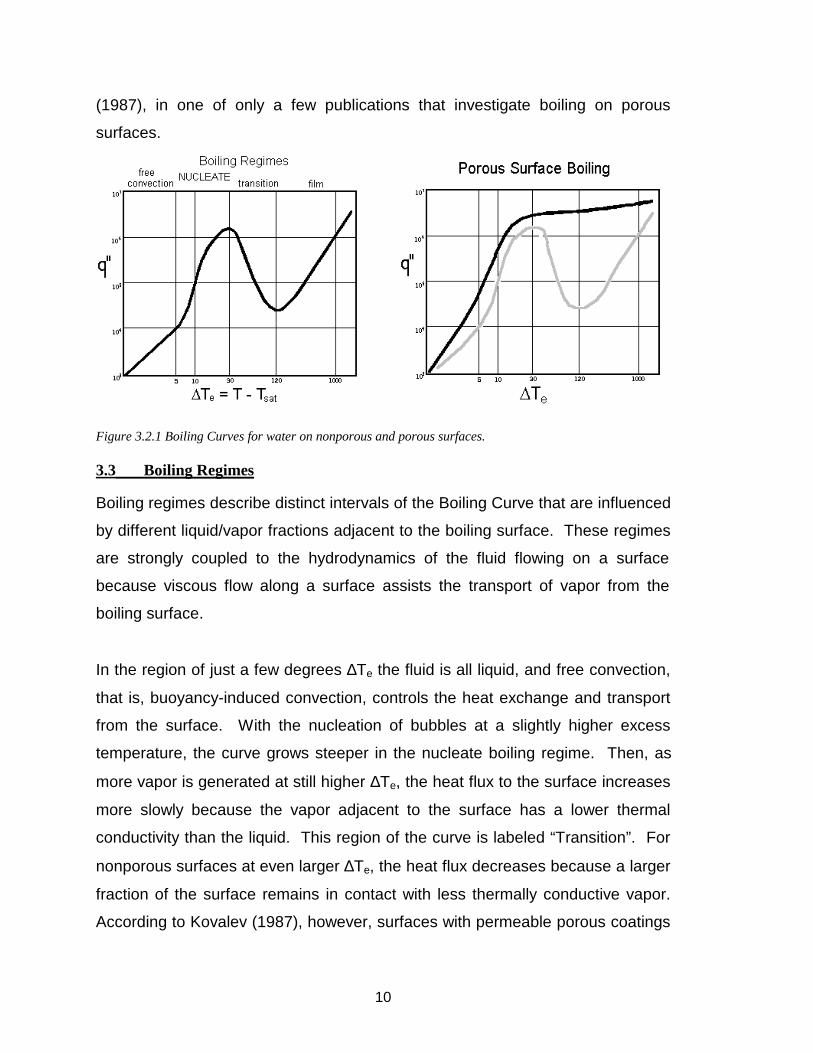
3.2 Boiling Curves A commonly employed illustration of the proportional relation between surface
heat flux and ∆Te is the boiling curve shown on the left in Figure 3.2.1. On the
right side of this figure is a qualitative comparison of boiling curves for a surface
with a porous coating, shown by the black curve, and a nonporous surface,
shown by the gray curve. This porous boiling curve is illustrated by Kovalev
10
(1987), in one of only a few publications that investigate boiling on porous
surfaces.
Figure 3.2.1 Boiling Curves for water on nonporous and porous surfaces.
3.3 Boiling Regimes
Boiling regimes describe distinct intervals of the Boiling Curve that are influenced
by different liquid/vapor fractions adjacent to the boiling surface. These regimes
are strongly coupled to the hydrodynamics of the fluid flowing on a surface
because viscous flow along a surface assists the transport of vapor from the
boiling surface.
In the region of just a few degrees ∆Te the fluid is all liquid, and free convection,
that is, buoyancy-induced convection, controls the heat exchange and transport
from the surface. With the nucleation of bubbles at a slightly higher excess
temperature, the curve grows steeper in the nucleate boiling regime. Then, as
more vapor is generated at still higher ∆Te, the heat flux to the surface increases
more slowly because the vapor adjacent to the surface has a lower thermal
conductivity than the liquid. This region of the curve is labeled “Transition”. For
nonporous surfaces at even larger ∆Te, the heat flux decreases because a larger
fraction of the surface remains in contact with less thermally conductive vapor.
According to Kovalev (1987), however, surfaces with permeable porous coatings
11
continue to maintain relatively high heat fluxes. The reasons for this difference
are topics for future research.
3.4 The Boiling Convection Coefficient
Heat transfer for internal flow is commonly characterized by the Nusselt number,
which can be viewed as a dimensionless convection coefficient and describes
the temperature gradient at the surface-fluid contact. The convection coefficient
( h ) is a factor of proportionality between the heat flux and the temperature
difference between a surface and the bulk fluid in accordance with Newton’s law
of cooling q” = h(Tsurface - Tfluid). With boiling, the convection coefficient ( hb ) is a
function of excess temperature, hb = q”/∆Te, and hb can be orders of magnitude
larger than a single phase convection coefficient.
Fluid properties, as well as rock properties, determine the heat convected with a
fluid in a boiling fracture. Surface tension (σ), the latent heat of vaporization
(hfg), viscosity (µ), flow velocity (u), fluid conductivity (kf), the liquid and vapor
phase heat capacities (Cp,liq/vap), and the density difference between the liquid
and vapor (ρliq-ρvap), gravity g, and length dimension L, are fundamental
parameters. In order to reduce the number of functional variables to a minimum
these may be grouped into a smaller number of dimensionless groups. The
common groups relevant for boiling include the Reynolds number ρ u L / µ (Re),
the Prandtl number µ Cp / kf (Pr), the Jakob number Cp ∆Te / hfg (Ja), and the
Bond number g (ρliq-ρvap) / σ (Bo). The Nusselt number h L / kf (Nu), which
characterizes the convection coefficient h, is considered a function of these
dimensionless parameters (Incropera and DeWitt, 1990), but may also be
influence by additional factors in fractured rock.
Empirical studies of boiling quantify either the heat flux at the surface or the
convection coefficient as functionally dependent upon these parameters and
∆Te. One well known example of an empirical relation, valid in the nucleate
boiling regime for pool boiling, was developed by Rohsenow in 1952, with q” =
12
(µliq hfg) [g(ρliq-ρvap)/σ]0.5 {Cp,liq ∆Te / (Cs,f hfg Prn)}3, where Cs,f and n are
characteristic of the surface and fluid to be determined by experimental data.
Many similar empirical correlations have been developed in other researchers for
various boiling regimes (Lung 1977, and Carey 1992).
Such correlations that quantify a boiling convection coefficient have been based
upon empirical studies of multiphase heat exchangers. Many of these relations
were developed with either unconfined surfaces, or tubes with horizontal and
vertical orientations in heat exchangers for specific flow regimes. They lack the
potentially important considerations for flow in porous rock fractures. Clearly,
further experimental work with geothermal rocks and fluids will be required to
establish a useful empirical relationship between excess temperature and the
heat flux to fracture surfaces with boiling flow.
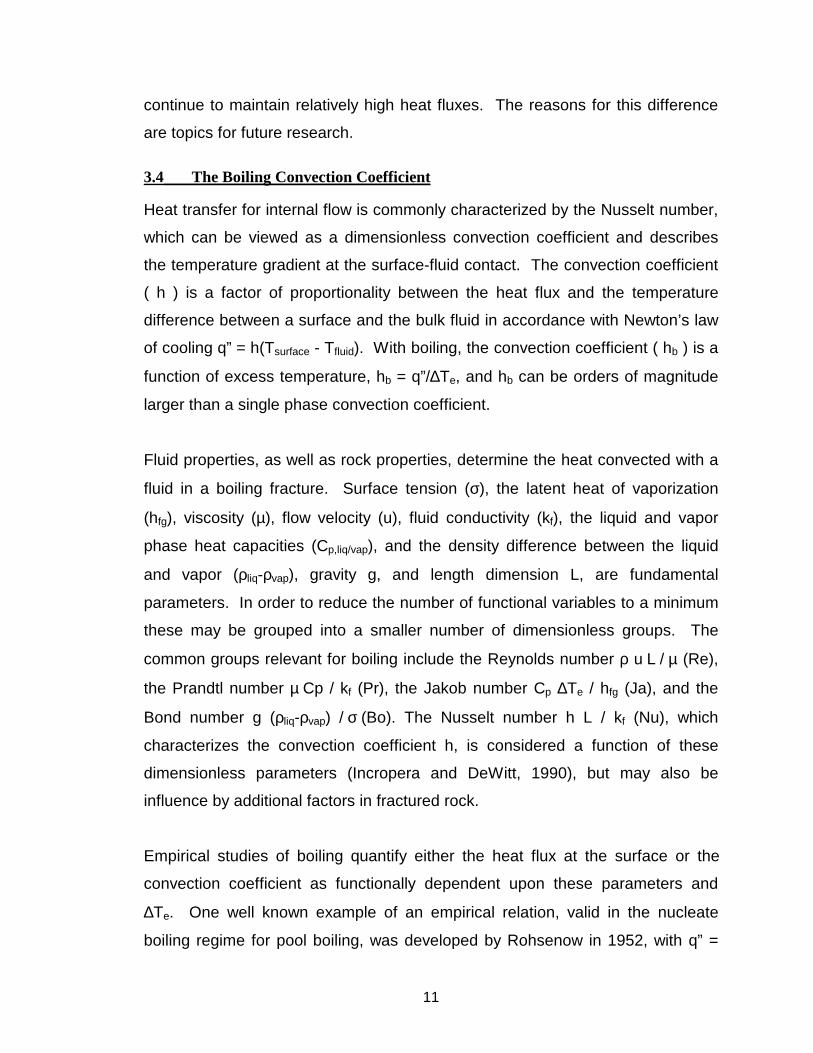
3.5 Flow Regimes With an understanding of boiling regimes it is easy to understand how the fluid
dynamics can affect the convection of heat away from boiling surfaces. The
term “flow regime” describes the mechanics of fluid motion in an interval that is
distinct from the fluid dynamics at other locations that have different liquid/vapor
fractions. Observations have shown that flow regimes influence the heat flux to
the boundary of the flow, and the heat flux affects the mechanics of the fluid
motion by generating vapor at the margins of flow. Figure 3.5.1 helps to
describe the relations between boiling and flow regimes.
Limited analogies to flow in tubes and channels were considered in the
developing of Figure 3.5.1, and similar figures can be found in texts on
vaporization and condensation in heat exchangers. The effects of porosity,
roughness, variable fracture aperture, and the permeable nature of rock surfaces
have been neglected in this simple illustration, however, the figure can be useful
for a general description of injection into a horizontal fracture. Near the injection
location the liquid is subcooled, and heat from the matrix begins a boiling
process that proceeds from bubbly flow, to slug flow where bubbles coalesce,
13
into annular and mist flow until the moving fluid becomes completely vaporized.
The boiling regimes in this illustration are divided into nucleate boiling and film
evaporation.
Figure 3.5.1: A qualitative description of boiling and flow regimes.
In Figure 3.5.1, nucleate boiling begins at the margins of the flow and generates
bubbles that migrate into the main channel of flow. This occurs at relatively low
quality, that is, at relatively small vapor fractions in the flow. As quality increases
the mean velocity of the flow increases with the decreasing mean density of the
fluid. Annular flow, therefore, may occur with exchanges of momentum between
the liquid and vapor fluxes and liquid droplets can become entrained in the vapor
flow. As further evaporation occurs, annular film evaporation may become the
boiling mechanism at relatively higher fractions of vapor in the channel. Annular
film evaporation is a mass flux from the liquid to a vapor phase without the
nucleation of bubbles across a thin film of liquid at the margin. In the horizontal
14
orientation shown, the liquid and vapor can segregate due to density differences
and the boundary conditions for heat transfer from above and below the fracture
can be different.
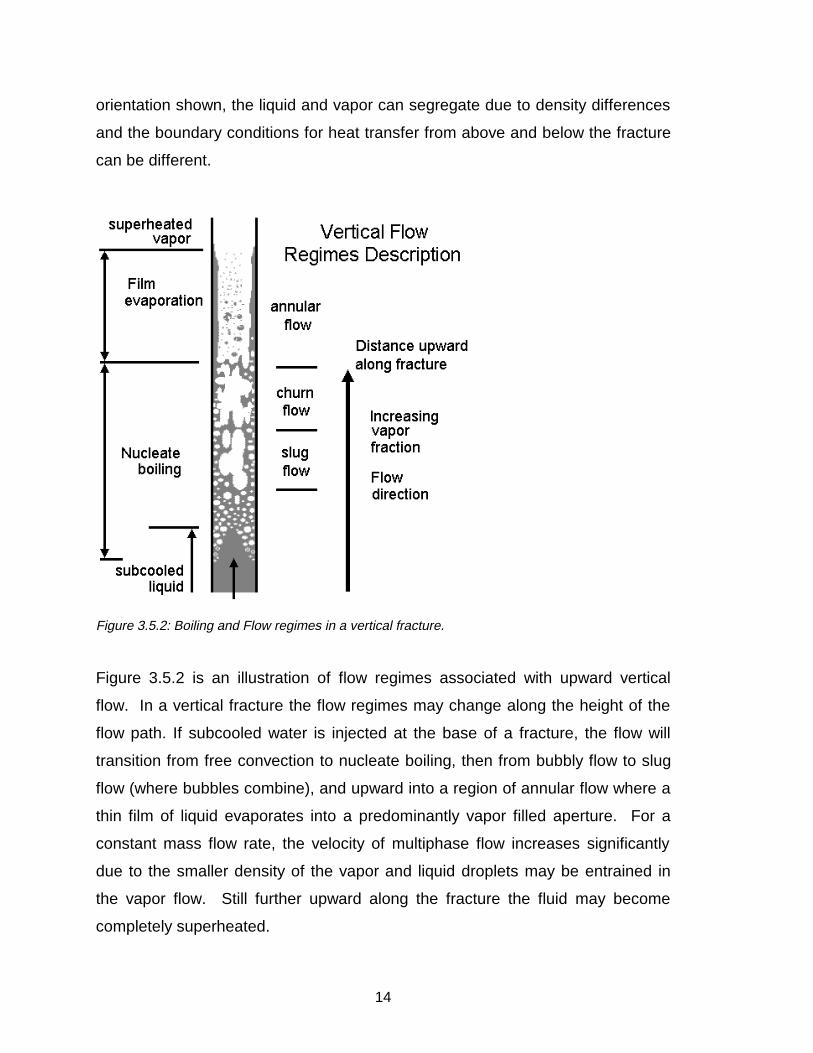
Figure 3.5.2: Boiling and Flow regimes in a vertical fracture.
Figure 3.5.2 is an illustration of flow regimes associated with upward vertical
flow. In a vertical fracture the flow regimes may change along the height of the
flow path. If subcooled water is injected at the base of a fracture, the flow will
transition from free convection to nucleate boiling, then from bubbly flow to slug
flow (where bubbles combine), and upward into a region of annular flow where a
thin film of liquid evaporates into a predominantly vapor filled aperture. For a
constant mass flow rate, the velocity of multiphase flow increases significantly
due to the smaller density of the vapor and liquid droplets may be entrained in
the vapor flow. Still further upward along the fracture the fluid may become
completely superheated.
15
In this illustration the effect of gravity does not cause a segregation of flow, but it
does exert a differential force on the liquid and vapor phases. In vertical flow the
buoyancy of the vapor and the interfacial tension between liquid and vapor allow
slugs of vapor to push slugs of liquid upward. Under the conditions where these
forces were in relative equilibrium, instability occurs and the flow can become
chaotic. This is illustrated as the “churn flow” regime.
To summarize, the morphology of a flow regime depends, in part, on how the
boiling mechanism at the boundary adds vapor to the flow, and the boiling
regime depends, in part, upon how the liquid and vapor fractions of the fluid
interact with the margins of the channel. Flow regimes involve the interaction of
viscous, capillary, inertial, and buoyancy forces. This interaction of forces
depends upon fluid properties and driving potentials, and may be highly
influenced by fracture orientation, aperture, and the exchange of momentum
between phases. One goal of the experimental research that follows is to
investigate the influence of boiling and flow regimes on a boiling convection
coefficient, the relationship between rock temperature and the heat flux to a
fracture surface.
16
4 TRANSIENT EXPERIMENT, DESCRIPTION, DATA, AND DISCUSSION
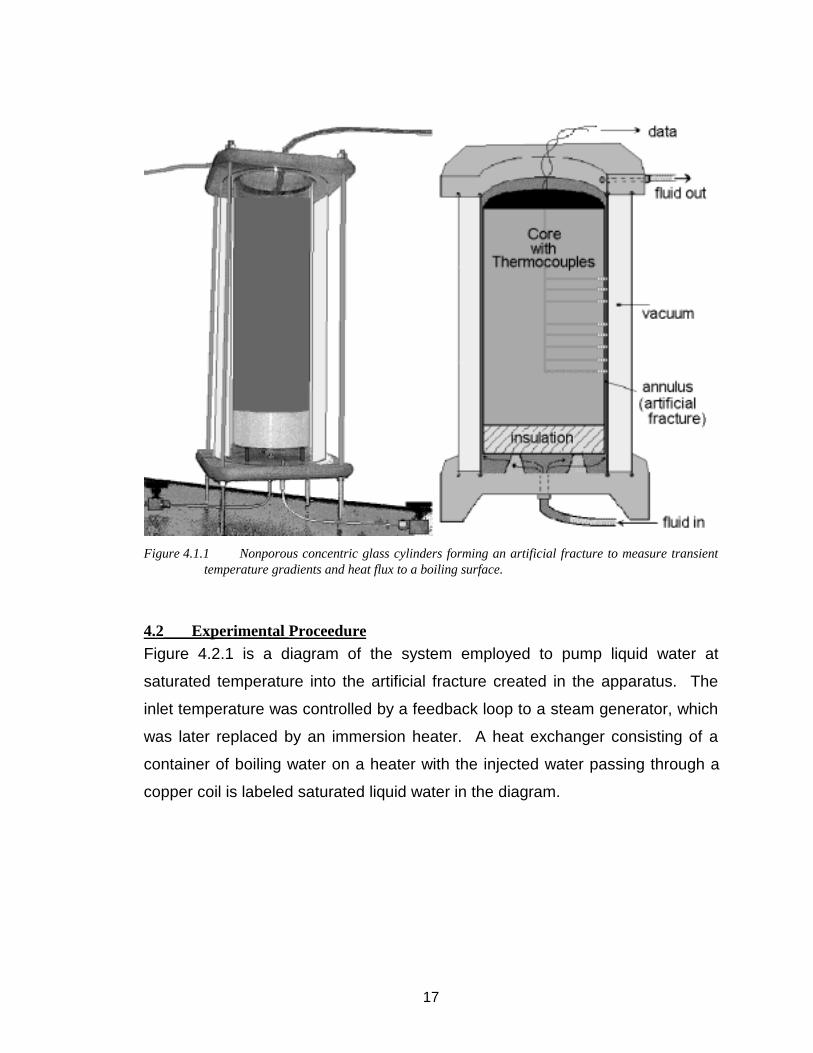
4.1 Description of Apparatus The experimental apparatus illustrated in Figure 4.1.1 was constructed to
measure the heat exchanged between a heated impermeable glass "core" and
water flowing upward and boiling in the concentric annulus around the core. The
annulus creates an artificial fracture less than one millimeter wide between two
large diameter glass tubes with a circumference of about 42 centimeters. The
core is a 135 mm (about 5 inches) diameter glass cylinder, closed at the bottom
to hold sand that has been heated to a temperature of about 150 oC. Water
flows upward in the annulus on the outside of the glass core, and not in the
sand. The sand only provides a medium with a conductivity and heat capacity
whose order of magnitude is comparable to rock, in order to develop temperature
gradients and heat flow on dimensional scales similar to real rock.
The apparatus is about 0.5 meters (18 inches) tall and has thermocouples
attached to the inside and outside of the core. A third concentric cylinder
surrounds the artificial fracture to reduce radial heat loss by applying a vacuum.
In a typical experiment, water was injected at near atmospheric pressure from
the bottom (z = 0) at a slow rate, so that (without boiling) it would take a few
minutes to reach the top. With boiling, a two-phase zone quickly extends from
the base to the top of the apparatus when boiling begins at the base of the
fracture.
The glass provides a nonporous impermeable surface, so unfortunately, does
not have the porosity, roughness, or a geometry anything like a natural fracture.
When preliminary experiments were conducted nucleation sites were sparsely
distributed, so a thin film of roughened Teflon was applied to the outside of the
cylinder in later experiments to provide better sites for the nucleation of bubbles.
This, however, also reduced the wettability of the surface, and these differences
must be considered when the data from this apparatus is analyzed.
17
Figure 4.1.1 Nonporous concentric glass cylinders forming an artificial fracture to measure transienttemperature gradients and heat flux to a boiling surface.
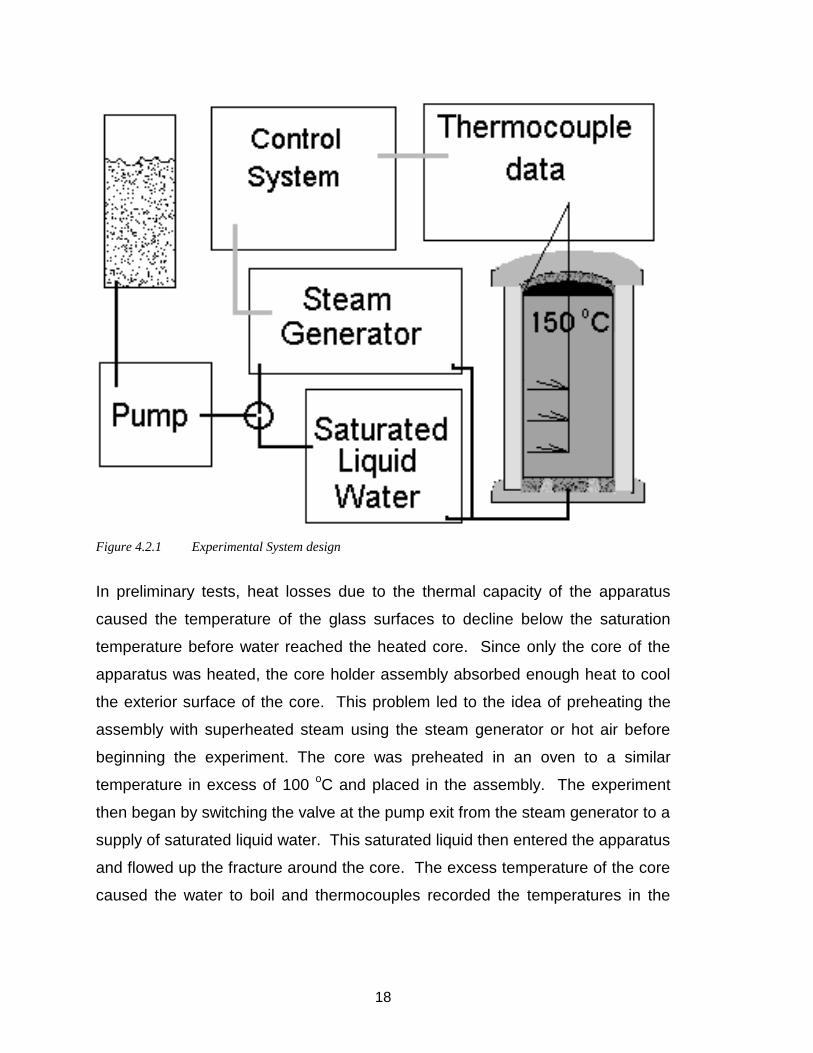
4.2 Experimental Proceedure Figure 4.2.1 is a diagram of the system employed to pump liquid water at
saturated temperature into the artificial fracture created in the apparatus. The
inlet temperature was controlled by a feedback loop to a steam generator, which
was later replaced by an immersion heater. A heat exchanger consisting of a
container of boiling water on a heater with the injected water passing through a
copper coil is labeled saturated liquid water in the diagram.
18
Figure 4.2.1 Experimental System design
In preliminary tests, heat losses due to the thermal capacity of the apparatus
caused the temperature of the glass surfaces to decline below the saturation
temperature before water reached the heated core. Since only the core of the
apparatus was heated, the core holder assembly absorbed enough heat to cool
the exterior surface of the core. This problem led to the idea of preheating the
assembly with superheated steam using the steam generator or hot air before
beginning the experiment. The core was preheated in an oven to a similar
temperature in excess of 100 oC and placed in the assembly. The experiment
then began by switching the valve at the pump exit from the steam generator to a
supply of saturated liquid water. This saturated liquid then entered the apparatus
and flowed up the fracture around the core. The excess temperature of the core
caused the water to boil and thermocouples recorded the temperatures in the
19
fracture, at the inner surface of the core, and radially inward toward the center of
the core.
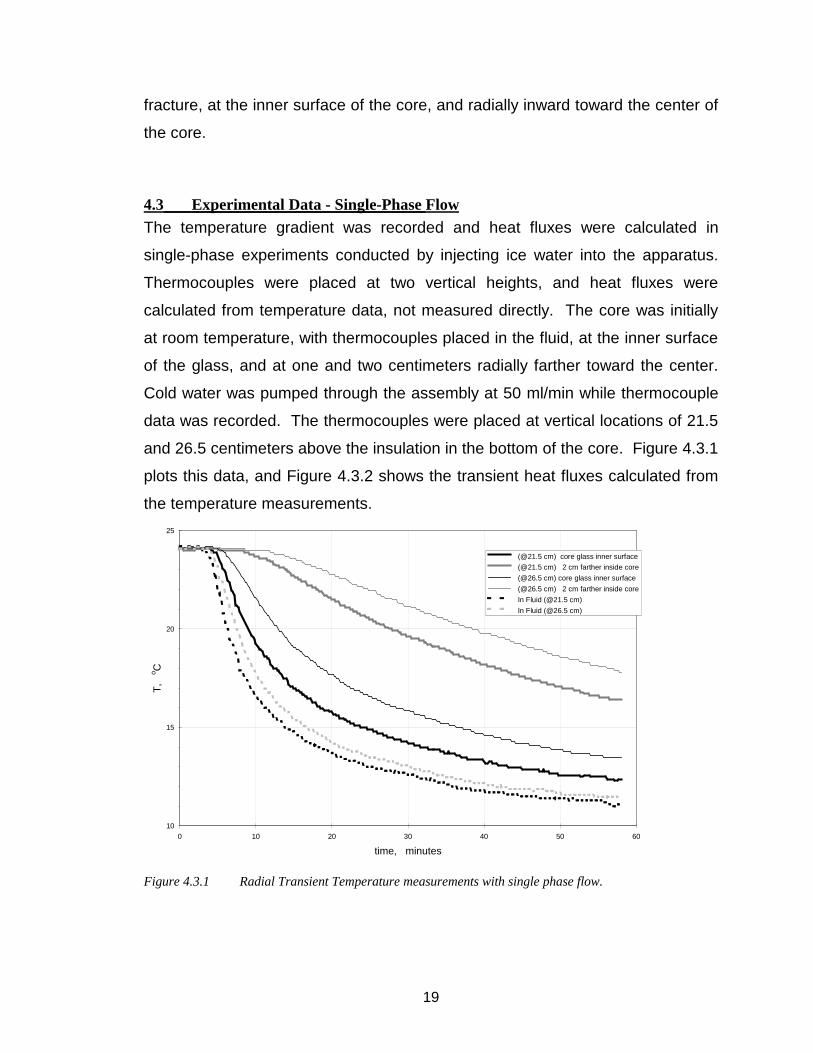
4.3 Experimental Data - Single-Phase Flow The temperature gradient was recorded and heat fluxes were calculated in
single-phase experiments conducted by injecting ice water into the apparatus.
Thermocouples were placed at two vertical heights, and heat fluxes were
calculated from temperature data, not measured directly. The core was initially
at room temperature, with thermocouples placed in the fluid, at the inner surface
of the glass, and at one and two centimeters radially farther toward the center.
Cold water was pumped through the assembly at 50 ml/min while thermocouple
data was recorded. The thermocouples were placed at vertical locations of 21.5
and 26.5 centimeters above the insulation in the bottom of the core. Figure 4.3.1
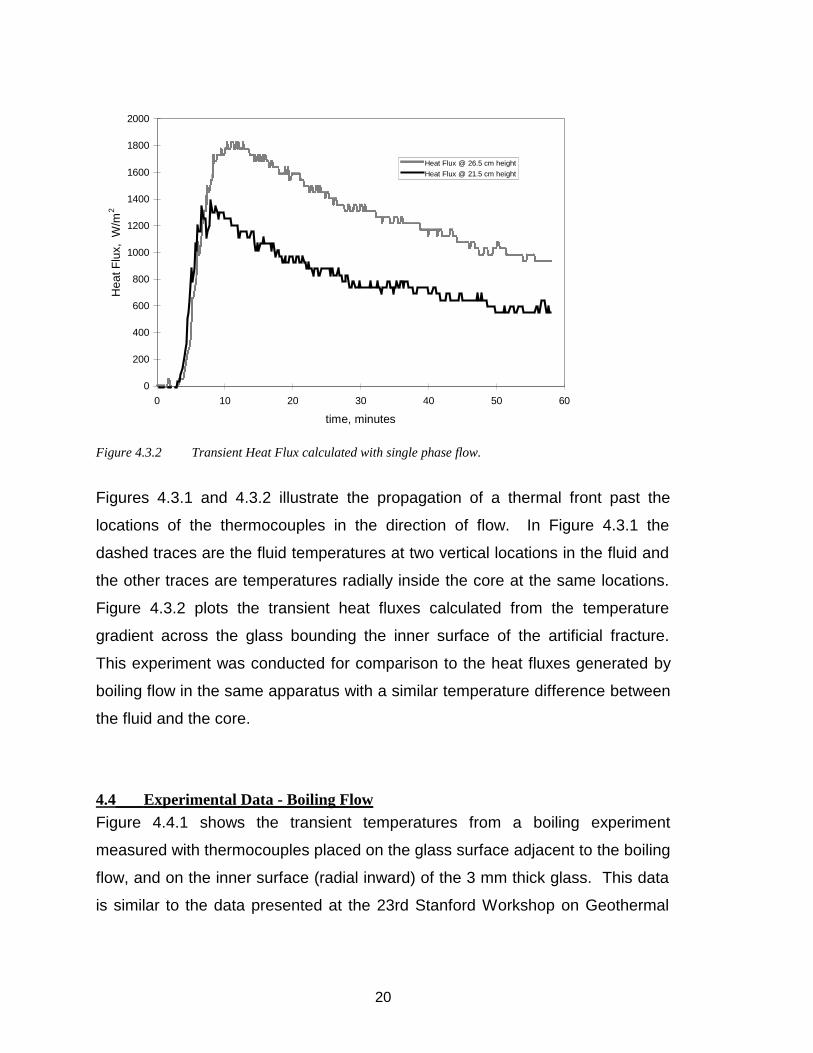
plots this data, and Figure 4.3.2 shows the transient heat fluxes calculated from
the temperature measurements.
10
15
20
25
0 10 20 30 40 50 60
time, minutes
T,
o C
(@21.5 cm) core glass inner surface
(@21.5 cm) 2 cm farther inside core
(@26.5 cm) core glass inner surface
(@26.5 cm) 2 cm farther inside core
In Fluid (@21.5 cm)
In Fluid (@26.5 cm)
Figure 4.3.1 Radial Transient Temperature measurements with single phase flow.
20
0
200
400
600
800
1000
1200
1400
1600
1800
2000
0 10 20 30 40 50 60
time, minutes
Hea
t Flu
x, W
/m2
Heat Flux @ 26.5 cm height
Heat Flux @ 21.5 cm height
Figure 4.3.2 Transient Heat Flux calculated with single phase flow.
Figures 4.3.1 and 4.3.2 illustrate the propagation of a thermal front past the
locations of the thermocouples in the direction of flow. In Figure 4.3.1 the
dashed traces are the fluid temperatures at two vertical locations in the fluid and
the other traces are temperatures radially inside the core at the same locations.
Figure 4.3.2 plots the transient heat fluxes calculated from the temperature
gradient across the glass bounding the inner surface of the artificial fracture.
This experiment was conducted for comparison to the heat fluxes generated by
boiling flow in the same apparatus with a similar temperature difference between
the fluid and the core.
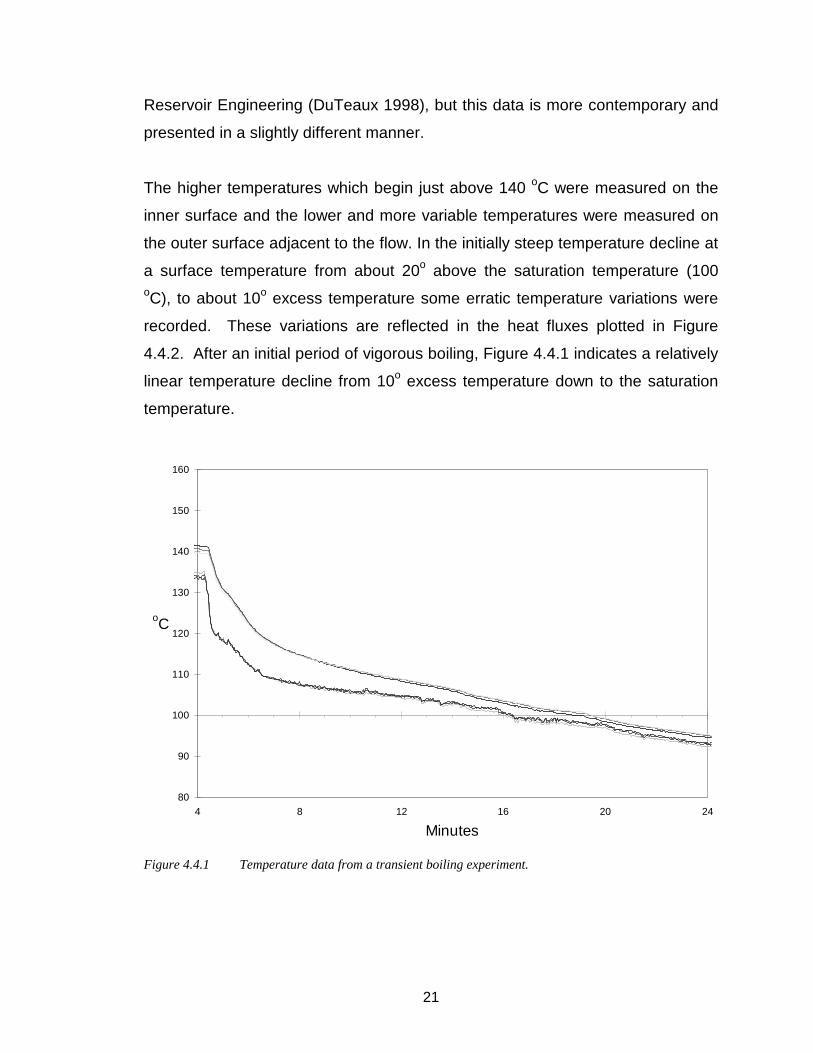
4.4 Experimental Data - Boiling Flow Figure 4.4.1 shows the transient temperatures from a boiling experiment
measured with thermocouples placed on the glass surface adjacent to the boiling
flow, and on the inner surface (radial inward) of the 3 mm thick glass. This data
is similar to the data presented at the 23rd Stanford Workshop on Geothermal
21
Reservoir Engineering (DuTeaux 1998), but this data is more contemporary and
presented in a slightly different manner.
The higher temperatures which begin just above 140 oC were measured on the
inner surface and the lower and more variable temperatures were measured on
the outer surface adjacent to the flow. In the initially steep temperature decline at
a surface temperature from about 20o above the saturation temperature (100oC), to about 10o excess temperature some erratic temperature variations were
recorded. These variations are reflected in the heat fluxes plotted in Figure
4.4.2. After an initial period of vigorous boiling, Figure 4.4.1 indicates a relatively
linear temperature decline from 10o excess temperature down to the saturation
temperature.
80
90
100
110
120
130
140
150
160
4 8 12 16 20 24
Minutes
oC
Figure 4.4.1 Temperature data from a transient boiling experiment.
22
0
1000
2000
3000
4000
5000
6000
7000
8000
4 8 12 16 20 24
minutes
W/m2
calculated @ z = 0
calculated @ z = 5
calculated @ z = 10
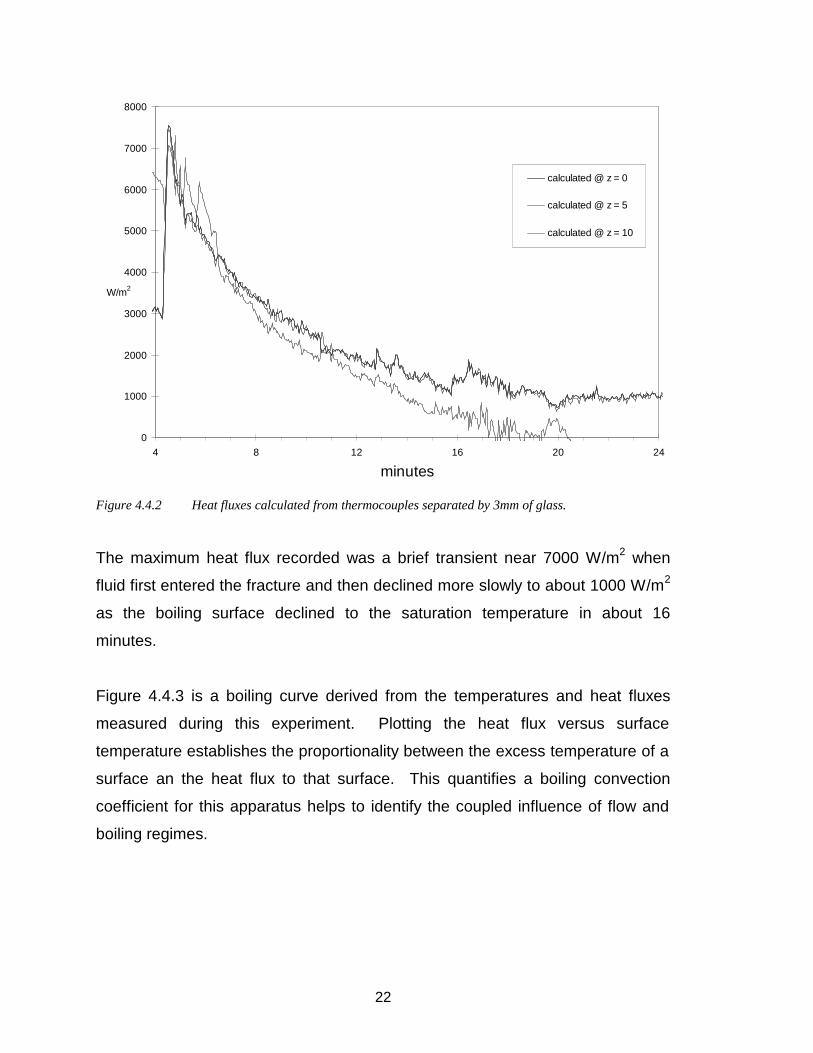
Figure 4.4.2 Heat fluxes calculated from thermocouples separated by 3mm of glass.
The maximum heat flux recorded was a brief transient near 7000 W/m2 when
fluid first entered the fracture and then declined more slowly to about 1000 W/m2
as the boiling surface declined to the saturation temperature in about 16
minutes.
Figure 4.4.3 is a boiling curve derived from the temperatures and heat fluxes
measured during this experiment. Plotting the heat flux versus surface
temperature establishes the proportionality between the excess temperature of a
surface an the heat flux to that surface. This quantifies a boiling convection
coefficient for this apparatus helps to identify the coupled influence of flow and
boiling regimes.
23
0
1000
2000
3000
4000
5000
6000
7000
8000
0 5 10 15 20 25
Te = T - Tsat, oC
W/m2
calculated @ z=0
calculated @ z=5
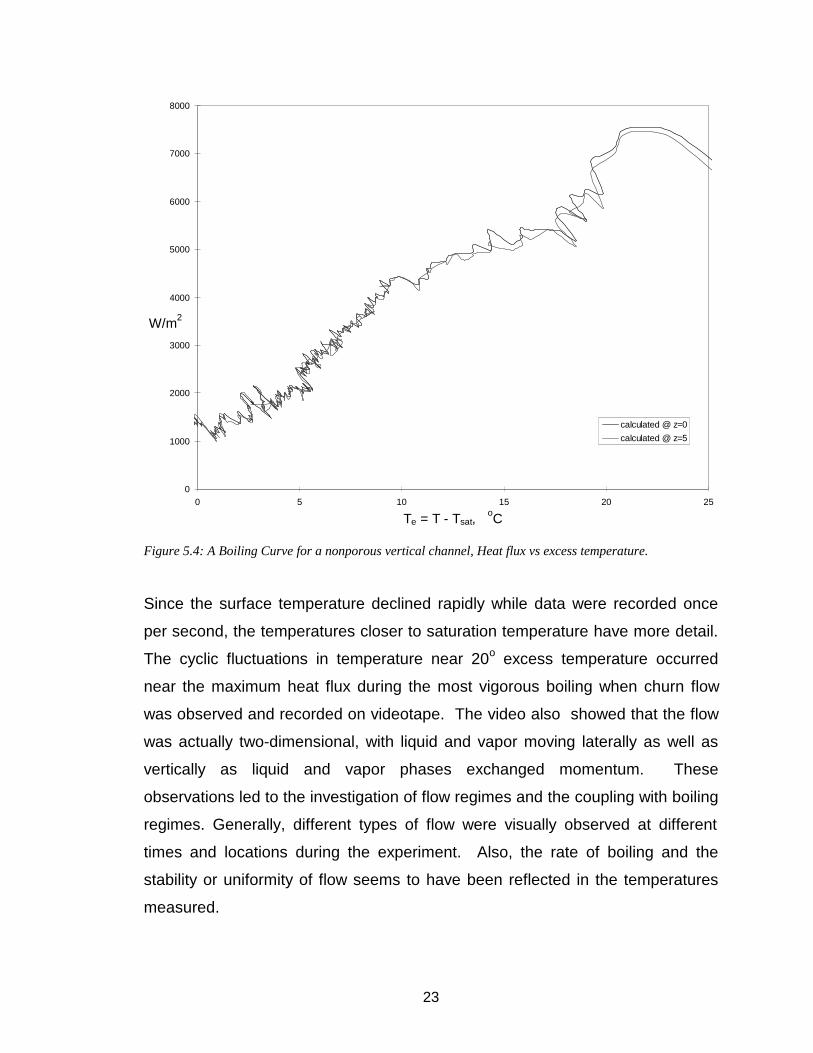
Figure 5.4: A Boiling Curve for a nonporous vertical channel, Heat flux vs excess temperature.
Since the surface temperature declined rapidly while data were recorded once
per second, the temperatures closer to saturation temperature have more detail.
The cyclic fluctuations in temperature near 20o excess temperature occurred
near the maximum heat flux during the most vigorous boiling when churn flow
was observed and recorded on videotape. The video also showed that the flow
was actually two-dimensional, with liquid and vapor moving laterally as well as
vertically as liquid and vapor phases exchanged momentum. These
observations led to the investigation of flow regimes and the coupling with boiling
regimes. Generally, different types of flow were visually observed at different
times and locations during the experiment. Also, the rate of boiling and the
stability or uniformity of flow seems to have been reflected in the temperatures
measured.
24
4.5 Discussion Comparing the single-phase experiment with the boiling data shows the heat flux
associated with boiling, with a similar absolute temperature difference, is more
than three times greater than the heat flux to a single-phase flow. The difference
in the magnitude of the heat flux at two different locations could be related to
nucleation at those locations, but the difference is more likely due to inconsistent
calibration of thermocouple outputs. The plots of Figures 4.4.1 and 4.4.2
compared to Figures 4.3.1 and 4.3.2 also illustrate that temperatures and heat
fluxes decline faster with boiling because heat is more rapidly depleted from the
core. This means that steeper temperature gradients develop near the fracture
surface, thus, greater quantities of energy are ultimately transferred to the fluid.
Although not unexpected, this result is positive for accessing more of the energy
contained in geothermal reservoir rocks.
Closer observation of the temperatures in Figure 4.4.1 allows the delineation of
time intervals where temperatures are influenced by flow or boiling regimes. For
example, the temperature data can be divided into three intervals, the initial
steep decline that lasts about 30 seconds, the moderately steep decline over the
next 2 minutes, and the more gradual decline down to saturation temperature
over the following 10 minutes. The boiling curve plotted also seems to show
three distinguishable intervals that could reflect the coupled boiling and flow
effects observed and recorded on videotape.
The cyclic fluctuations in temperature near 20o excess temperature occurred
near the maximum heat flux during the most vigorous boiling when churn flow
was observed in the fracture. Although the sampling frequency of the data did
not allow the resolution of detail in the data, churn flow did cause vapor to push
liquid upward in an unstable fashion where gravity caused the liquid to fall back.
This also showed the flow was actually two-dimensional, with liquid and vapor
moving laterally as well as vertically as phases exchanged momentum. These
observations led to investigating the roles of inertial, viscous, buoyancy, and
25
interfacial forces that influence two-phase flow and boiling in a fracture, and that
relative permeability may not be sufficient to describe flow in fractures with large
apertures. While pressures were not measured, the exchange of momentum
and the potential for segregated flow between phases was apparent. A
quantification of these forces and how they affect velocities and pressure drops
may be necessary for developing a physical flow model for discrete fractures.
The multiphase extension of Darcy’s Law appears only to couple the flow
velocities of distinct phases by the capillary pressure between the phases. In
fractures, however, capillary forces can be small relative to viscous and
buoyancy forces, and phases exchange momentum through the viscous
boundary layer between flowing phases. It therefore seems that the phase
velocities should be influenced by the exchange of momentum proportionate to
the ratio of the surface area to volume of the nonwetting phase, and
proportionate to the viscosity of the wetting phase.
These and other questions, especially the validity of measuring a boiling
convection coefficient with nonporous surfaces, led to the development of the
second experimental apparatus. This apparatus was designed to investigate
these competing with steady boiling on the surfaces of real geothermal rock.
Data and analysis from this steady state boiling experiment follow in the next
section.
26
5 STEADY STATE BOILING IN A POROUS ROCK FRACTURE
5.1 Boiling on a Porous Rock Surface Initially, since geothermal rocks often have very low porosities and very small
intrinsic permeabilities, nonporous glass surfaces were used to create an
artificial fracture. However, over the course of many experiments with glass it
became apparent that nucleate boiling and fluid flow across rock surfaces could
be considerably different from boiling flow on strictly nonporous surfaces. Also, a
method for investigating the interaction of forces with boiling flow in a fracture
needed to be researched, therefore, a new apparatus was designed and built.
This experiment was designed to quantify the heat flux associated with liquid
water flashing to steam in a fracture, similar to the vaporization of injectate in a
fractured steam reservoir.
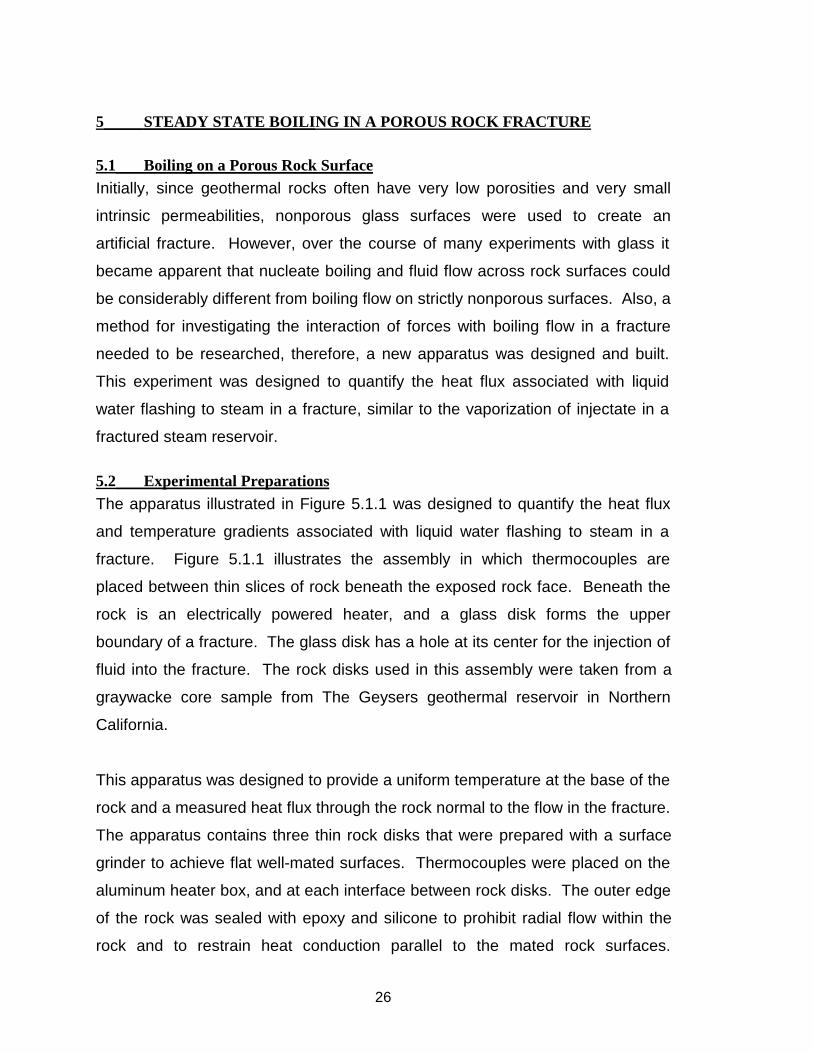
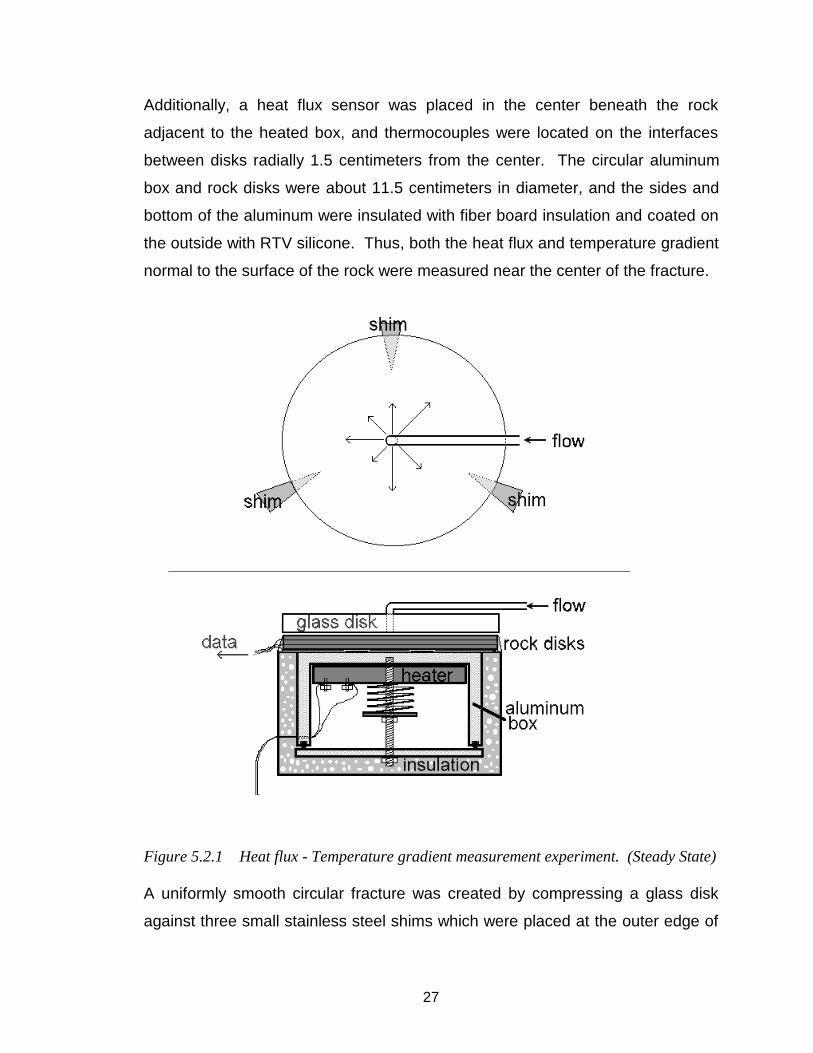
5.2 Experimental Preparations The apparatus illustrated in Figure 5.1.1 was designed to quantify the heat flux
and temperature gradients associated with liquid water flashing to steam in a
fracture. Figure 5.1.1 illustrates the assembly in which thermocouples are
placed between thin slices of rock beneath the exposed rock face. Beneath the
rock is an electrically powered heater, and a glass disk forms the upper
boundary of a fracture. The glass disk has a hole at its center for the injection of
fluid into the fracture. The rock disks used in this assembly were taken from a
graywacke core sample from The Geysers geothermal reservoir in Northern
California.
This apparatus was designed to provide a uniform temperature at the base of the
rock and a measured heat flux through the rock normal to the flow in the fracture.
The apparatus contains three thin rock disks that were prepared with a surface
grinder to achieve flat well-mated surfaces. Thermocouples were placed on the
aluminum heater box, and at each interface between rock disks. The outer edge
of the rock was sealed with epoxy and silicone to prohibit radial flow within the
rock and to restrain heat conduction parallel to the mated rock surfaces.
27
Additionally, a heat flux sensor was placed in the center beneath the rock
adjacent to the heated box, and thermocouples were located on the interfaces
between disks radially 1.5 centimeters from the center. The circular aluminum
box and rock disks were about 11.5 centimeters in diameter, and the sides and
bottom of the aluminum were insulated with fiber board insulation and coated on
the outside with RTV silicone. Thus, both the heat flux and temperature gradient
normal to the surface of the rock were measured near the center of the fracture.
Figure 5.2.1 Heat flux - Temperature gradient measurement experiment. (Steady State)
A uniformly smooth circular fracture was created by compressing a glass disk
against three small stainless steel shims which were placed at the outer edge of
28
the rock. Glass was used to allow observation of the vapor fraction and flow
characteristics. Stainless steel shims were used to create an aperture of precise
dimension, and the glass disc contained a hole at its center for saturated liquid
water to by pumped into the fracture and flow radially outward.
In order to obtain sufficient thermal contact with the rock, a heat sink compound
was used between the rock and the aluminum heater box. The rock surface
closest to the heater was coated on the heater side with a thin film of high
temperature epoxy to prevent the spontaneous imbibition of oil from the heat
sink compound from entering the rock. The other surfaces were not treated
except that shallow grooves were cut in the rock surfaces for the placement of
thermocouples. The top surface of the heater box was engraved to provide for
placement of the thermocouples and a heat flux sensor was placed on that
surface at the base of the rock. Upon each of the surfaces where temperatures
were recorded, three thermocouples were placed 1.5 cm radially out from the
center, separated from one another by an angle of 120 degrees. Since the
geometry is axisymmetric, two of each set of thermocouples record redundant
measurements. Each of the rock disks, from the bottom to the top surface of the
rock are, respectively, 3.10 mm, 4.19 mm, and 3.58 mm thick, and a set of three
thermocouples were placed at each junction.
5.3 Experimental Procedure The apparatus was designed to be submersed, however, the following data were
collected with the outer edge of the apparatus exposed to the atmosphere. The
fracture was oriented horizontally and a small positive displacement pump was
used to pump water though a copper coil immersed in boiling water to provide
fluid at saturated temperature. The pump was adjusted to supply discrete rates
of 15, 30, and 60 ml/min, and the fracture aperture was fixed at either 0.102 mm
or 0.889 mm. The average flow velocity was thus varied more than an order of
magnitude, and the velocity was further increased as liquid flashed to vapor in
the fracture. The average velocity was therefore proportional to both the
29
volumetric rate and the vapor fraction multiplied by the ratio of the liquid/vapor
densities.
Two types of experiments were conducted. The first was a single-phase
experiment that investigated the thermal conductivity of the rock by comparing
the heat flux measured with ice water injected into the fracture to the steady
state temperature gradient. Assuming one-dimensional heat conduction,
Fourier’s law q” = K ∆T/L describes the relationship between the heat flux and
the temperature gradient, where the proportionality factor K is the thermal
conductivity of the rock. Three temperatures were recorded at ten minute
intervals from each thermocouple location while a small amount of power was
applied to the heater and ice water was pumped at 30 ml/min with a fracture
aperture of 0.102 mm. Ice was also placed on top of the glass disk while
temperatures and the heat flux were recorded under these conditions for more
than one hour.
The second experiment was a steady state boiling experiment with a much
higher maximum temperature and saturated conditions with liquid and vapor flow
in the fracture. During this experiment 70 volts and 2 amps were supplied to the
heater and were maintained at those levels for the duration of the experiment.
Again, temperatures were recorded every ten minutes for many hours while the
flow rate and fracture aperture were adjusted and the times of steady state
conditions were noted. Unfortunately the heat flux sensor failed during this
experiment because the signal from the sensor reached a maximum and would
not provide information on heat fluxes above 12022 W/m2. Therefore, the rock
conductivity measured with the single phase experiment was used with the
temperature gradient to calculate the heat flux in this experiment.
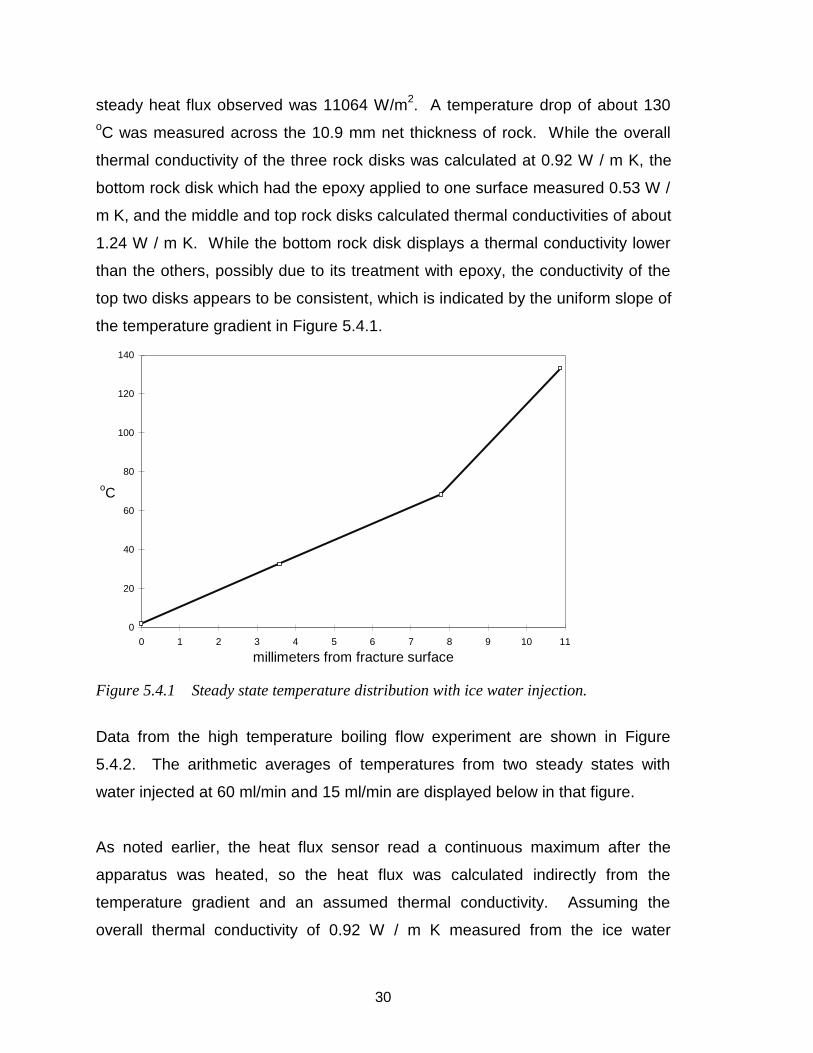
5.4 Experimental Data and Observations The arithmetic average temperatures from the data recorded after a steady state
had been established are displayed in the plot of Figure 5.4.1, while the average
30
steady heat flux observed was 11064 W/m2. A temperature drop of about 130oC was measured across the 10.9 mm net thickness of rock. While the overall
thermal conductivity of the three rock disks was calculated at 0.92 W / m K, the
bottom rock disk which had the epoxy applied to one surface measured 0.53 W /
m K, and the middle and top rock disks calculated thermal conductivities of about
1.24 W / m K. While the bottom rock disk displays a thermal conductivity lower
than the others, possibly due to its treatment with epoxy, the conductivity of the
top two disks appears to be consistent, which is indicated by the uniform slope of
the temperature gradient in Figure 5.4.1.
0
20
40
60
80
100
120
140
0 1 2 3 4 5 6 7 8 9 10 11
millimeters from fracture surface
oC
Figure 5.4.1 Steady state temperature distribution with ice water injection.
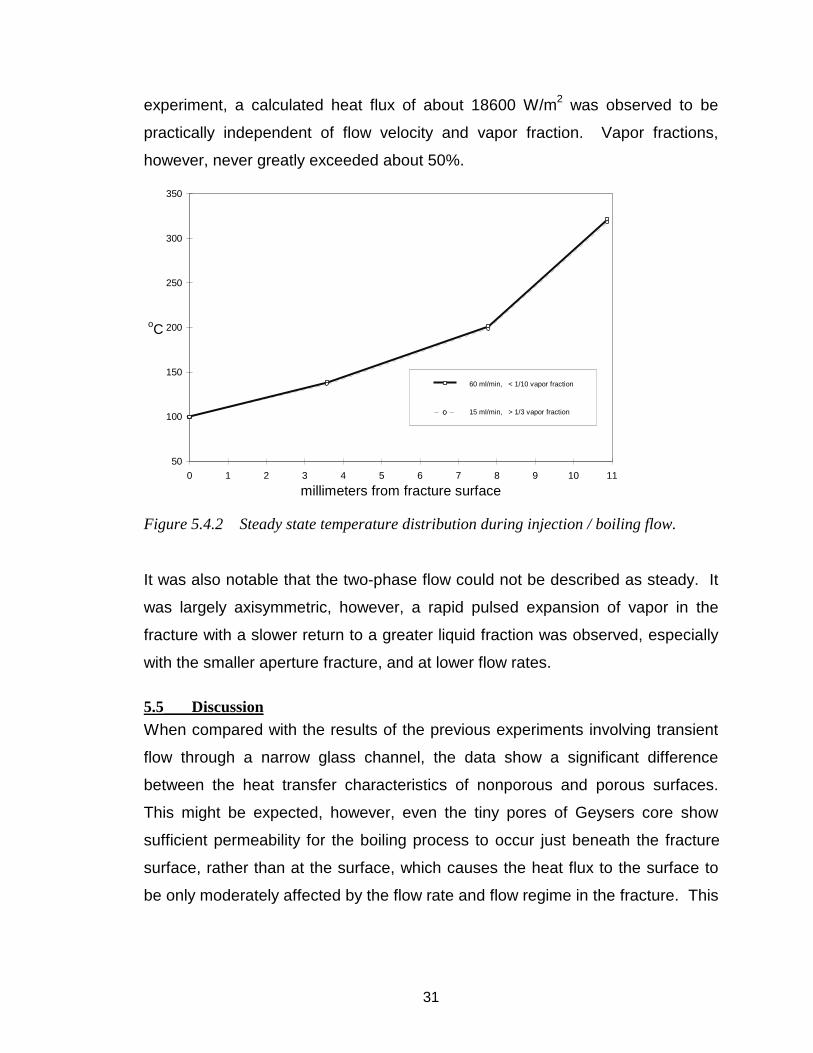
Data from the high temperature boiling flow experiment are shown in Figure
5.4.2. The arithmetic averages of temperatures from two steady states with
water injected at 60 ml/min and 15 ml/min are displayed below in that figure.
As noted earlier, the heat flux sensor read a continuous maximum after the
apparatus was heated, so the heat flux was calculated indirectly from the
temperature gradient and an assumed thermal conductivity. Assuming the
overall thermal conductivity of 0.92 W / m K measured from the ice water
31
experiment, a calculated heat flux of about 18600 W/m2 was observed to be
practically independent of flow velocity and vapor fraction. Vapor fractions,
however, never greatly exceeded about 50%.
50
100
150
200
250
300
350
0 1 2 3 4 5 6 7 8 9 10 11
millimeters from fracture surface
oC
60 ml/min, < 1/10 vapor fraction
15 ml/min, > 1/3 vapor fraction
Figure 5.4.2 Steady state temperature distribution during injection / boiling flow.
It was also notable that the two-phase flow could not be described as steady. It
was largely axisymmetric, however, a rapid pulsed expansion of vapor in the
fracture with a slower return to a greater liquid fraction was observed, especially
with the smaller aperture fracture, and at lower flow rates.
5.5 Discussion When compared with the results of the previous experiments involving transient
flow through a narrow glass channel, the data show a significant difference
between the heat transfer characteristics of nonporous and porous surfaces.
This might be expected, however, even the tiny pores of Geysers core show
sufficient permeability for the boiling process to occur just beneath the fracture
surface, rather than at the surface, which causes the heat flux to the surface to
be only moderately affected by the flow rate and flow regime in the fracture. This
32
means that the heat advected at the surface of a fracture is not as highly coupled
to the flow regime as the boiling heat flux in channels of nonporous materials.
There are uncertainties in the measured temperatures and other derived
quantities due to some aspects of how the apparatus was constructed. For
example, since the rock disks were cut, ground flat and mated, the pore space
and permeability at the junctions of the disks was likely to be much greater than
the intrinsic porosity and permeability of the rock. Also, small channels were cut
in the rock for the placement of thermocouples, which also created regions of
permeability orders of magnitude greater than the natural rock matrix. Since
temperatures recorded at symmetric locations the same distance from the
fracture surface showed differences of as much as 16 percent, fluid might have
unintentionally circulated around the locations of some of the thermocouples and
not others.
The thermal conductivity calculated from the temperatures and heat flux in the
ice water experiment is notably lower than most measurements of conductivity in
Geysers rocks (Walters and Combs, 1991). Since the thermocouples had been
checked and calibrated, it would be expedient to check the heat flux sensor by
measuring the heat flux and temperature gradient across a well characterized
material. Also, thermal conductivity is often a moderate function of temperature,
and in a wetted porous rock, would change with the liquid-vapor fraction in the
pore space. During the boiling experiment the temperature in part of the rock
exceeded 300 oC. Dependent upon the size of the pores, this may have been
sufficient to vaporize much of the liquid in the pores at these high temperatures
(Udell 1982). During the high temperature experiment in the apparatus as it was
assembled, there may have been thermal contact resistances between the rock
disks due to the vaporization of liquid water on those surfaces.
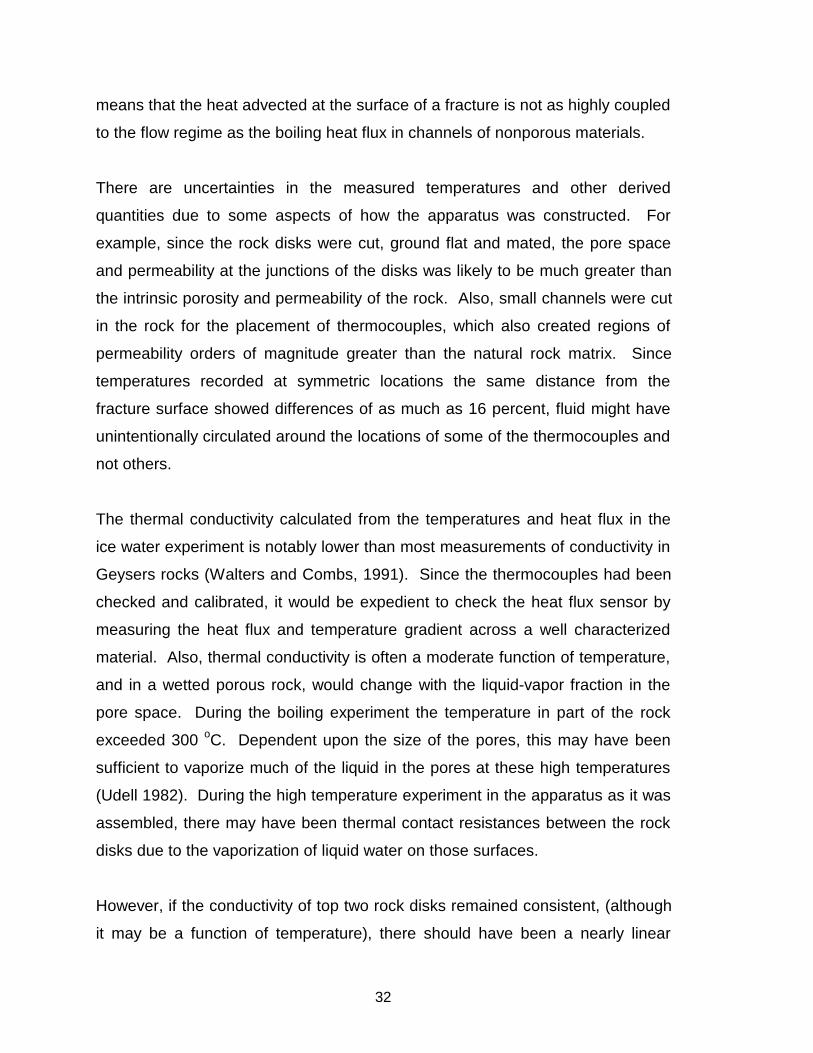
However, if the conductivity of top two rock disks remained consistent, (although
it may be a function of temperature), there should have been a nearly linear
33
temperature gradient through this section of rock to the fracture surface. Since
this is not seen in Figure 5.3.2, an extrapolation of the linear trend from the
middle rock disk to 100 oC might indicate the depth within the rock that liquid is
circulating, vaporizing, and returning to the flow in the fracture. This idea is
illustrated in Figure 5.5.1, where the arrow indicates the location where boiling
within the rock alters the temperature gradient to the fracture surface.
50
100
150
200
250
300
350
0 1 2 3 4 5 6 7 8 9 10 11
millimeters from fracture surface
oC
Figure 5.5.1 Extrapolated temperature gradient assuming uniform thermal
conductivity.
One conclusion that can be drawn from this concept is that boiling in a fracture is
not strictly a surface phenomenon even in very low porosity and low permeability
rock, but that the rock porosity and permeability play important roles in reducing
the coupling between the heat flux and the liquid/vapor ratio of the flow in the
fracture.
Another remarkable observation made during this experiment was that the
measured temperatures did not vary significantly when the fracture aperture and
pump rates were changed. With volumetric flow rates from 15 to 60 ml/min, with
apertures of either 0.102 mm or 0.889 mm, and with vapor fractions that varied
34
from less than 10 % to more than 50%, the measured temperatures never
differed by more than a few degrees Centigrade, well less than the uncertainties
associated with those measurements. This is notably unlike the highly coupled
flow and boiling in a nonporous walled fracture as seen from the transient
experiments.
35
6 CONCLUSIONS
A comparison of data from the earlier transient experimental apparatus with
recent experiments indicates that while heat transfer on nonporous surfaces is
strongly coupled to the flow regime, the heat flux to porous rock surfaces with
boiling appears to be much less sensitive to the fluid velocity. Therefore, boiling
on porous surfaces should be more easily modeled than boiling in nonporous
channels. Furthermore, these preliminary experiments show the magnitude of
the boiling heat flux to a porous surface is relatively constant, and may depend
primarily upon pore thermodynamics. If this is true the boiling convection
coefficient may be a relatively simple function of excess temperature and the
porosity, permeability, and the size distribution of pores in a particular rock.
Very little research has focused upon the nature of boiling on porous surfaces,
and therefore, much more research is needed to understand this phenomenon.
Generally, the magnitude of heat advected with boiling is much greater the
magnitude of heat advection during single-phase flow. This is positive for
establishing steep temperature gradients into unfractured rock and gaining
access to greater quantities of thermal energy. This is not positive, however, for
numerical modeling because this means that only very finely spaced grids can
accurately resolve these temperature gradients.
Multiphase flow in fractures with aperture widths on the order of one millimeter or
larger exhibit complicated flow regimes that involve the exchange of momentum
between phases. This was demonstrated and videotaped during the transient
boiling experiments. Since pressures were not measured, only a qualitative
analysis of flow regimes was made. However, observations indicate that a closer
study of the interaction of viscous, capillary, inertial and buoyancy forces could
help to develop empirical relationships to describe flow velocities and pressure
drops in fractured media.
36
7 REFERENCES
Ambusso, W. J., (1996), Experimental Determination of Steam Water RelativePermeability Relations, MS Report, Dept. Pet. Eng., Stanford University, June1996.
Bodvarsson, G., (1974), “Geothermal Resource Energetics”, Geothermics, vol. 3,no. 3, pp. 83-92, Sept., 1974
Bodvarsson, G. S., and Tsang C. F., (1982), “Injection and ThermalBreakthrough in Fractured Geothermal Reservoirs”, J. Geophysical Research,vol. 87, no. B2, pp. 1031-1048, Feb. 1982
Boitnott G. N., and Scholtz C. H., (1990), Direct Measurement of the EffectivePressure Law - Deformation of Joints Subject to Pore and Confining Pressures.Journal of Geophysical Research, 95, 19279-19298.
Carslaw, H. W., and Jaeger, J. C., (1959), Conduction of Heat in Solids, 2nd ed.Oxford, Clarendon Press, pg. 396, 1959.
Carey, V. P., Liquid-Vapor Phase Change Phenomena: An Introduction to theThermophysics of Vaporization and Condensation Processes in Heat TransferEquipment. pp. 508-524, Washington, D. C.: Hemisphere Publishing Corp.,1992.
Chen J., Miller M.A., Sepehrnoori K., (1991). Comparisons of Counter-CurrentImbibition Transfer Functions in Dual Porosity Models of Naturally FracturedReservoirs. In-Situ (1991):115-147.
Chen W.H., Wasserman M.L., Fitzmorris R.E. (1987). A Thermal Simulator forNaturally Fractures Reservoirs. SPE Paper No. 16008, presented at SPESymposium of Reservoir Simulation, San Antonio, TX, Feb. 1-4, 1987.
Corey A.T., (1954) The Interrelations Between Gas and Oil RelativePermeabilities. Producers Monthly, Vol. 19: pp 38-41.
Council J.R. and Ramey H.J., Jr. (1979) Drainage Relative PermeabilitiesObtained from Steam Water Boiling Flow and External Gas Drive Experiments.Geothermal Resources Council Trans. Vol. 3: pp 141-143.
D’Amore, F., Celati, R. and Calore C., (1983), Fluid Geochemistry Applications inReservoir Engineering (Vapor-Dominated Systems), Proceedings 8th Workshopon Geothermal Reservoir Engineering, Stanford University, Stanford, CA, Dec.14-16, 1982, 295-308.
37
DuTeaux R. (1998). Boiling in a Vertical Fracture. Proc. 23rd Workshop onGeothermal Reservoir Engineering, Stanford University, Stanford, CA, Jan 26-28, 1998 (SGP-TR-158)
Faulder D.D., Johnson S.D., Benoit W.R. (1997). Flow and PermeabilityStructure of the Beowawe, Nevada Hydrothermal System. Proc. 22nd Workshopon Geothermal Reservoir Engineering, Stanford University, Stanford, CA, Jan27-29, 1997 (SGP-TR-155), 63-71.
Firoozabadi A., Hauge J. (1990). Capillary Pressure in Fractured Porous Media.J Petrol Tech (June 1990):784-791.
Fulcher R.A. Jr., Ertekin T., Stahl C.D. The Effects of Capillary Number and itsConstituents on Two-Phase Permeability Curves. SPE Paper No. 12170.
Grant, M. A., Donaldson I.G., and Bixley P.F., Geothermal ReservoirEngineering, pp. 255-256, Academic Press Inc., 1982.
Gringarten A.C., Witherspoon P.A., Ohnishi Y. (1975). Theory of Heat Extractionfrom Fractured Hot Dry Rock. J Geophysical Res, 90(8):1120-1124.
Gunderson, R.P., (1991), Porosity of Reservoir Graywacke at the Geysers,Geothermal Resources Council, Monograph on The Geysers Geothermal Field,Special Report No. 17, pp. 89-93, 1991.
Harlow, F.H., and Pracht W.E., (1972), A Theoretical Study of GeothermalEnergy Extraction, Geophysical Research, 77, 7038, December, 1972.
Hornbrook J., Horne R.N. (1994). The Effects of Adsorption of Injection intoGeothermal Reservoirs. Proc. 19th Workshop of Geothermal ReservoirEngineering, Stanford University, Stanford, CA, Jan 18-20, 1994 (SGP-TR-147),201-207. See also Ph.D. Dissertation, Dept. Pet. Eng. Stanford University, 1994
Horne R.N. (1982). Geothermal Reinjection Experience in Japan. J. Pet. Tech.,34: 495-503
Incropera, F.P., and DeWitt, D.P., Fundamentals of Heat and Mass Transfer, 3rd
Edition. New York: John Wiley & Sons, 1990.
Kovalev, S.A., Solov’yev S.L., and Ovodkov O.A., (1987), Liquid Boiling onPorous Surfaces, Heat Transfer-Soviet Research, Vol. 19, No. 3, May-June1987.
Kuo M.C.T., Kruger P., Brigham W.E. (1975), Heat and Mass Transfer in PorousRock Fragments, Stanford University Geothermal Program Technical Report,No. 10, SGP-TR-10.
38
Kuo M.C.T., Kruger P., Brigham W.E. (1976). Shape Factor Correlations forTransient Heat Conduction from Irregular-Shaped Rock Fragments toSurrounding Field. Stanford University Geothermal Program Technical Report,No. 16, SGP-TR-16.
Kazemi H., Merrill L.S. (1979). Numerical Simulation of Water Imbibition inFractured Cores. Soc Petrol Eng J (June 1979):175-182.
Kazemi H., Gilman J.R., Elsharkawy A.M.(1992). Analytical and NumericalSolution of Oil Recovery from Fractured Reservoirs with Empirical TransferFunctions. SPE Res Eng (May 1992):219-227.
Labastie A. (1990). Capillary Continuity between Blocks of a FracturedReservoir. SPE Paper No. 20515. Presented at the 1990 SPE AnnualTechnical Conference and Exhibition, New Orleans, LA, Sept 23-26, 1990.
Lung, H., Latsch K., and Rampf H., “Boiling Heat Transfer to Subcooled Water inTurbulent Annular Flow” In Hahne, E. and Grigull, U. (eds.) Heat Transfer inBoiling, Hemisphere Publishing, 1997, pp. 220.
Ozdogan, Y., Nolen-Hoeksema R.C., and Nur A., (1994), Pore Pressure Profilesin Fractured and Compliant Rocks, Geophysical Prospecting, Vol. 42, pp. 693-714, 1994.
Pruess K. (1990). Modeling of Geothermal Reservoirs: FundamentalProcesses, Computer Simulation, and Field Applications. Geothermics, 19(1):3-15.
Reed, M., (1998), Ultra-low Permeability Core Measurements Taken for TheGeysers, Geothermal Technologies, Volume 3, Issue 1, February, 1998.
Robinson, B. A., (1982), Quartz Dissolution and Silica Deposition in Hot DryRock Geothermal Systems, Masters Thesis, Massachusetts Institute ofTechnology, Dept. Of Chem. Eng. Cambridge, MA, 1982.
Rohsenow, W. M., “ A Method of Correlating Heat Transfer Data for SurfaceBoiling Liquids, Trans,” ASME, 74, 969-975, 1952.
Tester, J. W., Murphy H. D., Grigsby C. O., Potter R. M., and Robinson B. A.,(1989), Fractured Geothermal Reservoir Growth Induced by Heat Extraction,SPE Res. Eng., pp. 97-104, Feb. 1989.
Udell K. (1982). The Thermodynamics of Evaporation and Condensation inPorous Media. SPE Paper 10779. Presented at SPE California RegionalMeeting, San Francisco, CA, March 24-26, 1982.
39
Walters, M. A., and Combs J., (1991), Heat Flow in The Geysers-Clear LakeGeothermal Area of Northern California, U.S.A., Geothermal Resources Council,Monograph on The Geysers Geothermal Field, Special Report No. 17, pp. 43-53.
Warren, J. E., and Root, P. J., (1963), The Behavior of Naturally FracturedReservoirs, Soc. Pet. Engrs. J., pp. 245-255, Sept., 1963.
Weeler, J. A., (1969), Analytical Calculations for Heat Transfer from Fractures,SPE 2494, Proceedings, SPE of AIME, Mid-Continent Section, ImprovdRecovery Symposium, pp. 217-232, April, 1969
Witherspoon P.A., Wang J.C.Y., Iwai K., and Gale J.E. (1980) Validity of theCubic Law for Fluid Flow in a Deformable Rock Fracture. Water ResourcesRes., 16, 6, 1016-1024.
Yamagata, K., Kirano F., Nishiwaka K., and Matsuoka H., (1955), NucleateBoiling of Water on the Horizontal Heating Surface, Mem. Fac. Eng. Kyushu, 15,98, 1955.