EXPERIMENTAL DETERMINATION OF KEY PARAMETERS FOR MODELLING THE TENSILE AND COMPRESSIVE FATIGUE...
43
EXPERIMENTAL DETERMINATION OF KEY PARAMETERS FOR MODELLING THE TENSILE AND COMPRESSIVE FATIGUE BEHAVIOUR OF NOTCHED GRP LAMINATES Bill Broughton , Mike Gower, Maria Lodeiro, Gordon Pilkington and Richard M. Shaw 5th International Conference on Composites Testing and Model Simulation, EPFL, Lausanne, 2011
-
date post
21-Dec-2015 -
Category
Documents
-
view
229 -
download
3
Transcript of EXPERIMENTAL DETERMINATION OF KEY PARAMETERS FOR MODELLING THE TENSILE AND COMPRESSIVE FATIGUE...

EXPERIMENTAL DETERMINATION OF KEY PARAMETERS FOR MODELLING THE TENSILE AND COMPRESSIVE
FATIGUE BEHAVIOUR OF NOTCHED GRP LAMINATES
Bill Broughton, Mike Gower, Maria Lodeiro,
Gordon Pilkington and Richard M. Shaw
5th International Conference on Composites Testing and Model Simulation, EPFL, Lausanne, 2011

ContentContent
Introduction
Test Programme
Constant Amplitude Cyclic Fatigue
Tension-Tension
Compression-Compression
Tension-Compression
Multiple Step T-T Block Loading
Concluding Remarks

IntroductionIntroduction
Aims and Rationale: Ensuring the long-term structural integrity and safety of composite structures throughout in-service lifetime
Develop and validate fatigue test methods for composites
Identify and evaluate key parameters for modelling tensile and compressive fatigue behaviour of FRPs

Test ProgrammeTest Programme
E-glass/913 (Hexcel Composites)
Quasi-isotropic (QI) lay-up [45°/0°/-45°/90°]4S
Open-hole tension (OHT)
Open-hole compression (OHC)
Quasi-static loading
Constant amplitude cyclic loading (f = 5 Hz)
Tension-tension (OHT): R = 0.1 and 0.5
Compression-compression (OHC): R = 10
Tension-compression (OHC): R = -1
Stress: 80, 70, 55, 40 and 25% UTS/UCS
Strain measurement
DIC, FBGs, strain gauges, extensometry

Open-Hole (Notched) TensionOpen-Hole (Notched) TensionTension-Tension FatigueTension-Tension Fatigue
Unnotched
Exx (GPa): 21.9 ± 0.4, xx: 0.31 ± 0.01
Strength (MPa): 484 ± 18
Open-Hole Tension (OHT)
Exx (GPa): 20.6 ± 0.3
Strength (MPa): 347 ± 5
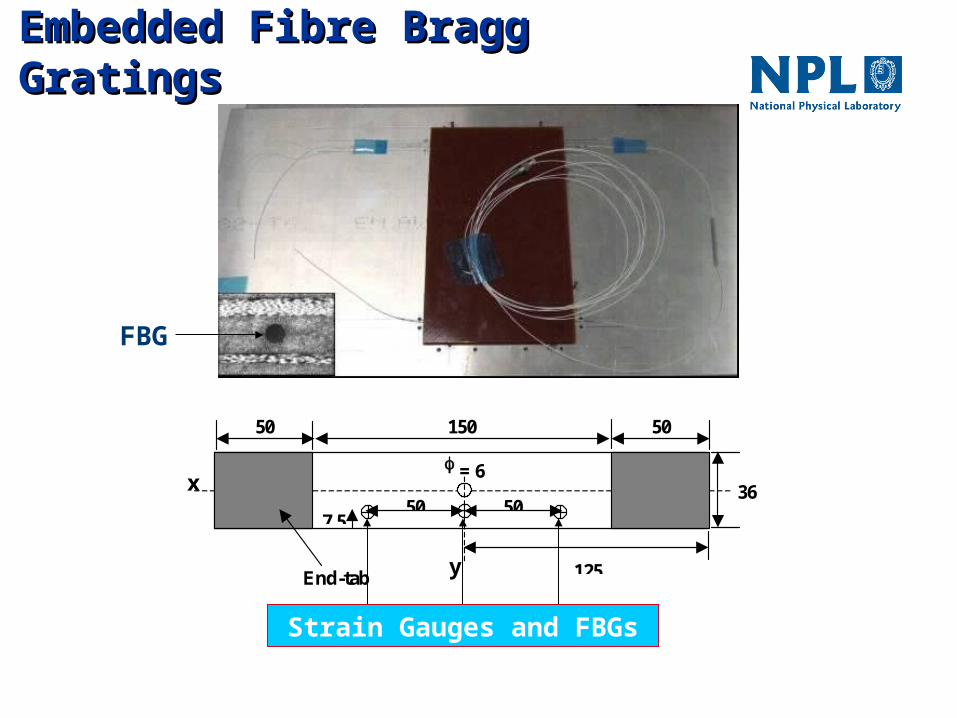
Embedded Fibre Bragg GratingsEmbedded Fibre Bragg Gratings
18 36
End-tab 125
= 6
150 50 50
50 50 7.5
x
y
Strain Gauges and FBGs
FBG

Multiple-Plexed FBGsMultiple-Plexed FBGs
215 mm buffer free region centred on middle grating
12 mm grating length 38 mm end-to-end spacing
50 mm centre-to-centre spacing
3 gratings at different centre wavelengths ~1540, 1550 and 1560nm
Length – 660 mm
Core – glass, 9 m diameter
Coating - 125 m diameter (acrylate re-coated)
Cladding – glass, 125 m diameter
This work is part of a small task in a project we are doing, the aim being to monitor strain during fatigue of an open hole tension (OHT) sample made from a QI 913 glass epoxy composite. Comparisons to be made between extensometers, strain gauges & embedded FBGs at 3 strain levels. Due to the non-uniform strain distribution we ideally want to look at the strain at 3 different points on the sample.
We would need a total of 6 fibres. Depending on the success of the FBG work, the outcome of the project will be written up as either an NPL measurement note or as a section of a larger report detailing all the outcomes of the project tasks plus a possible journal/conference paper. Although you are not permitted to sell the fibres, any work published would acknowledge City University’s help with the provision of the fibres.
50mm
50mm
Centre positions of FBG’s

Quasi-Static Strain MeasurementsQuasi-Static Strain Measurements
0 5000 10000 15000 200000
50
100
150
200
250
Strain Gauge Extensometer Fibre Bragg Grating Digital Image Correlation
Ap
plie
d S
tres
s (M
Pa)
Strain ()

Quasi-Static LoadingQuasi-Static LoadingDIC DIC xxxx Strain Strain MapsMaps
LaVision® DIC System
Single megapixel (1280 x 1024 pixel) video camera
Image recording frequency: 1 Hz
LaVision® Strainmaster software
Data capture/analysis
40.3 kN 42.5 kN

Quasi-Static LoadingQuasi-Static Loadingxxxx Strain Strain Across Specimen Mid-lengthAcross Specimen Mid-length
-0.5
0
0.5
1
1.5
2
2.5
3
0 3 6 9 12 15 18 21 24 27 30 33 36
Distance across specimen width (mm)
xx
(%)
0 kN
5.40 kN
11.80 kN
17.67 kN
20.17 kN
26.28 kN
32.03 kN
35.70 kN
Increasing Load

T-T Cyclic FatigueT-T Cyclic Fatigue
Fatigue Damage (55% UTS)Fatigue Damage (55% UTS)
5,000
20,000
30,000
Nf = 27,979 ± 9,142 cycles
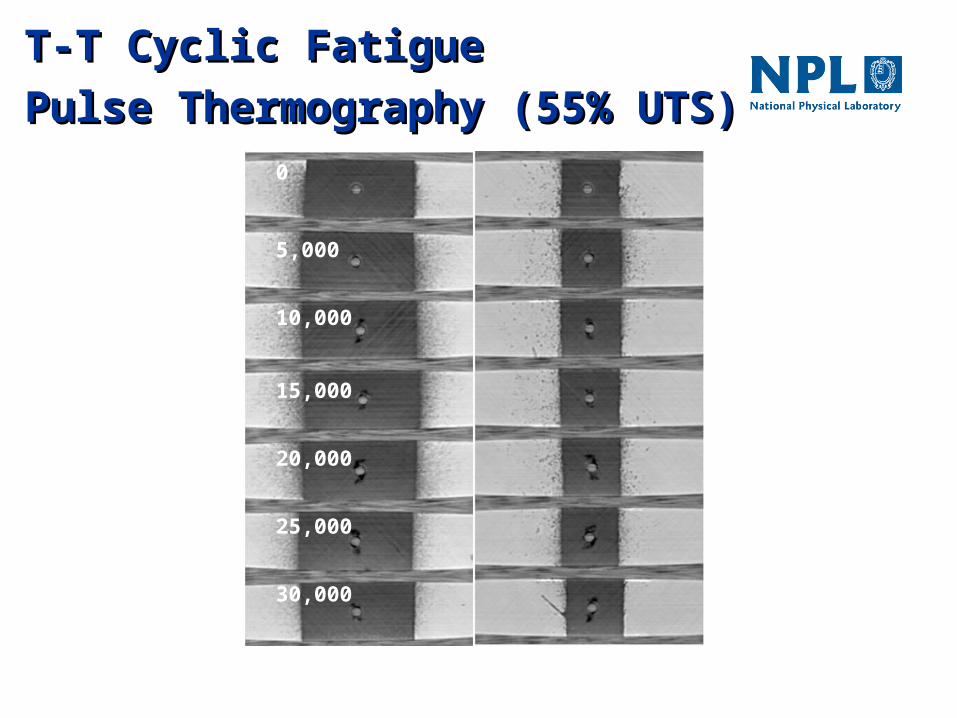
0
5,000
10,000
15,000
20,000
25,000
30,000
T-T Cyclic FatigueT-T Cyclic Fatigue
Pulse Thermography (55% UTS)Pulse Thermography (55% UTS)

T-T Cyclic FatigueT-T Cyclic FatigueNormalised Stress-Cycle (S-N) CurvesNormalised Stress-Cycle (S-N) Curves
100 101 102 103 104 105 106 1070.0
0.2
0.4
0.6
0.8
1.0
MAX
/UTS
= 1 - 0.09 logNf
MAX
/UTS
= 1 - 0.10 logNf
No
rmal
ised
Str
ess
(M
AX/ U
TS)
Number of Cycles to Failure (Nf)
R = 0.1 R = 0.5
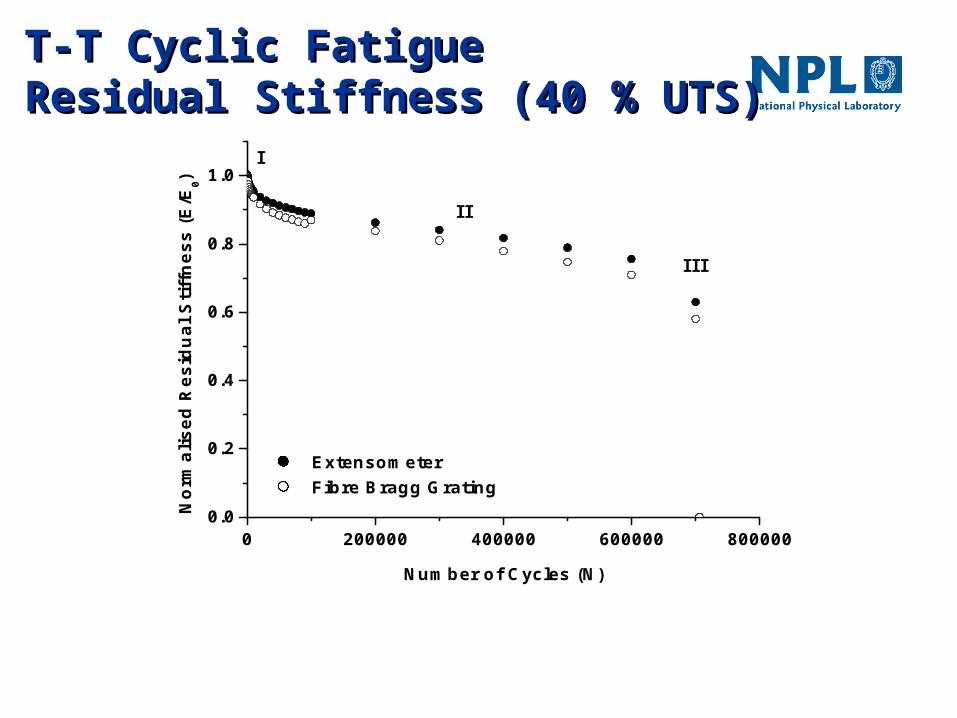
T-T Cyclic FatigueT-T Cyclic FatigueResidual Stiffness (40 % UTS)Residual Stiffness (40 % UTS)
0 200000 400000 600000 8000000.0
0.2
0.4
0.6
0.8
1.0I
II
III
No
rmal
ised
Res
idu
al S
tiff
nes
s (E
/E0)
Number of Cycles (N)
Extensometer Fibre Bragg Grating

0 1x10⁵ 2x10⁵ 3x10⁵ 4x10⁵ 5x10⁵ 6x10⁵ 7x10⁵ 8x1050.0
0.2
0.4
0.6
0.8
1.0
Nor
mal
ised
Sti
ffne
ss (
E/E
0)
Number of Cycles (N)
0 200 400 600 800 10000.0
0.2
0.4
0.6
0.8
1.0
Nor
mal
ised
Sti
ffne
ss (
E/E
0)
Number of Cycles (N)
T-T Cyclic FatigueT-T Cyclic FatigueResidual StiffnessResidual Stiffness
70% UTS 40% UTS

0 5000 10000 15000 20000 25000 300000
50
100
150
200
250
300
350
Experimental Boltzmann distribution
Res
idua
l Str
engt
h (M
Pa)
Number of Cycles (N)
Monotonic decrease in stiffness is not accompanied by decrease in residual strength during fatigue life
T-T Cyclic FatigueT-T Cyclic FatigueResidual Strength (55% UTS)Residual Strength (55% UTS)
255 ± 6 MPa
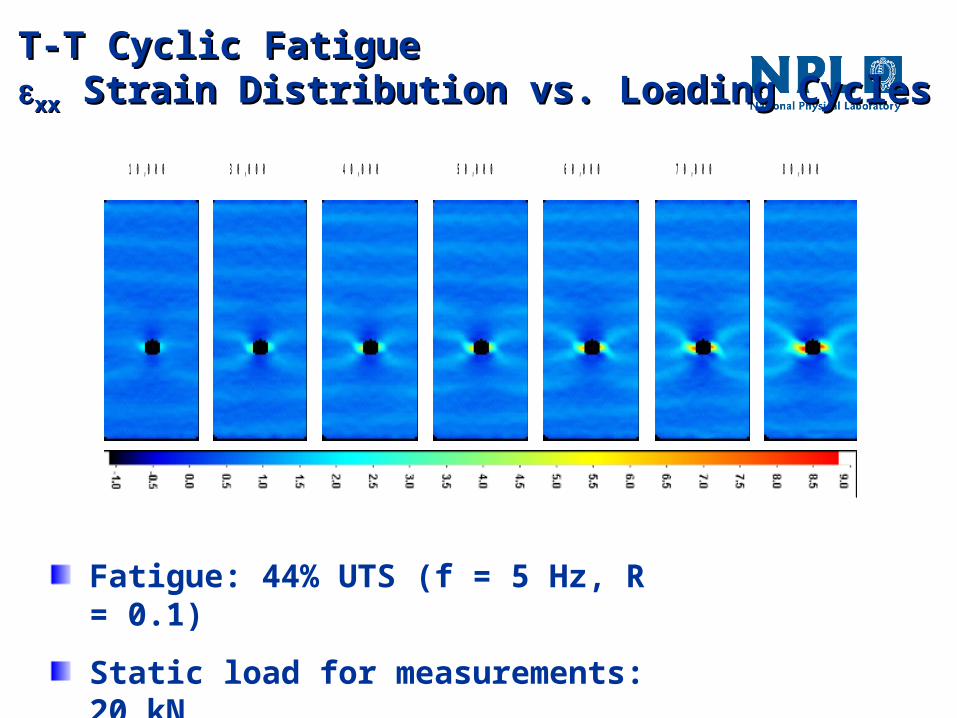
T-T Cyclic FatigueT-T Cyclic Fatiguexxxx Strain Distribution vs. Loading Cycles Strain Distribution vs. Loading Cycles
1 0 , 0 0 0 3 0 , 0 0 0 4 0 , 0 0 0 5 0 , 0 0 0 6 0 , 0 0 0 7 0 , 0 0 0 8 0 , 0 0 0
Fatigue: 44% UTS (f = 5 Hz, R = 0.1)
Static load for measurements: 20 kN

T-T Cyclic FatigueT-T Cyclic FatigueStrain Distributions vs. Loading CyclesStrain Distributions vs. Loading Cycles
1 0 , 0 0 0 3 0 , 0 0 0 4 0 , 0 0 0 5 0 , 0 0 0 6 0 , 0 0 0 7 0 , 0 0 0 8 0 , 0 0 0
yy
xy

T-T Cyclic FatigueT-T Cyclic Fatiguexxxx Strain Strain Across Specimen Mid-lengthAcross Specimen Mid-length
-10123456789
10
0 6 12 18 24 30 36
Distance across specimen width (mm)
xx (
%)
10,000 cycles30,000 cycles40,000 cycles50,000 cycles60,000 cycles70,000 cycles80,000 cycles
Increasing Cycles
Fatigue: 44% UTS (f = 5 Hz, R = 0.1)
Static load for measurements: 20 kN

T-T Cyclic FatigueT-T Cyclic FatigueMaximum Maximum xxxx Strain at Hole Perimeter Strain at Hole Perimeter
0.0 2.0x10⁴ 4.0x10⁴ 6.0x10⁴ 8.0x1040
1
2
3
4
5
6
7
8
xx
= 0.97 + 8.35 x 10⁻⁵N
Max
imu
m S
trai
n xx
(%
)
Number of Cycles (N)
Experimental Linear fit

T-T Cyclic FatigueGlobal xx Strain Values
0
mean
0
maximean
imax
fmax EE
2
R1maxmean
Stress
(% UTS)
Stress (MPa) Initial Strain (%) Final Strain (%)Nf
(cycles)mean max mean max mean max
R = 0.1
40
55
70
76.2
104.8
133.4
138.6
190.6
242.5
0.363
0.534
0.698
0.658
0.949
1.375
0.663
0.835
1.081
1.100
1.421
2.117
822804
26976
706
R = 0.5
40
55
70
103.8
142.7
181.7
138.6
190.6
242.5
0.412
0.570
0.763
0.554
0.765
1.017
0.753
1.063
1.331
1.004
1.373
1.775
599389862093
2262

OHT QI Laminate (T-T Cyclic Fatigue)Maximum Failure Strain f
max
100 101 102 103 104 105 106 1070.0
0.5
1.0
1.5
2.0
2.5
3.0
3.5
Experimental Linear fitM
axim
um F
ailu
re S
trai
n (f m
ax (
%))
Number of Cycles to Failure (Nf)
f10fo
f
maxfmax Nlogk
E
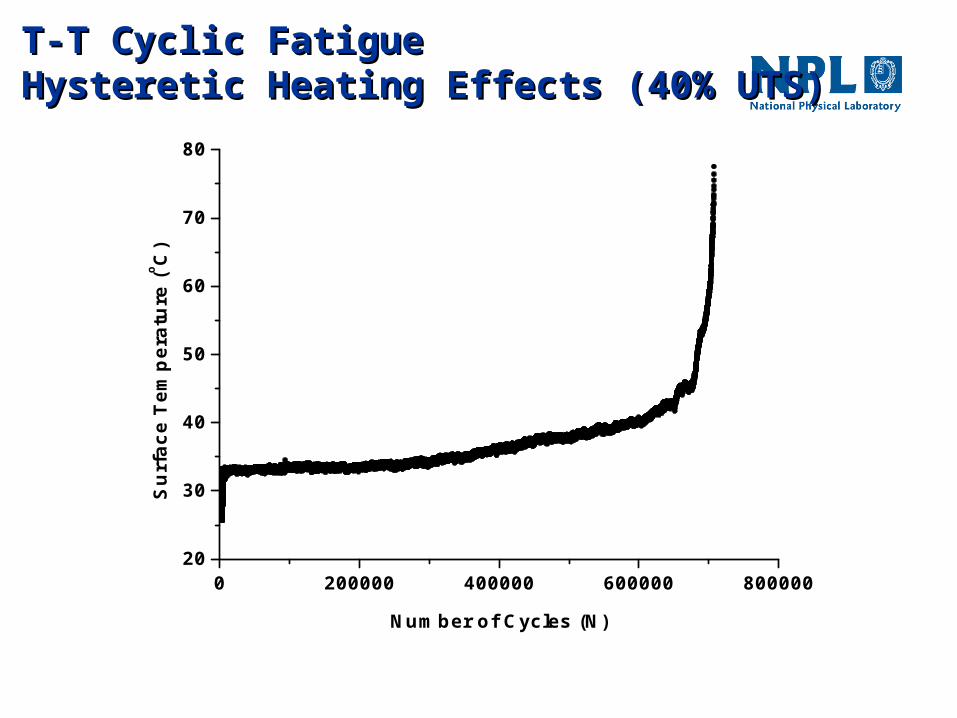
T-T Cyclic FatigueT-T Cyclic FatigueHysteretic Heating Effects (40% UTS)Hysteretic Heating Effects (40% UTS)
0 200000 400000 600000 80000020
30
40
50
60
70
80S
urf
ace
Tem
per
atu
re (
o C)
Number of Cycles (N)

T-T Cyclic FatigueT-T Cyclic FatigueMaximum Surface Temperature (ºC)Maximum Surface Temperature (ºC)
Measured at hole perimeter
Frequency is 5 Hz (unless otherwise specified)
Test Condition
(% UTS)
Initial Final Ultimate failure
R = 0.1
40
55
55 (1 Hz)
70
33
46
30
23
46
78
34
65
87
104
41
68
R = 0.5
40 25 33

T-T Cyclic Fatigue (55 %UTS)T-T Cyclic Fatigue (55 %UTS)Normalised Residual Fatigue StiffnessNormalised Residual Fatigue Stiffness
20 40 60 80 100 1200.0
0.2
0.4
0.6
0.8
1.0N
orm
alis
ed R
esid
ual S
tiff
ness
(E
/E0)
Surface Temperature (oC)
Experimental Linear fit

OHT QI Laminate (T-T Cyclic Fatigue)OHT QI Laminate (T-T Cyclic Fatigue)Normalised Residual Fatigue StiffnessNormalised Residual Fatigue Stiffness
20 40 60 80 100 1200.0
0.2
0.4
0.6
0.8
1.0
70% UTS 55% UTS 40% UTS Linear fit
Nor
mal
ised
Res
idua
l Sti
ffne
ss (
E/E
0)
Surface Temperature (oC)
AT1E
E
0

Open-Hole (Notched) CompressionOpen-Hole (Notched) Compression
Compression-CompressionCompression-Compression
Unnotched
SCxx (MPa): 617 ± 19
Open-Hole Compression (OHC)
Strength (MPa): 346 ± 54

C-C Cyclic Fatigue Damage/FailureC-C Cyclic Fatigue Damage/Failure
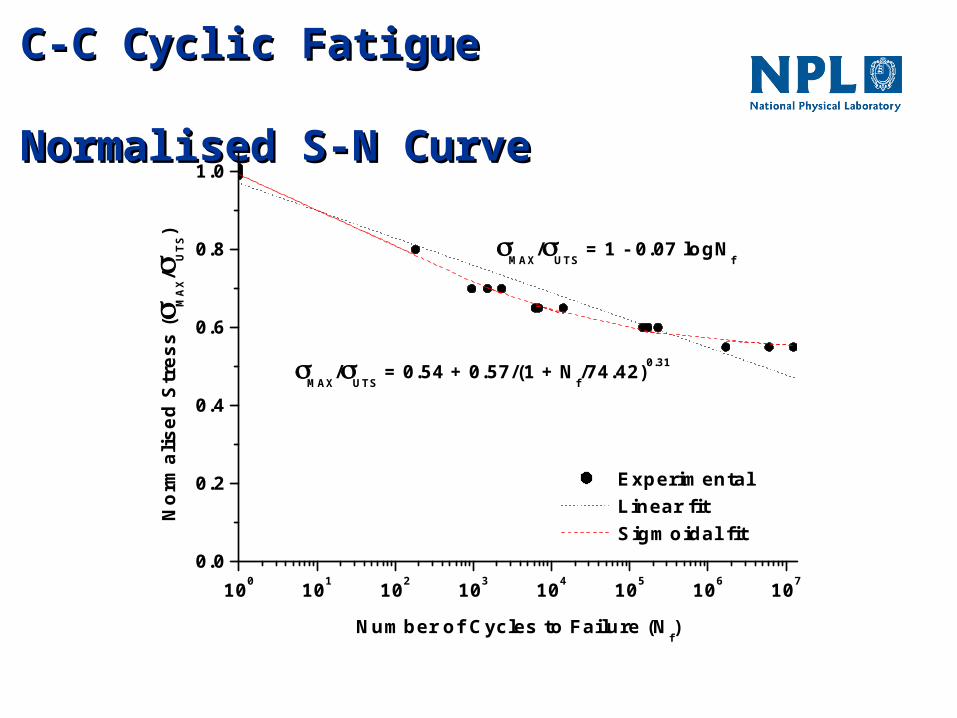
C-C Cyclic Fatigue C-C Cyclic Fatigue Normalised S-N Curve Normalised S-N Curve
100 101 102 103 104 105 106 1070.0
0.2
0.4
0.6
0.8
1.0
MAX
/UTS
= 0.54 + 0.57/(1 + Nf/74.42)0.31
MAX
/UTS
= 1 - 0.07 logNf
No
rmal
ised
Str
ess
(M
AX/
UT
S)
Number of Cycles to Failure (Nf)
Experimental Linear fit Sigmoidal fit

C-C Cyclic FatigueC-C Cyclic Fatiguexxxx Strain Strain Across Specimen Mid-lengthAcross Specimen Mid-length
-2.50
-2.00
-1.50
-1.00
-0.50
0.00
0 6 12 18 24 30 36
Distance across specimen width (mm)
xx
(%)
10,000 cycles20,000 cycles30,000 cycles40,000 cycles50,000 cycles60,000 cycles
Increasing Cycles
Fatigue: 61% UCS (f = 5 Hz, R = 10)
Static load for measurements: -25 kN

C-C Cyclic FatigueC-C Cyclic FatigueMaximum Maximum xxxx Strain at Hole Perimeter Strain at Hole Perimeter
1x10⁴ 2x10⁴ 3x10⁴ 4x10⁴ 5x10⁴ 6x1040.0
0.5
1.0
1.5
2.0
xx
= 0.97 + 1.46 x 10⁻⁵N
Experimental Linear fit
Max
imu
m C
om
pre
ssiv
e S
trai
n xx
(%
)
Number of Cycles (N)

C-C Cyclic FatigueC-C Cyclic FatigueHysteretic Heating Effects (5 Hz)Hysteretic Heating Effects (5 Hz)
* Unnotched
Applied Stress
MAX/UTS
Surface Temperature
(°C)
60% 41
65% 54
70% 59
70%* 45
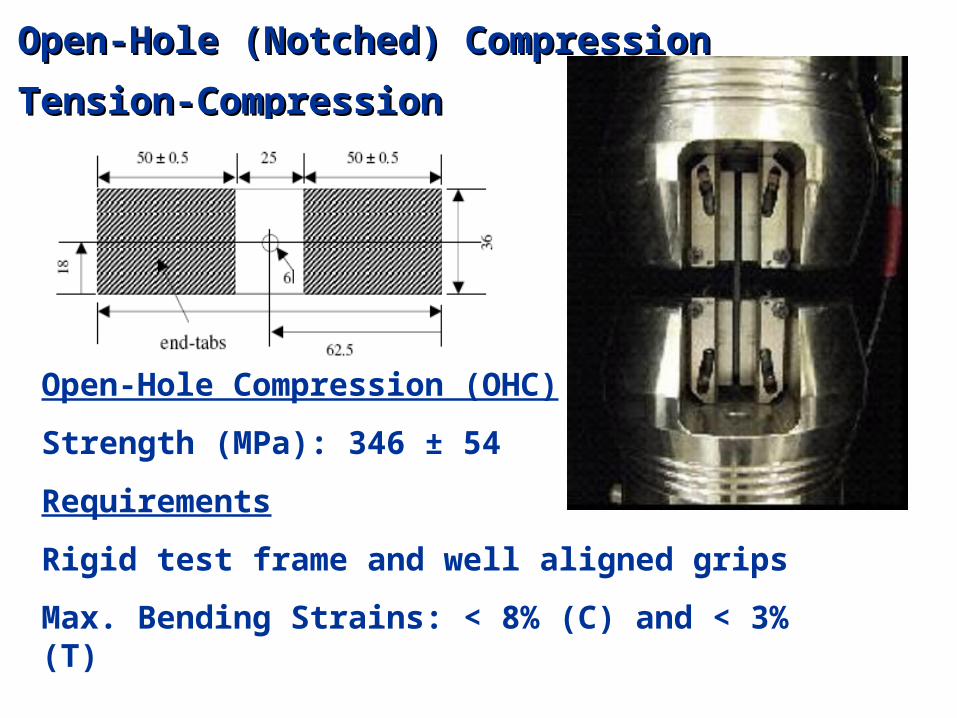
Open-Hole (Notched) CompressionOpen-Hole (Notched) Compression
Tension-CompressionTension-Compression
Open-Hole Compression (OHC)
Strength (MPa): 346 ± 54
Requirements
Rigid test frame and well aligned grips
Max. Bending Strains: < 8% (C) and < 3% (T)

T-C Cyclic FatigueT-C Cyclic FatigueNormalised S-N CurveNormalised S-N Curve
100 101 102 103 104 105 106 1070.0
0.2
0.4
0.6
0.8
1.0
run outMAX
/UTS
= 1 - 0.12 logNf
No
rmal
ised
Str
ess
(M
AX/
UT
S)
Number of Cycles to Failure (Nf)
Experimental Linear fit

T-C Cyclic FatigueT-C Cyclic Fatiguexxxx Strain Strain Across Specimen Mid-lengthAcross Specimen Mid-length
0.00
0.50
1.00
1.50
2.00
2.50
3.00
3.50
4.00
4.50
5.00
0 6 12 18 24 30 36
Distance across specimen width (mm)
xx (
%)
10,000 cycles
20,000 cycles
30,000 cycles
40,000 cycles
50,000 cycles
60,000 cyclesIncreasing Cycles
Fatigue: 61% UTS/UCS (f = 5 Hz, R = -1)
Static load for measurements: 15 kN

T-C Cyclic FatigueT-C Cyclic FatigueMaximum Maximum xxxx Strain at Hole Perimeter Strain at Hole Perimeter
1x10⁴ 2x10⁴ 3x10⁴ 4x10⁴ 5x10⁴ 6x1040
1
2
3
4
xx
= 0.41 + 5.37 x 10⁻⁵N
Experimental Linear fitM
axim
um
Ten
sile
Str
ain
xx (
%)
Number of Cycles (N)

T-C Cyclic FatigueT-C Cyclic FatigueFully Reversed Loading S-N ResponseFully Reversed Loading S-N Response
100 101 102 103 104 105 106 1070.0
0.2
0.4
0.6
0.8
1.0N
orm
alis
ed S
tres
s (
max
/U
LT)
Number of Cycles to Failure (Nf)
Experimental Predicted

Multiple-Step T-T Block LoadingMultiple-Step T-T Block Loading
QI E-glass/913 laminate
OHT: Tension-tension
Ni = 1,000 cycles
40% 25%, 55% 25%, 55% 40% UTS
50% 40% 25% UTS (repeated)
Ap
plie
d S
tres
s
T i m e

T-T Block LoadingT-T Block LoadingGlobal Global xxxx Strain Values (R = 0.1) Strain Values (R = 0.1)
Stress
(% UTS)
Stress (MPa) Initial Strain (%) Final Strain (%)Nf
(cycles)mean max mean max mean max
40-2 5
25
40
47.6
76.2
86.6
138.6
0.230
0.368
0.418
0.669
0.353
0. 581
0.642
1.065
1980585
990000
990584
55-2 5
25
40
47.6
104.8
86.6
190.6
0.244
0.538
0.444
0.978
0.515
0.940
0.684
1.548
74796
37000
37796
55-40
25
40
76.2
104.8
138.6
190.6
0.385
0.530
0.700
0.963
0.591
0.812
1.047
1.478
82569
41000
41569
55-40-25
25
40
55
47.6
76.2
104.8
86.6
138.6
190.6
0.238
0.381
0.524
0.433
0.693
0.953
0.303
0.485
0.666
0.681
0.994
1.574
51564
17000
17000
17564

T-T Cyclic FatigueT-T Cyclic FatigueGlobal Strain ValuesGlobal Strain Values
0
mean
0
maximean
imax
fmax EE
f10fo
f
maxfmax Nlogk
E
2
R1maxmean
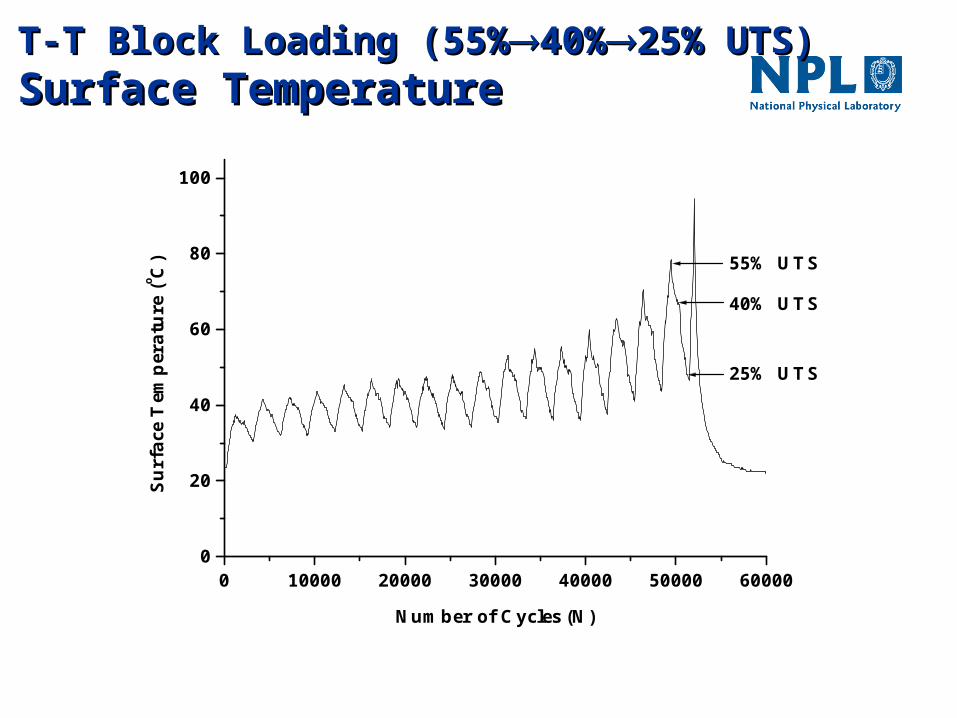
T-T Block Loading T-T Block Loading (55%(55%40%40%25% UTS)25% UTS)Surface TemperatureSurface Temperature
0 10000 20000 30000 40000 50000 600000
20
40
60
80
100
40% UTS
25% UTS
55% UTS
Surf
ace
Tem
pera
ture
(o C
)
Number of Cycles (N)

Concluding RemarksConcluding RemarksAlignment and rigidity of loading chain is critical for compression-compression and tension-
compression tests
DIC suitable for monitoring local and global strains
Providing critical information on changes in strain distribution around the hole of notched
laminates due to damage formation/growth incurred through either increasing load or number
of loading cycles
Optical fibres (FBGs) suitable for monitoring fatigue performance – superior fatigue performance
compared with strain gauges
Longitudinal strain and stiffness along with surface temperature – indication of level of remnant
life of notched components
Possible to estimate fatigue life for fully reversible and block loading conditions from T-T and C-C
cyclic data

AcknowledgementsAcknowledgements
The work was supported by United Kingdom Department for Business, Innovation and Skills (National Measurement Office), as part of the Materials 2007 Programme.
The authors would also like to thank:
Hexcel Composites Limited
Dr F Surre and Dr T Venugopalan - City University London