Experimental Design Internal Validation Experimental Design I. Definition of Experimental Design II....
11
Experimental Design Internal Validation
-
Upload
alexandra-brierly -
Category
Documents
-
view
257 -
download
1
Transcript of Experimental Design Internal Validation Experimental Design I. Definition of Experimental Design II....

Experimental Design
Internal Validation

Experimental Design
I. Definition of Experimental Design
II. Simple Experimental Design
III. Complex Experimental Design
IV. Quasi-Experimental Design
V. Threats to Validity

Experimental Design
I. Definition of Experimental Design
Control over the sequence and proportion of the independent variable involving: 1) at least two conditions (i.e. an independent variable); 2) random assignment of subjects to conditions; and 3) the measurement of some outcome (i.e. dependent variable)
Experimental Design
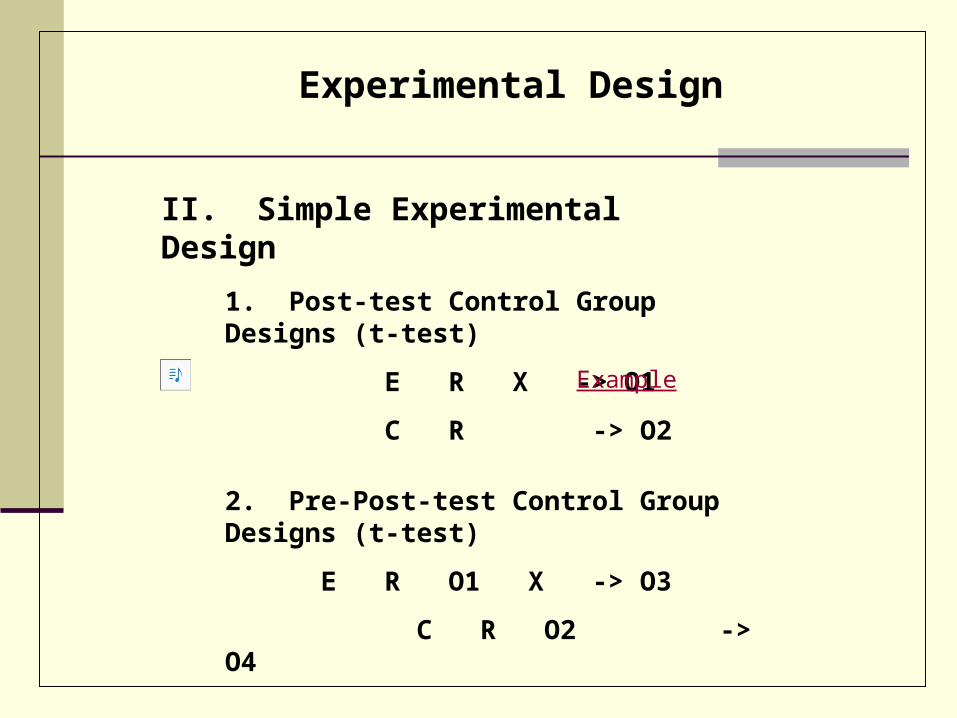
II. Simple Experimental Design
2. Pre-Post-test Control Group Designs (t-test)
E R O1 X -> O3
C R O2 -> O4
1. Post-test Control Group Designs (t-test)
E R X -> O1
C R -> O2 Example

Experimental Design
II. Simple Experimental Design
3. Soloman Four Group Design (t-test)
E1 R X1 -> O1
C1 R -> O2
E2 R O1 X1 -> O3
C2 R O2 -> O4
4. Analysis of Variance (ANOVA)
E1 R X1 -> O1
E2 R X2 -> O2
E3 R X3 -> O3
Example
Experimental Design
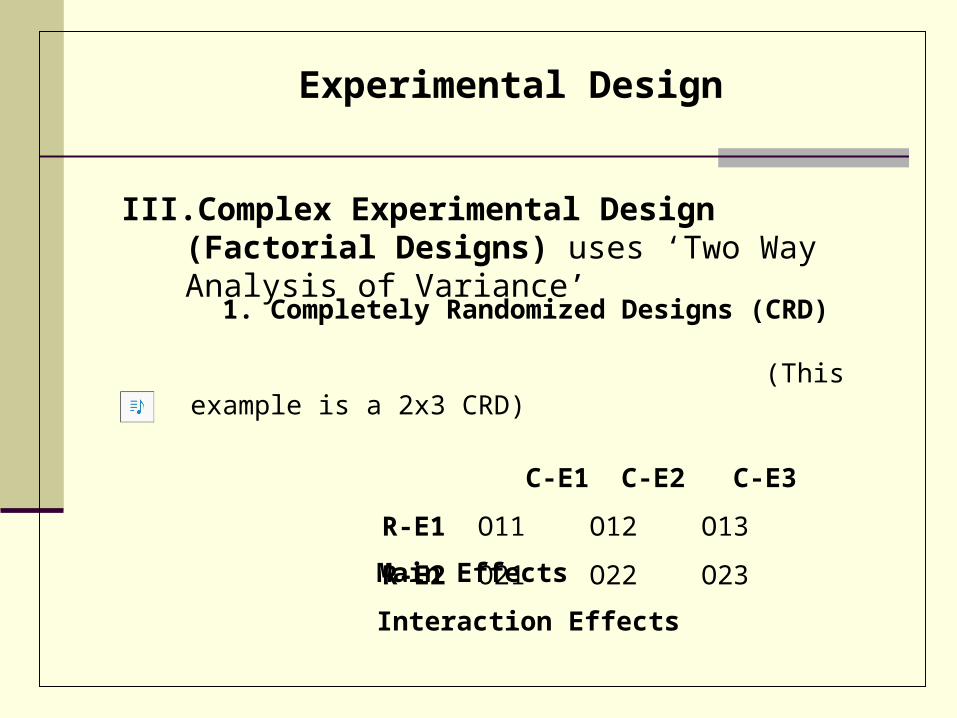
III. Complex Experimental Design (Factorial Designs) uses ‘Two Way Analysis of Variance’
Main Effects
Interaction Effects
1. Completely Randomized Designs (CRD) (This example is a 2x3 CRD)
C-E1 C-E2 C-E3
R-E1 O11 O12 O13
R-E2 O21 O22 O23

Experimental Design
III. Complex Experimental Design (cont.)2. Incomplete Designs (IRD)
Split Plot Design (This example is a 2x3 SPD)
C-E1 C-E2 C-E3
R-E1 - O12 O13
R-E2 O21 O22 -3. Repeated Measures Designs (RMD)
Latin Square Design ( This example is a 4x4 LSD)
O1 O2 O3 O4 O2 O3 O4 O1
O3 O4 O1 O2 O4 O1 O2 O3

Experimental Design
IV. Quasi-Experimental Design
1. One Shot Case Study
E O1 X ->O2
2. Non-Equivalent Control Group Design
E O1 X -> O3
C O2 -> O4 3. Interrupted Time-Series Design
E O1 O2 O3 X O4 O5 O6

Experimental Design
V. Threats to Validity
1. History = confounding of IV over time2. Maturation = age / experience contaminate
3. Testing = subjects come to understanding IV4. Regression to the Mean = extreme scores regress
5. Selection of Participants = non-random assignment
6. Mortality = subject attrition
7. Diffusion of Treatments = lack of control group
Back to the Beginning End Presentation

Two Sample t-test
Problem: Suppose you wanted to know if students who work (the experimental condition) take fewer units than students who do not (the control condition). If a sample of 25 working students yielded a mean of 12 units with an unbiased standard deviation of 3 units and 25 who do not work took an average 15 units with an unbiased standard deviation of 4 units, could you conclude that the population of students not working take significantly more units?
Step 2: Specify the distribution: (t-distribution)
Step 3: Set alpha (say .05; one tail test, N>30, therefore t= 1.65)
Step 4: Calculate the outcome:
2
22
1
21
21
ˆˆ
Ns
Ns
XXt
Step 5: Draw the conclusion: Reject Ho: 3.0 > 1.65 Working students take significantly fewer units.
Back
0.31/3
25
9
25
16
1215
Step 1 State the hypotheses: Ho: = ; H1: < 1 2 21

Multiple Sample Test (ANOVA)
Problem: Suppose your instructor divides your class into three sub-groups, each receiving a different teaching strategy (experimental condition). If the following test scores were generated, could you assume that teaching strategy affects test results?
In Class
At Home
Both C+H
115 125 135
135 145 155
140 150 160
145 155 165
165 175 185
Step 1: State hypotheses: Ho: 1 = 2 = 3; H1: Ho is false
Back
Step 2: Specify the distribution: (F-distribution)
Step 3: Set alpha (say .05; therefore F = 3.89)
Step 4: Calculate the outcome:
Source SS df MS F
Bet 1000 2 500 1.54
Within 3900 12 325
Step 5: Draw the conclusion: Retain Ho: 1.54 < 3.89 Type of instruction does not influence test scores.
Grand Mean = 150
140 150 160