
EXPERIMENTAL ASSESSMENT OF HANG UP AND SECONDARY FRAGMENTATION FOR BLOCK CAVING · 2019-01-02 ·...
63
UNIVERSIDAD DE CHILE FACULTAD DE CIENCIAS FÍSICAS Y MATEMÁTICAS DEPARTAMENTO DE INGENIERÍA DE MINAS EXPERIMENTAL ASSESSMENT OF HANG UP AND SECONDARY FRAGMENTATION FOR BLOCK CAVING TESIS PARA OPTAR AL GRADO DE MAGÍSTER EN MINERIA RENÉ ESTEBAN GÓMEZ PUIGPINOS PROFESOR GUÍA: RAÚL CASTRO RUIZ MIEMBROS DE LA COMISIÓN: ALDO CASALI BACELLI MAURICIO TELIAS HASSON ANDRÉS BRZOVIC PÉREZ SANTIAGO - CHILE 2015
Transcript of EXPERIMENTAL ASSESSMENT OF HANG UP AND SECONDARY FRAGMENTATION FOR BLOCK CAVING · 2019-01-02 ·...

UNIVERSIDAD DE CHILE
FACULTAD DE CIENCIAS FÍSICAS Y MATEMÁTICAS
DEPARTAMENTO DE INGENIERÍA DE MINAS
EXPERIMENTAL ASSESSMENT OF HANG UP AND
SECONDARY FRAGMENTATION FOR BLOCK CAVING
TESIS PARA OPTAR AL GRADO DE MAGÍSTER EN MINERIA
RENÉ ESTEBAN GÓMEZ PUIGPINOS
PROFESOR GUÍA:
RAÚL CASTRO RUIZ
MIEMBROS DE LA COMISIÓN:
ALDO CASALI BACELLI
MAURICIO TELIAS HASSON
ANDRÉS BRZOVIC PÉREZ
SANTIAGO - CHILE
2015

ii
Resumen
En minería es cada vez más recurrente el desarrollo de operaciones a mayores profundidades. En particular, en la minería subterránea masiva explotada por el método de Block/Panel caving esto genera como consecuencia grandes
alturas de columna de material quebrado, desarrollando altos esfuerzos producto de la sobrecarga. Es así que surge la presente investigación, con el
propósito de estudiar el impacto de mayores esfuerzos en la extracción y fragmentación del mineral
El estudio se centra en dos áreas de interés: la fragmentación secundaria y los eventos de colgadura. Estos tópicos son analizados a través del modelamiento
físico, para el cual es utilizado un modelo de flujo confinado ubicado en el Laboratorio de Block Caving de la Universidad de Chile. Este modelo emula la
extracción desde una batea a través de un sistema LHD. Los experimentos desarrollados consideran mineral el cual fue previamente preparado para representar dos curvas de fragmentación primaria. Dentro de las variables
estudiadas se encuentran: el tamaño de los fragmentos, la carga vertical y la humedad; para las cuales se considera la extracción desde un punto de
extracción y desde ambos puntos de la batea. Al evaluar los eventos de colgaduras, los resultados experimentales muestran
que una mayor relación entre la abertura de extracción y el tamaño medio de partícula mejora la capacidad de flujo del material, así como la extracción
desde ambos puntos de extracción también favorece la aparición de una menor cantidad de eventos, disminuyendo los eventos de colgadura en entre un 20 y 30 porciento al compararlos con la extracción desde un solo punto de la batea.
Mientras que al aumentar la carga vertical y la humedad, incrementa el número de colgaduras generadas. También se observa que la altura de las
colgaduras incrementa con la carga vertical en mineral seco. A través de los resultados obtenidos, fue posible desarrollar un gráfico para estimar la frecuencia de colgaduras el cual es validado con datos de terreno de diversas
operaciones mineras.
Por otra parte, es presentado un modelo de conminución con base experimental, el cual permite estimar la fragmentación secundaria a diferentes alturas de columna extraída. A diferencia de otros modelos de predicción de
fragmentación secundaria, este modelo considera el esfuerzo vertical asociado a la sobrecarga de material quebrado. Finalmente, el modelo propuesto es
comparado con la fragmentación generada en operaciones de block caving mostrando la capacidad del modelo planteado para modelar las curvas de fragmentación.
Los resultados obtenidos en cuanto a colgaduras y predicción de la
fragmentación secundaria, tienen aplicación en el diseño y planificación en minería de caving, a través del gráfico de estimación de colgaduras y el modelo de conminución presentados.

iii
Abstract
Future mining proceeds towards mining of low grade deposits at deeper levels.
In particular, in massive underground mining which are developed by block/panel caving method, deeper level implies higher columns of broken material. In Consequence, higher loads on production levels would be exist due
to overloading of these columns. Therefore, this research aims to study the impacts of higher loads on mine productivity and fragmentation.
The analysis focuses on two main topics: secondary fragmentation and hang up events. A confined physical model is implemented to study these topics, in
the Block Caving Laboratory of the University of Chile. This model simulates the ore extraction of Load Haul Dump (LHD) system in a drawbell. Two primary
size distribution curves of crushed ore are considered in the experiments. During the confined gravity flow experiments various parameters are considered including: fragment size, vertical load and humidity content; for
these variables two extraction strategies are implemented, extraction only by one drawpoint and extraction by both drawpoints of the drawbell.
In relation with hang ups event, the experimental results shown that a high
ratio between the apex and the mean fragment size implies a better flow-ability of the granular material. Moreover, the extraction from both drawpoint (one by one) decreases the hang up occurrence between a 20 and 30 percent
comparing with the extraction from just one drawpoint. In the other hand, the vertical load and humidity increase the number of hang ups. In experiment is
also observed that the hang up height increases due to the vertical load in dry ore material. A hang up prediction graph is developed based on results and it is validated with mine data.
On fragmentation analysis, a fragmentation model is developed which enables
to estimate the secondary fragmentation for various extraction heights based on the experimental results. One of the characteristics of this model is considering the overload of the broken column. Finally, the comminution model
is compared with the fragmentation curves from block caving operations. The comparison of the developed comminution model with mine fragmentation
curves shows the ability of this model to predict the secondary fragmentation. The hang up prediction graph and the comminution model presented in this
project could be very applicable in mine planning and design of caving operations.
iv
Acknowledgements
First of all I want to give special thanks to the Block Caving Laboratory for
providing me a great work environment and support during my thesis project. I’d like to express my sincere gratitude to professor Raúl Castro, my advisor, for his guide and insightful comments during this work. I’m also grateful for
the comments and reviews of my thesis from the professors in my thesis committee. I want to thank Asieh Hekmat for all her help and advises and
David Veloz for his aid developing the physical set-up for my experiments. I am very thankful for the people that I shared in the Laboratory: Ernesto,
Maria Elena, Carolina, Pestaña, Patricio, Diego, Sebastian, Isaac, Nicole, Francisca, Francisco, Camila, Kenji and Alvaro. Thanks for the all good
moments that we enjoyed. And finally the most important thanks to my family for the education, advices
and affection they gave me. My mom Soledad, my dad René, mi grandmother Cristina and my sister Laura.
And a special note of deep gratitude to Juanita Vergara for her tireless helps.

v
Table of Content
Introduction on work thesis ................................................................... 1
Experimental quantification of hang up for block caving applications ........... 3
Abstract .......................................................................................... 3
1. Introduction ................................................................................. 3
2. Similitude analyses ....................................................................... 5
3. Definition model condition ............................................................. 6
3.1 Physical model ......................................................................... 7
3.2 loading system ........................................................................ 8
3.3 Boundary condition .................................................................. 9
3.4 Model media .......................................................................... 10
3.5 Experimental program ............................................................ 11
4. Experimental results ................................................................... 12
4.1 Hang-up frequency ................................................................. 12
4.2 Hang-up height ...................................................................... 15
5. Hang-up analysis ........................................................................ 16
6. Conclusions ............................................................................... 20
References .................................................................................... 21
Experimental and comminution model framework for secondary
fragmentation quantification for block caving ......................................... 24
Abstract ........................................................................................ 24
1. Introduction ............................................................................... 24
2. Principals of Matrix Model ............................................................ 26
2.1 Modelling of secondary fragmentation ....................................... 27
3. Laboratory equipment, material and experimental conditions ........... 30
4. Results ...................................................................................... 31
4.1 Reproducibility evaluation ....................................................... 31
4.2 Extraction effect ..................................................................... 32
4.3 Fragmentation results ............................................................. 32
4.4 Modelling .............................................................................. 34
5. Mine application ......................................................................... 36
5.1 Model calibration based on BCF ................................................ 36

vi
5.2 Comminution model based on field data .................................... 38
5.3 Height consideration ............................................................... 39
6. Conclusions ............................................................................... 41
References .................................................................................... 41
Use of experiments to quantify the flow-ability of caved rock for block caving
....................................................................................................... 44
Abstract ........................................................................................ 44
1. Introduction ............................................................................... 44
2. Laboratory scaled model and material characterization .................... 46
2.1 Experimental set up and materials ........................................... 46
2.2 Experiments .......................................................................... 47
3. Results ...................................................................................... 48
3.1 Flow-ability ........................................................................... 48
3.2 Hang up frequency ................................................................. 49
3.3 Height of hang ups ................................................................. 51
4. Conclusions and discussion .......................................................... 52
References .................................................................................... 52
General Conclusion ............................................................................. 54
1. Hang Up occurrence .................................................................... 54
2. Secondary fragmentation ............................................................. 55
3. Future work ............................................................................... 56
3.1 Hang up events ..................................................................... 56
3.2 Fragmentation ....................................................................... 56

1
Introduction on work thesis
This research was developed in Block caving Laboratory, University of Chile,
and it patronized by the Advance Mining Technology Center (AMTC) through
the “Gravity flow technologies and fundamentals” project.
In the late years caving mining environments have been changing. This
changes includes greater depths, lower average grade deposits, demand for
increased productivity, escalating mining cost (capital and operating), harder
and heterogeneous rock masses and higher stress (Flores G, 20141). In Chile
we have some examples of new project under these new challenges such as:
Chuquicamata Underground project, Nuevo Nivel Mina at El Teniente and next
Nuevo Nivel Profundo.
Following these challenges, physical modelling was implementing to carry out
this investigation where fragmentation and hang ups phenomenon in Block
Caving mining were analysed. The motivation of this work was born to
increasing the knowledge on the behaviour and phenomena related to broken
ore extraction under high stress field in Block/Panel Caving mining. The mayor
stresses are due to the deeper condition on underground mining, this imply
higher overload in the extraction level owing to the broken column in caving
operations. These stresses condition impact on the gravity flow, but also has
generated collapse of production areas (DOZ case, Indonesia – FreePort2), in
this operation overload of the broken column implied loss between 15 and 30
percent of theoretical reserves in the production zones.
Furthermore, deeper condition implies higher broken ore column,
consequently, ore is draw under high vertical loads. There is a lack of
understanding of vertical load effect on fragmentation and ore flow.
Fragmentation is a key parameter in Block Caving mining, due to its relevance
on (Laubscher, 19943): drawpoint spacing, dilution entry into the draw column,
draw control, draw productivity and secondary blasting (Hang ups and
oversizes). All aforementioned factors have an economical implication on the
mine business. In response thereto, physical modelling under confinement
condition come out as an advantageous tool.
1 Flores, G 2014. Future Challenges and why cave mining must change. Caving 2014.
p . 23-52. 2 Sahupala H, Brannon C, Annavarapu S and Osborne K. Recovery of extraction level
pillars in the Deep Ore Zone (DOZ) block cave, PT Freeport Indonesia. In: Massmine
2008. Lulea, Sweden. p. 191 - 202. 3 Laubscher, 1994. The state of the art. Journal of the South African Institute of
Mining and Metallurgy.

2
In this context, it proposed as objectives develop a comminution model for
granular material and be able of estimate the hang up frequency in caving
mining. Both results based on experimental data through a scaled physical
model under high vertical load, and then, analysed with mine data. The
general methodology of work is illustrated:
General scheme of work
The following technical papers have resulted from the research presented in
this thesis:
1. Title: “Experimental quantification of hang up for block caving
applications”, paper elaborated for the International Journal of Rock
Mechanics and Mining Sciences.
This article analysed the hang-ups occurrence and the capability for their
prediction. Draft was send to the journal, to date comments were
received.
2. Title: “Experimental and comminution model framework for secondary
fragmentation quantification for block caving”, paper elaborated for the
proceeding Massmine 2016.
A comminution model used in mill comminution processes is presented,
this model is adjusted and calibrated for secondary fragmentation
prediction, to date the abstract of the paper was accepted to submit the
article.
3. Title: “Use of experiments to quantify the flow-ability of caved rock for
block caving”, paper presented in Caving 2014, pp 299 – 306.
The article is a summary of the preliminary results of the investigation,
related to the flow ability of the granular material under confinement
test.
Experimental tests
Secondary fragmentation
model
Hang up predriction
Aplication to Block Caving
mining
3
Paper 1: Experimental quantification of hang up for
block caving applications
Block Caving Laboratory
Advanced Mining Technology Center.
Mining Engineering Department, Faculty of Physical and Mathematical
Sciences, University of Chile, Santiago, Chile
Abstract
Block/Panel caving is an underground mining method in which ore production
is highly affected by interferences associated with the caving processes;
especially those related to gravity flow, such as, hang-ups and oversize rocks.
Despite its importance to production rate estimates, a review of current
methods indicates a lack of quantitative methods to estimate hang-up
frequency and height.
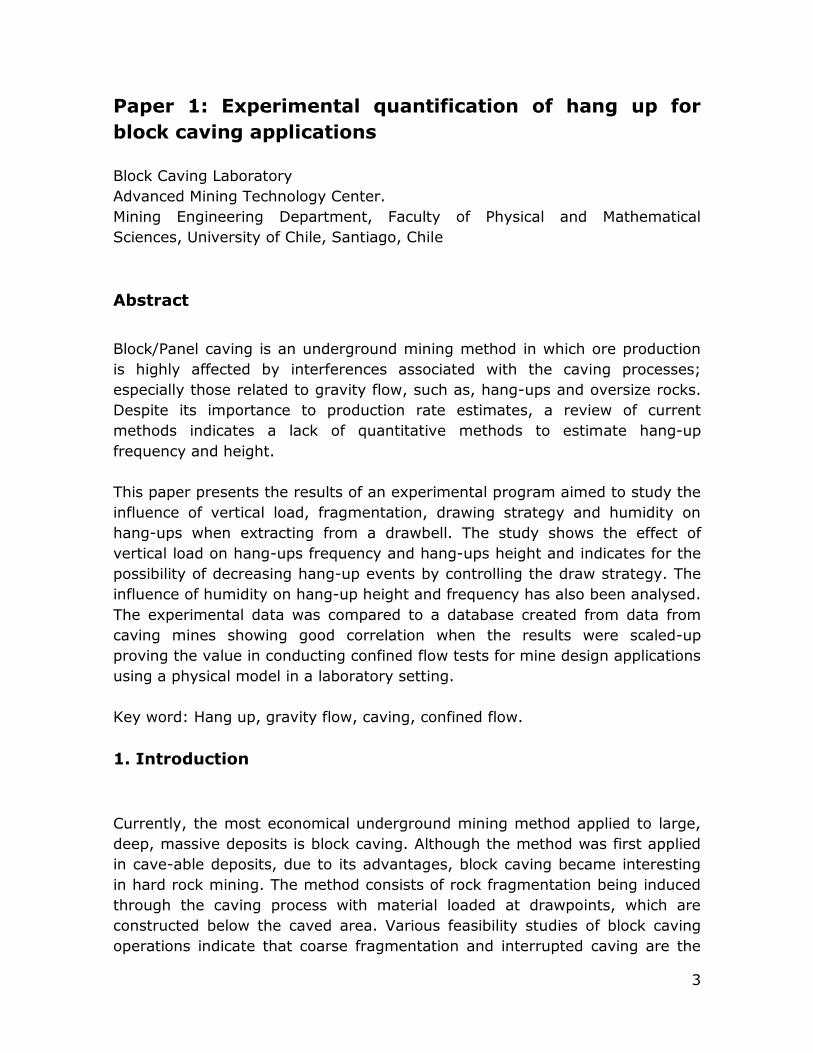
This paper presents the results of an experimental program aimed to study the
influence of vertical load, fragmentation, drawing strategy and humidity on
hang-ups when extracting from a drawbell. The study shows the effect of
vertical load on hang-ups frequency and hang-ups height and indicates for the
possibility of decreasing hang-up events by controlling the draw strategy. The
influence of humidity on hang-up height and frequency has also been analysed.
The experimental data was compared to a database created from data from
caving mines showing good correlation when the results were scaled-up
proving the value in conducting confined flow tests for mine design applications
using a physical model in a laboratory setting.
Key word: Hang up, gravity flow, caving, confined flow.
1. Introduction
Currently, the most economical underground mining method applied to large,
deep, massive deposits is block caving. Although the method was first applied
in cave-able deposits, due to its advantages, block caving became interesting
in hard rock mining. The method consists of rock fragmentation being induced
through the caving process with material loaded at drawpoints, which are
constructed below the caved area. Various feasibility studies of block caving
operations indicate that coarse fragmentation and interrupted caving are the

4
main risks that can make the method unfeasible, especially in hard rock and
poorly jointed deposits. Operationally, one of the most challenging aspects is
the handling of oversize rocks, which have a high impact on the production
rate of a drawpoint. According to Laubscher [1], the main parameters affecting
the draw rate are fragmentation, methods of draw, percent of hang-up and
secondary breakage. Therefore, practical hang-up estimation would assist in
production planning and scheduling as well as equipment selection for the
mitigation of hang-ups. Thus, the prediction of the hang-up frequency for a
given geotechnical design or environment is a key to determining the
production rate of a cave operation [2].
A hang-up is an interlocking arch of fragments that lies across the top of the
drawpoint blocking the flow of the material. There are multiple parameters that
influence hangs-up. Kvapil [3] listed thirteen parameters that influence hang-
up occurrence: particle size distribution, max size (d100), shape of fragments,
surface roughness and friction between particles, fragment strength, presence
of fine material and moisture content, compressibility and compaction,
extraction point geometry, magnitude, distribution and direction of external
loads and extraction rate. However, there is a need to quantify the influence of
these parameters on hang-up frequency. In general, hang-up frequency could
be defined as the tons of material extracted from one drawpoint between
interruptions of the flow. Hang-up frequency usually increases during the
extraction of a drawpoint due to the decrease in the percentage of coarse
fragments in relation to the secondary fragmentation [1].
To-date, attempts have been made to quantify hang-up frequency for coarse,
caved rock through the collection of data from mines, controlled experiments
and numerical modelling [2-13], mine data has been extensively used to
predict hang-up frequency [4-7]. Hadjgeorgiou [8], who summarized
experiments and numerical modelling under low confined conditions, showed
the influence of the ratio of the particle size to the ore pass diameter on flow
conditions. Orellana [9] quantified the hang-up frequency in a physical model
for different types of granular material showing the influence of density,
strength, friction proprieties and shape of the fragments on hang-up
frequency. However, the results obtained during low confined experimental
conditions could not be extrapolated to full-scale caving operations as the
models could not emulate the overload of the in-situ column of caved ore,
which induces fragmentation and compaction. Recently, the results of the
confined flow experiments using a circular exit point with vertical pressures
from 1-6 MPa demonstrated that the mean vertical pressure and the fragment
size influence the flow-ability and hang-up frequency [2, 10, 11]. The
applicability of these latest experimental results to material flow at the full-size

5
cave mines is not clear as the influence of the geometry of the drawbell and
type of loading machine was not investigated.
There are two numerical models that can be used to predict hang-up
frequency: Block Cave Fragmentation (BCF) and Core2Frag [12, 13]. These
models have been developed to predict the fragmentation and hang-up
frequency. Indeed, hang-up frequency prediction is accomplished according to
the rule-based approaches. For example, BCF determines the probability of
hang-ups occurrences in a drawbell using the secondary fragmentation results
as an input to the model. BCF applies two methods to estimate the hang-up
frequency: Ore Pass Rules and Robin Kear Rules. Core2Frag hang-up module
likewise considers a different Robin Kear Rule-Based Approach and uses
secondary fragmentation as an input [13]. Both Ore Pass and Robin Kear rules
consider the diameter of fragments and drawbell and define the hang up
frequency based on different assumptions [12]. Even though good agreement
was obtained with Robin Kear method and small physical models of drawpoints
[6], this method seemed to overestimate the number of hang-ups. However, it
appears that the Ore Pass rule maybe under estimating the number of hang
ups. Besides, both rules have the deficiency of considering the role of vertical
loads, moisture, fine material and draw strategy on hang-up frequency. While
useful, rules-based methods to predict hang-ups require further development
to be considered a validated approach.
In this paper, the results of the experiments using a scaled, confined physical
model to investigate the flow mechanisms during ore extraction in block caving
method are described. The experiments were conducted using granular
material, which was drawn from one or two drawpoints of the same drawbell.
Hang-up frequency and height of hang-ups were quantified for different mean
vertical pressures while extracting from one or two drawpoints. In addition, the
influence of fragmentation and moisture on hang-up occurrence was also
analysed, showing the importance of considering confined conditions on hang-
ups occurrence.
2. Similitude analyses
The use of scaled models for engineering applications requires a provision for
the conditions of similitude that depend on the problem to be solved. Castro
(2006) proposed six criteria to achieve kinematic similitude in a large physical
model to study free flow in granular materials for block caving [14]. The
conditions of similitude include: geometrical similitude (shape and size of
particles, geometry of drawpoints), friction angle (residual friction angle and
boundary friction angle), bulk density (related to size distribution), and time

6
(draw rate). However, dynamic similitude refers to the scaling of the most
important forces within the model.
In the gravity flow of caved rock in block caving, the main forces are vertical
loads, friction and cohesion. In summary, a reduced system should preserve
the geometry, velocities and the acting forces of the system under study
(prototype). Of course, there are distortions that are likely to occur due to the
presence of spurious forces that may affect the scaled system. Table 1 lists the
scale factors that needs to be considered, which are scaled in accordance with
the geometric scale factor (1:λL).
Table 1: Similitude analysis variables scaling parameters
Variable Scale Factor
Length 𝜆𝐿
Area 𝜆𝐿2
Volume 𝜆𝐿3
Velocity 2𝜆𝐿1/2
Time 𝜆𝐿1/2
Weight 𝜆𝐿3
Density 1
Friction
Angle 1
As noted in Table 1, the introduction of vertical forces also requires the scaling
of the strength of the rock mass to achieve dynamic similitude. To overcome
these limitations, Castro et al. (2014) presented the design and results of an
experimental setup to investigate confined flow [2]. In this case, a vertical
pressure was applied through a cylindrical press during the flow experiments.
The experiments showed the influence of the load on fragmentation,
compaction and hang up frequency. However, it should be noted that these
experiments required a special setup, which may not be available to all
physical modelers.
3. Definition model condition
The experimental model of confined flow was implemented in the laboratory to
investigate the impact of mean vertical pressures, moisture and draw policies
on hang-up occurrence. This model was represented by three main sections.
The first section was a “Physical model” which contained the steel-based
container with granular material under high stress condition, including the

7
drawbell located at the bottom of the model. The second section was “Loading
system” which involved LHD system to draw material at the drawpoints.
Moreover, this model comprised a press as a “Hydraulic press machine” to
apply the vertical pressure during the experiments.
3.1 Physical model
The physical model consisted of a steel cylinder, with a hydraulic press
machine which was filled using broken rock (60 kg of crushed ore) (Figure 1).
Fuenzalida [10] introduced this geometrical model to analyse the effects of
vertical pressures on gravity flow. However, the base of Fuenzalida model
consisted of a circularly-shaped hole to draw material. In this research, for a
practical application in cave mining, a drawbell was designed with a
rectangular opening of 53 mm x 96 mm at the bottom of the model (Figure
1.b). The dimensions of the opening were defined to emulate a drawbell
designed at Andina copper mine, Chile, with a scale of 1:75 (in all three x,y,z
dimensions). The main reason of selecting Andina mine was its regular
geometry of drawbell and the simplicity of constructing the scaled down model.
However, the objective of the research did not resembling an exact situation,
but a general condition. Hence, the model media was not the same as
Andina´s mine. Actually, two specific fragment sizes from the underground´s
Chuquicamata mine were selected to perform the experiments.
Figure 1: Experimental model: (a) cylindrical model in a press machine which changes
the vertical pressure, σV, and (b) drawbell, located at the bottom, center of the model.
The detailed geometry of the drawbell is displayed in Figure 2¡Error! No se
encuentra el origen de la referencia., including two different sections of the
physical model. Drawbell was located in the centre of the cylinder with
rectangular openings for two drawpoints. This model enabled analysing the
flow-ability of granular material subject to the interaction between drawpoints.

8
However, the interaction between drawbells was not in the scope of this
research. Scaled and actual drawbell dimensions are indicated in Table 2.
Figure 2: Physical model dimension.
Table 2: Mine infrastructure dimensions
Item Scaled model
Value
Actual
size
Drawbell angle (A section) 90° 90°
Drawbell angle (B section) 72° 72°
Drawbell height 180 mm 13.5 m
Drawbell apex 53 mm 4 m
Gallery height 60 mm 4.5 m
Gallery width 60 mm 4.5 m
3.2 loading system
In this physical model, an extraction system was built to replicate the LHD
extraction, as is the case of mine site conditions. The material extraction from
the drawbell was carried out utilizing two LHD systems (scaled from a bucket
of 14 yd3). The LHD extraction system was developed to replicate the draw
system of the production level in a Block/Panel caving operation (see Figure 3).
The system had two motors: stepper and servo. Stepper motor provided
horizontal movement of the extraction system and the servo motor controlled
the bucket movement during loading and dumping of the fragmented material
(between 50 and 60 grams of material).

9
Figure 3: LHD extraction system.
3.3 Boundary condition
The cylindrical geometry of the model was selected to prevent the boundary
effect related to arching and stress concentration in the corners. Moreover, the
design of drawpoints and LHD system allowed for the study of hang-up
occurrence in the drawbell, taking into account the boundary conditions related
to drawpoint geometry and conditions emulating the mine site conditions.
Considering the flow pattern within the cylinder, it was supposed that core flow
pattern would be happened due to the wide angle of drawbell. Figure 4.a
shows a schematic view of core flow pattern. The material statue at the end of
experiments also confirmed this pattern (Figure 4.b). If the core is narrower
than the width of cylinder (D), as in Figure 4, the material near the top will
cascade down the top surface into the flowing core and will be discharged
before material at a lower level [15]. During the experiment the internal flow
never reaches the wall of cylinder. The advantage of this flow pattern is that
wall stresses peaks occur in the flowing core and the surrounding stagnant
material shields the walls to some extent from these effects.
Figure 4: (a) A schematic view of material core flow pattern; (b) Material state
after the experiments

10
3.4 Model media
The material used in the experiments was crushed sulphide ore with a high
aspect ratio to represent the geometry of caved rock, sphericity of 0.58 and a
roundness of 0.25, where sphericity measures the degree to which a particle
approaches a spherical shape and roundness refers to the sharpness of the
corners and edges of a grain. To evaluate the impact of size distribution on
hang-up events, two different particle size distributions of the material were
prepared and tested: one with the 80% passing size (d80) of 11.8 mm and the
second with a d80 equals to 15.6 mm (see Figure 5: Curve 1 and Curve 2,
respectively). Both samples had the same uniformity coefficient of 2
(Cu=d60/d10). The particle size distributions were scaled from the predicted size
distribution of the primary fragmentation curve of the underground´s
Chuquicamata mine project (Figure 5) [16]. Table 3 summarizes the
characteristics of the samples, showing that the only difference between the
samples is in the dimension of the particles.
Figure 5: Comparison of particle size distribution of samples used in the experiments
with real size distribution of mining material.
Table 3: Characteristics of the material used during the experiments
Curve
Average
size, d50 d80
Uniformity
coefficient
Drawpoint
width/d50,
initial
Drawpoint
length/
d50, initial
Point
load
index
Initial
humidity Density
Internal
friction
angle
mm mm Cu dW/d50 dL/d50 IS50,
MPa
% (solid
by
weight)
kg/m3 °
1 8.6 11.8 2.0 6.2 11.2 6.2 0.6 2,630 39
2 10.8 15.6 2.0 4.9 8.9

11
3.5 Experimental program
A total of 33 laboratory tests of granular material under conditions of high
confinement were conducted. Variables measured during tests included hang-
up frequency, the height of hang-up and secondary fragmentation. The input
variables were: size distribution, mean vertical pressure, draws strategy and
humidity conditions.
During the experiments, different vertical pressures in dry and wet conditions
were applied. The humidity conditions were created with 1.6% of water
content (mass percent), which caused enough humidity to cover the surface of
the fragments with moisture (4.3% degree of saturation). The hang-up
frequencies and the heights of hang-ups were recorded while drawing material
through one or two drawpoints. Table 4 summarizes the number of
experiments carried out, for each the vertical pressures applied. In this table,
the symbols “1D”, “2D” and “1DW” donate the extraction from one drawpoint ,
both drawpoints (in sequence) and one drawpoint applying wet material
respectively. The bulk density and void ratio are also recorded for each test in
Table 4. These parameters are found to vary significantly with applied different
mean vertical pressures. This is mainly due to the rearrangement of the
particles. It should be mentioned that bulk densities and void ratios were
measured when the pressure was reached to its defined amount and before
ore extraction. In addition, vertical pressure was stabled during extraction in
each test.
The measurements of hang-ups for all experiments were carried out after 100
extraction cycles of LHD were achieved, which equalled approximately to five
kilograms of extracted material. When a hang-up occurred, it was recorded
and removed manually. For 2D tests, the extraction from both drawpoints was
performed sequentially until a hang-up occurred. When a hang-up occurred at
the drawpoint, drawing from the other drawpoint continued. If a hang-up did
not clear naturally after drawing five cycles of LHD from the neighbouring
drawpoint, the hang-up was removed manually.
Table 4: Experiments carried out during this research
Vertical
pressure
MPa
d50 = 8.6 mm d50 = 10.8 mm Bulk
density
Void
ratio
1D
(Dry)
2D
(Dry)
1DW
(Wet)
1D
(Dry)
2D
(Dry)
1DW
(Wet) t/m3 #
0 2 2 2 2 2 2 1.38 0.91
0.8 1 - - 1 - - - -
1.5 2 1 1 2 1 1 1.48 0.77
3 2 1 1 2 1 1 1.56 0.69
5 1 1 - 1 - - 1.69 0.56

12
4. Experimental results
Qualitative and quantitative analyses of hang-ups (frequency and height) were
performed. For qualitative analysis, three classes for hang-up location were
defined (see Figure 6). Type A illustrates a low hang-up characterised by a
vertical slope of broken ore at the drawpoint brow. This type of hang-up was
generally reported when coarse fragments collected at the top of the
drawpoint. This type of hang up was mostly cleared by extracting material
from the opposite drawpoint (2D tests). The type B hang-up in Figure 6
corresponds to the low hang-up over the drawpoint. The height of this hang-up
was significantly affected by the magnitude of the applied vertical pressure.
This type of hang-up must be removed manually. Type C represents a high
hang-up located at the top of the drawbell. This type of hang-up often appears
when high vertical pressure was applied. Due to the high compaction of
material, it was not possible to clear type C hang-up manually. Therefore, the
experiment finished when high hang up occurred.
Figure 6: Types of hang-ups.
4.1 Hang-up frequency
The measurement unit of the hang-up frequency was the amount of material
extracted between two consecutive hang-ups, gram/hang-up, which was
subsequently scaled up to ton/hang-up to be comparable with the mine data.
Hang-up frequency of the samples (Curve 1 - C1 and Curve2 - C2) was
measured when drawing from one drawpoint in dry (1D) and moisture (1DW)
conditions as well as two drawpoints in dry condition (2D). The results from
applying different vertical pressures are presented in Figure 7¡Error! No se
encuentra el origen de la referencia. and Figure 8 (for C1 and C2,
respectively). Although three experiments were performed applying 5 MPa
mean vertical pressures, these results have not been displayed in Figures 7
and 8 as, at the start of the test, a high hang-up occurred on the top of the
drawbell due to the high stress conditions. As a result, a gap area was
generated during the extraction of the material between the coarse arch and

13
the ore drawn. Therefore, the fragments under the gap area were drawn
without confinement.
A downward trend for all drawing strategies (Figure 7 and 8) reveals that
hang-up frequency decreases with increasing mean vertical pressures. The
same results were obtained in previous studies with gravel material and
circumferential extraction point [2]. Comparison of different tests shows that
lower hang-up frequencies were obtained in wet condition. The hang up
appeared in wet situation should probably be cohesive arches; since water
creates an agglomerate of fine materials due to increasing the cohesion
between fragments [3, 18]. Furthermore, when comparing two size
distributions (Figure 6 and 7), it can be seen that hang-up frequency of finer
material (C1) is significantly higher than the coarser fragmentation (C2). For
instance, during the experiments without confinement, hang-up frequency
increased 40% (C1) and 8% (C2) in 2D tests (compared with 1D tests). The
increase in the hang-up frequency implies a better flow-ability of broken
material. In addition, Curve 1 has less hang-up events due to a high ratio
dw/d50 = 6.2 as compared to Curve 2 (dw/d50 = 4.9).
Figure 7: Curve 1 (d80 = 11.8 mm) hang-up frequency results.
Figure 8: Curve 2 (d80 = 15.6 mm) hang-up frequency results.

14
A summary of results for the 2D test is shown in Table 5. The percentage of
hang-ups, which were removed automatically, shows that the alternate
extraction between drawpoints assists in the removal of hang-ups. Based on
the experiments, approximately fifty percent of hang-ups were removed by
alternating the extraction between the drawpoints, which shows that it is not
always necessary to remove hang-ups manually when applying this draw
strategy. Due to the interaction between drawpoints (at least for the ratios
dL/d50 tested between 8.9 and 11.2).
Table 5: Hang-ups on Test 2D strategy
Vertical pressure Total number of
hang ups
Hang up remove
Manu-ally
Hang up removal
automatically, %
MPa d50 = 8.6 mm
d50 = 10.8 mm
d50 = 8.6 mm
d50 = 10.8 mm
d50 = 8.6 mm
d50 = 10.8 mm
0 2 4 1 2 50% 50%
0 3 4 2 3 33% 25%
1.5 4 6 2 1 50% 83%
3 5 6 1 3 80% 50%
Mean 53% 52%
The size distribution has a significant impact on hang-up phenomena. During
the experiments, fragmentation was measured before and after each test.
Table 6 shows the degree of fragmentation as a function of the mean fragment
size. Experimental results show that final fragmentation depends on the
applied mean vertical pressure. Lower fragmentation is achieved with an
increase in vertical pressure and, with a decrease in material size distribution
under increased pressure, there is a reduction in hang-up frequency. In
addition, the vertical stress influence on hang-up frequency is evident in Table
6. For example, in tests 1D, the same final ratio dw/d50 of 6.2 was achieved for
0 MPa in Curve 1 (d50,initial = 8.6 mm) and 3 MPa in Curve 2 (d50,initial = 10.8
mm), yet the hang-up frequency in Curve 1 was almost five times that of
Curve 2.

15
Table 6: Summary of experimental results
Test Vertical
pressure
d50 d50 dw/ d50 Hang up
frequency
Standard
deviation initial final Final
Condition MPa mm mm # grams/hang up grams/hang up
1D
0
8.6
8.6 6.2 3109.3 713.1
0.8 7.8 6.8 2358.3 376.7
1.5 7.6 7.0 2074.9 210.7
3 7.1 7.4 1147.9 327.1
0
10.8
10.8 4.9 1163.2 471.1
0.8 9.1 5.8 1036.3 471.3
1.5 8.7 6.1 797.6 465.8
3 8.6 6.2 657.4 337.0
1Dw
0
8.6
8.6 6.2 1492.9 386.0
1.5 8.4 6.3 1434.5 372.5
3 8.2 6.5 866.4 104.0
0
10.8
10.8 4.9 555.0 230.3
1.5 10.5 5.1 476.5 134.6
3 10.0 5.3 437.6 137.7
2D
0
8.6
8.6 6.2 4342.4 810.7
1.5 7.6 7.0 2515.0 688.8
3 7.1 7.4 2208.7 528.4
0
10.8
10.8 4.9 1258.8 529.6
1.5 8.7 6.1 910.7 382.5
3 8.6 6.2 753.2 611.9
4.2 Hang-up height
The hang-up height is the distance between the top of the gallery and the arch
of the hang-up. Table 7 shows the experimental results of the height of hang-
ups with respect to the different mean vertical pressures. For all scenarios,
increased vertical pressure resulted in the increase in the height of hang-ups.
The results in Table 7 show that the height of hang-ups during 2D tests is less
than during the 1D test. Therefore, the interaction between drawpoints (2D
tests) not only decreases the number of hang-ups but also reduces hang-up
height. Furthermore, in comparing the dry and wet conditions, the results show
that the height of hang ups is more sensitive to vertical pressure under dry
conditions in experiments carried out probably due to the frictional forces
between fragment surfaces (of major sizes)decrease with the moisture
content and the fragment sizes tested.
Table 7: Hang-up mean height results, mine scale.
Vertical pressure
MPa
1D 2D 1DW
Height C1 m
Height C2 m
Height C1 m
Height C2 m
Height C1 m
Height C2 m
0.0 0.0 0.5 0.7 0.2 1.1 2.5
0.8 3.2 1.1 - - - -
1.5 0.1 4.0 0.0 0.4 0.3 3.5
3.0 5.1 5.5 0.0 3.1 2.3 4.4
5.0 9.8 5.6 - - - -

16
The most frequent hang-ups observed during the experiments were type A
(Figure 6) while high hang-up (type C) rarely appeared. Almost all high hang-
ups appeared in conditions of high vertical pressure (greater than 3 MPa).
Figure 9 displays a high hang-up under 5 MPa mean vertical pressure. The
majority of the arch surface is covered by coarse fragments; however, the size
of the largest fragment is at least five times less than the drawbell apex.
According to the ore pass studies [8], these types of hang-ups wouldn´t occur
for the size distributions used in this research. However, it should be noted
that the ore pass studies in [8] were performed in low stress condition.
Therefore, the state of stresses and the geometry of the drawpoint must be
considered in hang-up investigations.
Figure 9: High hang-up on test.
5. Hang-up analysis
The experimental results were scaled up to enable a comparison with mine site
data. A complete database of three caving mines was considered in this study.
This database includes DOZ mine of Indonesia, Palabora mine of South Africa
and four sectors of El Teniente mine in Chile. Due to the different drawbell
geometry and fragment size distributions, the ratio of drawpoint apex (dW) and
mean fragment size (d50) was selected as comparative parameters. Table
8¡Error! No se encuentra el origen de la referencia. illustrates these ratios
determined from experiments as well as mine site data. The dW/d50 of mine site
data ranges from 4.7 to 6.8 and the experimental ratios fall within this range.

17
Table 8: Ratio between the drawpoint apex and the mean fragment size
Data Ratio (dW/d50, initial)
Curve 1 (Test) 6.2
Curve 2 (Test) 4.9
Palabora 4.7
Reno 6.8
Diablo Regimiento 6.8
Teniente 4 Sur 6.2
Esmeralda ND
DOZ 5.1
ND: no data.
The experimental results illustrated the significant influence of mean vertical
pressures over hang-ups. Since the mean vertical pressure of mine data is not
available, it is necessary to calculate this parameter for each mine under
study. According to the arching effect over the production level, it is not
rigorous to calculate mean vertical pressures considering just weight and
height of caved material (ϒ*h) [14]. Experimental study developed in [14]
with fragmented gravel indicated mean vertical pressure was 0.71* ϒ*h.
Numerical modelling also manifested stress arching on granular material [18].
Stress arching occurs when part of the material weight is transferred into the
sidewalls, forces acting at the boundaries in an opposite direction to the
material weight. Surrounding uncaved boundaries of a caved are generally
rough, therefore, Janssen approach [19] was applied to estimate the mean
vertical pressure at the bottom of the broken ore (σv) in each mine, a general
solution of Janssen’s equation for mean vertical stresses is given by
Nedderman [15]:
𝜎𝑣̅̅ ̅ =𝑅ℎ∙𝜌𝑏∙𝑔
𝑇𝑎𝑛(ø𝑤)∙𝑘(1 − 𝑒𝑥𝑝
−𝑘∙𝑇𝑎𝑛(ø𝑤)𝑧
𝑅ℎ ) (1)
Where:
Rh: Hydraulic radius of the drawn area (m); drawn area can be estimated
through the ratio between production (tpd) and draw rate (tpd/m2),
ρb: Bulk density (kg/m3),
g: Gravitational constant (m/s2),
k: Ratio of horizontal to vertical stress (k = 1 – sen(ø) [15], ø: internal friction
angle),
øw: Friction angle at the ore column boundary (rad) and
z: Depth of broken ore (m), between production level to surface.
In order to compare the results obtained from the experiments with mine data,
hang-up frequency was scaled up through geometric scale factor (1:75).
Accordingly each ton per hang up equals (geometric scale factor)3/106 times of

18
one gram per hang up. For instance 1000 grams per hang up equivalent to
421.875 tons per hang up with the geometric scale factor of 75.
Subsequently, the mean vertical pressure was determined for the mines under
analysis through equation (1), considering the parameters shown in Tables 9,
10 and 11. Hang-up frequency can be considered as a function of vertical
pressure which is dependent on the height of draw column. In all mines, the
hang-up frequency increased by advancing the extraction of the ore column.
This was due to the reduction in the size of the fragments, which is known as
secondary fragmentation [1].
Table 9: Mine data of Diablo Regimiento, Reno, Teniente 4 Sur and DOZ mines.
Mine Draw column
height
Hang up
frequency Depth
Drawn
area
Mean Vertical
pressure
Name Sector m ton/hang up M m2 MPa
Diablo
Regimiento [4]
0-45 605 590 [20]
16320
[4] 2.0
0-93 784
Reno
[4]
Fw
0-50 403
830 [20]
28026
[4]
2.5
0-100 531
0-200 522
0-300 434
0-400 782
Hw
0-50 458
23355
[4]
0-100 596
0-200 830
0-300 914
0-400 914
Hw'
0-50 450
-
0-100 593
0-200 811
0-300 844
0-400 844
Teniente 4 Sur
[4]
0-50 251
550-660
[20]
99360
[4] 4.4
0-100 327
0-200 461
0-300 514
DOZ [5]
0-60 348.2
1200
[21] 41550 3.2
60-120 294.2
120-180 321.4
180-240 408.6
>240 609

19
Table 10: Mine data of Esmeralda mine.
Mine Extraction of
primary column
Hang up
frequency Depth
Drawn
area
Mean
Vertical
pressure
Name Sector % ton/hang
up m m2 MPa
Esmeralda [7]
10-20 750
650
30589
(B1)
13163
(B2)
[7]
2.2
10-20 860
10-20 900
20-30 1150
30-40 1130
40-50 1400
Table 11: Mine data of Palabora mine.
Mine Period Hang up
frequency Depth
Drawn
area
Mean
Vertical
pressure
Name Secto
r year ton/hang up M m2 MPa
Palabor
a [6]
1
2004 240
500-1260
[20]
11071
[6]
2.0
2005 300
2006 380
2007 390
2008 400
2009 380
2
2004 360
16850
[6]
2005 400
2006 620
2007 780
2008 640
2009 640
3
2004 400
27778
[6]
2005 540
2006 820
2007 1000
2008 600
2009 720
4
2004 240
11071
[6]
2005 240
2006 320
2007 320
2008 340
2009 320
In Figure 10, hang-up frequency of different mines as well as experiments (1D
and 2D tests for different size distribution C1 and C2) are plotted against the
mean vertical pressure. Linear Regression was applied to the experimental
results. The influence of the ore fragmentation on hang-up frequency is clearly

20
visible in Figure 10, which could be used as a practical approach to evaluate
the hang-up frequency for different mean vertical pressures and
fragmentation.
Figure 10: Hang-up frequency graph. Ref.: Diablo Reg. [4], Reno [4], Teniente 4 sur
[4], DOZ [5], Palabora [6], Esmeralda [7].
6. Conclusions
The influence of fragmentation, mean vertical pressure, draw strategies and
humidity on hang-up frequency and hang-up height was studied under
confined conditions for a single drawbell. During the experiments conducted in
the laboratory, hang-up frequency and hang-up height were recorded for
different pressure, fragmentation, draw strategy and humidity scenarios.
The review of hang up frequency obtained in each vertical pressure shows the
contrary relationship between these parameters. As can be seen from the
graph in Figure 10, an increase in mean vertical pressure results a decrease in
hang-up frequency. The Similar results were also obtained in previous studies
[2]. Therefore, vertical pressure should be considered in the studies of hang-
up frequency. Not even hang –up frequency, but also hang-up height was
influenced by vertical pressure. According to Table 5, high hang-ups mostly
appeared when applying high vertical pressure, due to the high compaction
and increasing the friction forces between ore fragments.
Besides vertical pressure, this research shows that draw strategy also influence
hang-up height and frequency. Higher hang-up frequency but lower hang-up
heights are experienced when using two drawpoints with alternating extraction
between the drawpoints due to interaction between the flow zones in

21
experiments. As a result, it would be possible to increase productivity by
changing the draw strategies during ore extraction; provided that the
drawpoints interaction takes place. In that case, the natural (due to draw)
removal of hang-up is increased when alternated extraction between
drawpoints is implemented.
The presence of water mostly change geomechanical and geotechnical
concepts of rock. Consequently, the influence of water on hang-up
characterization were analysed in this study, considering one active drawpoint.
The results revealed that Hang-up frequency is lower in wet conditions (1DW)
as compared to dry rock (1D) due to higher cohesion in humid conditions.
Moreover, hang-up height recorded in wet conditions is lower than in dry
situation for the same mean vertical pressure due to lower frictional force
between fragments causing instability in coarse arches, which decreases the
hang-up height.
Comparison of the experimental results of the samples with two different size
distributions showed that coarser fragmentation results in fewer number of
hang-up frequency. With the increase in the number of large fragments, the
probability of blockage at drawpoints increases.
In addition to laboratory experiments, field data were also used to compare
with experimental results. The scaled up hang-up frequency fell within the
range of the mine site data. It is thus concluded that experimental results
could be used as a practical guide for the analysis and prediction of the hang-
up events.
Acknowledgements
This paper describes a component of the work carried out withn the project
“Gravity flow technologies and fundamentals” run by the University of Chile
Advanced Mining Technology Center and funded by the chilean goverment
thorugh the Conycit Project FB0809. The authors would like to thanks Dr
Elenora Widzyk-Capehart for her contribution in the preparation of this article.
References
[1] Laubscher DH. Cave mining - the state of the art. Journal of the South
African Institute of Mining and Metallurgy 1994; 94: 2279.
[2] Castro R, Fuenzalida MA, Lund F. Experimental study of gravity flow under
confined condition. International Journal of Rock Mechanics and Mining
Sciences 2014; 67: 164-9.
22
[3] Kvapil R. Gravity flow in sublevel and panel caving – A common sense
approach. Sweden, 2008.
[4] Hurtado J, Pereira J, Campos R. Fragmentation back-analysis, mines:
Diablo Regimiento, Reno and Teniente 4 Sur. In: Final report, NNM-ICO-GEO-
INF Nº 003, Codelco 2007. (In Spanish)
[5] Kurniawan C, Setyoko TB. Impact of rock type variability on production
rates and scheduling at the DOZ-ESZ block cave mining. In: 5th International
Conference & Exhibition on Mass Mining. Lulea, Sweden; 9 – 11 June 2008. p.
291-301.
[6] Ngidi S, Pretorius D. Impact of poor fragmentation on cave management.
In: Proceeding of the 2nd International Symposium on Block and Sublevel
Caving. Perth, Australia; 20 – 22 April 2010. p. 593-601.
[7] Viera E, Diaz E. Analysis of hang up frequency in Bloque 1-2, Esmeralda
Sur Mine. In: Proceeding of the 3rd International Symposium on Block and
Sublevel Caving. Santiago, Chile; 5-6 June 2014. p. 138-145.
[8] Hadjigeorgiou J, Lessard JF. Numerical investigation of ore pass hang-up
phenomena. International journal of rock mechanics & mining sciences. 2007;
44: 820-34.
[9] Orellana L. Study of design variables for the Continuous Mining System
through laboratory experiments. Master thesis. University of Chile, Santiago;
2012. (In Spanish)
[10] Fuenzalida MA. Study of the confined gravity flow and its application to
caving. Master Thesis. University of Chile, Santiago; 2012. (In Spanish)
[11] Gómez R. Secondary fragmentation model and hang-ups on cave mining.
Modelo de fragmentación secundaria y colgaduras en minería de caving.
Bachelor degree. University of Chile, Santiago; 2014. (In Spanish)
[12] Esterhuizen GS. BCF version 3.05 – A program to predict block cave
fragmentation – Technical reference and user`s guide. 2005.
[13] Nicholas DE, Srikant A. Assessment of primary fragmentation from drill
core data. In: 4th International Conference & Exhibition on Mass Mining.
Santiago, Chile; 22-25 August 2004. p. 55-58.
[14] Castro R. Study of the mechanisms of gravity flow for block caving. PhD
Thesis. The University of Queensland. 2006.

23
[15] Nedderman RM. The method of differential slices. In: Statics and
Kinematics of granular material. Cambridge University Press. 1992. pp. 84 –
126.
[16] Codelco Chile Vicepresidencia Corporativa de Proyectos. Prefeasibility
study of Chuquicamata underground mine project - Main decisions, MSC-ICO-
SKMMIN-0000-GEN-INF-100. 2009. (In spanish)
[17] Beus M, Pariseau W, Stewart B and Iverson S, 2001. Design of ore
passes. In: Underground Mining Method. Edit W Hustrulid and R Bullock. p.
627-634.
[18] Pierce M. A model for gravity flow of fragmented rock in block caving
mines. PhD Thesis. The University of Queensland. 2009.
[19] Janssen, HA 1895, ‗Experiments regarding grain pressure in soils,
Zeitschrift Des Vereines Deutscher Ingenieure, vol. 39, no. 35, pp.1045-1049,
Translated from German by W Hustrulid and N Krauland. in Proud to be miners
(Proceedings, MassMin 2004, Santiago, August 2004), eds A Karzulovic and MA
Alfaro, Santiago, pp. 293-300.
[20] Karzulovic A. Height of primary rock in panel caving mining. In: Report DT
- CG - 01 – 002. 2001. (In spanish)
[21] Sahupala H, Brannon C, Annavarapu S and Osborne K. Recovery of
extraction level pillars in the Deep Ore Zone (DOZ) block cave, PT Freeport
Indonesia. In: 5th International Conference & Exhibition on Mass Mining. Lulea,
Sweden; 9 – 11 June 2008. p. 191 - 202.
24
Paper 2: Experimental and comminution model
framework for secondary fragmentation quantification
for block caving
Abstract
Block Caving is the most economic underground methods for excavating
massive ore bodies, due to the low production costs. The success of block
caving operation depends on the fragmentation and draws control as large
blocks decrease the equipment efficiency, inhibit the material flow, and may
lead to extensive secondary blasting. Even though ore handling system design
as well as overall economic results critically rely on secondary fragmentation,
this parameter continues to be one of the least understood in the caving
operations.
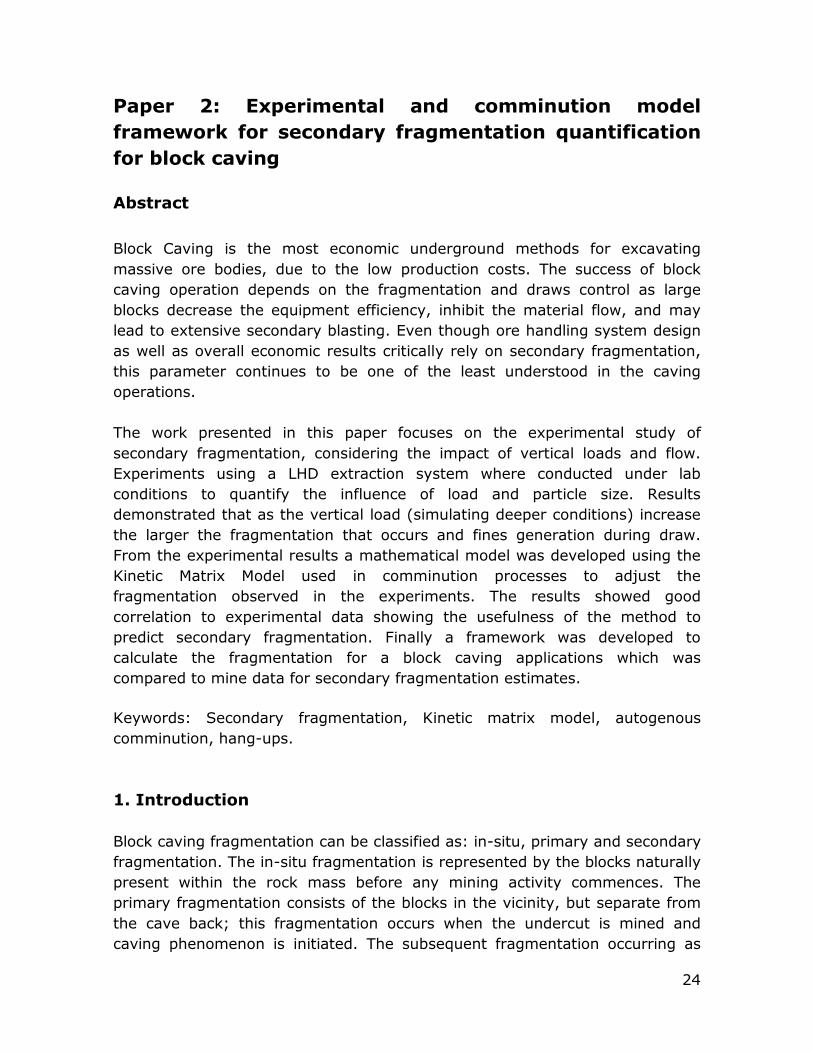
The work presented in this paper focuses on the experimental study of
secondary fragmentation, considering the impact of vertical loads and flow.
Experiments using a LHD extraction system where conducted under lab
conditions to quantify the influence of load and particle size. Results
demonstrated that as the vertical load (simulating deeper conditions) increase
the larger the fragmentation that occurs and fines generation during draw.
From the experimental results a mathematical model was developed using the
Kinetic Matrix Model used in comminution processes to adjust the
fragmentation observed in the experiments. The results showed good
correlation to experimental data showing the usefulness of the method to
predict secondary fragmentation. Finally a framework was developed to
calculate the fragmentation for a block caving applications which was
compared to mine data for secondary fragmentation estimates.
Keywords: Secondary fragmentation, Kinetic matrix model, autogenous
comminution, hang-ups.
1. Introduction
Block caving fragmentation can be classified as: in-situ, primary and secondary
fragmentation. The in-situ fragmentation is represented by the blocks naturally
present within the rock mass before any mining activity commences. The
primary fragmentation consists of the blocks in the vicinity, but separate from
the cave back; this fragmentation occurs when the undercut is mined and
caving phenomenon is initiated. The subsequent fragmentation occurring as

25
the blocks move down through the draw column to the drawpoints is known as
secondary fragmentation (Brown, 2004). The nature and degree of secondary
fragmentation is expected to vary with the stress regime within the caved
mass, the composition and mechanical properties of the ore body, the rate of
draw, the height through which the material is drawn and the residence time in
the draw column.
Many attempts have been made to model secondary fragmentation in block
caving (Chitombo, 2010). One of the most widely used methods of assessing
in-situ, primary and secondary fragmentations in block caving operation is
Block Cave Fragmentation (BCF, Esterhuizen, 1999). BCF was specifically
developed to generate rock size distribution using, as input data, the cave face
orientation (dip and dip direction), stress data, MRMR, joint set orientations
and joint set spacing. Using actual data from Premier and Codelco caves in
Chile, Ngidi and Pretorius concluded that BCF predictions are generally
conservative (Ngidi and Pretorius, 2011). Laubscher (2001) established a
practical graph, which shows how the decrease in particle size is influenced by
different draw heights (or travel of fragmented rock) and coarse (less jointed)
to fine (well jointed) rock mass. The influence of fragments’ travel has been
observed in ore passes, where the size of the rock representing the 50% of
mass after passing through 257 m rise has a reduction of 78% (Verden and
Henderson, 2004). The same results were obtained at the Brunswick and Kidd
Creek mines at which the maximum particle size was reduced by around 50%
per 300 m vertical distance of fragments’ travel (Yu TR, 1989).
Empirical models lack of a theoretical background to explain the influence of
compression (load) and shear (flow) in the fragmentation process of block
caving. There is evidence that compression and shear have influence on
fragmentation (Pierce, Waetherley and Kojovic, 2010). Flow models such as
Rebop have included the empirical breakage model of Bridgwater to estimate
the shearing-induced secondary fragmentation within a caving context (Pierce,
2004). Some authors have used methods that describe breakage mechanisms
based on comminution process to describe the secondary fragmentation
process (Merino, 1986; Hustrulid, 2000). The Matrix Model is a method that
could be used to study the process of comminution (Broadbent and
Callcot,1956; National Materials Advisory Broad, 1981; Lynch 1997). This
method has been successfully applied to comminution in grinding machines,
however, because of its generality and simplicity, it is suitable for the study of
any breakage process including secondary fragmentation in caving. The Kinetic
Model is, in concept, very similar to the Matrix Model except for the selection
function being replaced by the rate of breakage (Lynch, 1997). The rate of
breakage can vary with fragment size and the time the fragments stay inside

26
the draw column. Despite being postulated to caving environments there is not
experimental evidence of the efficiency of the Kinetic Breakage Model based on
experimental data.
Given the difficulties to estimate and measure shear and compression within
the ore column, in this paper, the authors investigated the efficiency of Kinetic
Breakage Model to model secondary fragmentation. For this purpose gravity
flow experiments under compression where conducted and based on two
particle size distributions of crushed ore material and compared to the
predictions of a proposed mathematical model.
2. Principals of Matrix Model
The Matrix Model can be used to analyze the breakage of heterogeneous
particles for any process that results in changes to the distribution of a
characteristic in an assembly (Broadbent and Callcot, 1956). To use this
method for predicting the secondary fragmentation in caving operations, the
draw column is represented as a comminution machine. This model was
developed to describe the breakage mechanism for solids. Breakage event
consisted of a single step in the degradation process (Epstein, 1948). If the
breakage process is considered as a succession of discrete events, two basic
functions can be used to determine the progress of a breakage process:
Selection function, which determines the proportion of particles that
undergo breakage while the remaining fragments are left unbroken;
Breakage function, which provides the probability of the mill output
containing a broken particle of size y, P(y). The probability that particle of
size y is broken to size x in the nth step of the breakage process is
defined by function F(x,y).
Any comminution device grinds a set of particles having a specific size
distribution with the larger particles having a greater probability of being
broken than the smaller particles. Thus, smaller particles require more events
of breakage. The breakage behavior of particles in a comminution device
depends on their size, shape and homogeneity and on other variables, which
are related to the equipment (National Materials Advisory Broad, 1981). If the
feed of the breakage machine is represented by a cumulative continuous
distribution function, F(y), and this function is differentiable, the frequency
function, f(y), can be calculated as:
𝑓(𝑦) = 𝑑𝐹(𝑦)
𝑑𝑦 (1)

27
In which f(y) is the proportion of particles of size y. If the material undergoes a
breakage process, represented functionally by b(x,y), the output frequency
function f(x), for each size y, can be obtained by (Merino 1986):
𝑃1(𝑥) = ∫𝑏(𝑥, 𝑦)𝑑𝐹𝑦 = ∫ 𝑏(𝑥, 𝑦)𝑓(𝑦)𝑑𝑦 (2)
In Equation 2, b(x,y) is defined as the breakage matrix, with elements bij,
where i, j = 1,…,n; correspond to the proportion of a typical particle with size
between aj-1 and aj before breakage, which falls between a size class ai-1 and ai
after breakage.
There is no recirculation of fragments in caving operation. Therefore, if a
proportion Si is selected for breakage from fi, the mass of fragments selected
for breakage in size range i is represented by Sifi and (1-Si)fi represents the
fragment that remains unbroken. Si is defined as the selection function (Reid,
1965).
2.1 Modelling of secondary fragmentation The secondary fragmentation model presented in this paper is able to predict
the particle size distribution based on the ore characteristics and operating
conditions. The model structure has its basis within a population mass balance
model, which has been widely accepted and is in common usage for many
comminution systems (King, 2001) including systems using the pressure as
the main fragmentation mechanism (Torres and Casali, 2009).
The linear size-discretised model for breakage kinetics, in its general form
(King, 2001), is as follows,
𝑝𝑖 = ∫ 𝑓𝑖(𝑡) 𝐸(𝑡) 𝑑𝑡∞
0 (3)
Where:
pi is the ore mass fraction in the ith size interval, at the draw point.
E(t) is the residence time distribution in the fragmentation environment.
fi(t) is the ore mass fraction in the i th size interval of the material being
fragmented at time t. It is known as the batch grinding kinetic equation (King,
2001), expressed as follow,
𝑑[𝐻 𝑓𝑖(𝑡)]
𝑑𝑡= − 𝑆𝑖 𝐻 𝑓𝑖(𝑡) + ∑ 𝑏𝑖𝑗𝑆𝑗𝐻𝑓𝑗(𝑡)
𝑖−1𝑗=1 (4)

28
Where:
H (holdup) is the total mass of material being fragmented.
Si is the selection function and denotes the fractional rate at which material is
broken out of the ith size interval.
bij is the breakage function and represents the fraction of the primary breakage
product of material in the jth size interval which appears in the ith size interval.
Considering that during the experiments pressure is applied to the material
confined in a steel cylinder, a plug flow has been assumed, neglecting any
vertical mixing in the system. For this case, the E(t) term has a value of 1 for a
fixed residence time τ and 0 for all other times. Then, Eq. 3 can be re-written
as follows,
𝑝𝑖 = 𝑓𝑖(𝜏) (5)
To find pi, the solution of the batch grinding kinetic equation (Eq. 2) is needed.
Considering H large enough to be assumed constant, Eq. 4 has been solved
analytically (Reid, 1965). The system solution for the N size classes and t = τ
is written as follows,
𝑝𝑖 = ∑𝐴𝑖𝑗𝑒−𝑆𝑗 𝜏
𝑖
𝑗=1
(6)
Where:
𝐴𝑖𝑗 =
{
0 𝑖𝑓 𝑖 < 𝑗
𝑓𝑖0 −∑𝐴𝑖𝑘
𝑖−1
𝑘=1
𝑖𝑓 𝑖 = 𝑗
∑𝑏𝑖𝑘𝑆𝑘𝑆𝑖−𝑆𝑗
𝐴𝑘𝑗
𝑖−1
𝑘=𝑗
𝑖𝑓 𝑖 > 𝑗
fi0 is the initial particle size distribution.
For the breakage functions, bij, the functional expression (Austin and Luckie
1972) presented in Eq. 7 was used,
𝐵𝑖1 = 𝛼1 (𝑥𝑖
𝑥2)𝛼2+ (1 − 𝛼1) (
𝑥𝑖
𝑥2)𝛼3
(7)
29
Where:
α1, α2 and α3 are model parameters (α3 > α2) representing the shape of the
fragment size distribution and need to be adjusted with the experimental data.
Bi1 is the cumulative form of the bij functions.
xi is a mesh size for a given size interval.
For the selection function, Si, the functional expression (Herbst and
Fuerstenau, 1980) presented in Eq. 8 was used,
𝑆𝑖𝐸 = 𝑆1
𝐸𝑒𝑥𝑝 {𝑍1𝑙𝑛 (𝑑𝑖
𝑑1) + 𝑍2 [𝑙𝑛 (
𝑑𝑖
𝑑1)]2} (8)
Where:
Z1, Z2 and 𝑆1𝐸 are the model parameters. 𝑆1
𝐸 considered invariant for each size,
and representing the specific rate of breakage for particles of the maximum
size fraction in the sample and Z1 and Z2 representing the shape of the
variation of the specific rate of breakage with particle size. These parameters
need to be adjusted with the experimental data.
di is the geometric mean of the ith size class, 𝑑𝑖 = √𝑥𝑖 ∙ 𝑥𝑖+1
To obtain the selection function, Si, a scale-up relationship (Herbst and
Fuerstenau, 1980) among the specific rate of breakage and the quotient
between Power, P and Holdup, H, was used, as it is shown in Eq. 9.
𝑆𝑖 = 𝑆𝑖𝐸 (
𝑃
𝐻) (9)
As was mentioned above, in the case of block caving H was assumed constant
and could be demonstrated that the relation of Power/H could be equated to
Pressure/constant. Therefore, as 𝑆𝑖𝐸 is invariant for each size, the scale-up
relationship (Eq. 9) can be transformed to Eq. 10 as follows,
𝑆𝑖 = 𝑆𝑖𝐸(𝜎𝑉) (10)
Where σV is the vertical load in MPa.
In summary, the secondary fragmentation model in block/panel caving mines
consists of Eqs. 6, 7, 8 and 9. This model considers 7 parameters α1, α2, α3, τ,
Z1, Z2 and 𝑆1𝐸. All of these parameters can be directly determined by
experiment.

30
3. Laboratory equipment, material and experimental conditions
Confined flow experiments were conducted in order to study the secondary
fragmentation. Experimental set up has been presented in (Castro, Fuenzalida
and Lund, 2014). Equipment was selected that could deal with 60-70 kg of
crushed ore per test. To avoid the concentration of stresses at corners, a
cylindrical shape was selected for the model. A 1,800 KN hydraulic press can
apply high pressure to material confined in the cylinder (Figure 1). A steel
cylinder with a 340 mm inner diameter was selected to apply maximum
pressure of 14 MPa (Figure 1). The height of the cylinder was 700 mm to hold
the desired volume of ore and to suit the stroke length of the hydraulic press.
In the base of the cylinder there is a drawbell (1:75 scale) located in the
center of the model to ensure that the flow zones would not intersect the
model’s walls. The outlet with a rectangular opening of 53mm x 96mm was set
to allow the broken material to flow. The extraction system represents a Load
Haul Dump (LHD) of 14 yd3.
Figure 1: Cylindrical model in a press machine to apply different vertical loads, σV.
The material used in the experimental tests was crushed ore with a sphericity
of 0.58 and a roundness of 0.25, both values was measured on 30 random
samples. Two different particle size distributions of sulfide ore were prepared
and tested. The basic sample with a wide distribution with the d80 of 15.6 mm
(shown in Figure 2) was scaled from the size distribution predicted for
Chuquicamata Underground Project, Chile (Codelco VP, 2009). The other
initial size distribution (also shown in Figure 2), were constructed with the
characteristic sizes (d80) of 11.8 mm. Both samples have a coefficient of
uniformity of 2 (d60/d10), density of 2.63 t/m3, point load index of 6.2 MPa and
friction angle of 39°.

31
Figure 2: Particle size distributions of samples: (a) d80=15.6 mm, (b) d80=11.8 mm.
The experimental conditions under which the experiment were conducted are
listed in Table 1. Vertical loads were chosen regarding different heights of the
broken column to represent what is expected in caving operations. Janssen
formula (Nedderman, 1992) was applied to calculate vertical loads. Moreover,
experiments carried out under 0, 1.5, and 3 MPa were duplicated and tested
for wet condition. In the case of wet condition 1.6% of water content was
applied, this percentage is enough to saturate the fragments surface (4.3%
degree of saturation).
Table 1: Summary of the experimental conditions
Test Vertical load
σV, MPa
Initial size distribution
Sample d80, mm d50, mm
1
2
3
4
5
0
0.8
1.5
3
5
a 15.6 10.8
6
7
8
9
10
0
0.8
1.5
3
5
b 11.8 8.6
4. Results
4.1 Reproducibility evaluation
Since the physical model of confinement flow implemented for the first time to
study secondary fragmentation, it is necessary to test reproducibility of the
results. Thus, the results of each duplicated test were compared to investigate
the differences between the results of a specific test in completely similar
condition. Figure 3 shows the results of tests 3 and 8 (Table 1) and their

32
duplicate tests (3’ and 8’). The size distributions of both tests are similar to
their replicate tests. Therefore, the reproducibility of both is quite acceptable.
The same results were obtained from the other tests.
Figure 3: Experimental tests reproducibility. Tests (3-3’) Sample “a” d80=15.6 mm,
σV= 1.5 MPa; Tests (8-8’) Sample "b” d80=11.6 mm, σV= 1.5 MPa.
4.2 Extraction effect
In block caving mining, the abrasion due to the ore extraction is a key
parameter that influence on secondary fragmentation (Laubscher, 2001), then,
must be consider for experimental studies. In this investigation, the
experiments were conducted under draw conditions keeping vertical load
constant, where almost the 10 percent of the total mass was extracted. Tests
in draw are undrawn conditions were carried out at 3 MPa of vertical load to
demonstrated if the ore extraction influences on fragmentation. Figure 4 shown
results of both test conditions, fragmentation of characteristics sizes increased
around 10 on tests (related to undrawn condition).
Figure 4: Fragmentation due to draw, 3 MPa of vertical load conditions.
4.3 Fragmentation results
During the experiments the influence of vertical loads, water content, initial
size distribution and extraction on secondary fragmentation was analysed.

33
Figures 4 and 5 illustrate that size distribution always decreased by increasing
the vertical load; even though, the applied load is significantly lower than the
fragment strength. Increasing the compression and abrasion by vertical load, is
the main mechanism of breaking fragments during the experiment.
Comparing Figures 4 and 5 shows that coarser material show higher
percentage of fragmentation. This is due to the fact that coarser material has
higher probability to push over each other. Moreover, the abrasion of coarse
fragments is more because of the more surface area.
Figure 5: Fragmentation results for sample “a” (d80=15.6 mm).
Figure 6: Fragmentation results for sample “b” (d80=11.8 mm).
The secondary fragmentation results in wet condition reveal that fragmentation
occurs only in the fine section of size distribution curve. Figure 6 shows the
results obtained on dry and wet conditions for samples “a” and “b”. The
humidity avoided comminution of coarser fragments on both samples. This
phenomenon is due to lubricating of fragments’ surfaces, which decrease the
friction between particles. In addition, comminution by compression also
decreases regarding to greasing the surface of fragments. Therefore, the main
fragmentation mechanisms, compression and abrasiveness, are decreased in
wet condition and inhibit the coarser fragmentation effect.

34
Figure 7: Secondary fragmentation of dry and wet material: Sample “a” (d80 = 15.8
mm) and Sample “b” (d80 = 11.6 mm).
4.4 Modelling
In order to define the appropriate model of secondary fragmentation
prediction, the constant values of brakeage and selection functions (Eq. 7 and
8) were adjusted based on experimental results. The adjustment was
performed using the minimum square error and the fitting parameter results
are presented in Table 2 (for all tests) and graphically for 4 tests in Figures 7
and 8. When applying adjusted parameters in breakage function, the second
part of the equation approached to zero. Therefore, only the first part of the
breakage function (Eq. 7) was considered in this research with α1 and α2 as:
𝐵𝑖1 = 𝛼1 (𝑥𝑖
𝑥2)𝛼2
(11)
Table 2: Adjusted parameters of the comminution model
S1E Z1 Z2 α1 α2 τ
0.53 0.01 -1.03 0.95 3.72 0.52
Figures 7 and 8 display the comparison of the predicted model and
experimental results. It is obvious that the developed model capable to predict
secondary fragmentation for different ranges of vertical loads in both initial
sizes distribution.

35
Figure 8: Experimental and modelled values for Initial particle size distribution: d80 =
15.6 mm. Vertical load (σV) = 1.5 and 5 MPa.
Figure 9: Experimental and modelled values for initial particle size distribution: d80 =
11.8 mm. Vertical load (σV) = 1.5 and 5 MPa.
The Goodness of Fit of the model was evaluated using the correlation
coefficient, R2, as well as the Mean Squares Error,
𝑀𝑆𝐸 = 1
𝑁∑ (𝑦𝑖,𝑒𝑥𝑝 − 𝑦𝑖,𝑚𝑜𝑑)
2𝑁𝑖=1 (12)
Where:
yi,exp and yi,mod are the cumulative size fractions for size i, measured and
modelled, respectively.
The fitness values illustrated in Table 3 show that the comminution model
could be effectively applied to represent the secondary fragmentation under
confined flow.

36
Table 3: Model Goodness of Fit
Test Sample Vertical load
MPa
Correlation
coefficient
R2, %
MSE
%2
1
2
3
4
a
0.8
1.5
3
5
99.70
99.64
99.90
99.91
13.66
15.16
3.44
9.95
5
6
7
8
b
0.8
1.5
3
5
99.89
99.88
99.97
99.92
6.30
4.86
4.09
3.19
5. Mine application
5.1 Model calibration based on BCF
Since the comminution model developed based on experimental data, it is
required to be evaluated considering mine-scale information. Therefore,
secondary fragmentation module of BCF software was used to scale the
presented comminution model. As representing the finer fragmentation is more
difficult in BCF, in this paper only considered Sample “a” to scale up the model.
Thus, the size distribution of Sample “a” was scaled up based on similitude
analysis (Castro, Orellana and Pineda, 2012) with the geometric factor (1:75).
Sample “a” was also simulated in BCF (Figure 9).
Figure 10: Primary curve made in BCF and Sample “a”, mine scale.
BCF software used geometric and draw parameters to predict secondary
fragmentation, while the developed model consider vertical loads and rock
characteristics besides geometric and draw parameters. In order to consider
vertical load in BCF, the draw zone geometry used in the software was
correlated with vertical load through Janssen approach (Nedderman, 1992).
According to the scaled up geometrical parameters of physical model, the

37
vertical load of 0.8 MPa was obtained by Janssen equation in mine scale.
Hence, the secondary fragmentation result obtained by BCF was compared
with the scaled up size distribution obtain through the experiment of Test 2
(Sample “a”, σV = 0.8 MPa). Figure 10 shows that predicted fragmentation of
the model and BCF results are different in coarse fragments. In general, BCF
tends to predict fragmentation finer than reality. This deference is related to
the scaled factor. In order to eliminate the difference between two curves, the
constant parameters of the developed model were also scaled up (Table 4).
The calibrated model is also presented in Figure 10.
Figure 11: Comminution model curves on mine scale.
As it was mentioned, the comminution model included breakage and selection
function. The breakage function presents how the size distribution function
changes after breakage. This function is invariant to the scale for the same
material and mechanisms of fragmentation. However, selection function is
scaled dependent. Therefore, the constant parameters of selection function as
well as residence time ratio (τ) were considered to adjust the secondary
fragmentation curve obtained by BCF (Table 4).
Even though, there are uncertainties in secondary fragmentation prediction by
BCF, this software was the most common tool to validate the developed model.
It should be mentioned that the comminution model enables to calibrate easily
regarding to the variables mentioned in table 4. It is suggested that this model
calibrated based on the mean fragmentation obtained applying image analyses
of the muck piles in drawpoints.

38
Table 4: Selection function parameter on mine scale
Parameter Experimental
value
Calibrated
value
S1E 0.53 39.74
Z1 0.01 0.01
Z2 -1.03 -21.67
τ 0.52 4.52
5.2 Comminution model based on field data
While BCF is the most widely used model for predicting fragmentation, in this
research BCF outcomes were considered to scale up the constant of
comminution model; although, the accuracy of BCF software is being
discussed. Thence, the fragmentation of three sector of El Teniente mine
(Esmeralda, Reno-Fw and Reno-Hw) were considered to evaluate the
developed model.
Figures 11 illustrates the mean fragmentation of Esmeralda sector which
measured during two recent years (2013 and 2014).The size distribution curve
of 2013 representing the fragmentation of 0 and 20 m extraction column . This
distribution was considered as input and comminution model was used to
predict mean fragmentation of next years. The result of predicted size
distribution curves reveals that the Comminution Model (CM) without scaling
up the constant parameters always predicted the secondary fragmentation
while the calibrated model has imprecise representation of fragmentation.
Figure 12: Fragmentation curves of Esmeralda, El Teniente mine (Codelco, 2015), and
the comminution model. CM (exp): constant calibrated through test; CM (BCF): constant calibrated through BCF.
The adequate prediction of the main comminution model reveals that the
constant parameters obtained in laboratory experiment are competent to
predict fragmentation and it is not necessary to scale them up. Moreover, it is
not necessary to use the exact material to define the constant parameters,
only material with the same strength could be sufficient.

39
5.3 Height consideration
In order to evaluate the comminution model in various heights (for different
extraction period), the caved column was divided into several horizontal zones
and the comminution model was applied to each zone. Figure 12 shows a
scheme of an ore column divided into different areas or zones (Ai, i= 1, 2, 3…
n) as a function of height.
For each area, the comminution model changes based on vertical load σv and
the constant parameter of τ. Vertical load of each zone was calculated
regarding to its height and obtained based on rock properties and the
geometry of the caved column (Janssen approach). While τ is related to the
residence time that fragment are in the draw column. In practical, the
residence time is not conceivable in caving operation; as a result, this
parameter was calibrated with mine data as a function of the height of the
draw column.
Figure 13: Schematic view of fragmentation in various heights of draw column.
In order to evaluate the comminution model in various heights, this model was
performed to estimate the secondary fragmentation of each column heights of
Reno, El Teniente (Hurtado and Pereira, 2009). Figure 13 illustrates the size
distribution of two heights of draw column for two sectors of Reno (Footwall
(Fw) and Hanging wall (Hw)). The comminution model was also applied for
different values of σV and τ, based on the mine situation. Figure 13 indicates
that the comminution model enables to estimate secondary fragmentation in
both heights. The validation of model for the draw heights more than 400
meters was not achievable due to the lack of mine data in high draw columns.

40
Figure 14: Fragmentation back-analysis from Reno (Hurtado and Pereira, 2009) and
comminution model (CM) estimations.
Despite vertical load, calculation of residence time ratio (τ) is somehow
ambiguous. Secondary fragmentation occurs while material flow through draw
column. In high caved columns, long travel distance, results more residence
time and hence finer fragments will be obtained during the extraction. Even
though measuring the residence time of material is not possible, this
parameter could be presented by geometrical properties. In this research,
mine data was utilized to develop an empirical relationship between τ and
distance of ore transportation as follow:
𝜏 = 0.52 ∙ (355.57 ∙𝑑ℎ
𝐴𝑑+ 0.51) (13)
Where:
dh: is the height of the draw column where the secondary fragmentation want
to be predicted [m],
Ad: is the area under draw [m2].
Equation 13 models the behaviour between the height of the draw column and
the area under draw of this column, for higher columns the material inside the
column travelled large distance, then, the parameter 𝜏 increase to represented
more time in the breakage process. Mine data used to calibrate 𝜏 show an
inverse correlation between this parameter and the area under draw.
Finally, secondary fragmentation can be estimated for various heights applying
the comminution model. The parameter τ can be approached with Eq. 13, a
simplification form of parameter τ of 0.52 (obtained from experimental result)
can be use getting an acceptable fitting.

41
6. Conclusions
Despite the high influence of secondary fragmentation on block caving mine
design, equipment selection and production planning, few studies have been
conducted to predict the final size distribution. This paper used the concept of
the comminution process to predict rock fragmentation in draw columns of
block caving mines with vertical loads (through σV). Therefore, several
experiments were undertaken using a confined flow test with various vertical
loads and size distributions to calibrate the comminution model. Comparison of
the size distribution before and after each test provides the percentage of
breakage during the test. The comminution model was modified to consider
vertical load in fragmentation prediction and then experimental results were
applied to determine the coefficients of the model.
The height of caved column was also considered in this model. The result of
the comparison of model outcomes with mine data shows that this model
enables to estimate secondary fragmentation in different heights. The
methodology presented in this paper was developed of comminution analysis
for secondary fragmentation estimation and evaluate the fragmentation.
However, there are limitations regarding to the representativeness of caving
operations and a limited number of conditions such as rock type. This would
require more experiments and full scale tests which would give more insight
into the meaning and range of fitted parameters for secondary fragmentation
prediction.
References
Austin, L and Luckie, P T, 1972. Estimation of non-normalized breakage
distribution parameters from batch grinding, Powder Technology, 5(5):267-
271.
Broadbent, S R and Callcot, T G, 1956. A Matrix analysis of processes involving
particle assemblies, Philosophical Transactions of the Royal Society of London,
Mathematical and Physical Sciences, 249(960):99-123.
Brown, E T, 2004. Block Caving Geomechanics (2nd ed.), pp 184-227.
Castro, R, Fuenzalida, M A, Lund, F, 2014. Experimental study of gravity flow
under confined conditions, International Journal of Rock Mechanics and Mining
Science, 67: 164-169.

42
Castro, R, Orellana, L and Pineda, M, 2012. Physical modelling as and
engineering tool for mining: Theory and Practice, in Proceeding of the 6th
International Conference & Exhibition on Mass Mining 2012.
Codelco Vicepresidencia corporativa de proyectos, 2009. Prefeasibility study of
Chuquicamata underground mine project, in Main Decisions, MSC-ICO-
SKMMIN-0000-GEN-INF-100. (In spanish)
Codelco, 2015. Fragmentation back-analysis of Esmeralda, internal Report.
Chitombo, G P, 2010. Cave Mining – 16 Years After Laubscher’s 1994 Paper
“Cave mining – State of the Art”, in Proceedings of the 2nd International
Symposium on Block and Sublevel Caving (ed: Y Potvin), pp 45-61 (Perth,
Australia).
Epstein, B, 1948. Logarithmico-normal distribution in breakage of solids, in
Industrial & Engineering Chemistry, 40(12):2289-2291.
Esterhuizen, G S, 1999. A Program to Predict Block Cave Fragmentation,
Technical Reference and User´s Guide Version 3.0.
Herbst, J A and Fuerstenau, D W, 1980. Scale-up procedure for continuous
grinding mill design using population balance models, in International Journal
of Mineral Processing, 7(1):1-31.
Hustrulid, W, 2000. Methods selection for large scale underground mining, in
Proceeding of the 3rd International Conference & Exhibition on Mass Mining
2000, pp 29-56 (The Australasian Institute of Mining and Metallurgy).
King, R P, 2001. Modelling and simulation of mineral processing systems (1st
ed.).
Laubscher, D H, 2001. Cave Mining – The State of the Art, in Underground
Mining Methods (ed: W Hustrulid and R Bullock), pp 455-463.
Lynch, A J, 1997. Mineral crushing and grinding circuits, their simulation,
optimization, design and control, in Elsevier Scientific Publishing Company.
Merino, L, 1986. Predicting the Size Distribution of Ore Fragments in Block
Caving Mines, Master thesis, Imperial College, England.
Montecino, N, 2011. Modelling of the secondary fragmentation in Block/Panel
caving, Master thesis. University of Chile, Chile. (in Spanish)
National Materials Advisory Broad, 1981. Comminution and energy
consumption, U.S. Dept. of Energy, U.S. Bureau of mines, National Science
Foundations, Report No 364.
Nedderman, R M, 1992. The Method of differential slices, Statics and
Kinematics of Granular Material, pp 84-126.

43
Ngidi, S N and Pretorius, D D, 2011. Impact of poor fragmentation on cave
management, in 6th Southern African Base Metals Conference, pp 111-121
(The Southern African Institute of Mining and Metallurgy).
Pierce, M E, Waetherley, D K and Kojovic, T A, 2010. Ahybrid methodology for
secondary fragmentation prediction in cave mines, in Proceedings of the 2nd
International Symposium on Block and Sublevel Caving (ed: Y Potvin), pp 567-
582 (Perth, Australia).
Pierce, M E, 2007. Six Monthly Technical Report, Gravity flow mechanics and
SLC blasting and flow, Sub-Project No. 1.2 and 3.2.3: REBOP Development and
Disturbed Flow Modelling, Itasca Consulting Group Inc., Report to Mass Mining
Technology Project, 2004-2007, ICGO6-2292-13-Task 1 and 9.
Reid, K J, 1965. A solution to the batch grinding equation, Chemical
Engineering Science, 20(11):953-963.
Torres, M and Casali, A, 2009. A novel approach for the modelling of high-
pressure grinding rolls. Minerals Engineering, 22(13):1137-1146.
Verden, R and Henderson, A H, 2004. Backfill at Sons of Gwalia mine, in Pro.
Conf. Ground support (ed: Villaescusa and Y Potvin), pp 613-618 (Perth).
Yu, T R, 1989. Some factors relating to the stability of consolidated rockfill at
Kidd Creek, in Proceedings of the 4th International Symposium on Mining with
Backfill, Montréal, Que, pp 2-5.
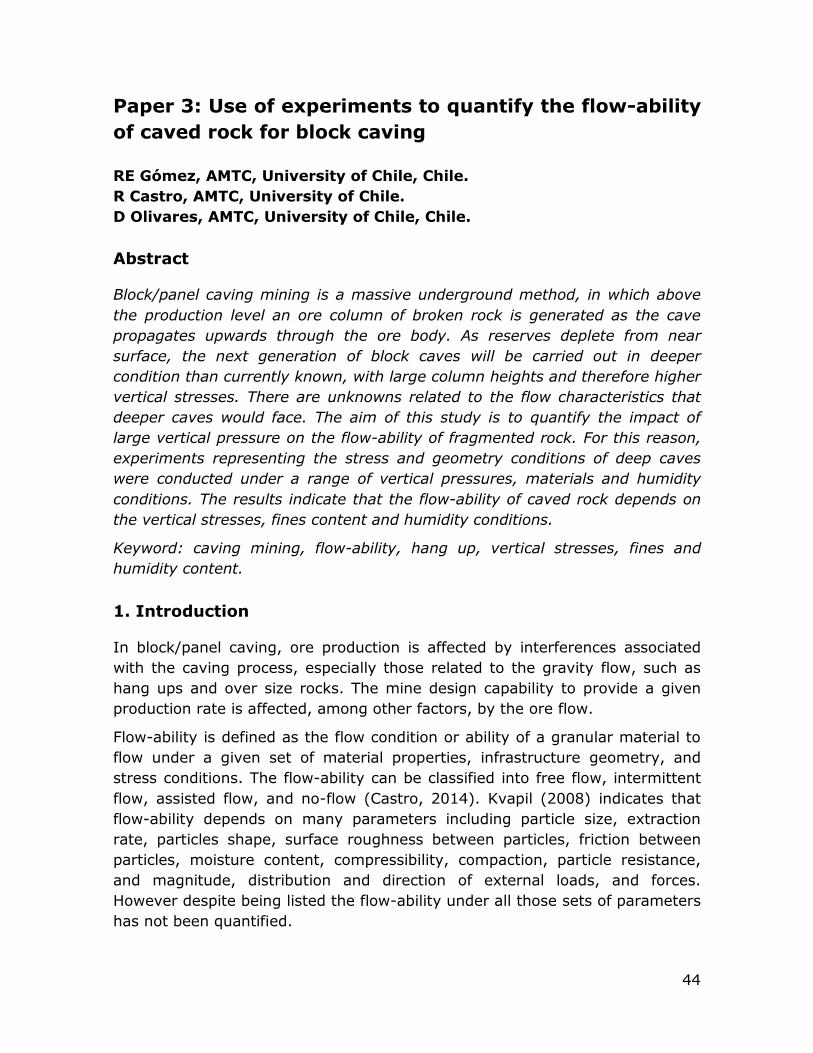
44
Paper 3: Use of experiments to quantify the flow-ability
of caved rock for block caving
RE Gómez, AMTC, University of Chile, Chile.
R Castro, AMTC, University of Chile.
D Olivares, AMTC, University of Chile, Chile.
Abstract
Block/panel caving mining is a massive underground method, in which above
the production level an ore column of broken rock is generated as the cave
propagates upwards through the ore body. As reserves deplete from near
surface, the next generation of block caves will be carried out in deeper
condition than currently known, with large column heights and therefore higher
vertical stresses. There are unknowns related to the flow characteristics that
deeper caves would face. The aim of this study is to quantify the impact of
large vertical pressure on the flow-ability of fragmented rock. For this reason,
experiments representing the stress and geometry conditions of deep caves
were conducted under a range of vertical pressures, materials and humidity
conditions. The results indicate that the flow-ability of caved rock depends on
the vertical stresses, fines content and humidity conditions.
Keyword: caving mining, flow-ability, hang up, vertical stresses, fines and
humidity content.
1. Introduction
In block/panel caving, ore production is affected by interferences associated
with the caving process, especially those related to the gravity flow, such as
hang ups and over size rocks. The mine design capability to provide a given
production rate is affected, among other factors, by the ore flow.
Flow-ability is defined as the flow condition or ability of a granular material to
flow under a given set of material properties, infrastructure geometry, and
stress conditions. The flow-ability can be classified into free flow, intermittent
flow, assisted flow, and no-flow (Castro, 2014). Kvapil (2008) indicates that
flow-ability depends on many parameters including particle size, extraction
rate, particles shape, surface roughness between particles, friction between
particles, moisture content, compressibility, compaction, particle resistance,
and magnitude, distribution and direction of external loads, and forces.
However despite being listed the flow-ability under all those sets of parameters
has not been quantified.

45
Flow-ability could be characterised both qualitatively and quantitatively. In
terms of qualitative characterization, the flow could be qualified as free flow,
intermittent flow and no flow depending on the ratio between particle size and
opening (Laubscher, 2006). Studies on gravel have shown also that the flow-
ability of granular material is influenced also by the vertical load (Fuenzalida,
2012). Castro et. al (2014) have proposed a flow-ability chart for coarse and
dry rock which is presented in terms of vertical stress and drawpoint width/d50.
Figure 15: Influence of vertical stress in flow-ability.
In quantitative terms flow-ability can be characterised in terms of the number
of hang ups every 1000 tons or broken rock drawn. Hang ups are one of the
flow interferences that affect productivity. Moreover, hang ups can be used to
measure the flow-ability of material because when a hang up occurs it means
the flow of material has been interrupted and the broken rock cannot be
extracted (Troncoso, 2006). Two kinds of hang ups can be formed in coarse
material: cohesive and mechanical (Kvapil, 2008. Beus et. al, 2001.
Hadjigeorgiou & Lessard, 2007). The formation of arches on a rough wall is
generated by the rotation of the principal stresses on the wall and by induced
wall pressures (Handy, 1985). The dimensions of the arch depends on the
friction angle of the material, depth or vertical stress, inclination of the walls in
a drawpoint, draw rate, shape and strength of the particles, and humidity
(Kvapil, 2008). At the mine it has been observed that as more material is
extracted from a drawpoint the frequency of the hang ups decreases (Maass,
2013). This phenomenon is probably related to the decrease of the particle size
during the extraction of an ore column (Montecino, 2001).
There are many unknowns related to the flow of materials especially under
confined conditions. For example what is the role of the fines, water and
stresses on the flow-ability of the broken rock. In this article we present the
experiments conducted to evaluate the flow-ability of caved rock under high

46
vertical load for different fines and humidity conditions. Extraction is carried
out by a scaled LHD system to represent current caving characteristics.
2. Laboratory scaled model and material characterization
2.1 Experimental set up and materials
The experiments were conducted in a set up to study confined flow. This
consist of a steel cylinder which is filled with broken rock (70-80 kg of crushed
ore) under a hydraulic press machine with a capacity of 1,800 kN. The steel
cylinder has diameter of 340 mm, as shown in Figure 2. A cylindrical shape
was chosen to avoid the concentration of stresses at singularities. The height
of the designed cylinder is 700 mm in order to hold the desired volume of
gravel and to suit the emulated Andina mine drawbell with a scale of 1:75 (see
Figure 2-b), with a rectangular opening of 53 x 96 mm2. Since the drawbell is
located in the center of the cylinder, flow zones will not intersect the walls of
the model. A steel extraction system was built to replicate the extraction the
same as LHD does from an extraction point (see Figure 2-a).
Figure 16: Experimental equipment: (a) cylindrical model in a press machine which changes the vertical load, σV, and (b) extraction system, located in the bottom, center
of the model.
The material used in the experimental tests was crushed sulphide ore with a
high aspect ratio to represent the geometry of caved rock (sphericity of 0.58
and a roundness of 0.25). Two different particle size distributions of this
material were prepared and tested: one with a passing size d80 of 11.8 mm
and the other one with a d80 of 15.6 mm. Both samples have the same
uniformity coefficient (Cu=d60/d10) of 2. Those particle size distributions were

47
scaled from the size distribution of the primary fragmentation curve of the
underground´s Chuquicamata project (Figure 3). Table 1 summarizes the
characteristics of the samples.
Figure 17: Particle size distribution of samples used in the experiments
Table 1: Samples characteristics.
Media
Average
size d80
Uniformity
coefficient
Drawpoint
width*/d50
Point
load
index
Initial
humidity Density
d50
[mm] [mm] Cu
IS50 [%] (solid by
weight) [kg/m3]
9 mm 8.6 11.8 2.0 7.9 6.2 0.8 2,600
11 mm 10.8 15.6 2.0 6.3 *Drawpoint width for non-square geometry can be represented by hydraulic
diameter (Jennings & Parslow, 1988).
2.2 Experiments
A total of 18 experiments have been carried out to date described in Table 2.
Ten experiments were performed without fines or humidity in order to define a
base case considering different vertical loads. Then humidity and fines were
added to the samples to measure their impact on the flow-ability. Fine material
used in this study has a uniform distribution with d100 equals 1 mm. Humidity
used in this study is 1.5 liters per 10kg of fine material that is 15% of water.

48
Table 2: Summary of experimental conditions.
Test Material
Vertical
load σv
[MPa]
Humidity
[%] Fines [%]
Size d80
[mm]
1
A1
0 0 0 11.8
2 1.5 0 0 11.8
3 3 0 0 11.8
4 6 0 0 11.8
5 10 0 0 11.8
6
A2
0 0 0 15.6
7 1.5 0 0 15.6
8 3 0 0 15.6
9 6 0 0 15.6
10 10 0 0 15.6
11 B
0 0 20 15.6
12 6 0 20 15.6
13 C
0 0 40 15.6
14 6 0 40 15.6
15 D
0 15 20 15.6
16 6 15 20 15.6
17 E
0 15 40 15.6
18 6 15 40 15.6
3. Results
The experiments were performed twice for coarse ore and once for fine
material (the latter only for one particle size distribution). During the tests, the
flow-ability, the hang up frequency and the hang up height were recorded.
3.1 Flow-ability
Flow-ability is classified into free flow, intermittent flow, assisted flow, and no-
flow (Figure 1). In terms of flow-ability the results (Table 3) indicate that for
materials A1 and A2 flow-ability decreased from free flow to no flow when
vertical load increased from 0 to 10 MPa. When fines were added without
humidity, the flow condition was intermittent or assisted. When water was
added the flow was assisted flow and, when there were a 40% of fines, the
flow condition was no flow at all.

49
Table 3: Summary of experimental results.
Test Material Vertical load σv
[MPa] Flow condition
Interferences
[g/hang up]
Standard
dev. [g/hang
up]
1
A1
0 Free Flow 1246 640
2 1.5 Assisted Flow 928 371
3 3 Intermittent
flow 1068 256
4 6 Assisted Flow 368 246
5 10 No Flow 0 -
6
A2
0 Free Flow 1177 471
7 1.5 Intermittent
flow 1036 471
8 3 Intermittent
flow 761 356
9 6 Assisted Flow 599 276
10 10 No Flow 0 -
11 B
0 Intermittent
flow 1014 248
12 6 Assisted Flow 586 312
13 C
0 Assisted Flow 501 153
14 6 Assisted Flow 475 180
15 D
0 Assisted Flow 352 97
16 6 Assisted Flow 378 112
17 E
0 No flow 0 -
18 6 No flow 0 -
3.2 Hang up frequency
During the experiments it was possible to detect flow interruptions or hang ups
which were recorded in terms of mass and height. The hang up frequency (Hg)
is defined as the amount of material that can be drawn before an interruption
happens. The experimental results of Hg as a function of the vertical stress for
each laboratory test are presented in Figure 4.

50
Figure 18: Hang up result in laboratory test. A: coarse material test (duplicates
included), B: 20% of fine material, C: 40% of fine material and D: 20% of fine material
with humidity
The experimental results in coarse material (A) shows that increasing the
vertical stress decreases the flow-ability of material. For the media B, that is
the one with 20% of dried fines, the hang up frequency number decreased. For
materials C and D, the vertical load had no significant influence in the
frequency of hang ups as they were not able to flow.
Field measured hang ups are quantified by their hang ups index (number of
hang ups per 1000 ton of ore). The measured hang ups index in the
experiments is similar to the observed index of primary sulphides in mines.
The index varies from 1.6 to 3.6 in mines and, as can be seen in Table 4, the
scaled experimental index varies from 0.75 to 3.95.
Table 4: Scaled hang ups index
Vertical
load
[MPa]
Hang ups index [# hang up/ 1000 ton]
A1 A2
0 1.05 2.05
1.5 1.26 2.29
3 1.09 3.11
6 3.17 3.95
10 0.75 3.32
For the experiments with vertical load 10 MPa the material got strongly compacted over the drawbell generating a great hang up above the drawbell and almost no hang ups of lower height.

51
3.3 Height of hang ups
A classification was made according to the height of the hang up:
Low: in extraction point.
Medium: in drawbell (0-13.5m from the roof of the production level)
High: Above drawbell (over 13.5 m).
The geometry of the drawbell from which the dimensions were scaled is
represented in Figure 5.
Average hang up height of each experiment based on the vertical stress is
shown in Figure 6. It can be seen that as the vertical stress increases, the
height of the hang ups increases simultaneously. The dimensions of each
observed hang up were scaled in order to quantify their height in the mine.
Figure 6: Hang up heights in laboratory test. On coarse material A1: d80=15.6
[mm], A2: d80=11.8 [mm], B: 20% of fine material, C: 40% of fine material and D:
20% of fine material with humidity
Figure 19: Drawbell geometry in
real size.
52
In general, the height of the hang ups increases with the vertical pressure for
the coarse material (A1 and A2). In the case of the addition of fine (materials
B and C) the results indicate that vertical load has a small impact in the
increase of the height of the hang ups. When fines and water were added
(material D) there is no effect of the vertical load on the height of the hang
ups.
4. Conclusions and discussion
Based on experimental tests, this paper shows that particle size, as well as the
moisture content, and vertical stress have a noticeable impact on the flow-
ability of caved rock. The number and height of hang ups increases as the
vertical load increases. Fines and humidity increase the number of hang ups.
Also, high hang ups occurs when a vertical pressure was applied or when
humidity and fines were acting together.
The scaled model was successful in understanding how confinement, particle
size distribution, humidity and fines presence affect the flow-ability of material.
It is expected that as block caves get deeper the number of hang ups would
increase if fragmentation keeps constant. The results of the above experiments
shows that the hang up´s number for mine design applications could be
obtained from this kind of experiments. This would require further research
and analysis. It is expected that this kind of experiments would be in the
future standards to the caving industry, especially for future and unknown
conditions.
Acknowledgement
We want to thank Patricio Ávila and Alonso Vives for their help in these
experiments, the staff of Block Caving Laboratory for their support and
encouragement and Asieh Hekmat for her advices. This project was conducted
under the partial funding of the basal project for Basal Excellences, which is an
initiative of the Chilean government.
References
Beus, M, Pariseau, W, Stewart, B & Iverson, S 2001. Design of Ore Passes, in
Underground Mining Method, pp 627-634.
Castro, R, Fuenzalida, M & Lund, F 2014. Experimental study of gravity flow
under confined condition. International Journal of Rock Mechanics and Mining
Sciences, vol 67, pp. 164-169.
Fuenzalida, MA 2012 Study of the confined gravity flow and its application to
caving. Master's thesis. Santiago, Chile, Universidad de Chile. (in Spanish).

53
Jennings, BR & Parslow, K 1988. Particle size measurement: the equivalent
spherical diameter, in Proceedings of the Royal Society of London. A.
Mathematical and Physical Sciences, 419(1856), pp. 137-149.
Hadjigeorgiou, J & Lessard, JF 2007. Numerical investigations of ore pass
hang-up phenomena, in International Journal of Rock Mechanics and Mining
Sciences, 44(6), pp 820-834.
Handy, RL 1985. The arch in soil arching, in Journal of Geotechnical
Engineering, vol 111(3), pp 302-318.
Kvapil, DR 2008. Gravity flow in sublevel and panel caving – A common sense
approach.
Laubscher 2006, Cave Mining Handbook.
Maass, S 2013. Technological alternatives for hang ups removal. Master’s
thesis. Santiago, Chile, Universidad de Chile. (in Spanish).
Montecino, N 2011. Secondary fragmentation mix model in block/panel caving
mining. Master’s thesis. Santiago, Universidad de Chile. (in Spanish)
Troncoso, S 2006. Simulation of operational interferences impact on production
planning. Thesis. Santiago, Chile, Universidad de Chile. (in Spanish).

54
General Conclusion
The research presented in this thesis is an experimental study which main
objective is to understand the influence of key parameters such as stresses,
fragments size, ore extraction and humidity on hang up phenomena and
secondary fragmentation in caving mining. To achieve this purpose, a set up
was developed to represent the extraction in a drawbell of Block Caving mines.
This chapter summarizes the main findings regarding the hang up events and
fragmentation results obtained in the confined flow model as well as a
comparison of the model performance to real mine data from several Block
Caving mines.
1. Hang Up occurrence
The process of ore fragments flowing through drawpoints implies a discrete
sequence of events, each one having a probability to create interference such
as a coarse arch. Typically this probability depends on certain variables like the
ratio between drawpoint apex and fragment size, geometry of drawpoints,
stress condition, presence of fine material, moisture content, draw rate and
interaction between neighbor drawpoints.
Previous research using the confined flow model with a circular opening
indicate that the stress condition has an extraordinary effect on hang ups thus
implying that hang up studies should also consider stresses along with the
ratio between drawpoint apex and fragment size. Other studies in the field
have frequently missed or overlooked testing and simulating the mine
conditions, especially those related with the geometry of drawpoints and
extraction system, both considerations introduced in the present work. The
impact of these variables on the hang up frequency and the height of the hang
up were quantified on tests.
Hang up frequency was analyzed for different load, fragmentation, draw
strategy and humidity scenarios. A raise in vertical load increases the hang up
occurrences in drawpoints due to ore compaction creating stable arches of
fragments. Fragmentation also influences the hang up interferences, with
larger fragment size inducing more hang up events, associated with a
reduction of the ratio between drawpoint apex and fragment size. When
extraction occurs in both drawpoints of the drawbell a better flow conditions
took place, because the distance among the drawpoints let interaction and
helps destabilizing arches formed. An increase in ore moisture content also has

55
and impact on hang ups, increasing the quantity of hang up. This effect is
linked to the enhanced cohesion in wet ore.
On the other hand, the height of hang ups increases with higher vertical load,
due to the intensification of friction forces between ore fragments. The
opposite is true under wet conditions, the height of hang up decreases due to
lower frictional force between fragments.
Field data was used to back up experimental results. The scaled up hang up
frequency fell within the range of the mine site data. It is thus concluded that
experimental results could be used as a practical guide for the analysis and
prediction of hang-up events.
2. Secondary fragmentation
The comminution model was developed using the Kinetic Matrix Model
originating at mill comminution processes. In this study the model was
implemented to adjust the fragmentation observed in the experiments due to
the similitude between the breakage mechanisms. Additionally, the
mathematical model also incorporates the stress as parameter to estimate
fragmentation. The model was calibrated with experimental results and
compared with fragmentation of mine data.
Experimental results showed major fragmentation for higher vertical load,
although the high differences between the rocks strength of the ore tested
(~140 MPa) and vertical loads applied on test (0-5 MPa). Abrasion and
compression were the main breakage mechanisms during the experiments.
Moreover, these mechanisms were individually identified when tests with and
without draw were carried out. Secondary fragmentation is affected by ore
draw, thus, the extraction must be considered in experiments of secondary
fragmentation. These results allowed adjusting the comminution model
parameters for mine implementation.
Even though the comminution model can be used for any fragment size
(because it is an input of the model), the scale factor from experimental result
to mine was considered. In the first instance, Block Caving Fragmentation
(BCF) software was uded to adjust the comminution model´s parameters in
mine scale. Then two set of parameters was available: parameters calibrated
just with experimental results and parameters calibrated with BCF. However,
when the comminution model was compared with fragmentation from mine
data, parameters adjusted with experimental results showed grater fitness due
to the comminution model can be represented by any distribution curve shape,
while BCF only displaces the primary fragmentation curve.

56
3. Future work
3.1 Hang up events
Few experimental studies are found in the literature on the subject of hang ups
and even fewer representing the mine condition of caving operations in a
reliable manner. This work presents new findings that shed light on the
behaviour of hang up events but a number of open questions still remain
unsolved in this field, therefore it would be recommendable to continue with
this line of research.
The ore internal friction angle is known to be a relevant parameter in the hang
up analysis; hence, material with different friction angles should be tested to
determine its real influence. Cohesion is also an important characteristic of the
hang up process, experiments adding fines and humidity could contribute to
our understanding on hang ups.
Drawpoint geometry is another interesting parameter, it would be adequate to
design various experiments testing drawbells with different angles and shapes,
based on typical operational designs. Furthermore, not only drawpoint
interaction should be studied but also the interaction between drawbells in
search for a draw strategy based on the experimental results.
3.2 Fragmentation
To strengthen the application of the comminution model the following
recommendations should be considered in future research:
Ore fragmentation due to extraction should be quantified under experimental
and controlled conditions. Additionally, it would be interesting to measure the
ore fragmentation that occurs due to interaction between drawpoints and/or
drawbells.
Ore with different rock properties should be tested to improve the prediction
accuracy of the model and defining the parameters based ore properties. A
long term goal for this line of research is to be able to represent the
parameters of the model only based on rock properties as strength, friction
angle, shape factor, density.
Finally, coding the comminution model in a user friendly interface or software
would be highly recommended to facilitate mine application. It should be
programmed considering the equations presented in the “Experimental and

57
comminution model framework for secondary fragmentation quantification for
block caving” paper.


