EXPERIMENTAL AND NUMERICAL INVESTIGATIONS ON … · experimental and numerical investigations on...
16
Journal of Engineering Sciences, Assiut University, Vol. 37, No. 6, pp.1407-1422, November 2009. 1407 EXPERIMENTAL AND NUMERICAL INVESTIGATIONS ON THE MONOTONIC BEHAVIOUR OF STEEL CONCRETE COMPOSITE SLAB-TO-COLUMN CONNECTING SYSTEMS Ahmed S. Elamary Department of Structural Engineering, Al-Azhar University- Qena – Egypt (Received October 27, 2009 Accepted November 9, 2009). This paper presents a study devoted to the definition of technical solutions for improving the seismic performance of steel-concrete composite beam-to-column joints. In particular, this investigation is focused on the role of the concrete slab in how to increase the transferring capacity of the compressive forces between slab and partially encased composite columns. Based on the approach proposed by the Eurocode 8, the bearing capacity of the concrete slab in compression is globally schematized using strut & tie mechanisms. On the basis of this model, the numerical analyses and the experimental results were utilized to study the effect of different variables in the overall behaviour of joint. A parametric study was undertaken using the validated model performed using ANSYS finite element program. The parametric numerical analyses were executed to study the effect of relevant parameters (concrete class, reinforcing bar diameter and column steel profile) on the performance of both the resistant internal mechanisms of concrete slab and the slab-column connecting mechanism. Based on the obtained results, the friction and the cohesion factors existed in the design shear formula, proposed by AASHTO and EN1992- 1-1. From this study, it can be concluded that, the column inertia and concrete compressive strength are the main factors in joint behaviour. More and over, the cohesion factor can be taken as a percentage from concrete compressive strength to allow a practical tool to anticipate the ultimate strength of the slabs. 1 INTRODUCTION Steel Moment Resisting Frames (SMRF) represents an efficient solution for the realization of high ductile structures in earthquake-prone areas. Dissipation of high quantities of seismic energy can be guaranteed by the ductility of materials coupled with a suitable capacity design, able to localize plastic phenomena at beams ends instead of columns and to avoid at the same time brittle or instability phenomena. Unfortunately, design of SMRF is conditioned by code requirements of satisfying strict drift limits under low-intensity earthquakes. 2 EXPERIMENTAL AND NUMERICAL INVESTIGATIONS Drift limitation at damage limit state often requires over dimensioned cross-sections. Otherwise, steel-concrete composite moment resisting frames (CMRF) can represent
Transcript of EXPERIMENTAL AND NUMERICAL INVESTIGATIONS ON … · experimental and numerical investigations on...

Journal of Engineering Sciences, Assiut University, Vol. 37, No. 6, pp.1407-1422, November 2009.
1407
EXPERIMENTAL AND NUMERICAL INVESTIGATIONS ON THE MONOTONIC BEHAVIOUR OF STEEL CONCRETE
COMPOSITE SLAB-TO-COLUMN CONNECTING SYSTEMS
Ahmed S. Elamary Department of Structural Engineering, Al-Azhar University- Qena – Egypt
(Received October 27, 2009 Accepted November 9, 2009).
This paper presents a study devoted to the definition of technical solutions for improving the seismic performance of steel-concrete composite beam-to-column joints. In particular, this investigation is focused on the role of the concrete slab in how to increase the transferring capacity of the compressive forces between slab and partially encased composite columns. Based on the approach proposed by the Eurocode 8, the bearing capacity of the concrete slab in compression is globally schematized using strut & tie mechanisms. On the basis of this model, the numerical analyses and the experimental results were utilized to study the effect of different variables in the overall behaviour of joint. A parametric study was undertaken using the validated model performed using ANSYS finite element program. The parametric numerical analyses were executed to study the effect of relevant parameters (concrete class, reinforcing bar diameter and column steel profile) on the performance of both the resistant internal mechanisms of concrete slab and the slab-column connecting mechanism. Based on the obtained results, the friction and the cohesion factors existed in the design shear formula, proposed by AASHTO and EN1992-1-1. From this study, it can be concluded that, the column inertia and concrete compressive strength are the main factors in joint behaviour. More and over, the cohesion factor can be taken as a percentage from concrete compressive strength to allow a practical tool to anticipate the ultimate strength of the slabs.
1 INTRODUCTION Steel Moment Resisting Frames (SMRF) represents an efficient solution for the realization of high ductile structures in earthquake-prone areas. Dissipation of high quantities of seismic energy can be guaranteed by the ductility of materials coupled with a suitable capacity design, able to localize plastic phenomena at beams ends instead of columns and to avoid at the same time brittle or instability phenomena. Unfortunately, design of SMRF is conditioned by code requirements of satisfying strict drift limits under low-intensity earthquakes.
2 EXPERIMENTAL AND NUMERICAL INVESTIGATIONS Drift limitation at damage limit state often requires over dimensioned cross-sections. Otherwise, steel-concrete composite moment resisting frames (CMRF) can represent
Ahmed S. Elamary
1408
an attractive solution with respect to their bare steel counterpart. Composite elements (beams and columns) typically exhibit relatively higher lateral stiffness which permits to satisfy more easily code specified drift limits. Compared to traditional steel structures, efficient solutions for beam-to-column joints can also be obtained by using the concrete slab and its steel reinforcing bars to withstand bending moments due to gravity and lateral loads [1]. The contribution of concrete slab to flexural resistance also gives the possibility of using simple steel details, saving welding and operational costs and simplifying construction phases [2, 3]. Moreover, ductile structural behaviour can be guaranteed by suitable solutions of beam-to-column joints designed as partial strength and presenting high plastic rotation capacity. In particular, the recent studies demonstrated that one of the critical aspects in seismic design situation for such joints can be the brittle behaviour of concrete slab subjected to compressive force causing undesirable decreasing of resistance [10]. The portion of concrete slab in contact with a composite column, disposed in an interior joint, uses its bearing capacity for transferring both compressive force and tensile force coming from slab of composite beams subjected to sagging and hogging moments respectively. Consequently, increasing the bearing capacity of the slab means an improving in the global seismic performance of an interior beam-to-column joint.
Four reinforced concrete slab specimens able to reproduce different proposed solutions of slab-to-column mechanical connection systems were realized and subjected to monotonic loading tested at the Laboratory for Material and Structural Testing of the University of Pisa [13].
The analysis of experimental results obtained from the four slabs allowed building and calibrating accurate finite element (FE) models in order to execute nonlinear numerical analyses. In such a way the effects of relevant parameters (concrete class, reinforcing bar diameter and column steel profile) on the performance of connecting systems were analyzed to point out which parameter could enhance their efficiency. Based on the FE analyses results obtained, it was possible to, first-cut estimations of the ultimate concrete slab loading using the shear formula currently adopted by AASHTO and EN 1992-1-1 by taken the friction and the cohesion factors as a percentage from concrete compressive strength.
3 SLAB-TO-COLUMN SHEAR CONNECTION PROTOTYPES In the slab-to-column shear connection systems, herein analyzed, the resistance necessary for the development of the mechanism 2 was provided adopting three different technical solutions: A) by a system of additional stirrups connecting the concrete slab of the beam to the concrete encasement of the composite column realizing a “local” shear mechanism, figure 1-a; B) realizing the continuity between the slab and the column encasement by means of a concrete socket, figure 1-b; C) adopting both A) and B) systems at the same time, figure 1-c. The collaboration of the two mechanisms, 1 and 2, was also experimentally checked and analyzed by realizing and testing a slab specimen in which resistant mechanisms were activated as shown if Figure 2.

EXPERIMENTAL AND NUMERICAL INVESTIGATIONS……….
1409
Column - HEB 280 Column Concrete
Concrete Slab
2 Stirrups
(A)
(a)
Column - HEB 280
Column Concrete
Concrete Slab
Filling Socket
(B)
(b)
Column - HEB 280
2 stirrups
Column Concrete
Concrete Slab
Filling Socket
(C)
(c)
Figure 1. Experimental test on joint sub-structure: (a) steel stirrups, (b) concrete filling sockets; (c) steel stirrups and filling sockets.
To these purposes, four slab sub-structures with the same re-bars layout and the same geometry of the concrete slab shown in the figures 3-a÷f [20] were designed and built. In particular the slab width was 1400 mm, while the height was set equal to 750 mm to consider all the portion of concrete slab working in the transferring of compression to the column by mechanism 1 and mechanism 2.
main beam
Fcd
Fcd
F rd2
main beam
Fcd
Mechanism 2 Mechanism 1
strutsteel tie
strut
(1- 2)F rd2
2
2
(1- 2)F rd2
transverse rebars
2
( 2)F rd2longitudinal rebars
F rd1
wire meshsteel tie
( 1)F rd1
2
(1- 1)F rd1
2
( 1)F rd1( 2)F rd2
2longitudinal rebars
Figure 2. Analysed joint solution: Resistant slab mechanism adopted from Annex C of Eurocode 8 [10].
The slab thickness was equal to 100 mm for the three specimens (S2, S3 and
S4) realized for testing the different shear connections, Fig. 1-a, b, and c, and the corresponding resistance of the associated mechanism 2. For the specimen realized for

Ahmed S. Elamary
1410
testing the collaboration of the two mechanisms (S1) the thickness was 130 mm. The column stub was realized adopting by using steel profile, HEB280. Each of tested specimen was characterized by different shear connection and working conditions as resumed in Table 1.
Table 1. Tested specimens: resistant mechanisms, connecting types and boundary conditions
Test No.
Resistant
Mechanism Shear connection type Boundary condition
S1 1 + 2 A continuous support
S2 2 A frontal opening & two supports
S3 2 B frontal opening & two supports
S4 2 C frontal opening & two supports
The testing campaign was planned in order to investigate three main issue: the
interaction between the two resistant mechanisms, the effective working condition of the mechanism 2 and the efficiency of the three shear connections for improving mechanism 2 effectiveness. According to these purposes the tests plan was organized as follow: (1) testing of the specimen S1 in order to evaluate the interaction of the resistant mechanisms and investigate the working conditions of the mechanism 2 (strut inclination, carried load,…); (2) testing of the specimens S2, S3 and S4 adopting suitable supporting conditions, derived from the analysis if the S1 test, in order to develop the mechanism 2 alone and define its maximum resistance correlated to the different shear connections. The first specimen (test S1) was realized considering the activation of the two resistant mechanism, as in the tested joint sub-structure, and adopting a continuous support located at the base for all its length, as shown in the figure 3-a. Moreover the specimen was provided with the connecting system type A), considered easier to be realized in the field, see figure 3-b. The three specimens (tests S2, S3 and S4) were realized after having analyzed the results obtained from test S1. Some main changes were made in specimens S2, S3, and S4 respect to S1 configuration. An opening was created between the front column stub and the concrete slab, Fig. 3-c. The dimensions of the supporting zones and their location were derived from the interpretation of the experimental results coming from the S1 testing and from F.E.M. analyses indicating the inclination of compressed struts in mechanism 2.
The supports were only in correspondence of the external parts of its base as shown in the figure 3-d, in order to stress at the best the development of mechanism 2 to test the real capacity of mechanical connecting systems (A, B, and C, fig. 1). All tests were executed applying external monotonic load at the top of the column stub, as illustrated in figures 3-d and 3-e relative to the S2 test. The applied force was centred respect to the column stub so producing a uniform compression on the slab pushing against the column flange.
EXPERIMENTAL AND NUMERICAL INVESTIGATIONS……….
1411
280
135
370
750
370660370
1400
50
7070
7070
50
523
380
45°
Ø12
Continuous support
(a)
(b)
Frontal opening
Simply support
40
280
100
13537
075
0
370660370
280 840 2801400
50
7070
7070
50
523
380
45°
Ø12
(c)
F
F/2F/2
Mea
sure
d d
isp
lace
men
t
1
(d)
(e)
(f)
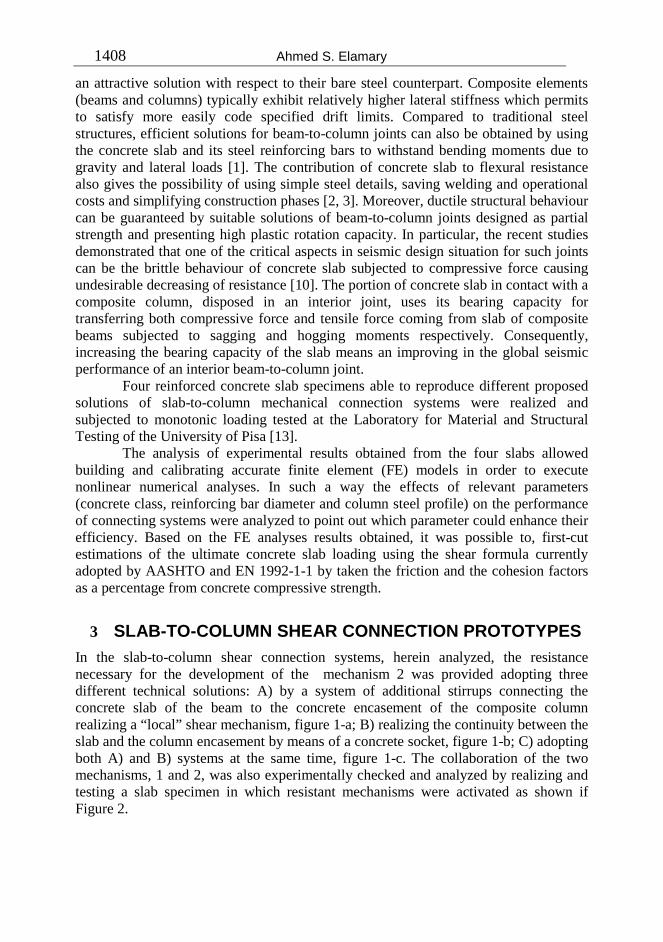
Figure 3. Experimental tests on slab specimens: (a) geometries and details of specimen, test S1; (b) shear stirrup connection and detail of reinforcement (re-bars and wire-
mesh), test S2; (c) geometries and details of specimen, Test S2; (d) scheme of Tests S2,
S3 and S4; (e) set-up of displacement transducers; (f) strain gauges disposed on transverse seismic re-bars.
The full resistance of the various slab mechanisms activated in each test were
determined. Due to the fact that the interaction between web column panel deformation and the concrete slab – fig. 1 b – is not considered, the test condition was not able to fully reproduce the situation of the concrete slab in the aforementioned tested beam-to-column joints. On the other hand, it should be mentioned that the advantage of the chosen testing scheme is not only the definition of resistance upper limit for the mechanisms 1 and 2, but also to allow a clear mechanical modelling and interpretation of these two mechanisms. In this way, results could be useful for rigid full-strength joints and for the described PS joint: in the former the compressive stresses are
δ1

Ahmed S. Elamary
1412
uniformly distributed through the slab thickness; in the latter the non-uniform stress pattern caused by shear panel deformation can be considered suitably reducing mechanism 1 and 2 resistance. In order to capture the deformation of strut and tie elements that constitute the resistant mechanisms of Eurocode 8, all the specimens were instrumented with displacement transducers, as shown in fig. 3-e. Moreover, strain gauges were placed on the reinforcing steel rebars forming the steel tie of mechanism 2 as shown in Fig. 3-f. The material properties and the diameters of the reinforcement used to realize the specimens are reported in the table 2.
3.1 Experimental results
The tests executed on the slab specimens were carried out till collapse; for the test S1 the collapse took place mainly in front of the column and successively in the shear connection between column and slab, Fig. 4-c. For tests S2, S3 and S4 the collapse took place at the shear interface, as shown in the figure 4-d: at first in the shear connection. The total resistance of the specimen S1 was equal to 1476 kN, while for tested specimens S2, S3, and S4 showed maximum resistances equal to 630 kN, 925 kN and 676 kN,respectively, as shown in figure 4-a. In this figure the plotted curves representing imposed force vs. δ1 displacement for the aforementioned tests. In spite of, the absolute values of resistance obtained for tests S2, S3 and S4 referred only to mechanism 2.
0
200
400
600
800
1000
1200
1400
1600
0.00 0.50 1.00 1.50 2.00 2.50 3.00
δ1 displacement [mm]
App
lied
For
ce [k
N]
S3
S1
S4
S2
(a)
0
200
400
600
800
1000
1200
1400
1600
0.0 0.5 1.0 1.5 2.0 2.5 3.0 3.5 4.0d1 displacement [mm]
App
lied
forc
e &
Inte
rnal
For
ces
[kN
]
Experimental Curve
Mechanism 1 Contribution
Mechanism 2 Contribution
EC2 Calibrated Formula
(b)
(c)
(d)

EXPERIMENTAL AND NUMERICAL INVESTIGATIONS……….
1413
(e)
(f)
Figure 4. (a) Force-Displacement curves of tested slabs; (b) Preliminary results: contributions of the two resistant Mechanisms [20]. Slab at the end of loading process:
(c) slab collapse, Test S1; (d) slab collapse, Test S2; (e) cracks pattern of Test S1 by FEM simulation; (f) cracks pattern of Test S2 by FEM simulation.
In the last phase of the test, after the failure of mechanism 1, see figure 4-b, the
mechanism 2 started working properly developing its full resistance. Obviously, this first evaluation based on simplified hypotheses and engineering approximate interpretations, needed of more refined analyses and more deep investigations. To these purposes, accurate numerical nonlinear calculations were carried out after the completion of the S1 test in order to deep investigate these preliminary results and to define the test set-up for the three tests (S2, S3 and S4) on the various shear connections. The resistance obtained from S2, S3 and S4 depends strongly from the concrete resistance and the shear connecting system as shown and stated in Fig 4-a and table 2 respectively. The high resistance value of S3 was mainly due to a high concrete strength.
4 THE NUMERICAL MODELLING The finite element modelling method was used to elaborate a deeper mechanical interpretation of experimental results coming from tests S1, S2 and S4 and to carry out a parametric study to individuated more influencing parameters. The model dimensions and properties were directly adopted from the measured values of experimental specimens. A numerical model represents only a half of the full size slab was adopted with symmetric boundary conditions used at the slab center in order to simulate the full slab adequately. A first series of pilot runs were carried out in order to define elastic properties (young modulus and poisson ratio), matching the initial experimental stiffness of specimens, and an optimal refinement of the mesh that didn’t influence the results of the numerical model. The values of young moduli and poisson ratio determined from the pilot runs have been reported in Table 2. The dimensions of the elements have an aspect ratio 1:1 with 20mm length in all directions of the element, furnishing the best simulation of the experimental data.
The finite element types adopted in the model were: SOLID65 element for concrete, that is capable of cracking in tension and crushing in compression; LINK8
element, for representing the reinforcement embedded in the concrete; SHELL43, thick

Ahmed S. Elamary
1414
shell element, for modelling the steel plates of the HEB profiles adopted in the tested specimens; CONTACT 174 for modelling the surface-to-surface contact with friction due to the relative sliding (the same element is used to model the concrete-to-concrete and concrete-to-steel contact).
Table 2. Material properties and diameters of the reinforcement of tested specimens
The non-linearity of the concrete was modelled adopting the concrete model proposed by ANSYS software assuming that: the concrete strength was set equal to the actual values fcm related to the concrete compressive strength obtained from cylinder tests (specimen S1, S2 and S4). In the portion of the concrete inside the steel profile an increased value of the resistance was adopted, according to the model proposed by Mander [22] (specimen S1, S2 and S4). Higher value of confined resistance considered in slab S4 for taking into account that a portion of the concrete was cast between the column flanges before the concrete of the slab and of the connecting tooth. The values of the confined resistance proposed by Mander were slightly modified in order to capture the experimental behaviour obtained during the test. All these parameter have been reported in Table 2. The cracking and post-cracking conditions of the concrete were established setting the following parameters: the shear transfer coefficient
S1 S2 S3 S4Rebars
diametermm 12 12 12 12
Stirrups diameter
mm 8 8 - 8
Number of stirrups
mm 4 4 - 4
f yk N/mm2 525 525 525 525f u N/mm2 640 640 640 640Es N/mm2 206000 206000 206000 206000
Concrete f cm N/mm2 41 38 43 34f yk N/mm2 300.8 300.8 300.8 300.8f u N/mm2 428.4 428.4 428.4 428.4Es N/mm2 206000 206000 206000 206000f yk N/mm2 340.75 340.75 340.75 340.75f u N/mm2 450 450 450 450Es N/mm2 206000 206000 206000 206000f c N/mm2 41 38 - 34f ct N/mm2 4.5 4 - 4E c N/mm2 32000 33000 - 31000
f confined N/mm2 57 60 - 60µ c-c 0.8 0.75 - 0.95µ c-s 0.5 0.5 - 0.5
Friction
Con
cret
e
Mat
eria
l pro
pert
ies
of te
sted
spe
cim
ens
Par
amet
ers
assu
med
for
the
conc
rete
Ste
el R
einf
orce
men
tS
teel
fla
nge
Ste
el
web

EXPERIMENTAL AND NUMERICAL INVESTIGATIONS……….
1415
between the cracks is set to 0.2 for open cracks and 0.8 for closed cracks. The tensile strength, fctm, of the concrete adopted in each model was set equal to the 10% of its relative compressive strength. The cracks in the concrete were assumed to be fully opened at a tensile strain of 0.1% and the ultimate deformation of not confined concrete was set to 0.35%. The friction coefficients adopted in the CONTACT 174 elements were assumed as calibration parameter in order to capture the experimental behaviour of the slab specimens: the friction coefficient was selected in a range from 0.8 to 0.95 for concrete-to-concrete surfaces and set equal to 0.5 for concrete-to-steel surfaces. The model for the structural steel was a bi-linear elasto-plastic stress-strain law for both reinforcing steel and steel profile, assuming the steel properties coming from experimental tests, reported in Table 2.
The validation of the models was based on the experimental data available from the previously mentioned experimental programme. Numerical models represented only half of the full size tested slabs; symmetric boundary conditions were used at the slabs centre in order to simulate the full slabs adequately. Figures 5-a, 5-c and 5-e illustrates the models representing the tests S1, S2 and S4, respectively. The nonlinear finite element analysis was performed by applying the displacement control techniques, which enforced a better conditioning of the tangent stiffness matrix if it compared with the classical load control techniques. The results obtained from both the experimental and finite element method were compared. The load deflection responses for the slabs numerical simulation were captured in good agreement with the experimental results as illustrated in the figures 5-b, 5-d and 5-f. Moreover, also the tensile forces acting in seismic rebars, calculated from the strain gauges readings, were compared with the total tensile force acting in the seismic rebars of the FEM model, Figs. 4-g and 4-h, showing a good agreement.
(a)
0
200
400
600
800
1000
1200
1400
1600
0 0.25 0.5 0.75 1 1.25 1.5 1.75δ1 displacement [mm]
App
lied
For
ce [k
N]
F.E.Model
Experimental Curve
(b)
(c)
0
100
200
300
400
500
600
700
0.00 0.25 0.50 0.75 1.00 1.25 1.50 1.75 2.00δ1 displacement [mm]
App
lied
For
ce [kN
]
Experimental Curve
F.E. Model
Test S2Column - HEB 280 Column Concrete
Concrete Slab
2 Stirrups
(d)

Ahmed S. Elamary
1416
(e)
0
100
200
300
400
500
600
700
800
0.00 0.50 1.00 1.50 2.00 2.50 3.00
δ1 displacement [mm]
App
lied
For
ce [k
N]
Experimental Curve
F.E. Model
Column - HEB 280
2 stirrups
Column Concrete
Concrete Slab
Filling Socket
Slab S4
(f)
Figure 5. FE modelling and results. Test S1: (a) FE model, (b) comparison between experimental and numerical results; Test S1: (c) FE model, (d) comparison between
experimental and numerical results; Test S4: (e) FE model, (f) comparison
between experimental and numerical results;.
To minimize the computational effort without sacrificing the accuracy of the results, the 45° inclined part in the slab was completed arriving to a rectangular shaped specimen. Consequently, all the elements assumed regular shape and the time and the resources required for solving the problem were reduced [20]. Pilot runs, executed for checking the new proposed models, gave same results obtained previously in the figures 5-b and 5-d for the main models S1 and S2. One of the most significant characteristic describing the overall behaviour of the model in addition to the load-deformation curve was the position of the concrete cracking into the slab: cracked finite element models, illustrated in the figures 4-e and 4-f, compared with the final results experimentally obtained, showed a good agreement.
5 PARAMETRIC ANALYSES In order to identify the dependence of the steel-concrete composite joints on the main geometrical and mechanical variables, a numerical finite element parametric analysis was undertaken varying parameters as concrete class, column steel profile or reinforcement details. As the connecting system type A) was considered the easier to be realised in the practice demonstrating at the same time enough strength and ductility, S1 and S2 tests were analysed in the parametric studies.
S2 test parametric analyses allowed the study of mechanism 2 resistance and its collapse behaviour. In particular, the influence of the diameter of the wire mesh, of the diameter of the transverse rebars, of the diameter of the additional stirrups and of the reinforced concrete compressive strength of the slab was investigated. The results obtained from each parameter are plotted in the figures 6-a÷d: increasing the diameter of the wire mesh, both the initial stiffness and the overall capacity of the mechanism 2 didn’t change significantly; similar results were obtained for rebars diameter or the stirrup diameter; the compressive strength of the reinforced concrete influences remarkably the overall behaviour of the mechanism 2.

EXPERIMENTAL AND NUMERICAL INVESTIGATIONS……….
1417
0
100
200
300
400
500
600
700
0.00 0.25 0.50 0.75 1.00 1.25 1.50 1.75δ1 displacement [mm]
App
lied
forc
e [k
N]
8mm
10mm
6mm
(a)
0
100
200
300
400
500
600
700
0.00 0.25 0.50 0.75 1.00 1.25 1.50 1.75δ1 displacement [mm]
App
lied
forc
e [k
N]
12mm
18mm
16mm
(b)
0
100
200
300
400
500
600
700
800
0.00 0.25 0.50 0.75 1.00 1.25 1.50 1.75δ1 displacement [mm]
App
lied
forc
e [k
N]
16mm
18mm
12mm
(c)
0
100
200
300
400
500
600
700
800
0.00 0.25 0.50 0.75 1.00 1.25 1.50 1.75δ1 displacement [mm]
App
lied
forc
e [k
N]
45Mpa
38Mpa
50Mpa
(d)
Fig.6 FE modelling of test S2: influence of (a) wire mesh diameter, (b) additional
transverse rebars diameter, (c) stirrups diameter, (d) concrete compressive strength on connecting system performance
The parametric analyses on the S1 test identified which parameters play a
governing role on the mechanism 1 capacity and therefore on the post-peak behaviour of the connecting system. The column flange thickness, the column web thickness, the slab concrete compressive strength and the percentage of reinforcing steel area with respect to the total concrete area have a greater influence respect to the wire mesh diameter, the transverse rebar diameter and the stirrup diameter (figures 7-a÷g).It was ease to note how varying profile dimensions - flanges thickness and column web thickness seems possible to delay the failure of mechanism 1 without in any case improving the overall performance of the connecting system (figures 7-a÷b). On the contrary increasing the slab concrete compressive strength the overall resistance significantly increased, nevertheless the brittle failure of mechanism 1 was still slightly anticipated with respect the gradual softening effect due to the ductile failure of mechanism 2 (Figure 7-c).

Ahmed S. Elamary
1418
0
200
400
600
800
1000
1200
1400
1600
0 0.2 0.4 0.6 0.8 1 1.2 1.4 1.6δ1 displacement [mm]
App
lied
forc
e [k
N]
18 mm
22 mm
24 mm
20 mm
(a)
0
200
400
600
800
1000
1200
1400
1600
0 0.2 0.4 0.6 0.8 1 1.2 1.4 1.6
δ1 displacement [mm]
App
lied
forc
e [k
N]
10.5 mm
16 mm
20 mm
14 mm
12 mm
(b)
0
200
400
600
800
1000
1200
1400
1600
1800
0 0.2 0.4 0.6 0.8 1 1.2 1.4 1.6
δ1 displacement [mm]
App
lied
forc
e [k
N]
fc 50
fc 41
fc 45
(c)
As = Area of steel reinforcenment in column stripAc = Area of concrete cross section in column strip
ρs = Reinforcement ratio As/Ac
0
200
400
600
800
1000
1200
1400
1600
1800
0 0.2 0.4 0.6 0.8 1 1.2 1.4 1.6δ1 displacement [mm]
App
lied
forc
e [k
N]
ρs = 3.36%
ρs = 2.30%
ρs = 0.30%
ρs = 1.50%
(d)
0
200
400
600
800
1000
1200
1400
1600
1800
0 0.2 0.4 0.6 0.8 1 1.2 1.4 1.6δ1 displacement [mm]
App
lied
forc
e [k
N]
6 mm
8 mm
10 mm
(e)
0
200
400
600
800
1000
1200
1400
1600
1800
0 0.2 0.4 0.6 0.8 1 1.2 1.4 1.6δ1 displacement [mm]
App
lied fo
rce
[kN
]
12 mm
16 mm
18 mm
(f)
0
200
400
600
800
1000
1200
1400
1600
0 0.2 0.4 0.6 0.8 1 1.2 1.4 1.6δ1 displacement [mm]
App
lied
forc
e [k
N]
12 mm
16 mm
18 mm
(g)
Fig.7. FE modelling of test S1: influence of (a) column flange thickness, (b) column web thickness, (c) concrete compressive strength, (d) percentage of steel rebars , (e) wire mesh diameter, (f) additional transverse rebars diameter, (g) stirrups diameter.

EXPERIMENTAL AND NUMERICAL INVESTIGATIONS……….
1419
6 COMPARISON WITH CODES’ FORMULA Results attainable with design for sizing of shear connection between concrete elements already existing in current standards were so analysed and compared with reference to connecting system type A). Two design formula were calibrated in order to obtain the same resistant capacity obtained in the parametric analyses on the S2 test varying concrete strength class. In particular the formula stated in AASHTO formula No. (1) [23] and Eurocode formula No. (2) [24]
( )yntr fc ⋅++= ρσµν (1)
( )** cossin ββµρσµν +⋅⋅⋅+⋅+⋅= ynctmr ffc (2)
were considered, being tc the cohesion coefficient, c the rate of tensile strength of
concrete due to cohesion, µ the friction coefficient, ρ the ratio of steel reinforcement
along the shear surface, yf the yield stress of rebars, *β the inclination of
reinforcement with respect to shear surface and nσ the average compression acting
perpendicular to shear surface. Both formula furnish the shear resistance for unit of area of critical shear surface. The parameters µ , c and tc were calibrated in order to
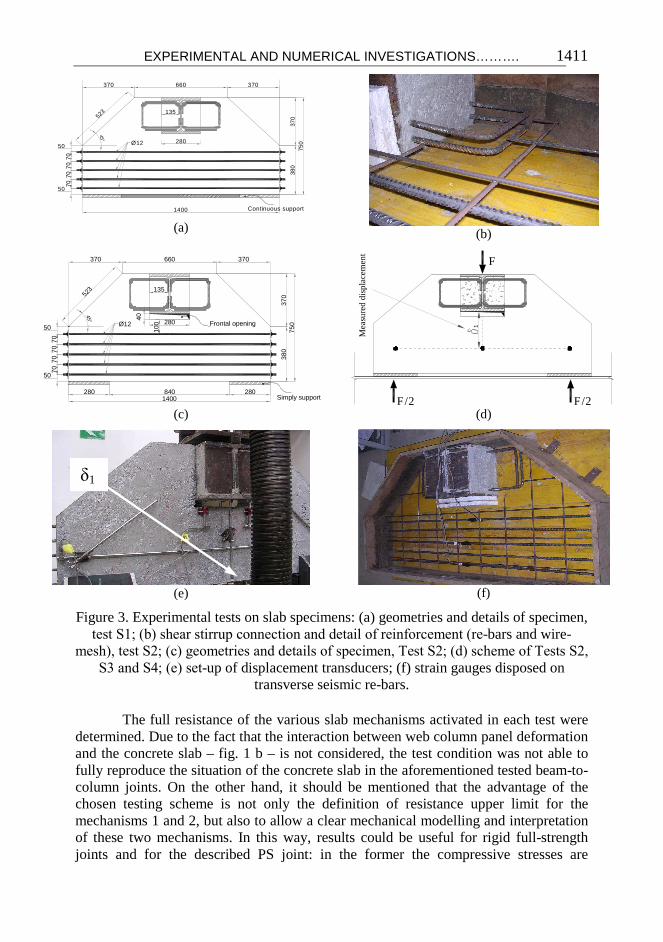
fit resistances of S2 test simulations assuming the inclination of strut in the mechanism 2 equal to 30° as found in the previous analyses. The strong dependency of resistant capacity of mechanism 2 on the concrete strength was again confirmed. In fact it was ease to note, for both formula, a direct proportional dependencies of the calibrated parameters on the concrete compressive strength. In EC2 code formula, in order to satisfy numerical results, it was sufficient to assume the c factor constant and equal to 0.50 and the friction coefficient µ equal 0.57. On the other hand, for the AASHTO formula, the cand µ, factors furnished satisfactory results assuming both coefficients equal to 1.0% of the concrete compressive strength.
Table 3 Calibration of code formula: comparison of ultimate load calculation results
Concrete resistance
[Mpa]
Ultimate load Numerical simulation
[kN]
AASHTO Eurocode 2
ct µ Ultimate Load
[kN] c µ
Ultimate Load [kN]
38 640 0.380 0.380 636 0.5 0.57 639
45 671 0.450 0.450 674 0.5 0.57 670
50 697 0.500 0.500 704 0.5 0.57 692
In the figures 8-a÷c and in the table 3 the ultimate loads obtained by finite element model are compared with values attainable by formula (1) and (2), calibrated as above described.
Ahmed S. Elamary
1420
0
100
200
300
400
500
600
700
800
0.00 0.25 0.50 0.75 1.00 1.25 1.50 1.75δ1 displacement [mm]
App
lied
forc
e [k
N]
Eurocode 2
AASHTO LFRD
Finite Element Results
FE Simulationfc = 38 N/mm2
EC2AASHTO
(a)
0
100
200
300
400
500
600
700
800
0.00 0.25 0.50 0.75 1.00 1.25 1.50 1.75δ1 displacement [mm]
App
lied
forc
e [k
N]
Eurocode 2
AASHTO LFRD
Finite Element Results
FE Simulationfc = 45 N/mm2
EC2AASHTO
(b)
0
100
200
300
400
500
600
700
800
0.00 0.25 0.50 0.75 1.00 1.25 1.50 1.75δ1 displacement [mm]
App
lied
forc
e [k
N]
Eurocode 2
AASHTO LFRD
Finite Element Results
FE Simulationfc = 50 N/mm2
EC2AASHTO
(c)
Fig.8 Calibration of code formulas on the basis of S2 test simulations: concrete strength equal to (a) 38 MPa, (b) 45 MPa, (c) 50 MPa.
7 CONCLUSIONS Three mechanical systems connecting composite column to reinforced concrete slab were studied analysing experimental results obtained on suitably designed prototypes. Subsequently, on this bases, numerical models were calibrated and parametric analyses performed. All choices showed good performance, anyway shear connecting system obtained by introducing suitable steel stirrups, solution A) used in the S2 test, showed good ductile performance and resistant capacity and, at the same time, easiness in building with respect to the proposed concrete socket. Concrete strength of the r.c. slab showed a rather big influence both on the behaviour of connecting system for mechanism 2 and, obviously, on the capacity of mechanism 1. In particular, by means of parametric analyses, it was possible to demonstrate that and a proper choice of class of strength for concrete and diameter of transverse reinforcing bars allows to reach a satisfying ductility and high resistance avoiding early loss of carrying capacity. The analysis of the test S1, on the other hand, demonstrated that the thickness of the column web and flanges did not increase the capacity of the joint significantly. More and over, this analysis demonstrated how the mechanical interaction between the mechanism 1 and the mechanism 2 is not easily to assess at design stage and particular attention should be paid when both mechanisms are considered in the evaluation of carrying capacity of the steel-concrete composite joints. Design formula already existing in current standards was suitably calibrated in order to reproduce carrying capacity of solution B) of shear connecting system.

EXPERIMENTAL AND NUMERICAL INVESTIGATIONS……….
1421
REFERENCES
[1] AISC, (2005). ANSI/AISC 341-05 Seismic provisions for structural steel buildings. American Institute of Steel Construction, Inc., Chicago. IL.
[2] Braconi, (2004), A. Partial-strength beam-to-column connections for steel-concrete composite earthquake resistant high-ductility structures (in Italian). Ph.D. Thesis, Department of Structural Engineering, University of Pisa.
[3] Braconi, A., Caramelli, S., Cioni, P., Salvatore, W., (2003a), Earthquake-resistant composite steel-concrete frames: some constructional considerations. In: Processigns of the international conference on metal structures, ICMS 2003, University of Miskolc, Hungary.
[4] ASCE, (1998), Design guide for partially restrained composite connections. Journal of Structural Engineering, ASCE, 1998; 124 (10): 1099-1114.
[5] Leon, R. T., Hoffman, J.J., and Staeger, T., (1996), Partially restrained composite connections. Steel Design Guide Series No. 8, American Institute of Steel Construction, Chicago, IL.
[6] CEN, (2003). Eurocode 3: Design of steel structures. Part 1-1: General rules, December 2003. European Committee for Standardization, Brussels, Belgium.
[7] CEN, (2004). Eurocode 4: Design of composite steel and concrete structures. Part 1.1. General rules and rules for buildings, EN 1994-1-1, January 2004. European Committee for Standardization, Brussels, Belgium.
[8] CEN, (2003), Eurocode 8: Design of structures for earthquake resistance. Part 1: General rules, seismic actions and rules for buildings, EN 1998-1, December 2003, European Committee for Standardization, Brussels, Belgium.
[9] Braconi, A., Salvatore, W., Tremblay, R. and Bursi, O.S. (2007). Behaviour and modelling of partial-strength beam-to-column composite joints for seismic applications. Earthquake Engineering and Structural Dynamics, Wiley Interscience, 36, 142-161.
[10] Green; T. P., Leon, R. T and Rassati, G. A., (2004). Bidirectional Tests on Partially Restrained, Composite Beam-to-Column Connections. Journal of Structural Engineering, Vol. 130, No. 2, February 1, 2004.
[11] Rassati, G. A.; Leon R. T., Noé, S., (2004). Component Modeling of Partially Restrained Composite Joints under Cyclic and Dynamic Loading. Journal of Structural Engineering, Vol. 130, No. 2, February 1, 2004.
[12] Bursi, O. S., Caramelli, S., Fabbrocino, G., Molina, J., Salvatore, W., Taucer, F., and Zandonini, R., (2004), 3D Full-Scale Seismic Testing of a Steel-Concrete Composite Building at ELSA. Report No. EUR 21299 EN, European Laboratory for Structural Assessment (ELSA), Ispra, Italy.
[13] ECSC Steel RTD Programme, (2002), Applicability of composite structures to sway frames. ECSC Contract n. 7210-PR-250, edited by H. Stangenberg, European Commission.
[14] Braconi, A., Salvatore, W., Bursi, O. S., Ferrario, F., (2003), Seismic design of beam-to-column connections for steel-concrete composite moment resisting frames. In Behaviour of Steel Structures in Seismic Area, Proc. STESSA 2003 Conference, F. Mazzolani (ed.), 253-260, Naples, Italy, June 2003. Lisse: Balkema.
Ahmed S. Elamary
1422
[15] Doneux, C., (2002) Étude du mécanisme de transfert des flexions à la jonction poutre-poteau dans les structures en portiques mixtes soumises à une action sismique. Ph.D. Thesis, Faculty of Applied Sciences, Université de Lièges, Lièges, Belgium. (In French).
[16] Braconi, A., Bursi, O. S., Fabbrocino, G., Salvatore, W., Tremblay, R., Seismiic performance of a 3D full-scale high-ductility steel-concrete composite moment-resisting structure - Part I: Design and testing procedure. Earthquake Engineering and Structural Dynamics, Wiley Interscience. (accepted) at under publication.
[17] SAC Joint Venture, (1996), Experimental investigations of beam-column sub-assemblages, Rep. No. SAC-96-01, Part 1 and 2, Sacramento, California.
[18] Salvatore W., Braconi, A. and Bursi, O. S., (2004), Component-based models of dissipative partial-strength beam-to-column composite joints, Composite Construction V, ASCE.
[19] Salvatore, W., Braconi, A., Bursi, O. S. and Tremblay, R. (2004), Modelling of a partial-strength beam-to-column joint for high ductile steel-concrete composite MR frames, Proceedings of 13th World Conference on Earthquake Engineering, Vancouver, B.C., Canada, paper n. 2929.
[20] Braconi, A., Elamary, A., Lucchesi, D., Salvatore, W., (2007). Improvement of seismic performances of steel-concrete composite joints by means of slab-column shear connections. Proc. of Italian National Conference on Earthquake Engineering, ANIDIS, Pisa, Italy.
[21] ANSYS User’s Manual, Version 9, 2004. [22] Mander, J.B., Priestley M.J.N., and Park R. 1988. Theoretical stress–strain model
for confined concrete. Journal of Structural Engineering, ASCE, 114, 8, 1804–1826.
[23] AASHTO (2004). LRFD bridge design specification. 3rd ed. American Association of State Highway and Transportation Officials.
[24] CEN, (2003). Eurocode 2: Design of concrete structures. Part 1-1: General rules, December 2003. European Committee for Standardization, Brussels, Belgium.
دراسة عملية تحليلة لسلوك الوصالت بين العمود والبالطة الخرسانية فى المنشات
المركبة من حديد وخرسانة
الخرسانية طة يهدف هذا البحث الى دراسه عملية ونظرية لتحليل الدور الذي تقوم به البال
فى زيادة قدرة الوصالت بين الكمرة والعمود فى المنشات المركبة من حديد وخرسانة على نقل قوى
حيث تطرق البحث الى دراسة . الضغط الواقعة على تلك النوع من الوصالت نتيجة االحمال الجانبية
اومة الخرسانة وقطر حديد تحليلية باستخدام طريقة العناصر المحددة حيث تم دراسة تاثير كال من مق
والبالطة الخرسانية على قدرة تحمل الوصلة التسليح بالبالطة وقطر حديد وصالت القص بين العمود
ككل نتيجة تاثير االحمال الخارجية كما تم عمل مقارنة بين القيم الناتجة من الدراسة التحليلية واقصي
وقد خلص البحث الى . قيمة يمكن الحصول عليها باستخدام معادالت الكود االمريكى والكود االوروبى
.ة الخرسانة فى تلك النوع من المنشاتاهمية الدور الذى تلعبة مقاوم