Laboratory, Computational and Field Studies of Snowboard Dynamics

Experimental and Computational Studies on Oil Injected Twin-Screw Compressor
A Thesis Submitted for Award of the Degree of
Doctor of Philosophy
Nagam Seshaiah
Mechanical Engineering Department National Institute of Technology
Rourkela

Chapter I
INTRODUCTION
Gas compressors are mechanical devices used for raising the pressure of gas
or vapour either by lowering its volume (as in the case of positive displacement
machines) or by imparting to it a high kinetic energy which is converted into
pressure in a diffuser (as in the case of centrifugal machines). The classification and
use of compressors are described in the next section.
The selection of compressors for different applications is a crucial issue in the
process industry. It is usually the most expensive piece of equipment and has
dominant influence on cycle efficiency. The common types of compressors used in
industry are reciprocating, twin screw, single screw, centrifugal, scroll and rotary
vane. Compressor manufacturers are used to having a large market potential.
Probably all types of compressors can be improved over what is available in the
market today; but the potential return must justify the expense of research and
development to achieve the improvement.
The twin screw compressor is popular and constitutes a substantial
percentage of all positive displacement compressors now sold and currently in
operation. Their rapid acceptance over the past thirty years is due to their relatively
high rotational speeds compared to other types of positive displacement machines
which make them compact, their ability to maintain high efficiencies over a wide
range of operating pressures and flow rates and their long service life and high
reliability.
1.1 Classification of Compressors
Compressors are broadly divided into positive displacement and dynamic
type. The detailed classification of compressors is shown in Figure 1.1. The dynamic
principle is utilized in the multi blade dynamic compressors. These are further sub

divided into centrifugal and axial flow types. In axial compressors, the velocity of
fluid can be supersonic which is converted to a pressure head by diffusers. Positive
displacement compressors are further subdivided into piston compressors in which
the gas volume changes due to the action of one or more reciprocating pistons
moving axially in the cylinder and Membrane compressors in which the volume
variations are affected by deflection of an elastic partition. In the positive
displacement rotary compressors, the compression is produced as the result of
reduction of volume inside the rotating elements such as helical screws.
Compressor Specifications: Most of the compressors are specified with the following parameters:
Mass Flow Capacity.
Inlet / Suction Pressure.
Discharge / Operating Pressure.
Inlet Temperature.
Speed.
Type and Volume of Gas Handled.
Dynamic compressors
Dynamic compressors are sub divided into radial flow (centrifugal) and axial
flow compressors.
(a) Centrifugal Compressor
It consists of a vaned rotating disk or impeller which is used to force the gas
up to the rim whereby the speed of the gas is increased. The turning of the impeller
causes compression of the gas. The compressor also incorporates a diffuser as the
converting element from velocity to pressure head. Centrifugal compressors are
usually stationary compressors. They are used for heavy duty applications in
industry. They are most suitable to applications where the pressure requirement is
moderate. They are widely used in large snow-making works especially in ski resorts
and also in gas turbine engines. They are also used as turbochargers and
superchargers in internal combustion engines. The large air separation industry also
2

uses centrifugal compressors. The advantages of the centrifugal compressor are its
ruggedness and relatively low cost of manufacturing. The disadvantages are its large
frontal area and its relatively poor pressure ratio when compared with other types of
compressors.
Figure: 1.1: Classification of compressors [1].
(b) Diagonal or Mixed-Flow Compressor
A mixed flow is similar in construction to that of the centrifugal compressor. It
differs in that the axial and radial components are available outside the rotor. It
incorporates a diffuser for turning the diagonal flow into the axial direction.
(c) Axial Flow Compressor
The axial flow compressor consists of rows of alternate rotating (rotor) and
fixed (stator) blades. A row of rotors followed by a row of stators is known as a
3

stage and there may be many stages attached to a single shaft. Gas is drawn usually
by the spinning of the numerous fans on the shaft. A series of divergent and
convergent ducts form the stator. Axial flow compressors are mostly available as
multi staged type. They are used in applications that require very high flow such as
large gas turbine engines.
Positive Displacement Compressors
In positive displacement compressors, the compression is realized by
displacement of a solid boundary and preventing the fluid by this solid boundary
from flowing back in the direction of pressure gradient. These are further classified
into reciprocating and rotary types.
(a) Reciprocating compressor
As the piston moves for the downward stroke, discharge valves are forced
shut. The gas is then sucked into the cylinder by the suction pressure. During
upward stroke the suction valves are forced shut and the gas is moved into the
discharge valve. The spring loaded valves are self operated by the pressure in the
cylinder.
Advantages
High efficiency, particularly when new and after overhauls.
Possibility of very high discharge pressures.
Disadvantages
o Requires high maintenance.
o Fixed speed.
o Creates noisy atmosphere.
o Damping requirement to arrest vibration.
o More moving parts.
o Efficiency drops off between overhauls.
o High cost.
4

Applications
There are no rigid rules for the application of reciprocating compressors. The
power ranges between 5 and 30 HP are used for automotive work especially for
intermittent duties. Compressors of greater power such as 1000 HP are meant for
large process applications.
(b) Rotary Compressors
The compression is produced as a result of the positive action of rotating
elements such as helical screws, scrolls or vanes. Rotary positive displacement
compressors are classified into single rotor and two rotor compressors. Single rotor
compressors are further classified into single screw, sliding vane/rotary vane, liquid
ring, and scroll compressors. Similarly, the two rotor compressors are divided into
roots blower and twin screw compressors.
(I) Single Rotor Compressor
The single rotor compressors are further classified as below.
(i) Single-screw compressor
This type of compressor uses a single main screw rotor meshing with two
gate rotors with matching teeth. The main screw is driven by the prime mover,
typically an electric motor. The gate rotors may be made of metal or a composite
material. The screw-like grooves gather gas/vapours from the intake port, trap them
in the pockets between the grooves and compressor housing, and force them to the
discharge port along the meshing path. This action raises the trapped gas pressure
to the discharge pressure. Single screw compressors usually employ hermetic or
semi-hermetic designs for higher efficiency, minimum leakage and ease of service.
(ii) Rotary Vane Compressor
It consists of a single rotor accommodated in a cylindrical housing. As the
rotor rotates, the vanes of the rotor are thrown off against the housing wall. The
bearings and vanes are lubricated with oil. The segments created by the vanes
change in shape and volume during a cycle. This results in the compression of the
5

trapped gas. Ports are used for intake and exhaust of the gas at the minimum and
maximum pressure positions.
Advantages
Simplicity in design.
Slow rotational speed results in low wearing of parts.
Moving parts are only the rotor and the vanes.
The rotor can be directly driven.
Gas discharge rate is not pulsed.
No additional foundation required.
Vibration free operation.
Valveless operation.
Requires little maintenance.
Disadvantages
Close contact between the compression gas and lubricating oil.
Lubrication oil necessitates disposal.
Low pressure capability
Applications
o Landfill gas gathering and boosting.
o Digester mixing.
o Fuel gas boosting.
o Flare gas recovery.
o Wellhead gas compression.
(iii) Liquid ring compressor
In a liquid ring compressor the rotor is positioned centrally in an oval-shaped
housing. Upon rotation, which proceeds without metal to metal contact, a ring of
liquid is formed that moves with the rotor and follows the shape of the housing. At
the two points of the closest proximity between the rotor and the housing, the liquid
completely fills the chambers of the rotor. As rotation proceeds, it follows the
contour of the body and recedes again, leaving spaces to be filled by the incoming
gas. These spaces are connected via the cone porting to the inlet of the compressor.
6

As a result of the suction action thus created, gas is pulled into the compressor. As
the rotation progresses, the liquid is forced back into the chambers, compressing the
gas. This gas is forced out of the discharge port and then leaves the compressor via
the outlet flange.
The compressor is fed continuously with liquid which serves to seal the
clearances between inlet and discharge ports and removes the heat of compression.
This liquid leaves the compressor together with the compressed gas and is separated
from the gas in a discharge separator.
3 Advantages
Virtually no gas temperature rise
Low wear
Reduced maintenance costs
Reduced operation downtime
Investment cost savings
High operation safety
Low noise
Environment operation
Applications
• For compressing explosive gases
• When gases tend to polymerise or otherwise react under rising compression
temperatures
• When oil free compression is required
• For vapour recovery applications
• For applications requiring tolerance to liquid carry over
• When gas scrubbing is desired
• For corrosive services
(iv) Scroll compressor
The scroll compressor consists of two scroll members each with a spiral
shaped wrap and corresponding end plate. The working mechanism of scroll
compressor is shown in Figure 1.2. The two scroll members are placed at the top of
the compressor housing. The top scroll member is fixed to the compressor housing
7

while the lower member is free to orbit about the centre of the fixed scroll. The
moving scroll is driven by a motor and is attached to the motor shaft. As the moving
scroll orbits about the fixed scroll, the wraps of the two scroll members form lines of
contact. These lines of contact form crescent shaped symmetric pockets. The gas
enters the first pair of symmetric pockets at the outer periphery of the scroll set and
continues to travel towards the centre. As the gas moves towards the centre, the
volume of the pockets decreases thus compressing the trapped gas.
Once the gas reaches the centre of the scroll set, the tip of the moving scroll
begins to uncover the discharge port located in the centre of the endplate of the
fixed scroll member. Once the discharge port becomes uncovered, the discharge
process begins. Because of the scroll’s geometry, no discharge valve is needed;
instead the tip of the moving scroll wrap uncovers the discharge port. Scroll
compressors are used refrigeration and air conditioning systems as well as
supercharger in automotive operations. Pulsed output is obtained which discourages
its usage in industry.
(v) Roots Blower
It is a positive displacement compressor with two lobed impellers, each
resembling the figure of “8”. The two rotors are mechanically linked via gears such
that they rotate in opposite directions. The figure of “8” shape allows the impellers
to be close to but never in contact with each other and the compressor walls at
every position of their rotation. The close tolerances of the components allow the
impellers to move without a lubricant if required.
Roots blowers are typically used in applications where a large volume of gas
must be moved across a relatively small pressure differential. This includes low
vacuum applications, with the roots blower acting alone, or use as part of a high
vacuum system in combination with other compressors. Roots blowers are also used
as superchargers.
(II) Twin Screw Compressor
It is a positive displacement machine that uses a pair of intermeshing rotors
housed in a suitable casing instead of piston to produce compression. In the double
screw compressor, each rotor comprises of a set of helical lobes affixed to a shaft.
8

One rotor is called the male rotor and the other rotor is the female rotor. The
number of lobes on the male rotor, and the number of flutes on the female, will vary
from one compressor manufacturer to another. However, the female rotor will
always have numerically more valleys (flutes) than the male rotor lobes for better
efficiency. Either an electric motor or an engine drives the male rotor.
Twin-screw compressors are basically classified into oil free and oil injection
types. Single stage oil free machines are used for low-pressure devices and oil-
injected compressors are used for moderate pressure machines. Multistage designs
are used for the compressors working with higher pressure ratio. Oil injection
provides cooling, lubrication and sealing, thus permitting higher pressure ratio.
Fixed scroll
Orbiting scroll
Maximum filling area Inlet cut off
Start of discharge End of discharge
Figure 1.2: Operating principle of an orbiting scroll compressor (moving scroll is orbiting clockwise)
9

(i) Oil free compressor
Oil free operation implies that the gas compression space is entirely free from
oil contamination. These compressors are suitable for compression of a wide variety
of gases requiring relatively low pressure ratios at fairly constant volume flow rates.
These are particularly suitable for handling contaminated, particle-laden,
polymerizing, or explosive gases.
(ii) Oil Injected compressor
In an oil injected twin-screw compressor, the lubricating oil is deliberately
injected into the gas stream to absorb the heat of compression. This enables much
higher pressure ratio in a single stage without intercooling and provides significant
protection against corrosive gases. Also, it permits the use of stepless capacity
control by slide valve. No timing gears are required and the male rotor usually drives
the female rotor through an oil film between the intermeshing profiles.
Twin-screw oil injected machines are used today for different applications
both as compressor and expander. They operate on a variety of working fluids. The
working fluid may be gas, dry vapour, or multi phase mixture with phase change
taking place within the machine. Presently, screw compressors hold an important
position in the industrial refrigeration and compression field. It occupies a position
alongside reciprocating and centrifugal types as a standard choice for refrigeration
compressors.
The asymmetric rotor profile of oil-injected type screw compressors reduces
the leakage path cross section resulting in increased efficiency. The helical screw
compressor is the only rotary unit that operates at tip speeds in excess of 0.12 Mach
[2]. These machines develop pressure 7.3 times more than that of a centrifugal
compressor operating at the same tip speed [3]. While the performance
characteristics and flexibilities of this type machine approach that of the piston
compressor, it has compression efficiency comparable to that of a centrifugal
machine. Its maintenance cost also compares favourably with that of the centrifugal
machines, which is less than one third of the cost of maintaining piston compressors.
A schematic view of a pair of twin-screw rotors is shown in Figure1.3.
The commercial range of oil injected screw compressors available today
covers outer diameter of the male rotor between 75 and 620 mm. They produce
10

between 10 m3/hr and 10,000 m3/hr of gas flow rate for refrigeration and air
conditioning applications and up to 60,000 m3/hr for general purpose applications.
Pressure ratios of 3.5 for dry compressors and up to 15 for oil injected twin-screw
compressors are available in the market. The average pressure difference is up to 15
bar but maximum pressure difference some times exceeds 40 bar [1]. Typically, the
volumetric efficiency of oil injected compressor exceeds 90%.
Figure 1.3: Isometric cutaway drawing of Twin-Screw compressor [4]
1.2 Twin-Screw Compressor Applications and Advantages
Oil injected twin-screw compressor offers several advantages over
comparable machines:
(i) Simple maintenance, low maintenance cost and Low weight.
(ii) High reliability and long compressor life, full use of drive horsepower.
(iii) Low operating expense, medium purchase price.
(iv) High compression ratio (up to 16 per stage).
(v) Operation at low suction pressure up to 66 cm Hg vacuum.
11

(vi) Reduced package cost due to compactness.
(vii) Absence of reciprocating components and low internal forces, allowing the
compressor to run at higher tip speeds, resulting in more compact unit.
(viii) The continuous flow of cooling lubricant permits high single
stage compression ratio.
(ix) High speeds and compression ratios help to maximize the available power
efficiency.
(x) Less sensitive to liquid slugging.
(xi) Suitable for wide variety of gases.
(xii) High ride quality and controllability.
(xiii) High speed operation over a wide range of operating pressures and flow rates
with high efficiencies.
Drawbacks (i) High volume of lubricant injected into a conventional screw compressor
reduces power efficiency due to the oil compression phenomenon and
increased stirring loss due to the presence of oil.
(ii) Power consumption during unloading operation is normally higher than that
of reciprocating type.
(iii) Issues such as rotor deflection, casing strength, intrinsic leakage and
technological deficiencies.
Applications
The rotary dual screw compressor package is ideal for numerous gas
compression applications including fuel gas boosting, general construction and road
building purposes and operating pneumatic tools. It has become a better choice in
textile, electronic and automotive sectors, iron and steel, food and beverage, tobacco
sector and petroleum refining and petrochemicals, vapour recovery, land fill and
digester gas compression and propane/butane refrigeration compression. It can be
applied for compression of corrosive and/or dirty process gas, poly-alpha-olefins,
poly-glycols, synthesized hydrocarbons and liquefaction of gases.
A rotary compressor package can also be used to upgrade existing
reciprocating compressor installations. By boosting low suction pressure, capacity
may be increased at minimum cost with continued use of existing reciprocating
12

equipment. If an application requires large volume flow rate at low suction pressure,
but discharge pressures greater than what the screw machine can provide, a
combination of screw and reciprocating units with a common driver can be a better
solution.
Materials
Oil injected screw compressors are built with different materials for its
components.
(i) Casing
Gray cast iron is generally used to manufacture casing for air and inert gases.
Cast S.G iron is used for compression of hydrocarbon and other hazardous gases,
where site conditions/specifications permit a less expensive material than steel. Cast
carbon steel is necessary for clean hydrocarbon and other hazardous gases and even
sour and/or wet gases.
(ii) Rotors
The rotors are normally made of ferrous materials. Aluminium and plastics
are feasible in certain applications. Forged carbon steel is used for air and most gas
applications. In many cases, S.G (nodular) iron is also acceptable. Forged high alloy
steel is preferred (typically 12-13% Cr, 4-5% Ni) for corrosive, sour and wet gases.
1.3 Geometry of Screw Compressor The rotors of a twin-screw compressor are a form of helical gears with
parallel axes and a uniform lead. The rotors make line contact and the meshing
criterion in the transverse plane perpendicular to their axes is the same as that of
spur gears. Two intermeshing rotors are housed in a suitable casing to achieve
compression. Different views of compressor rotors and casing are shown in Figure
1.4 for better understanding of the geometry.
The rotors intermesh in the dual bores of a one-piece cylinder. The space
between any two successive lobes of each rotor and its surrounding casing forms a
separate working chamber of fixed cross sectional area. The length of working
chamber varies as rotation proceeds due to displacement of the line contact between
13

the two rotors. The volume is maximum when the entire length between the lobes is
unobstructed by the meshing contact between the rotors and has a minimum value
of zero when there is full meshing contact with the second rotor at the discharge
end. The two meshing rotors effectively form a pair of helical gear wheels with their
lobes acting as teeth. The casing provides gas inlet passages, oil injection points, and
compression zone and discharge ports. Rolling element bearings located near the
ends of the rotor body support the screws.
Majority of screw compressors are still manufactured with four lobes in the
main (male) rotor and six lobes in the gate (female) rotor with the same outer
diameter. This configuration is a compromise having favourable features for both dry
and oil injected compressor applications and is used for air and refrigeration or
process gas compression. However, other configurations like 5/6 and 5/7, and more
recently 4/5 and 3/5, are becoming increasingly popular. A configuration with five
lobes in the main rotor is suitable for higher pressure ratios, especially when
combined with larger helix angles. The 4/5 arrangement has emerged as the best
combination for oil injected applications with moderate pressure ratios. The 3/5
configuration is favoured in dry applications, because it offers a high gear ratio
between the gate and the main rotors, which may be taken advantage of to reduce
the required drive shaft speed.
However, the efficient operation of screw compressors is mainly dependent
on proper rotor design. Most commonly used rotor profiles are shown in Figure 1.5.
An additional and important requirement for successful design of all types of
compressors is an ability to predict accurately the effects of the change in any design
parameter on performance. The main requirement of these types of compressors is
to improve the rotor profile so that the flow area through the compressor is
maximized while the internal leakage areas are minimized. Also, the internal friction
due to relative motion between the contacting rotor surfaces should be made as
small as possible.
Compressor designs have evolved gradually over half a century and the
present trend is to realise smallest possible machines still meeting the required
performance. This means, the rotor tip speeds are to be as high as possible with the
limits imposed by efficiency requirements. Rolling element bearings are to be used to
permit the smaller clearances than journal bearings. Similarly the ports are to be
14

made as large as possible to minimize suction and discharge gas speeds, and
consequent pressure losses.
Figure 1.4: Different views of meshing screw rotors and casing [5]
An efficient screw compressor needs a rotor profile which has a large flow
cross-section area, short sealing line and small blowhole area. The larger the cross
sectional area, the higher is the flow rate for the same rotor size and rotor speed.
Short sealing lines and smaller blowhole area reduce leakages. Higher flow rates and
smaller leakage rates increase compressor volumetric efficiency. This, in turn,
increases the adiabatic efficiency because less power is wasted to compress
internally recirculated leakage gas.
Precision manufacture permits rotor clearances to be reduced, but the
likelihood of direct rotor contact is increased despite oil flooding. Hard rotor contact
leads to the deformation of the female rotor due to increased contact forces, and
ultimately leads to rotor seizure. Hence, the screw profile should be designed in such
a manner that the risk of seizure is minimized. The clearance between the rotor and
15

the housing, especially at the high-pressure end, must be properly selected. This in
turn requires either expensive bearings with smaller clearances or cheaper bearings
with their clearances reduced to an acceptable value by preloading.
Oil injected screw compressor which operates with high pressure difference is
heavily loaded by axial and radial forces, which are transferred to the housing by the
bearings. Rolling element bearings are normally chosen for small and medium screw
compressors and these must be carefully selected to obtain a satisfactory design.
Usually two bearings are employed on the discharge end of the rotor shafts in order
to absorb the radial and axial loads separately. The contact force between the rotors
is determined by the torque transferred between them and is significant when the
rotors make direct contact. It is relatively small when the compressor drive is
through the main rotor. If the drive is through the gate rotor, the contact forces will
be substantially larger and as far as possible, this arrangement should be avoided.
The oil used for sealing the gaps is also used for bearing lubrication.
Generally the oil supply to the bearings is separate to minimize frictional losses. Oil is
injected into the compressor chamber at the place where thermodynamic
calculations show the gas and oil inlet temperatures to coincide. The position is
defined on the rotor helix for locating the injection hole located so that the oil enters
tangentially in line with the female rotor tip to recover the maximum possible oil
kinetic energy.
To minimize the flow losses in the suction and discharge ports, the suction
port is positioned in the housing in a manner that lets the gas enter with the fewest
possible bends and the gas approach velocity is kept low by making the flow area as
large as possible. The discharge port size is determined by estimating the built-in-
volume ratio required for optimum thermodynamic performance. The discharge port
position is so adjusted as to reduce the exit gas velocity to minimum to obtain the
lowest internal and discharge flow losses. The casing should be carefully
dimensioned to minimize its weight containing reinforcing bars across the suction
port to improve rigidity at higher pressures.
1.4 Design parameters
The performance of a screw compressor depends on a large number of
design parameters. Knowledge of the effect of these parameters can help a designer
16

select the best performing machine for a given application. It can be improved
considerably by proper selection of some of the important design parameters which
influence the performance.
4/6 Asymmetric profile “D” Predominantly used for small oil injected compressors
4/6 Symmetric profile Predominantly used for oil free compressors
4/6 Asymmetric profile “A” Predominantly used for larger oil injected compressors
3/4 Asymmetric profile Used for high volume flow, low differential
pressure applications
6/8 Asymmetric profile Used for high differential
pressure and reduced volume flow applications
5/7 Asymmetric profile Used in place of 4/6 for smaller rotor diameters
to improve shaft rigidity
Figure 1.5: Illustration of the most commonly used rotor profiles [1]
Cycle of operation
The compression process in a screw compressor is similar to that of a
reciprocating compressor, but it does not suffer re-expansion at the end of
17

compression cycle from clearance volume. Its p-v diagram is, therefore, very simple
and it is similar to the reciprocating compressor without clearance volume as shown
in Figure 1.6.
Suction
Compression
Discharge
2
34
1
P
V Vmax 0
Figure 1.6: p-v diagram for reciprocating and screw compressor.
The process 1-2 is the suction process which takes place for one revolution of
male rotor. The inducted gas volume of one pair of grooves is the sum of the
volumes of male and female rotor grooves. Unlike that in a reciprocating compressor,
the suction process in the screw compressor is simultaneously carried out with
compression and discharge processes. While a part of a groove is in the suction
stage, the rest of the groove undergoes compression. The phenomenon is depicted
in Figure 1.7 on a p versus θm plot for better understanding, θm being the angular
rotation of the male rotor. The figure shows that the compression and discharge
processes occur simultaneously, the suction process for one revolution of the male
rotor starting from the entrapment point ‘1’ and ending in ‘2’. The compression
process occurs between points ‘2’ and ‘3’. The point ‘3’ is the beginning of discharge
process where the pair of compression cavities of the male and female rotors
uncovers the discharge port. The point ‘3’ determines the built-in volume ratio on the
V-axis and built-in pressure ratio on the P-axis of p-v diagram.
18

1
3 4
2
00 2π
P Compression
Discharge
Suction
θm
2
Figure 1.7: P-θm diagram for twin-screw compressor.
Built-in volume ratio and internal pressure ratio Unlike reciprocating compressors, the screw compressor does not have
valves. The location of the discharge port determines the maximum discharge
pressure level that can be achieved in the screw threads before the compressed gas
is pushed into the discharge pipe. Being a positive displacement machine, the
pressure rise across the compressor is determined by the built-in volume ratio. This
volume index (vi) determines the internal pressure ratio of the compressor. For gas
compressors, an approximation of the internal pressure ratio (πi) is obtained from the
relationship πi = (vi) k [6]. Only the suction pressure and the internal volume or built-
in volume ratio determine the internal pressure level in the trapped pocket before
the gas enters the discharge port.
Compressors that have only axial ports will have fixed volume ratios. The
built-in volume ratio can be changed by changing the size or location of the
discharge port. Another way to change the volume ratio is with the help of a slide
valve. For these compressors, the volume ratio can be varied according to
requirements while the compressor is in operation, to get better part-load efficiency.
A smaller discharge port also increases the volume ratio by holding the gas inside the
flute space longer than larger that held by a discharge port. The longer the gas is
held inside the flute space before it is allowed to communicate with the discharge
line, more rotation, more volume reduction and more pressure ratio occur.
19

For best efficiency, the volume ratio should be so set that the internal
compression ratio matches the system compression ratio. If the internal compression
ratio does not match the system compression ratio, the result is either over
compression or under compression. If the internal volume ratio of the compressor is
too high for a given set of operating conditions the discharge gas remains trapped
longer, leading to pressure rise above the discharge pressure. This is called over
compression and is represented in the p-v diagram in Figure 1.8. In this case, the
gas is compressed to a value above the discharge pressure and when the discharge
port opens, the high pressure gas in the screw flutes expands out of the compressor
into the discharge line. This takes more energy than that required if the compression
had been stopped sooner when the internal pressure was equal to the system
discharge pressure.
If the internal volume ratio is too low for a given set of operating conditions,
the gas pressure in the trapped volume remains below the desired discharge
pressure. In this case, the discharge port opens before the set internal pressure of
the compressor pocket reaches the system discharge pressure. The high pressure
gas from the discharge line flows back into the flute space, equalizing the flute
pressure that must be compressed again. This has been shown in Figure 1.9. Extra
work is required to compress the same gas twice. Generally over-compression is less
efficient than the under-compression. In over-compression, extra work is done on
the entire flow stream, while in under-compression, extra work is done only on the
gas that backflows into the flute space from the discharge line.
Maximum inlet (suction) pressure
Due to the availability of high volume ratio, the internal pressure ratio (πi) in
a screw compressor can be high. If the maximum allowable design discharge
pressure is Pd(max), the maximum permitted inlet/suction pressure Ps(max) may be
estimated by the relation given by Stocker [7].
ki
ds V
PP
)((max)
(max) = (1.1)
The index k being the ratio of specific heats of gas
20

Figure 1.8: Example of over compression [8]
Figure 1.9: Example of under compression [8]
Oil injection considerations For optimum efficiency, internal clearances within the screw compressor must
be kept as small as possible. However due to the presence of large quantity of oil
during compression process, there is less chance of contact between the rotors and
casing. As the oil serves as a sealant, the rotor radial clearance to diameter ratio can
be selected suitably for the oil gas mixture. It has been seen that the presence of
more oil in the compression chamber, covering all the metal surfaces, acts as a
21

significant barrier to corrosion by the gas to be compressed. This feature has
permitted the compressor to be used with gases containing sulphides and chlorides.
Another important feature of oil injected compressors is that the oil acts as a
noise damper. This provides major advantages over the oil free type compressor. It
is quite common in oil injection machines that the oil is supplied through a single
connection and from there it is fed to the various points of use. As the injected oil
acts as a coolant, the main rotor can be allowed to rotate at higher tip speeds.
Rotor circumferential velocity (tip speed)
The efficiency loss due to oil shear resulting in foaming and churning is a
major design concern in oil injected compressors. As a result, these compressors are
operated at lower speeds than oil free compressors. For optimum efficiency,
circumferential velocity of oil screw compressors should preferably be in the range of
30-35m/s for larger compressors and 20-30m/s for smaller ones.
Number of lobes and compressor size
Based on research and experience, it has been proved that the smaller
number of lobes increases the rotor volume and thus the air end size for a given
displacement. Also, there is a distinct difference between female and male rotor
lobes, nf-nm=2 and nf-nm=1 profiles. The former require considerably larger rotors for
a given displacement. This happens, because in one revolution of the male rotor, two
of the female cavities are idle and not taking part in the suction or compression
process for the same displacement.
Number of lobes and rotor stiffness
Rotor stiffness is an important parameter since it may limit the maximum
operating pressure. As the stiffness is a strong function of the groove depth on
rotors, the profiles with nf-nm=2, the female rotors are almost equal in size to the
male rotors and thus inherently much stiffer.
Number of lobes and discharge port velocity
The discharge port velocity generally decreases with increase of number of
lobes. This means that the discharge port losses are higher for profiles with less
22

number of lobes. Also, at higher tip speeds, where discharge port losses become
significant, the profiles with a lower number of lobes will have poor performance.
Lobe combination
Profiles with lobe difference of ‘1’ have marginally better performance than
those with differences of ‘2’ at all tip speeds. Based on experimentation and analysis
[9] it has been proved that the 5/6 profiles have all the attributes of a good lobe
combination in terms of performance, strength, and size. The performance of 3/4
combination profile at high tip speed can be improved considerably by early opening
of the discharge port. Thus each design should be optimized according to the
individual application.
Wrap angle The decrease in male wrap angle has two effects: the discharge port size
increases and the overlap constant decreases. When the wrap angle becomes large,
the blowhole expands and the discharge port contracts. Therefore, the internal
leakage mass which will re-circulate in the grooves increases and the flow resistance
across the discharge port becomes higher. It is evident that the indicated torque
increases as the wrap angle becomes smaller, corresponding to the increase in
leakage losses. The volumetric efficiency does not vary much as the wrap angle
changes. However, the adiabatic efficiency decreases as the wrap angle decreases.
L/D ratio
The relative merits of equal and unequal rotor diameters are mostly a
function of manufacturing considerations than the design. Only profiles with lobe
combinations differing by ‘2’ can be practically made to have equal rotor diameters.
This forces the manufacturer to select larger female addendum, which generally
results in a large blowhole. A small L/D ratio means larger diameter rotors for a
given displacement and larger leakage areas. At higher tip speeds, the leakage areas
begin to have less influence and performance for all L/D ratios tend to cluster
together. L/D ratios of 1.65 and 1.8 have shown the best overall performance.
23

Opening the discharge port early One method of improving the performance is to open the discharge port
early, i.e. to reduce the built in pressure ratio. This has the effect of increasing the
discharge port size at the cost of some back flow compression. However, at higher
tip speeds, gas inertia tends to overcome this back flow effect and significant
improvement in performance can be achieved. The optimum built in pressure ratio
and the other parameters such as discharge port opening angle is function of profile
shape, number of lobes, wrap angle, and L/D ratio. Thus, it is necessary to
determine the optimum opening angle according to profile shape and operating
conditions.
Symmetric and asymmetric profiles
There have been extensive rotor profile developments in recent past.
Symmetric rotor profiles are predominantly used for oil free screw compressors. The
symmetrical circular arc profile in general has large blowhole area. It is always
desirable that the rotor profile has smallest blowhole area. Oil injected screw
compressor rotors have universally asymmetric rotor profile designs. These types of
profiles have shorter sealing lines and smaller blowhole areas.
1.5 Performance Parameters
Efficient operation of screw compressor is mainly dependent on proper rotor
design as discussed above. An important requirement for the successful design of a
compressor is the ability to accurately predict the effect of design parameters on
performance. Optimum rotor profile, oil injection rate and temperature may
significantly differ when compressing different gases or vapours and when working in
oil free or oil injected mode of operation.
It is difficult to calculate performance figures from first principles, as the oil is
mixed with the gas being compressed. All currently available selection methods are
based on empirical data derived from extensive testing on closed loop test rigs. The
operation of any compressor requires an input of mechanical work. Most of this
mechanical work is eventually converted to heat, principally the heat of compression
and also mechanical and aerodynamic friction resulting from the operation.
24

The power and volumetric efficiencies of a compressor depend on inlet
temperature of gas and coolant used. The volumetric efficiency mainly depends on
internal leakage and inlet conditions of oil and gas. Although there are no pistons,
valves or clearance volume to affect the filling ratio, the leakage losses along the
rotors are important. The gas that leaks back to the suction side not only occupies
space but also is at higher temperature. It is obvious that the clearances between
the rotors and between the rotors and the barrel are important in minimizing the
leakage. An increase in clearance of 0.01mm results in decrease of 1% in volumetric
efficiency. The dimension of the oil stream also plays an important role on power
performance.
The male rotor diameter and its rotational speed determine the tip speed.
There is an optimum tip speed to achieve maximum efficiency for each built-in-
volume ratio. When the rotor speed is increased keeping the diameter constant, the
displaced gas volume per unit time increases and the losses per unit gas volume
become relatively smaller. As the losses due to friction and turbulence of the gas
increase, the adiabatic efficiency decreases.
The relation between rotor length and diameter has influence on efficiency.
Particularly at higher pressure ratios, the discharge port cross section becomes very
small and shorter rotor gives less discharge losses. The shape of rotor cross section
has considerable influence on the filling ratio. In fixed built-in volume ratio
compressors, the compression process always ends at the same point irrespective of
the line pressure. This happens when the inter lobe space comes into open contact
with the discharge port.
1.6 Objectives of the Investigation The present work aims at arriving at a better understanding of the suction,
compression and discharge processes in a twin-screw compressor, particularly the
thermofluid phenomena taking place inside the air end during these processes. For
understanding the thermofluid processes taking place inside the screw compressor, it
is necessary to build a numerical model and to validate it through experiments.
Based on this understanding, it is proposed to explore the possibility of using
commercially available low cost air compressors for compression of gases such as
argon and helium used in cryogenic process plants.
25

For the development of a numerical model, the governing differential
equations have been derived from control volume analysis for oil and gas separately.
The leakage of gas and oil has been critically analyzed based on the analogy of flow
through nozzle. Nozzle coefficients are adopted by matching experimental volumetric
efficiency with that from a numerical model. The heat transfer coefficient between
gas and oil is calculated from experimental observations on the variation of
volumetric efficiency with suction temperature. The derivation of governing
equations and the realistic implementation of leakage and heat transfer coefficient
formulas are some of the important features of the numerical model.
Experimental studies have been carried out on two commercially available
compressors using air, nitrogen, argon and helium as working gases. The effect of
volumetric and adiabatic efficiencies on air compressor to compress other gases are
evaluated and compared with the numerical model. The effect on efficiencies of the
variation of suction pressure, suction temperature, oil inlet temperature, oil injection
rate and pressure ratio are presented and the explanations are duly recorded.
To generate machine independent experimental data, two similar
compressors with different capacities have been chosen. No experiment is complete
without the estimation of the uncertainty in experimental error. An error analysis
procedure has been adopted to estimate the uncertainty in the experimental data.
1.7 Organization of the Thesis
The thesis has been arranged into seven chapters. Chapter 1 (this chapter)
deals with a general classification of compressors and introduction to the twin screw
compressor in more detail and enumerates the objective of the present investigation.
In chapter 2, a brief review of relevant literature covering theoretical and
experimental studies has been presented. Chapter 3 covers the basic principles of
operation, the suction and compression processes involved and the approach to
mathematical analysis.
Numerical solution of the governing equations of the oil injected twin screw
compressor is presented in chapter 4. The numerical model involves the variation of
thermodynamic properties of gas and injected oil during compression and discharge
process and also the estimation of power and volumetric efficiencies. The effects of
interlobe clearance, blowhole area, quantity of injected oil and its temperature, wrap
26

angle etc are included in the simulation study. A description of the experimental
apparatus and an uncertainty analysis are presented out in chapter 5. Experimental
studies on commercially available 37 kW and 5.5 kW oil injected twin-screw air
compressors are presented in chapter 6. Chapter 7, the final chapter, is confined to
some concluding remarks and for outlining the scope of future work.
27

Chapter II
LITERATURE REVIEW
Around 1928 gear theories applicable to gas compression were developed by
Nahuse of Tohoku University, Japan, and by the Russian engineer Novikov. These
theories, however, were not used practically in compressor technology at that time.
The first practical compressor was invented by Lysholm in 1934 and was mainly
developed by SRM (Svenska Rotor Maskiner AB) of Sweden. Lysholm’s compressor,
which had a 3/3 profile combination, was produced in 1934. By 1937, a 4/6 Profile
combination machine had been developed, and in 1938, such a compressor was
manufactured in collaboration with Lysholm by James Howden & company of
Glasgow, Scotland. Since the late 1950’s, it has received practical applications for
industrial use. The Scottish engineer Duncan Laing at James Howden & company
tested the first operating screw machine in 1955.
In the 1960’s, the twin-screw compressor come to existence, providing high
capacity with reduced size and cost, together with an option to operate with high
compression ratios allowing single stage systems for gas compression and low
temperature refrigeration requirements. More recently, there has been a lot of
research activity at the City University of London (at www.city.ac.uk) on methods to
improve rotor design as well as volumetric and adiabatic efficiencies. Despite the
rapid growth in screw compressor usage, public knowledge of the scientific basis of
their design is still limited. In this chapter, relevant published literature is reviewed
on the subject, focussing on design and performance.
Mathematical modelling, experimental validation, design of critical
components, complete screw machine design, product development, training in
machine design, advanced computerized design tools, machine process modelling, 2-
D and 3-D computational fluid dynamics, modern experimental techniques,

computerized data acquisition, rotor and compressor optimization are the essential
stages needed for appropriate screw compressor development [10-12]. Screw
compressor rotors of various profiles can be conventionally manufactured today with
small clearances at an economic cost and the internal leakages have been reduced to
a small fraction of their earlier designs
Screw machines have been used today for different applications both as
compressors and as expanders [11]. They operate on a variety of working fluids. The
working fluid may be gas, dry vapour, or multi phase mixture with phase change
taking place within the machine. These machines may operate oil flooded or with
other fluids injected during compression process. In the field of air and gas
compression, screw machines are continuously replacing reciprocating and vane
compressors and a dramatic increase in its applications in the field of refrigeration
compressors are expected in the next few years.
Comparative investigations between rotary and reciprocating compressors
have been presented by Kaiser [13] and by Villadsen [14]. In their experimental
investigations, various reciprocating and rotary compressors of comparable capacities
have been analyzed on the basis of their thermodynamic and mechanical losses. The
authors have explained the differences and have concluded that that both types of
positive displacement compressors have their own merits, and that they complement
each other to the extent that they may often be combined in one plant to obtain the
most energy efficient installation under variable operating conditions. Different
operational modes of twin-screw compressors have been explained by Sjoholm [15],
who concluded that screw compressors could be adapted to every specific need
without losing its favourable characteristics as a heavy-duty machine with high
performance.
2.1 Compressor Design
Screw compressor designs have gradually evolved through history and the
trend has been to realise as small machine as possible to meet the required
performance. This means that rotor tip speeds are as high as possible with the limits
imposed by efficiency requirements. Wherever possible, rolling element bearings
should be used to permit the small clearances necessary instead of journal bearings.
Similarly the ports are to be made as large as possible to minimize suction and
29

discharge gas speeds and consequent pressure losses. The oil injection port position
on the compressor casing is to set at the point where thermodynamic calculations
show the gas and oil inlet temperatures to coincide.
To minimize flow losses in the suction and discharge ports, the suction port
should be positioned in the housing so as to let the gas enter with the fewest
possible bends and the gas approach velocity kept low by making the flow area as
large as possible. The discharge port size is first determined by estimating the built
in volume ratio required for optimum thermodynamic performance. The casing
should be carefully dimensioned to minimize its weight, containing reinforcing bars
across the suction port to improve its rigidity at higher pressures. Bennewitz [16]
suggests a comprehensive method for design, manufacture and quality control using
computer assisted manufacturing.
Geometrical Parameters
Screw compressor rotor geometry plays a crucial role in its design and
performance. For a given application, there are a number of design possibilities. But,
normally only a few designs can adequately fulfil the basic requirements of reliability,
high performance and low cost. The rotor profile not only affects the performance
and torque distribution between the rotors, but also the axial and radial loads. The
important geometrical parameters of a compressor and their influence on
performance have been studied by Tang, Sjoholm and Singh [17-19].
Zhang and Hamilton [20] studied the effect of main geometric characteristics
such as compression volume curve, sealing line length, flute area, wrap angle and
blowhole area. Mathematical models of these parameters were formulated to
develop the manufacturing software. Tang and Fleming [17] studied the effect of
relative blowhole area and relative contact line length on performance and suggested
some methods for geometrical parameter optimization.
Singh and Bowman [9] examined the effect of some of the geometrical
parameters like number of lobes, wrap angle, L/D ratio and opening of discharge
port early for a particular profile shape. The authors focussed more attention on
fundamental aspects of the design process. Number of designs was created and their
dimensions were normalized to male rotor diameter of the 5/6 profile to get identical
displacement per unit revolution in all types of rotors. The authors applied
30

generalized mathematical modelling to calculate the geometrical characteristics and
presented the results. It has been observed from the results that the contact or
interlobe sealing line length increases strongly with the number of lobes, which has
an adverse effect on performance at low male rotor tip speeds and high pressure
ratio.
A parametric study on twin screw refrigeration compressor performance has
been carried out numerically by You et al [21] for optimum rotor geometry with four
commonly used lobe combinations and five different lengths to diameter ratios and
wrap angles. The four lobe combinations considered in the study are 4/5, 4/6, 5/6,
5/7; the length to diameter ratio ranges from 1.0 to 2.2, and the male wrap angle
ranges are from 2500 to 3000. Apart from performance parameters, factors like rotor
deflection, bearing load and its life and inter rotor contact forces are also included.
The influence of geometrical parameters has been discussed and suggestions on
choosing optimum parameter combinations presented. Female rotor deflection has
been calculated since it is several times higher than that of the male rotor. It has
been found that the 4/5 combination is an excellent choice since it has the smallest
size and lowest weight, while the 5/6 design has the lowest input torque. The
results, however, show that these two combinations have relatively larger deflections
than the 4/6 and 5/7 combinations.
The authors have concluded that 4/6 and 5/7 profile combinations are the
better choices for high pressure applications. Also, the 5/6 combination showed
relatively higher isentropic indicated efficiency for L/D ratios up to 1.7. The 5/7
combination showed that the performance of this combination is very close to that of
the 5/6 combination for L/D ratio above 1.7, and that their deflections are much
smaller as shown in Figure 2.1. It has been concluded that the 5/6 combination is
more appropriate for L/D ratio above 1.7, particularly for high pressure ratio
applications.
Rotor Profile Generation
Any design process can be made more reliable with mathematical modelling
and numerical simulation. With the advancement of computational facilities,
prototyping has been reduced to a minimum. The design of screw compressor is
interactive and the measured performance of the compressor has to be compared
31

with that specified in advance. Usually this is achieved by testing a prototype system
and modifying the design until it yields satisfactory results.
Figure 2.1: Variation of female rotor deflection with L/Dm ratio [21]
An efficient screw compressor needs a rotor profile which has a large flow
cross-section area, short sealing line length and a small blowhole area, to achieve
higher flow rate for the same rotor size and speed. Short sealing lines and small
blowhole reduce leakage. Higher flow and smaller leakage rates will increase
volumetric efficiency. This, in turn, increases the adiabatic efficiency, because less
power is wasted in the compression of leaked gas, which is re-circulated internally.
As precise manufacturing permits the rotor clearances to be reduced despite oil
flooding, the likelihood of direct rotor contact increase on reduced clearance. Hard
rotor contact leads to deformation of the female rotor due to increased contact
forces and ultimately rotor seizure. Hence, the profile should be designed so that the
risk of rotor seizure is eliminated.
Relatively few publications are available on screw compressor design since
their large scale manufacture began only in the early nineteen seventies as a result
of the introduction of the ‘A’ Profile by the Swedish company SRM. Arbon [1]
dedicated his book exclusively to twin shaft compressors and their applications with
limited details. Xing published a comprehensive book on this topic but it is written in
Chinese language and is generally not available outside China. Only recently, Stosic
32

et al [12] have published a book emphasizing mathematical modelling and
performance.
The common practice for generation of rotor profiles is to create a primary
profile on one of the screw rotors and to generate a corresponding secondary profile
on the other rotor using appropriate conjugate action criterion. Any curve can be
used as a primary one, but traditionally the circle is the most commonly used one.
The disadvantage of the classical profile generation methods is that they require
significant effort when selecting original curves and the effect of modifications in
design cannot easily be predicted. Zaytsev and Ferreira [22] proposed a profile
generation method based on line meshing. The method is analytically derived based
on the system of contact line, rotor coordinate transfer relations coupled with
meshing conditions. The method is such that, as soon as the solution of the meshing
condition is obtained, both rotor profiles are automatically generated.
Stosic and Hanjalic [23-26] presented a general algorithm for generation of
screw rotor profile and related machine geometry. The method is convenient for the
design of screw rotors as well as for improvement of existing rotors. A rack based
procedure, capable of generating modern screw rotor profiles has also been
included. The main advantage of the algorithm lies in its simplicity, and its capacity
to enable ordinary mechanical engineers to create a variety of profiles, a privilege
which was previously shared only by a limited number of exclusive specialists. The
conjunctive condition has been solved numerically, thereby introducing a variety of
primary arc curves. The approach has simplified the design procedure since only
primary arcs need to be given, the secondary arcs being automatically generated.
Singh and Onuschak [27] developed a rapid, flexible and comprehensive
computer assisted technique to analyze twin-screw rotor profile generation methods.
The strength of this method lies in the reduction in time taken by the whole process
from profile generation to performance prediction. This powerful profile generation
tool can be used in many ways. It has been instrumental in inventing and analyzing
entirely new profiles and modifying existing profiles to match particular applications,
optimizing geometrical parameters of machines and understanding the importance of
different leakage areas and power loss. It has also been used for generating input
data such as contact line length and blowhole area for performance prediction
programmes. The flow chart of program sequence used for profile generation is
shown in Figure 2.2. The model has been used several times successfully for all kinds
33

of applications including analysis and evaluation. The profile types investigated had a
wide range of shapes, number of male/female lobes (3/4 to 6/8 and in between),
wrap angles (150 to 3500), L/Dm ratios (0.8 to 2) and built in pressure ratios (4 to
10).
Profile sketch
Pre-Generation Programs
Profile Generation Program
Profile Plot Program
Seal line length Program
Cavity area and rotor inertia program
Discharge port loss program
Blowhole area Program
Filling-Discharge curve Programs
Performanceprogram
Figure 2.2: Flow chart of computer program to generate screw profile [27]
New designs of rotor profiles have been introduced [28] considering modern
design concepts such as larger opening of the suction port and early exposure of the
discharge port together with improved bearing systems and seal specifications to
maximize work efficiency. Prototype compressors have been tested by the authors
and compared with the best compressors currently available in the market. The
maximum measured specific power input at a delivery pressure of 8 bar was 5.6 kW
/(m3/min), which was less than the published value for any other equivalent
compressor manufactured at that time.
McCreath et al [29] have published a paper that describes the development
of two highly efficient oil free screw compressors designed for dry air delivery. Their
34

design is based on the use of rack generated 3/5 rotor profiles. The optimum rotor
size and speed, together with the shape and position of the suction and discharge
ports, were determined by mathematical modelling. The model took full account of
the limitations imposed by selection of bearings and seals required to maximize
endurance and reliability. Xing et al [30] developed a software package to design
twin-screw compressors. The package was used to calculate the rotor profile,
geometrical characteristics, thermodynamic performance, and forces on rotor teeth,
rotor shape and cutter shape. A user friendly interface and some powerful post
processing programs were also included in the package. The same package has been
used for improving the performance of an existing machine.
Rotors of helical screw compressors present a challenging manufacturing
problem. This is due to complex profiles and the fine tolerances necessary for
machining the minimal running clearances required for efficient operation. The rotors
may vary in length to diameter ratio, male to female diameter ratio, male to female
lobe ratio, diameter, profile, and host of other parameters. Mould et al [31]
presented a method which proceeded directly from an analytical description of the
profile to a computer generated cutter template using a numerically controlled
contouring grinder having an accuracy and repeatability in the region of 1 µm. They
present a method for describing the tool paths in CNC machining starting with the
mathematical theory of the design of milling cutters.
Zhou [32] developed a computer aided design method for profile generation,
meshed line and contact line plotting, generation of pressure distribution diagram,
blowhole area calculation, and milling cutter profile calculation and plotting. Xing et
al [33] introduced a new theoretical approach and practical application of a CAD
system to machining of twin-screw compressor rotors. It comprises of procedures for
calculation of geometrical parameters of rotors, simulation of the compressor
working process and optimization of the design parameters. The design process has
been used to determine the manufacturing and operating parameters for several air
and refrigeration compressors.
Computerized design, profile generation and simulation of meshing of rotors
have been done by Faydor and Feng [34]. They have covered the conjugation of
surfaces, investigation of influence of misalignment on the backlash between the
surfaces, synthesis of rotor surfaces with two lines of contact and avoidance of
singularities. Fluid leakage across the contact line between two conjugate helical
35

surfaces is the major concern in terms of machine efficiency. To characterize the
geometrical shape of the leakage path and to find the contact line, an average
comprehensive radius of curvature (ACRC) analysis has been proposed by Xiao et al
[35,36]. A numerical approach is accordingly developed which is suitable for
microcomputer implementation and used as a part of the CAD and performance
analysis package for screw compressors.
Design Optimization
Continuous increase in demand for efficient screw compressors requires that
the designs are tailor-made to address to varying duty, capacity and manufacturing
capability. A suitable procedure for optimization of screw compressor shape,
dimension and operating parameters needs to be developed which will lead to the
most appropriate design for a given compressor duty. An optimization technique has
been developed [37] and applied to the design of refrigeration twin-screw
compressors. The authors also measured the operating parameters as well as rotor
and compressor parameters such as wrap angle, L/D ratios and slide valve
specifications. You et al [38] gave special attention to the male rotor crest range
angle and female rotor addendum, since these parameters have a greater influence
than all other rotor tip parameters on optimum lobe tip design. Xing et al [39] carried
out research on the design of a new generation of refrigeration compressors. The
rotor profile and other design parameters were optimized with the help of the
software package SCCAD.
Stosic et al [25, 28, 40, 41] carried out the design of a family of efficient oil
flooded twin screw air compressors using a software package which included almost
every aspect of rotor profiling and compressor thermodynamic and geometric
modelling with the capacity to transmit calculated output directly into a CAD drawing
system. They have also designed a family of highly efficient screw rotors based on
rack-generated profiles as shown in Figure 2.3, which can be used to replace
standard asymmetric profiles. Optimization of a single stage compressor for oil-free
and oil-flooded air compression and refrigeration applications has been developed by
the authors as shown in Figure 2.4. These profiles are compared in Table 2.1. The
results of multivariable optimization, the calculated compressor profiles and design
parameters must, however, be considered with extreme caution. This is because,
36

multivariable optimization usually finds only local minima, which may not necessarily
being the best optimization result globally. Therefore, extensive calculations have
been carried out by Stosic et al [41] before a final decision on the compressor design
has been made.
Figure 2.3: Optimized Screw Rotor Profile Designs [25]
Figure 2.4: Rotor profiles optimized for oil-free and oil-flooded air and refrigeration compressor duty [41]
37

Table 2.1: Results of optimization calculations for dry and oil flooded air compressors and oil flooded refrigeration compressors [41]
Parameters Dry air Oil-flooded air Refrigeration
r0 [mm]
r1 [mm]
r2 [mm]
r3 [mm]
Built-in volume ratio
Rotor speed [rpm]
Oil flow [lit/min]
Injection position [o]
Oil temperature [oC]
2.62
19.9
6.9
11.2
1.83
7560
-
-
-
0.74
17.8
5.3
5.5
4.1
3690
12
65
33
0.83
19.3
4.5
5.2
3.7
3570
8
61
32
Rotor Forces
Screw compressor rotors are normally subjected to severe pressure loads.
The rotors, as well as their bearings must satisfy the rigidity and elasticity
requirements to ensure reliable compressor operation. Bearings that support the
rotors are basically considered to be ideal, under simply-supported boundary
conditions. Some studies on rotor dynamics have shown that the behaviour of the
rotor bearing system is, to some extent, controlled by the bearings that support the
rotor. Therefore, it is important to study the dynamic performance of the rotor
bearing system of screw compressors to ensure safe and long term operation. The
rotor journal bearing system of a screw compressor has been numerically analyzed
by Stosic and Hattori [42-44]. The analytical procedure to estimate the reliability and
to optimize the bearing design has been described.
(i) Contact forces
Zhou et al [45] presented an improved method to determine axial and radial
forces applied to the helical rotors of a refrigeration compressor. The axial force
consists of two parts: the force applied to the end surfaces and the force applied to
the helical profile surfaces. The radial force also consists of two parts: the force
applied to the non contact segments and the force applied to the contact segments.
38

The authors have used the results for bearing design and rigidity calculation. The
computation and plotting procedure includes the generation of profile, pressure
distribution curves, rotors’ meshing curves and the rotors’ contact curves. The axial
and radial forces of a prototype compressor have been calculated and compared with
experimental results. The improved method of rotor force calculation derived by
Zhou et al has the features of speed, flexibility, accuracy and visual display of results.
This computer assisted technique has been used for different rotor profiles and for
different refrigerants at different ratings. Experimental studies of compressor noise
and vibration in addition to distribution of static forces have been presented by
Fujiwara et al [46].
Adams and Soedel [47] have presented a classical model for computing rotor
contact forces. Compression loads have been incorporated with contact forces to
determine the bearing loads. The newly developed model allows only one rotational
degree of freedom for each rotor. Backlash type clearance has been considered
between the contact points in the rotor meshing zone. In addition, a method has
been worked out for computing the motion due to transitions between the states.
The equations have been solved using Runge-Kutta integration algorithm with time
as the independent variable and the rotor angular positions and velocities as the
dependent variables. The simulation has been implemented with a typical set of
compressor parameters and the resulting bearing forces have been computed. The
test results indicated that the compression loads, as compared to the contact forces,
dominate the resulting bearing forces.
(ii) Bearing Forces
A recent study [47] has shown that compression loads dominate the bearing
forces in comparison with contact forces between the rotors. The simplest way to
compute the compression loads is to utilize some of the assumptions [45] to simplify
the complex geometry of the rotor profile. Since the compression loads depend
mainly on the rotor profile and pressures at the suction and discharge ends, this
simplification affects the magnitude of the computed compression loads.
You et al [48] presented a suite of programs, which provides a generalized
method for calculating bearing loads of a screw compressor. The method is based on
analysis of geometric characteristics and incorporates a performance prediction
program which can handle different rotor profiles, port designs, working media and
39

operating conditions. All the factors which influence the bearing loads have been
taken into account including rotor contact, axial forces due to gas leakage across
rotor end faces and description of gas pressure forces on helical screw surfaces.
Typical results of bearing loads are presented in Figures 2.5 and 2.6 as a function of
male rotor rotation angle. Studies on the rotor dynamics have shown that the
behaviour of a rotor bearing system is, to some extent, controlled by the bearings
that support the rotor.
Figure 2.5: Variation of bearing loads with male rotor rotation [48]
Oscillating bearing loads occur even in the absence of rotor chatter due to
several effects. Adams et al [49-51] have presented a numerical method for
computing compression loads by integrating the pressure forces on rotor surface. In
addition, a dynamic model of a rigid compressor supported by two cylindrical roller
bearings and a four point contact ball bearing is developed from basic principles to
analyse noise and vibration. Compression induced rotor bearing loads change with
that in operating conditions. The authors have developed a generalised procedure for
compression load calculation based on the geometry of the rotor profile and
pressures at the suction and discharge ends by mapping the 3D rotor surface into a
2D region.
40

Figure 2.6: Variation of maximum bearing loads with volumetric capacity [48]
2.2 Performance
Being a positive displacement machine, a screw compressor has performance
characteristics similar to those of a reciprocating compressor. The entire volume of
gas is discharged after compression because there are no clearance pockets. The
interlobe space of the screw compressor corresponds to the swept volume of the
reciprocating compressor. Compressor designers often predict performance of
machines of different sizes but of similar type or belonging to the same family. The
machines essentially have the same operating conditions (suction, compression and
discharge processes). However, they may differ in volume displacement. Obviously,
testing to evaluate performance of various compressors of a given family is a time
consuming and expensive process. Generally, performance analysis programs are
employed to predict and optimize the performance prior to embarking on costly test
programs.
Analysis of compressor behaviour under part load operation has been
facilitated by recent advances in mathematical modelling and computer simulation.
By this means, the earlier approach of process analysis and optimization by intuitive
changes, verified by tedious trial and error testing, has been be eliminated. As a
result, the design of screw compressor flow control systems has substantially evolved
41

over the past few years and is likely to lead to further improvements in system
performance in near future.
In most refrigeration systems the compression load varies significantly during
operation. For optimum performance of the systems, compressors are to be operated
efficiently over a wide range of loads for long periods. Capacity control is one of the
most important aspects of compressor operation under these conditions. Stosic et al
[52] modelled the methods of shaft speed variation, suction throttling and variation
of suction volume using slide valve mechanism. Capacity control analysis has been
carried out on screw compressors with 5/6 and 5/7 “N” rotor profiles for air and
refrigeration compressors.
Compressor capacity control strategies minimize energy consumption. There
are several methods of controlling capacity. A pulse width modulation capacity
control mode has been analyzed and a cascade of capacity control for one and a
group of compressors have been suggested by Alyokhin et al [53]. This type of
capacity control method, using mathematical model and electronic control system,
has resulted in considerable energy saving in refrigeration plants. The behaviour of
the compressor at different operating conditions has also been studied by Alyokhin,
Sjoholm and Sauls [53-55] using various capacity control methods.
Performance Prediction
Numerical modelling is an effective way of reducing experimental cost in
research and development. Performance modelling and simulation of rotary
compressors has been developed by several authors [56-67] to predict detailed
behaviour with sufficient accuracy to investigate the dependence of performance
parameters on design factors. A computer program for oil free screw compressors
has been developed by Barblik et al [57] which provides a quick, simple, and
accurate environment for modelling and analyzing their performance. The
mathematical model developed provides a single database for performance,
optimization of design parameters and statistical analysis which have been used for
the development of the compressor.
Performance analysis of compressors has been discussed in detail by Fujiwara
et al [64-66]. The flow and heat transfer coefficients required for computer
simulation have been obtained experimentally and used in the numerical simulation.
42

The flow coefficients required are calculated from the efficiency versus clearance
curves. Singh and Patel [67] have published a generalized computer program to
predict the performance of screw compressors. It includes all leakages, viscous shear
losses, oil cooling, and inlet and discharge losses. A mathematical model considering
the effect of real gas properties has been presented by Xiao and Sangfors [68, 69]
which predicts the effect of factors such as gas leakage, heat exchange between gas
and oil and flow resistance at discharge port on the performance of the compressor.
Peng et al [70] have presented a paper on the basic geometry and
engagement characteristics of rotor profile. Two types of new profiles have been
generated, all the characteristic parameters of rotor profiles are derived and
construction parameters are optimized. Oil compression phenomenon occurs at two
portions of conventional compressors and degrades their isothermal efficiency. A new
screw rotor profile and a new lubricant have been developed by Kishi et al [71] to
avoid the oil compression phenomenon.
In the past, compressor performance parameters were computed from
operating data by varying the rotation speed and pressure ratio to match each rotor’s
outer diameter and built in pressure ratio. However as it was not practical to
measure the pressure rise phenomena inside the rotor grooves, this method was not
useful to study tooth profile or improvements in the discharge and suction ports.
Kivotada [72] analyzed compressor performance based on indicator diagram and
determined the conditions inside the grooves. A small pressure sensor was built into
the tooth root on the discharge side of the female rotor. The pressure change in the
groove was measured from the midpoint of the suction process to the completion of
the discharge. Indicated diagrams were collected for a single stage cycle and the
indicated horsepower was calculated and the performance analyzed.
Responding to demands of practical application, Zhang et al [73] carried out
a series of performance tests on a twin-screw compressor with 3.5 m3 /min free air
delivery at discharge conditions under various operating parameters. They
investigated several screw compressor basic parameters with air as working gas and
presented many new ideas on screw compressor design.
43

Thermal Analysis
The compression process in a screw compressor is usually described by a
range of algebraic relations obtained by the integration of the generalised continuity,
momentum, and energy equations. The optimum design is sensitive to the correct
selection of design and operating parameters which govern the thermodynamic and
flow processes within the machine. Oil and other fluids may be injected and wet
vapours may be compressed. Under these circumstances the compression process is
better described by means of an open system covering fluid admission, discharge
and leakage processes. The mathematical model gives an equation for the
instantaneous operating volume that change with rotation angle or time, together
with the differential equations for conservation of mass and energy.
Mathematical modelling and computer simulation of compressor operation
have now reached such a stage that much of the traditional trial and error
experimental approach to design, still widely used in the compressor industry, is no
longer necessary. There have been many approaches to thermodynamic modelling of
screw compressors. One of them is modelling of the compression process within a
rotor pair. Compression process modelling can be carried out under a variety of rotor
geometries, discharge port options, rotor and housing clearances and oil or liquid
refrigerant injection. Clearance options include variations in rotor to housing
clearance which is a function of position within the housing, variations in rotor-to-
rotor clearance along the length of the rotor, rotor to slide valve clearances and rotor
discharge end clearances. Porting options include separate radial and axial discharge
ports with geometries computed from specified volume ratio and automatic
adjustment of radial port geometry for slide valve unloading systems.
Modelling and simulation of rotary compressor was adopted by Mark et al
[56] to investigate the performance sensitivity of design parameters with sufficient
accuracy. Sauls [74] developed a comprehensive thermodynamic modelling system
for refrigeration compressors. He suggested a combination of analytical and
experimental methods leading to a complete thermodynamic model with emphasis
on methods for inspection of experimental and assembly analysis to determine actual
clearances in a specific test compressor.
The surfaces enclosing the compression cavity are the housing bore, the end
plates and the helical surfaces of the rotors. The process of heat exchange between
44

the gas and the cavity surfaces is complex, not only because the surface area
changes as a function of rotation angle but also because the locations change during
the process. A mathematical model for describing the thermal interaction between
the gas under compression and the rotors is presented by Ignatiev et al [75].
Simultaneous influence of the geometrical and the physical characters of the screws,
the working process, the thermophysical properties of the fluid, the influence of
different operating parameters and the analysis of rotor thermal distortion have been
included in the model.
A complete mathematical model with computer programs has been presented
by Alday and Hood [58]. Their model provides a quick, simple and accurate
environment for modelling and analyzing the thermodynamic performance of a screw
machine. The program provides a single database for performance optimization and
statistical analysis that can be used for the development of new compressors. Wu et
al [76] have proposed a new mathematical model for generating indicator diagrams
of refrigeration twin screw compressors. The effect of internal leakage, oil injection,
gas-oil heat transfer, refrigerant property and partial loading are taken into account
both simultaneously and separately. The model has been verified by experimental
recording of p-v indicator diagram. Haugland [77] developed a pressure indication
system to monitor pressure at different locations in the compressor cavity that
helped in verifying the simulation model.
Stosic et al [78-80] describe a numerical model of thermodynamic and fluid
flow processes, which is valid for both the compressor and the expander mode of
operation. It includes the use of the equations of conservation of mass and energy
applied to an instantaneous trapped volume within the machine with allowances for
fluid leakage, oil or other fluid injection, heat transfer and real fluid properties.
Oil Injection and Heat Transfer
Compressor performance is influenced both by the refrigerant and by the
type of lubricant used. Thermodynamic efficiency of the compression process
depends greatly on the oil to gas heat transfer. The oil-injected type screw
compressor uses a relatively large mass of injected oil to lubricate the rotor motion,
seal the gaps and reduce the temperature rise during compression. Heat transfer
between oil and gas primarily occurs by convection. The heat transfer coefficient is a
45

function of injection parameters. To enhance it, the characteristic size of the oil
droplet should be as small as possible. For this purpose, oil should be atomized into
small droplets by generating an oil spray. The residence time of the droplets in the
compressor cavities depends on the compressor rotational speed and is generally
measured in milliseconds. The time the jet surface is exposed to the temperature
difference is even smaller in oil jet injection type compressor. Therefore, it is
essential to have a clear understanding of the oil injection process, particularly the oil
mist injection system.
Singh and Phillips [81] developed a mathematical model to calculate the heat
transfer rate between oil and gas assuming that the oil is injected in the form of non-
intersecting spherical droplets. They calculated the droplet trajectories from the point
of injection to the point where the droplet hits the moving boundaries of the rotors.
The authors used the model to calculate the effect of heat transfer on performance
and suggested some guidelines to enhance the heat transfer between oil and gas.
Stosic et al [82-84] published some results of mathematical modelling and
experimental investigation on oil injection and its influence on thermodynamic
process in twin screw compressors. The model was subsequently applied to analyze
the effect of oil droplet size, position of oil injection port on the casing, oil jet speed
and angle, oil inlet temperature, oil to gas mass ratio, oil viscosity and the time of oil
retention in the working volume. The compressor performance was evaluated from
the measurement of bulk parameters such as delivery rate, power consumption,
power utilization efficiency, specific power as well as the instantaneous values of
pressure and temperature at several locations over the working volume from which
the indicator diagram was worked out. After comprehensive analysis of the influence
of various parameters, the authors devised a new system with a more efficient
nozzle.
Over the past twenty years, there are a good number of publications have
appeared on theoretical modelling of screw compressors mainly focussing on the
simulation of thermodynamic processes within the working chamber. Although some
experimental investigations have been carried out for verifying the mathematical
models, papers totally based on experimental studies leading to better understanding
of the oil injection process and its effect on performance seem to be rather low in
number. Peng et al [85] investigated the oil injection phenomenon to get a better
understanding of compressor performance experimentally. The p-v diagrams of a
46

prototype compressor at various operating conditions were recorded and analyzed.
Using a laser measuring system, the authors visualised atomised spray of injected oil
and studied the effect of oil-injection parameters. Observation of oil distribution
within the working chamber of a model compressor gave valuable information. It
was observed that many oil droplets were flying in the working chamber. It was also
observed that a thin film of oil always existed on the rotor surfaces, and that there
was voluminous oil foam in the working chamber.
Hammerl et al [86] examined several variants of the oil injection technique
where the oil was injected by nozzles into the suction port of the compressor. They
concluded that a finer atomization of the oil jet, leading to increase in the surface
area of oil droplets will enhance the heat transfer rate between the oil and the gas.
Sangfors [87] studied the effect of oil injection parameters on compressor
performance. His model included liquid evaporation, subsonic or sonic two phase
leakage, heat transfer among liquid, gas and metal, flashing of dissolved gas and
frictional losses due to viscous liquid between moving parts.
Sjoholm and Glenn [88, 89] analyzed the performance of screw compressors
operating with a family of complex ester lubricants and with HCFC-22 and HFC-134a
as working fluids. Performance of the compressors was measured with R-22 and
polyalphaolefins (PAO) and R-22/complex ester lubricant combinations. The authors
observed that the complex ester lubricant is the most suitable lubricant for
compressors operating with R-22 and unloaded, limited cooled oil or liquid refrigerant
injection. They also observed that the complex ester lubricant is superior to PAO
lubricant at low pressure ratios.
The influence of degree of oil flooding, liquid refrigerant injection, vapour
charge from the economizer, characteristics of refrigerants and degree of partial
loading were simultaneously studied by Tang and Fleming [90]. The development of
water injected operation of helical screw compressors [91,92] for delivery of
lubricant-free air at gauge pressures up to 9 bar in single stage was successfully
demonstrated and satisfactory solutions to anticipated problems of lubrication, oil-air
isolation, construction material selection and solids deposition within the compression
zone were found out. Ducruet et al [93] applied two different cooling modes and
conducted efficiency tests on refrigeration screw compressors
The operating pressure ratio in a stage without oil injection is limited by the
deformation of rotors caused by temperature rise. Rotor cooling reduces this
47

deformation. Stosic et al [43] have suggested a novel procedure to estimate and
control the heat transfer in screw rotors by the injection of minute quantities of a
volatile fluid. David and Anthony [94] employed three different cooling techniques:
liquid refrigerant injection, thermosyphon and oil injection, on refrigerant screw
compressor and proved that the oil injection system is slightly better than the other
two. A test rig was built [95] to asses the performance of different types of
atomizers for oil atomization. Experiments on the test rig showed that lowering the
oil droplet diameter results in a considerable increase in heat transfer between gas
and oil. It has been concluded that lower injected oil temperature gives better results
and changing (increasing) oil flow rate gives only small gains.
Flow and Leakage
To minimize the flow losses in the suction port, the suction port should be
positioned on the housing to let the gas enter with the fewest possible bends and the
gas approach velocity should be kept low by making the flow area as large as
possible. The discharge port size is determined by estimating the built in volume
ratio required for optimum thermodynamic performance. Most of the theoretical work
done on gas leakage in compressors is based on quasi one dimensional steady state
models.
The shape and position of the suction and discharge ports influence the
dynamic losses. The position of oil injection port and the quantity of oil injected into
the working chamber affect both the outlet temperature and the power consumption.
Dynamic flow loss in the suction chamber is a significant factor in reducing screw
compressor efficiency but can only be roughly estimated during compressor design
step due to the simplified methods of analysis used to account for these effects.
Today, computational fluid mechanics based analysis is used to estimate
velocity, pressure, temperature and concentration fields within a compressor far
more accurately than was done earlier. Stosic et al [96] applied this technique to
design a suction port with minimized flow losses. The function of the discharge port
on a screw compressor is to provide an exit of the gas and oil from the flutes of the
rotors. The volume of flutes occupied by the gas at the beginning of discharge
relative to the total volume of the cavities gives the volume ratio of the compressor.
An error in calculation of these volumes will lead to error in calculation of volumetric
48

and adiabatic efficiencies. Sjoholm and Muralidhar have published a paper [97] on
measurements on the axial discharge port and its geometric tolerance and have
suggested a method to minimize discharge port losses.
Even in the absence of valves, flow through the suction and discharge ports
of a screw compressor are oscillatory in nature which affects the compressor
performance. Koai and Soedel [98, 99] analyzed the volume and port area curves
based on rotor profiles and other geometric data. The gas conditions and flow rates
through the ports were determined from thermodynamic analysis of flow phenomena
through discharge and suction ports including under and over pressure conditions
over a complete cycle.
Leakages are generally considered to be one of the major sources of
efficiency loss in screw machines. Rotor clearances are mainly responsible for
leakage. Clearances must be minimized to obtain high volumetric and power
efficiencies. The gas that leaks back to the suction side not only occupies space but
is also at higher temperature. It is obvious that manufacturing tolerances on rotors
and the barrel are very important. An increase in tolerance by 0.01mm results in an
increase of 1% in volumetric losses [100]. The dimension of the oil stream also plays
an important role.
The actual profile of the compressor rotors and their engaged clearance have
a great effect on volumetric efficiency and noise. Dynamic measurements on
compressor rotor pair in connection with the working process and analysis of rotor
profile including engaging clearance has been described in detail by Xiong [101].
Prins and Farreira [102,103] have tested four types of quasi-static models for gas
leakage which are different in mathematical formulation and solution strategy.
Unfortunately, none of the models predicts the mass flow rate with sufficient
accuracy and reliability, mainly due to poor modelling of viscous effects. Hangiqi and
Guangxi [104] developed a computer model considering the effect of discharge port
position on compressor performance at various working conditions.
For practical computation of the effects of leakage during the compression
process, it is convenient to distinguish between two types of leakages according to
their direction in the working chamber: gain and loss leakages. The gain leakages
flow into a compression cavity from the discharge plenum and from the neighbouring
working chambers which are at higher pressures. The loss leakages leave the
49

chambers towards the suction plenum and to the neighbouring chambers having
lower pressures.
The leakage of gas and oil mixture takes place through interlobe clearance,
blow holes and gaps between the plate and the rotors at the discharge end. At the
lobe tip, the clearance fills with oil due to the action of centrifugal forces, and only oil
leakage takes place which can be calculated by using the equation of incompressible
viscous flow through a narrow gap [64]. The amount of oil leakage depends on the
gap between the rotor tip and the housing, and the sealing line length. The sealing
line length depends on the rotor turning angle. As the rotor starts rotating, the
sealing line length decreases. It has the maximum value at the beginning of
compression and is zero when the discharge process is completed.
Presence of leakage triangles (blow holes) is an inevitable consequence of the
rotor profile geometry. During compression, two blowholes called leading blowhole
and lagging blowhole are formed. Both are of same cross sectional area. Leakage of
oil-gas mixture into the working chambers is from the leading blowhole and out of
the working chamber is through lagging blowhole. Singh and Bowman [105] have
presented analytical and experimental methods to calculate blowhole area and have
suggested methods to verify the theoretical values. Measured values were consistent
with the computed values within the measured accuracy of ±4%. The contact line
between conjugate helical surfaces is a sealing line separating the high pressure
compression chamber from the suction chamber. The fluid leakage across the
contact line of conjugate helical surfaces is the major concern in terms of machine
efficiency. An average comprehensive radius of curvature (ACRC) analysis was
proposed by Xiao and Liu [36] to characterize the geometrical shape of leakage path.
A numerical approach was developed for the analysis. It is suitable for
microcomputer implementation and is used as a part of the CAD system and
performance analysis package.
Leakages are calculated basing on the assumption that gas and oil are
uniformly mixed and thermally isolated from the surroundings [68]. The oil-gas
mixture leakage rate is calculated using a standard formula for compressible fluids
flowing through a convergent nozzle. The flow and blockage coefficients identify the
effects of refrigerant viscosity and the sealing function of the lubricating oil used.
The properties of gas and oil mixture coming out from the leakage paths and
through the discharge port need to be known a priori. But in the absence of accurate
50

thermodynamic data, they are usually determined by comparison of theoretical
models and experimental data. By comparison with laboratory tests, Sangfors [69]
suggested the following assumptions for different types of leakage paths: (i) the
gas/oil mixture is homogeneous in all leakage paths and (ii) the gas/oil mixture ratio
is same in all leakage paths except at the lobe tip clearance, and is equal to the
mixture ratio in the discharge port. The leakage rates were calculated basing on the
above assumptions. Due to the presence of oil, exact determination of specific heat
ratio is rather difficult. Fujiwara and Osada [64] defined an apparent ratio of specific
heats and a modified gas constant and used them in their simulation models.
The average leakage area is determined by multiplying the sealing line length
with an average gap (clearance) for each type of leakage [65]. The average
gap/clearance is determined from actual clearance measurements on the
compressor. The discharge or flow coefficients are empirically selected for each
leakage to account for the presence of oil. The flow of oil gas mixture through the
leakage paths is in two-phase. Exact determination of physical properties of oil-gas
mixture is difficult. Based on extensive test data the oil-gas mixture properties have
been determined by Sangfors [69].
It is observed that leakage of gas is significantly reduced with oil injection.
Increasing the oil injection rate and the rotational speed of the shaft reduce gas
leakage. Xiong and Xiao [106] published a simple and effective mathematical
description for obtaining the actual engaging profile surface of rotors. They
calculated the actual engaging clearances between mating rotors according to basic
principles.
Vimmer[107] suggested the essential steps for numerical simulation of
compressible inviscid flow in a sealing gap starting from the description of a
mathematical model to its final numerical solution. For solution of the system, the
cell centred finite volume formulation of the explicit two-step MacCormac scheme
with Jameson’s artificial dissipation was used. Zaytsev and Ferreira [108] presented a
one dimensional leakage flow model for two phase ammonia-water twin-screw
compressor. The model accounted for viscous and acceleration forces based on three
conservation equations and the equation of state for homogeneous NH3/H2O mixture.
The governing equations were solved using a finite difference method. Results of the
solution were used for calculation of shear stress and friction between the rotors and
the housing. Comparison of the proposed leakage flow model with the results of the
51

isentropic converging nozzle model showed that the latter predicts up to two times
higher leakage mass flow rate.
Leakage losses are directly proportional to the effective leakage areas. A
method to determine the aggregate leakage through each path individually over a
complete compression cycle is required to compute the gas leakage loss. Fleming
and Tang [109] constructed a mathematical model for thermofluid processes suitable
for leakage calculation. Analytical techniques were proposed for different rotational
speeds and experimental methods were suggested for optimized compressor design.
The design of the rotor-casing assembly is primarily controlled by the
consideration of internal leakage. Optimised rotor geometry and proper choice of
clearances reduce leakage losses. To study the influence of rotor clearances on
compressor efficiency, computational fluid dynamics (CFD) analysis has been carried
out using FLUENT package [110]. The analysis has been done for static rotors at
different positions. The results obtained have shown that the size of the clearances
and the geometry of rotor lobes have significant effect on gas leakage and
distribution of leakage over the three main leakage paths.
Leakage experiments on a running twin-screw compressor were carried out
by Prins et al [111]. In their experiment, the indicated diagram was measured for
different sizes of rotors and sealing line gap. Lee at al [112] have numerically
analysed leakage performance of a screw compressor, assuming turbulent flow
through a plain seal with oil injection. The effects of parameters such as rotation
speed, injection speed, clearance ratio, injection angle and axial injection location on
flow pattern and leakage performance have been investigated. The authors
concluded that with oil injection, the total leakage of compressed gas can be reduced
to acceptable levels.
52

Chapter III
MATHEMATICAL ANALYSIS
The mathematical modelling of screw compressor is important to understand
the basic processes determining its performance. The screw compressor belongs to a
family of rotary positive displacement machines whose process diagram is different
from that of the conventional turbocompressor. In this chapter an attempt has been
made to develop a mathematical model for the suction and compression-discharge
steps. The model has been derived from the First Law of Thermodynamics applied to
a control volume, ideal gas laws and other relevant relations. This model predicts the
variation of temperature and pressure of gas with volume change during
compression process. The variation of oil temperature has also been derived. In a
reciprocating compressor, the clearance volume is the dominant factor apart from
pressure ratio that determines the volumetric efficiency. Analogues to this, the
leakage of gas and oil are the primary factors for the determination of volumetric
efficiency of screw compressors. In the control volume analysis, the leakage mass of
oil and gas in and out of the working chamber constitute the input and output
streams.
3.1 The Working Principles
The twin-screw compressor has two of rotors with parallel axes, enclosed in a
casing. Each rotor has a number of lobes, which are cut in helical form and mesh
into each other in the casing. The casing and the grooves on the two rotors make
the working chamber which corresponds to the cylinder and piston of a reciprocating
compressor. The twin-screw compressor process consists of three steps, namely
suction, compression and discharge as shown in Figure.3.1.

In the suction process, fresh charge is drawn into the cavities of male and
female rotors through the inlet port. When the volume of the space reaches its
maximum and any further rotation would result in remeshing, the rotors turn past
the edges of the inlet port so that the gas in the space is trapped. The compression
process starts with the entrapment of the gas and remeshing of rotors progressively
reduces the volume of the space or working chamber. The trapped gas is
compressed and moves towards the discharge end of the rotors. At an appropriate
point (based on designed discharge pressure) the rotors pass the edge of the
outlet/discharge port at the opposite end of the rotors.
(a) b (i) b (ii) (c)
Figure 3.1: Working mechanism of twin screw compressor [113] (a) End of
suction process (b) Compression process [(i) entrapment & (ii) reduction in volume] (c) Discharge process
A Typical view of a set of 5/6 screw rotors have been shown in Figure 3.2
without casing for clarity. The meshed and unmeshed volumes of a pair of cavities
from the start of compression to the completion of discharge steps are shown in
Figure 3.3. The shaded pair of rotor cavities is meshed for compression followed by
the unmeshed cavities. The process is shown in steps, as the reduction in volume of
a pair of cavities approaches the axial discharge port. Obviously, all other chambers
undergo similar process simultaneously with difference of phase with the chamber
shown.
When compression is taking place between the seal line and the discharge
end, intake is taking place in the volume represented by dots appearing at the back
of the sealing line. It is seen that as the rotors revolve, the sealing line moves
towards the discharge side of the compressor.
54

Female RotorMale Rotor
Radial PortAxial Port Suction
Axial Discharge Flow
Figure 3.2: Typical view at compression side of twin-screw rotors with first closed chambers unwrapped [114]
Calculation of thermodynamic cycle Time:
The major processes in the operating cycle of a screw compressor are
suction, compression and discharge. Generally the cycle time of oil injected twin-
screw compressor is represented in terms male rotor rotation angle. The suction and
discharge processes overlap in time, even for the same flute. While one part of a
flute is under suction, the rest of it is subjected to compression or discharge.
55

Generally the dimensions of the rotors are so chosen that the suction process goes
on for almost a full rotation, while the compression-discharge process is some what
shorter.
The rotary compressor under consideration has a 5/6 combination: 5 lobes on
the male rotor and 6 on the female. The total time taken for suction process of any
one pair of male and female rotor cavities is almost one revolution of male rotor.
Therefore, the suction process time in terms of male rotor rotation angle is close to
3600. The compression process depends on the male rotor wrap angle. This angle
gives the angle of contact between male and female rotors during compression and
determines the axial movement of compression process. A smaller wrap angle gives
higher speed of compression, where as for larger male wrap angle, the speed of
compression is lower for same volume delivery. For 5/6 rotor lobe combination, the
optimum wrap angle φ is estimated to be approximately 3000 of male rotor rotation
[9]. Hence the time required for compression is determined from the angular rotation
of male rotor. During discharge process, two adjacent compression processes overlap
over certain rotational angle of male rotor. This means that two adjacent
compression processes are simultaneously opened to discharge port for certain
rotational angle of male rotor. For a wrap angle of 3000, the total discharge
processes takes place approximately 600 of male rotor rotation. Thus, for the present
combination, the total angular rotation of male rotor is one revolution to complete
one thermodynamic cycle. During this time, suction, compression and discharge
takes place simultaneously. The operation cycle is shown in Figures 1.6 and 1.7 in
chapter I.
Thus, if the male rotor rotates at Nm revolutions per second, the cycle time is:
mN1
=Γ (3.1)
For the sake of analysis of suction, compression and discharge processes, the total
time can be expressed by the relation [67]:
⎟⎟⎠
⎞⎜⎜⎝
⎛++=Τ
mm nN1
3601
1 ϕ sec (3.2)
where ϕ is male wrap angle and nm is number of lobes on the male rotor.
56

Figure 3.3: Progression of one unwrapped and meshed volume chamber during rotation (compression process) [114]
57

3.2 Leakages
In an oil injected twin screw compressor, oil is circulated to take out the heat
of compression and also to provide sealing effect between lobes, and between the
rotors and the casing. Along the axial direction between the discharge and the
suction sides, the pressure difference induces leakage of both gas and oil. This
leakage amounts to a substantial part of the total flow rate and plays an important
role in determining the performance of the compressor. At high-pressure ratio and
low speed, the leakage paths constitute the major cause for reduction in efficiency.
For practical computation of the effects of leakage during compression
process, it is convenient to distinguish between two types of leakages based on the
direction with respect to the working chamber: gain or loss leakage. Gain leakage is
taken as positive and loss leakage is taken as negative. The gain leakages come from
the discharge plenum and from the neighbouring working chambers or compression
cavities which are at higher pressure. Loss leakage means the gas and oil leaving the
working chamber or compression cavities towards the suction plenum and to the
neighbouring chambers at a lower pressure. Different leakage paths are identified
and located in the compressor during compression process.
Figure 3.4 depicts different types of leakage flow passages into and out of
the working chamber. The leakage flow path can be simulated as a convergent
nozzle. The leakage rate depends on leakage area, flow coefficient, pressure and
temperature difference between the working chamber and its adjacent chambers.
The flow coefficients can be estimated by simulation to match with the experimental
result, where as the leakage area can be measured for a given pair of rotors. To find
the leakage flow rates, the state of the grooves adjacent to the working chamber
need to be known with respect to male rotor angle. For the state of the working
chamber at θm angle of rotation of male rotor, the preceding and succeeding
chambers are at a state of (θm+2π/nm) and (θm-2π/nm) respectively, nm being the
number of lobes on the male rotor. In association with the Figure 3.4, the state of
the parameters is shown with the help of a block diagram in Figure 3.5. Four major
sources of internal leakages exist [115] in a screw compressor. These sources are
explained below.
58

Leakage through interlobe clearance
The interlobe clearance promotes the leakage of gas and oil between
adjacent flutes. Some design clearance is provided between the lobes to avoid wear
loss. The gas and oil leakage through this clearance goes directly to the suction
chamber. The leakage quantity depends on the clearance area, temperature, flow
coefficient and the pressure difference between the working chamber and the
suction chamber.
1-Interlobe leakage, 2-Leakage through trailing blowhole, 3-Leakage through discharge end clearance, 4-Leakage through rotor tip housing, θm-male rotor rotation angle
Figure 3.4: Overview of the different types of leakages through gaps in a twin- screw compressor [115]
Leakage through blowhole
Another unavoidable leakage is that through the blowhole. Presence of
leakage triangles (blowholes) in twin-screw compressor is a consequence of the rotor
59

profile geometries. Blowhole area is defined as the smallest triangular area bounded
by the housing and the two rotors in a plane normal to the primary leakage flow
path between two adjacent working chambers. During compression process two
blowholes are formed, which are called leading blowhole and lagging blowhole. Both
blowholes are of same area. The leading blowhole is formed between the working
chamber and adjacent chamber at angle of θm+2π/nm, and the lagging blowhole is
formed between the working chamber and its adjacent chamber at an angle θm-
2π/nm. Leakage of gas and oil mass into the working chamber takes place through
leading blowhole and leakage out of the working chamber is through the lagging
blowhole.
M (θm -2π/nm) P (θm -2π/nm) T (θm -2π/nm)
Tooth Space (θm-2π/nm)
Tooth Space θm
M (θm+2π/nm) P (θm+2π/nm) T (θm+2π/nm)
Suction Chamber (Ps, Ts)
M (θm), P (θm) T(θm)
Tooth Space (θm+2π/nm)
blm&dmlm& dflm&
dmtm&
btm&
ilm&m
dftm&
Figure 3.5: Flow model through clearance gap of a twin-screw compressor
Leakage through discharge end clearance Another important mass leakage is through the clearance between the rotor
end and the discharge end plate. Leakage of oil and gas mixture from leading
cavities of male and female rotors goes to the working chamber under study through
the clearance between male rotor and discharge end plate and also between the
female rotor and the discharge end plate. Similarly, the leakage mass of oil and gas
mixture from the working chamber goes to succeeding chamber of male and female
rotor cavities.
60

Leakage through the rotor tip-housing clearance
The leakage mass around the rotor tip depends on the gap between the rotor
tip and the housing along the sealing line length. The sealing line length, in turn
depends on the rotor turning angle. As the rotors start rotating, the sealing line
length decreases due to the decrease in volume of the compression chamber. It is
highest at the beginning of compression and is zero at the end of the discharge
process. Due to centrifugal action, the clearance at rotor tip is filled with the oil alone
due to its higher density compared to the working fluid. Hence, unlike the other
leakage paths, only oil leaks through this clearance passage. The oil mass leakage
into the working chamber from preceding and succeeding chambers has been taken
as positive and negative respectively. This type of leakage takes place from both
male and female rotor tip-housing clearances to respective lagging cavities.
Figure 3.6 shows meshing of twin-screw rotors with mass leakages and
leakage paths in X and Y planes. The rotors rotate in a tight casing which has not
been shown in the figure for clarity. The working space comprises of a pair of
grooves of male and female rotors (called working chamber) as shown by the shaded
area. The gas to be compressed occupies the space in the grooves. Figure 3.7
shows the projected surface of a male rotor groove on the y-z plane. When the
meshed rotors rotate, the contour of the projected surface also moves parallel to the
rotor axis without change in the shape. The sealing line contour is extrapolated
beyond the rotor by dotted lines to visualize the sealing lines more clearly. When the
rotors rotate, a leading section of sealing line appears and as rotation continues the
line moves parallel to z-axis and decreases in dimension till it eventually disappears
as shown in Figure 3.8. The sealing line length varies as the rotors rotate.
Leakage Calculation
The gas and oil mass vary continuously due to leakage during compression-
discharge process. The rate of change of gas and oil mass can be written as:
gogig mm
dtdM
&& −= (3.3)
and
lolil mm
dtdM && −= (3.4)
61

where Mg , and Ml are the mass of gas and oil trapped in the flutes under
consideration, and being the leakage flow rates of gas and oil respectively. gm& lm&
Figure 3.6: Different leakages during compression process [65]
Figure 3.7: Projected area of male rotor groove on the y-z plane [65]
The gas and oil mixture leakage may be expressed in terms of local variables
at any time in the working chamber and are assumed to follow the process of a
convergent nozzle. Except at the lobe-tip clearance, the leakage gas and oil are
62

assumed to be mixed uniformly. If the pressure drop of a flowing fluid through the
nozzle is considerable, the energy equation for adiabatic compressible fluid flow can
be expressed as [116]:
2
22
2
21
21
1
1
2)1(2)1(z
gV
gP
zg
Vg
P ee ++−
=++− ρβ
βρβ
β (3.5)
It is assumed that the upstream and down stream leakage paths are at the same
elevation (i.e. z1=z2) and the inlet velocity of the oil-gas mixture is assumed to be
small compared with the outlet velocity. With these assumptions, the above equation
reduces to:
2)1()1(
22
2
2
1
1 eVPP+
−=
− ρββ
ρββ
(3.6)
The conservation of mass of mixture at inlet ‘1’ and outlet ‘2’ leads to the equation:
222111 ee VAVA ρρ = (3.7)
From equations (3.6) and (3.7), after simplification, the leakage mass flow rate of
gas and oil mixture is calculated to be:
m
clg RT
PCAmmm
11
1
1 )1(2
)(
−+
⎟⎟⎠
⎞⎜⎜⎝
⎛−
=+=
ββ
ββ
&&& for 1
)1(2
0−
⎟⎟⎠
⎞⎜⎜⎝
⎛+
≤≤ββ
βr (3.8a)
(for subsonic flow)
and
m
clg R
rrTPCA
mmm)1(
)(2)(
12
1
1
−−
=+=
+
ββ β
ββ
&&& for r >1
)1(2 −
⎟⎟⎠
⎞⎜⎜⎝
⎛+
ββ
β (3.8b)
(for supersonic flow)
63

where β is the ratio of specific heats, and r is the ratio of downstream (P2) to
upstream (P1) pressure (1
2
PP
r = ) and C is the flow coefficient of the nozzle. It may
be noted that the pressure ratio is always less than unity. Hence, the equation (3.8b)
for supersonic flow is never used although both the equations are given for
mathematical completeness.
Figure 3.8: Change of sealing line length with male rotor rotation [65]
The leakage mass flow rate of mixture through various leakage paths into
and out of the working chamber/cavities except through lobe tip-housing clearance is
found by using the equation (3.8a). Due to the presence of oil, the exact mass ratio
of oil to gas in the mixture is not known. However, the mass ratio in the mixture
coming out from the leakage paths and through the discharge port can be calculated
from experimental data. The following assumptions are made for the leakage of oil
and gas mixture [69].
(i) The oil-gas mixture is homogeneous in all leakage paths.
(ii) The oil to gas mass ratio is same in all the leakage paths and equal to the
mixture ratio in the discharge port.
64

From these assumptions, the mass ratio of oil to gas in the working chamber and
through all leakage paths may be defined as:
φ = (mass flow rate of oil through discharge port)/(mass flow rate of gas through
discharge port)
= (leakage flow rate of oil)/(leakage flow rate of gas).
In mathematical terms it can be expressed as,
gi
li
g
l
mm
mm
&
&
&
&==φ (3.9)
The specific heat ratio of oil-gas mixture influences the leakage rate. Exact
determination of adiabatic index is rather difficult due to the presence of oil. Fujiwara
and Osada [64] have defined the apparent ratio of specific heats and effective gas
constant for oil-gas mixture. The modified specific heat ratio and gas constant for the
mixture are defined as:
lv
lp
CCCC
φφ
β+
+= (3.10)
RRm φ+=
11 (3.11)
The ratio of specific heats of pure gas can be defined as:
v
p
CC
k = (of the gas species being compressed) (3.12)
The average leakage area in leakage equation is determined by multiplying
sealing line length with an average gap (clearance) for each type of leakage. The
average gap/clearance is determined from the actual clearance measurements of the
compressor. The flow coefficients are empirically selected to account for the
presence of oil in each type of leakage flow.
The gap between the lobe tip and the rotor casing is filled with higher density
fluid, i.e. oil alone, due to the action of centrifugal force, and thus the leakage flow is
65

in a single phase. The rate of oil leakage through this clearance from both male and
female rotor tip clearances can be calculated using the equation of incompressible
viscous flow through a narrow gap between two horizontal plates where one plate is
stationary and the other plate is moving. The moving plate is the lobe tip having
length equal to lobe tip width. The mass of oil leakage along the lob tip sealing line
(S) can be written as [117]:
⎥⎥⎦
⎤
⎢⎢⎣
⎡ −−=
tl
tll w
aPPavSm
µρ
12)(
2
312& (3.13)
where ρl is the density of oil, wt is lobe tip width and a is the clearance
perpendicular to flow direction.
Unlike reciprocating compressors, screw compressors are of rotary type and
have a number of working chambers. The total number of working chambers
depends on male and female lobe combination. Simultaneous suction, compression
and discharge processes take place in all the grooves with leading or lagging phase
angle of 3600/nm. The phase angle between two adjacent working chambers depends
on the number of lobes on male rotor. It is assumed that one pair of male and
female cavities under study are at an angle θm0 of male rotor rotation. The leakage
gas and oil mass into these cavities are from the preceding working chamber
cavities, which are at an angle of (θm+360/nm)0. Similarly, the oil and gas masses
leak to the succeeding cavities at (θm-360/nm)0. The leakage mass flow rate of
homogeneous mixture of oil and gas during compression and discharge process
through various leakage paths are calculated by using equation 3.8(b). Equation
(3.13) is used to calculate the leakage of only oil through rotor tip-housing clearance.
The same equations are employed to calculate the leakages into and out of the
working chamber or compressor cavities on which the numerical study is focussed.
In leakage calculation, one pair of male and female cavities is considered, since all
the cavities are similar in all aspects. The leakage rate of gas mass and oil mass can
be calculated separately from the equation of the leakage rate of mixture for a
known mass fractionφ .
66

Gas leakage into the cavities The gas mass leakage into the working chamber are (i) leakage through
leading blowhole (ii) leakage from male rotor end face at the discharge side and (iii)
leakage from female rotor end face at the discharge side.
The values of flow coefficients used in the simulation vary according to the
type of leakage, male rotor tip speed, and injected oil quantity. Using the nozzle
equation (3.8a), the leakage rate of gas mass through the leading blowhole into the
working chamber at any instant can be estimated by using the relation:
)1/()1(
2 11
1
1 φβ
βββ
+⎟⎟⎠
⎞⎜⎜⎝
⎛−
=
−+
m
blblgbi RT
PACm& for
1
)1(2
0−
⎟⎟⎠
⎞⎜⎜⎝
⎛+
≤≤ββ
βr (3.14)
where Cbl , Abl are the discharge coefficient and leakage area respectively. If (Cdmi ,
Admi ), (Cdfi , Adfi) are the flow coefficients and leakage areas of male and female
rotors at the discharge end side, the net gas mass leakage rate into the working
chamber through all the leakage paths including blowhole can be computed by using
the expression:
m
dfidfidmidmiblblgi RTP
ACACACm
11
1
1 )1(2
)()1(
1
−+
⎟⎟⎠
⎞⎜⎜⎝
⎛−
+++
=
ββ
ββ
φ& (3.15)
Gas leakage out of the cavities
The leakage rate of gas mass from the compression cavities to the adjacent
chambers is through (i) trailing blowhole (ii) interlobe clearance (iii) discharge end
clearance of male cavity and (iv) the discharge end clearance of female rotor cavity.
It may be noted that the leakage through interlobe clearance goes directly to the
suction cavities where as leakage through trailing blowhole goes to its succeeding
cavities. Similarly, the leakage gas mass goes to its succeeding cavities due to the
clearance between male and female rotors with the discharge end plate.
67

Using the same nozzle equation (3.8a), the net gas mass leakage going out
of the working cavities from all the leakage paths of the compressor can be
estimated by using the equation shown below:
gilm
dtidtidmtdmtbtbtgo mRT
PACACACm && +
⎟⎟⎠
⎞⎜⎜⎝
⎛−
+++
=
−+11
1
1 )1(2
)()1(
1
ββ
ββ
φ(3.16a)
where
mililgil RT
PACm
11
1
1 )1(2
)()1(
1
−+
⎟⎟⎠
⎞⎜⎜⎝
⎛−
+=
ββ
ββ
φ& (3.16b)
For interlobe leakage calculations, the downstream pressure P2 is equal to suction
pressure (Ps), and (Cbt , Abt), (Cdmt , Admt), ( Cdft , Adft) (Cil , Ail) are the flow coefficients
and leakage areas of trailing blowhole, discharge end of male rotor, discharge end of
female rotor, and at interlobe leakage respectively.
Oil leakage into the cavities
The oil mass leakage rate into the working chamber is through rotor tip
housing clearance from both male and female rotors in addition to the oil leakage
associated with the gas leakage given by equation (3.15). The total oil mass leakage
rate into the working chamber can be calculated using the relation:
gilrfilrmili mmmm &&&& φ++= (3.17)
where , lrmim& lrfim& are the oil leakage rates through male and female rotor tip-
housing clearances respectively and gim&φ is the leakage oil mass associated with the
mixture leakage.
The oil leakage flow rate through rotor tip-housing clearance from leading working
chamber of male rotor is estimated by equation (3.13) as:
68

⎥⎥⎦
⎤
⎢⎢⎣
⎡ −−=
tml
tmlmllrmi w
aPPavSm
µρ
12)(
2
312& (3.18)
where Sml is the sealing line length of male rotor at rotor tip-housing clearance.
Similarly, leakage from the leading female rotor groove is calculated by the relation:
⎥⎥⎦
⎤
⎢⎢⎣
⎡ −−=
tfl
tflfllrfi w
aPPavSm
µρ
12)(
2
312& (3.19)
where Sfl is the sealing line length of female rotor at rotor tip-housing clearance. The
oil leakage associated with the gas leakage can be calculated using equation (3.15)
by multiplying the value of with the mass fraction ‘gim& φ ’.
Oil leakage out of the cavities
Similar to the leakage of oil into the cavities, oil mass leakage out of the
compression cavities is composed of two parts: (i) oil leakage alone along the sealing
line length between the tips of the male and female rotors and the housing and (ii)
oil leakage associated with gas leakage.
The total leak rate of oil mass from the working chamber to the adjacent grooves is
given as:
golrfolrmolo mmmm &&&& φ++= (3.20)
where , are the oil leak rates through the clearance between the tips and
the housing. The last term is the oil content in the leakage of mixture of gas and oil.
lrmom& lrom&
The oil mass leak rate from the male rotor cavity through rotor tip-housing clearance
to the succeeding working chamber can also be estimated by using equation (3.13)
as:
⎥⎥⎦
⎤
⎢⎢⎣
⎡ −−=
tml
tmlmtlrmo w
aPPavSm
µρ
12)(
2
312& (3.21)
where Smt is the sealing line length of trailing male rotor.
69

Similarly, the leakage from the female working chamber to the succeeding
groove is calculated by using the relation:
⎥⎥⎦
⎤
⎢⎢⎣
⎡ −−=
tfl
tflftlrfo w
aPPavSm
µρ
12)(
2
312& (3.22)
where Sft is the sealing line length of trailing female rotor.
3.3 Suction Process
Screw compressor performance is governed by the interactive effects of
thermodynamics, heat transfer and machine geometry. This can be calculated
reliably only by their simultaneous consideration.
The analysis of suction process of a compressor is essential to know the
amount of fresh gas mass inducted into the suction cavities, the quantity of gas mass
inducted being a function of the temperatures of inlet gas and cavity walls. The
temperature T1 at the end of suction process is higher than the temperature Ts of the
freshly inducted gas because of the heat transfer with the oil present in the suction
chamber.
The following assumptions have been made in analyzing the suction process.
Since the pressure and temperature fluctuations are generally small, the analysis of
the suction process is simplified with the following quantities being assumed to be
constant.
Inlet velocities of gas and oil
Temperature of gas and oil
Pressure drop across the inlet port
Heat flow from gas to oil (or from oil to gas)
Using the above assumptions, the state of the gas and the oil at the end of suction
process are calculated using mass and energy balance. It is possible to describe their
temperatures explicitly in terms of the input parameters.
The sensible heating of fresh inducted gas mass is:
)( 11 sp TTMCQ −= (3.23)
70

where T1 is temperature and M1 the mass of the fresh gas inducted during suction
process.
If the temperature rise of inducted gas is small comparison with the
difference of temperatures between the injected lubricating oil and the inducted gas,
the convective heat transfer between the leaked oil and inducted gas during suction
process may be expressed as:
ssoil tTThAQ )( −= (3.24)
where ts is the suction duration in seconds.
Under ideal conditions, the heat lost by the oil must be equal to the heat
gained by the gas. From equations (3.23) and (3.24), the mean temperature of
inducted gas can be written as:
sp
ssoil TcM
t)TT(hAT +−
=1
1 (3.25)
Using the ideal gas equation of state, the total amount of gas mass, including
leakage gas mass, occupying the suction volume at (Ps ,Ts) can be written as:
s
tsts RT
VPM 1= (3.26)
where Vt1 is the geometrical volume of one pair of male and female rotor cavities.
L)AA(V fmt +=1
The actual gas mass contained in the volume at the end of suction process (Ps ,T1) is
estimated to be:
11
11 T
TM
RTVP
M sts
tst == (3.27)
71

The total gas mass at (Ps ,T1) is the sum of fresh charge inducted and the leaked gas
mass. Thus:
il11t MMM += (3.28a)
The leakage gas mass rate is given as:
gogigl mmm &&& −= (3.28b)
The expressions for , are given by the equations (3.15) and (3.16a)
respectively. The total amount of gas mass leakage into the suction cavities over the
suction duration t
gim& gom&
s is
sglil tmM ×= & (3.28c)
Using equation (3.27), the fresh charge at (Ps ,T1) can be expressed by the relation:
il1
sts1 M
TT
MM −= (3.29)
It may be noted that M1 is the mass of fresh charge at (Ps ,T1). Mts is the total mass
of gas at (Ps ,Ts) and Mil is leakage gas mass at (Ps ,T1). Substituting the value of M1
from equation (3.29) in equation (3.25), we get a quadratic equation in T1 as:
[ ] 0TMct)TT(hATMcTMcTTMc 2s1tpssoilsilps1tp1
21ilp =−−−++− (3.30)
The solution of the quadratic equation (3.30) gives the temperature of gas mass at
the end of suction process. The parameter Mil is to be determined from the
simulation of compression chamber which has been described in section 3.2.
72

Heat Transfer between Gas and Oil
One of the important problems which require careful investigation is the role
of the injected oil into the working chamber. Oil is injected into the compression
cavities for sealing, cooling and lubrication purpose. The thermodynamics of suction
and compression processes change substantially with oil injection.
To enhance cooling efficiency, oil must be atomized into a spray of fine
droplets to enhance the area of the contact surface between the gas and the oil. The
atomization is performed by using specially designed nozzles or by simple high-
pressure injection. The distribution of droplet sizes is controlled by oil-gas mass flow
and velocity ratio for a given oil injection system. In recent years, many authors have
simulated the behaviour of oil injected compressors to predict the performance. In
suction process, the gas is warmed up by the hot leaked oil film. Singh and Bowman
[81] analyzed the movement of oil droplets in the working space and calculated the
heat transfer between the gas and the oil. Stosic et al. [82-84] used an oil droplet
model to study the influence of droplet size on heat transfer rate and determined the
heat transfer coefficient using experimental data. Recently a simpler procedure has
been adopted by Fujiwara and Osada [64] in which the heat transfer coefficient is
formulated and calculated basing on the analysis of suction process. The same
method has been adopted in this study to determine the heat transfer coefficient for
different working gases. At the beginning of suction process, a fresh charge at
suction condition is taken into the suction chamber. At the end of suction process,
the temperature of this gas rises to a level which is between the suction and the
leaked lubricating oil temperature at suction pressure.
The displacement volume of the working chamber is the theoretical volume of
one pair of male and female rotor grooves. This volume is filled with the fresh
inducted gas and the leaked gas from the previous compression process from a
neighbouring flutes at pressure Ps and temperature T1 occurring at the end of the
suction process. Though there is a leakage of oil through the interlobe clearance, its
volume is small compared to that of the leaked gas. However, the mass of leaked oil
may be large compared to that of the leaked gas. A schematic model of the working
chamber at the end of suction process is shown in Figure.3.9.
The heat exchange between oil and the leaked gas is negligible because both
are leaked quantities and are therefore assumed to be in thermal equilibrium. The
73

pressure drop across the inlet port is assumed to be negligible. With these
assumptions, the amount of heat transfer from oil to the inducted gas may be
estimated using the expression:
(3.31) )TT(McQ s11p −=
Figure 3.9: Model of the working chamber of an oil injected twin screw compressor at the end of suction process [64]
Assuming the working gas to be ideal, the state equation of gas at the end of suction
condition can be written as:
111 RTMVPs =′ (3.32)
where M1 is the actual fresh mass entering the suction chamber at (Ps ,T1) for an
available suction volume of ′1V . The equivalent volume V1 necessary for the same
mass at suction condition (Ps ,Ts) is given by the relation:
ss RTMVP 11 = (3.33)
Since Ts<T1 , the actual volume of fresh charge decreases from ′1V to V1.
Since the heat capacity of the oil is very large compared to that of the gas,
the temperature variation of oil during gas induction into the suction chamber
(cooling effect) and the heating effect on the compression process are small
compared to the temperature variation of the gas during suction and compression
74

processes. Therefore, the temperature of leaked oil is assumed to be constant at Toil
which is also the temperature of oil in the suction chamber.
The total suction volume (geometrical volume) of the gas at the end of suction
process (Ps ,T1) is,
211 VVVt +′= (3.34)
The leaked gas does not take part in the heat transfer process since it is assumed to
be at (Ps ,T1). Thus from equation (3.32) and (3.34)
1121 RTM)VV(P ts =− (3.35)
Substituting the values of Ts and T1 from respective equations (3.33) and (3.35) in
equation (3.31), we get:
)V
VV(VP
Rc
Qt
tsp
1
211 1
+−= (3.36)
When the temperature rise of the inducted gas is small compared with the
temperature difference between Toil and Ts , the convective heat transfer between
gas and the oil during suction process can be described by the relation:
ssoil t)TT(AhQ −= (3.37)
Eliminating Q between equations (3.36) and (3.37),
)V
VV(VP
Rc
t)TT(Aht
tsp
ssoil1
211 1
+−=− (3.38a)
The above equation can be expressed in terms of volumetric efficiency as:
⎟⎟⎠
⎞⎜⎜⎝
⎛−−=−
1
21 1)(
tevts
pssoil V
VVP
Rc
tTTAh η (3.38b)
75

Since the heat capacity of the oil in the working chamber is much larger than
that of the gas, the temperatures of the oil in the compression and discharge steps
are not affected very much by the inlet gas temperature. Therefore Toil , leaked gas
volume V2, and the heat transfer coefficient are assumed to be independent of
suction gas temperature. Thus, differentiating the equation (3.38b) with respect to Ts
on both sides yields:
s
ev
s
ts
dTd
AtkVkP
hη
)1(1
−= (3.39)
Equation (3.39) relates the heat transfer coefficient to the slope of the volumetric
efficiency vs gas inlet temperature curve. Applying experimental data to this
equation, the heat transfer coefficient can be determined for any working gas. But
there is no exact information available concerning the heat transfer area between
inducted gas and the oil. Fujiwara and Osada [64] defined the representative heat
transfer area as:
32
1 )( tVA = (3.40)
They have also presented the experimental relationship between Nusselt
number and rotational Reynolds number. Figure 3.10 depicts the experimental
relation between Nusselt number and rotational Reynolds number for three different
oil-supplying conditions. The line is approximated by the equation:
74.0)(Re51.0 wNu = (3.41)
The Nusselt number and the rotational Reynolds number are defined as:
λhD
Nu m= (3.42a)
and
υω 2
Re mw
D= (3.42b)
76

where Dm is the male rotor diameter, which is also the characteristic length in
Nusselt number calculation.
The relations given by the equations (3.42a) and (3.42b) are based on
generalised dimensionless parameters which are independent of time in the suction
process. Hence, it has been argued that the same relation can be extended to
estimate the heat transfer coefficient in compression and discharge processes for
computer simulation.
Symbol Qoil (litre/min) Toil (0C) ● 20 50 × 35 50 ∆ 35 70 Qoil is oil supplying rate
Figure 3.10: Experimental relations between Nusselt number and rotational
Reynolds number [64]
3.4 Compression and Discharge Process
Analysis of the compression and discharge processes are required to find the
variation of gas temperature (or pressure) for different angular positions of male
rotor. For a constant angular speed of the rotor, the variation of temperature (or
pressure) can be expressed as time rate quantities. Using ideal gas law, the variation
77

of one thermodynamic property can be related with that of the other properties. The
analysis of compression process in a screw compressor is carried out on the
principles of the First Law of Thermodynamics for a flow system. The control volume
for the analysis of gas phase is shown in Figure 3.11. The control volume for this
analysis is based on the following assumptions.
• Gas properties are uniform throughout the control volume at any instant of time.
• The working substance is a perfect gas with constant specific heats.
• Heat transfer to the casing and rotor walls is negligible.
• Gas and oil never change phase.
• Average clearances are used in determining leakage flows. It is assumed
that such averaging gives a good representation of the actual leakage flows.
• Pressure is homogeneous throughout the working space at any instant.
• Oil is an incompressible fluid.
• Heat exchange between gas and oil is in proportion to the temperature
difference between the gas and the oil in the cavities.
• The oil and gas are assumed to be separate fluids and their interaction takes
place only through heat transfer.
• It is assumed that the heat of compression is transferred only to the injected oil.
• Gas and oil states are homogeneous throughout the working space at any
instant.
Mass balance of gas over the control volume is rewritten as:
gogig mm
dtdM
&& −= (3.43)
The rate of change of energy of the control volume (with negligible kinetic and
potential energies) in the flow process can be written as:
dt
dHdt
dHdt
dWdtdQ
dtdE lgv ++−= (3.44a)
For a stationary control volume, the kinetic and potential energies are assumed to be
negligible so that the above equation can be written in terms of internal energy of
the system as:
78

dtdH
dtdH
dtdW
dtdQ
dtdU lgg ++−= (3.44b)
dQ = hA (T l -T g)
dW g = -P dV g
W o rk in g cham be r
lim& (T li)
g im& (T gb)
lom& (T l)
gom&
C on tro l vo lum e
(M g, T g, P )
(G as com p re ss ion w o rk )
H ea t tran sfe r be tw een ga s & o il
O il p um p w o rk
libp qPPdW &)( −−=
Figure 3.11: Schematic diagram for First Law analysis of control volume for gas phase
Over a time interval dt, the change in internal energy form the above equation can
be written as:
lgg dHdHdWdQdU ++−= (3.45)
The internal energy of gas in the control volume can also be written as:
ggvg TMCU = (3.46)
The internal energy change in time dt from the above equation can be expressed as:
ggvggvg dMTCdTMCdU += (3.47)
79

The net enthalpy input in time dt (input enthalpy-output enthalpy) of gas due to
leakage is given by the relation:
gogpgigbpg dMTCdMTCdH −= (3.48)
Since oil temperature remains constant for a small time period dt, the net enthalpy
input of leakage oil is due to the difference in their flow work and is expressed as:
dtm
Pdtm
PdHl
lo
l
libl ρρ
&&−= (3.49)
The gas work done in time dt due to the change in volume of cavities is given by:
gg PdVdW = (3.50)
The change in net gas volume in time dt is defined as:
dtm
dtm
dVdVl
lo
l
lig ρρ
&&+−= (3.51)
The oil pump work due to leakage is defined as:
dtm
PPdWl
libp ρ
&)( −−= (3.52)
The heat exchange between the gas and oil is given by the relation:
dtTThAdQ gl )( −= (3.53)
Substituting equations (3.47), (3.48), (3.49), (3.50), (3.51) (3.52), and (3.53)
in equation (3.45) and rearranging, the rate of change of working gas temperature is
obtained as:
80

)]()1(
)()()1(
[
lggv
gg
go
ggbg
gi
l
lo
l
lib
g
gg
TTMC
hATkMm
TkTMmmm
PP
dtdV
VTk
dtdT
−−−−
−++−−
−=
&
&&&
ρρ (3.54)
The first term on the right-hand side of the above equation relates to the
change in geometrical volume including the rate of leakage of oil volume. The
second and third terms represent the effect of gas leakage into and out of the
compression cavities respectively. The last term is derived from the heat transfer
between gas and oil.
Since oil is an incompressible fluid, the rate of pressure change in the cavities
is related to the rate of change of gas volume. The gas volume change is given by
the formula:
l
li
l
log mmdtdV
dtdV
ρρ
&&−+= (3.55)
Assuming that the working fluid is an ideal gas, the equation of state is expressed
as:
ggg RTMPV = (3.56)
The differential form of the above equation is:
⎥⎥⎦
⎤
⎢⎢⎣
⎡++−=
dtdT
RMdt
dMRT
dtdV
PVdt
dP gg
gg
g
g
1 (3.57)
Substitution of equations (3.43), (3.54), and (3.55) in equation (3.57) results in the
relation:
)](
)()([1
lgggv
ggo
g
g
gigg
ggb
l
libb
l
lo
g
TTTMChAPV
mMPV
k
mMTPVT
km
PPkPm
dtdVkP
VdtdP
−−−
++−++−=
&
&&&
ρρ (3.58)
81

The rate of change of oil temperature in the compressor cavities can be
obtained from energy balance over the control volume for oil phase separately. The
schematic diagram of control volume is shown in Figure 3.12. This analysis yields the
temperature of oil over a differential time interval as a parameter for the calculation
of temperature and pressure variations of gas in equations (3.54) and (3.58). Since
only the temperature variation of oil is required, the control volume is assumed to be
undergoing a constant pressure process.
dQ = hA (T g-T l)d t d tqPdW libp&)( −−=
W ork in g cham be r
lim&
C on tro l vo lum e
(M l , T l , P ) )( bli Pq& )(Pq lo&
H ea t tran s fe r be tw een ga s & o il O il p um p
w o rk
O il w o rk due to o il vo lum e change
lom&
d tqqPdW lolil )( && −−=
Figure 3.12: Schematic diagram for First Law analysis of control volume for oil phase
The mass balance equation for the oil is rewritten as:
lolil mm
dtdM && −= (3.59)
For a stationary control volume, the kinetic and potential energies of oil are assumed
to be negligible. Hence, the rate of internal energy change of oil can be written as:
82

⎟⎟⎠
⎞⎜⎜⎝
⎛+−+=
dtdW
dtdW
dtdQ
dtdH
dtdU pllll (3.60)
Over a time interval dt, the above equation can be stated as:
)( pllll dWdWdQdHdU +−+= (3.61)
The change in internal energy of oil can also be expressed in terms of the enthalpy
change and the flow work as shown below.
dtm
Pm
PdHdUl
lo
l
libll )(
ρρ−−=
& (3.62)
The enthalpy change of oil can be written in terms of change of mass and
temperature as:
lllllll dMTCdTMCdH += (3.63)
The net enthalpy input of oil in time dt due to leakage is then written as:
dtTCmTCmdH lllolbllil )( && −= (3.64)
The heat gained by oil from the working gas during the compression process is:
dt)TT(hAdQ lg −= (3.65)
The work done due to change in oil volume can be written as:
dtmm
PdWl
lo
l
lil )(
ρρ
&&−= (3.66)
The pump work spent on leakage of oil can be expressed as:
83

dtm
PPdWl
libp ρ
&)( −= (3.67)
Substituting equations (3.62), (3.63), (3.64), (3.65), (3.66), and (3.67) in equation
(3.61) and rearranging, the rate of change of oil temperature is obtained as:
)()( lglll
lillb
l TTCM
hAMm
TTdtdT
−+−=&
(3.68)
In summary, we have derived the following set of equations that describes the
compression-discharge process.
gogig mm
dtdM
&& −= (E1)
lolil mm
dtdM && −= (E2)
l
li
l
log mmdtdV
dtdV
ρρ
&&−+= (E3)
)](
)()([1
lgggv
ggo
g
g
gigg
ggb
l
libb
l
lo
g
TTTMChAPV
mMPV
k
mMTPVT
km
PPkPm
dtdVkP
VdtdP
−−−
++−++−=
&
&&&
ρρ (E4)
)](
)1()()()1(
[
lggv
gg
goggb
g
gi
l
lo
l
lib
g
gg
TTMC
hA
TkMm
TkTMmmm
PP
dtdV
VTk
dtdT
−−
−−−++−−
−=&&&&
ρρ (E5)
)()( lglll
lillb
l TTCM
hAMm
TTdtdT
−+−=&
(E6)
84

In the above set of equations (E1) to (E6), time t is the independent variable and Mg ,
Ml , Vg , P, Tg , and Tl are the six dependent variables whose history of change is
described the six equations over a cycle.
3.5 Performance Evaluation
Many efficiency definitions exist in literature that qualify the mass flow and
power performance characteristics of a compressor. Different definitions are often
used interchangeably throughout the compressor industry. The performance index of
a compressor is characterised by its volume or mass handling capacity and specific
power consumption. The losses such as friction and transmission loss are redundant
and can be used for expression of overall performance. Thus the performance index
of a compressor is assigned by two efficiencies: volumetric efficiency and power
efficiency. The power efficiency may be called adiabatic, isothermal or polytrophic
efficiency depending on the compression process. An excellent review by Ueno and
Hunter [118] gives the volumetric and power efficiencies of reciprocating compressor.
The volumetric efficiency of a reciprocating compressor is based on expansion
of entrapped gas left at the end of compression in the clearance volume. Unlike
reciprocating compressor, the volumetric efficiency of screw compressor depends on
the leakage gas volume through the clearances from the discharge end to suction
cavities. A schematic diagram of reciprocating compressor analogous to oil injected
twin-screw compressor given by Fujiwara et al. [65] is shown in Figure 3.13.
Volumetric efficiency
It is evident from Figure 3.13 that the actual amount of fresh charge taken
during suction process decreases due to recirculation of leakage gas. The volumetric
efficiency can be defined either in terms of volume flow rate or in terms of mass flow
rate to yield the same value.
=vη (Volume of gas delivered at suction condition for a pair of rotor cavities)/
(volume of meshed male and female rotor cavities)
= (Mass delivered for a pair of rotor cavities)/ (Theoretical mass of gas
contain for the same volume at suction condition)
85

The amount of mass present at the end of suction process is:
s
stst RT
VPRTVP
M 1
1
11 == (3.69)
where Vt1 is the volume of suction chamber, V1 is the equivalent volume of gas at
suction temperature, and T1 is temperature of gas in the suction chamber.
The theoretical amount of gas mass is:
s
tsts RT
VPM 1= (3.70)
But the surface temperature of a pair of grooves will be different from the
gas temperature under suction conditions. Hence, it is necessary to find the gas
mass inducted at the average surface temperature of the suction chamber. The gas
mass inducted at average surface temperature of suction cavities may be defined as
11 T
TMM s
tst = (3.71)
Thus, Mt1 is the amount of gas mass present in the suction chamber consisting of a
pair of cavities including the leakage mass. The theoretical gas flow rate at
temperature T1 over a suction duration ts is:
s
tt t
Mm 1=& (3.72)
The net gas mass leakage rate from one pair of grooves is:
gogigl mmm &&& −= (3.73)
86

Figure 3.13: Schematic diagram of a reciprocating compressor analogous to an oil
injected twin screw compressor [65]
The total leakage from all the cavities over a suction duration ts is:
sglil tmM ×= & (3.74)
Thus the rate of fresh gas mass flow is:
gltdt mmm &&& −= (3.75)
The maximum rate of fresh gas mass flow is:
s
tsts t
Mm =& (3.76)
Thus, the theoretical volumetric efficiency of screw compressor is derived to be:
ts
sglt
ts
ilt
ts
dttv M
tmMM
MMmm &
&
& −=
−== 11 )(
η (3.77)
87

The theoretical volumetric efficiency is based on the theoretical mass flow
rate. The experimental mass flow rate will always be less than the theoretical
inducted mass flow rate due to imperfect nature of ports, wall friction and other
losses. The experimental volumetric efficiency may be calculated based on the actual
measurement of mass flow rate. The experimental volumetric efficiency is defined
as:
ts
eev m
m&
&=η (3.78)
In a screw compressor, injection of oil improves the volumetric efficiency. The
improvement is due to the fact that oil acts as a sealant to decrease the leakage
mass and that the injection of oil makes the compression process to approach
isothermal situation. However, addition of excess oil decreases the volumetric
efficiency due to the availability of less volume during the suction process to admit
fresh charge of gas.
Adiabatic efficiency
If the compression is an adiabatic process, the adiabatic compression work is:
⎥⎥⎥
⎦
⎤
⎢⎢⎢
⎣
⎡−⎟⎟
⎠
⎞⎜⎜⎝
⎛=
−
1
1k
k
s
dspdtad P
PTcmW && (3.79)
where k= Cp/Cv for the gas.
Similarly, for isothermal compression:
⎟⎟⎠
⎞⎜⎜⎝
⎛=
s
dsdtiso P
PRTmW ln&& (3.80)
The theoretical mass flow rate is usually different from the experimental mass
flow rate . Thus based on experimental mass flow quantities, these works can be
redefined as:
dtm.
em.
88

⎥⎥⎥
⎦
⎤
⎢⎢⎢
⎣
⎡−⎟⎟
⎠
⎞⎜⎜⎝
⎛=
−
1,
1k
k
s
dspeead P
PTcmW && (3.81)
and
⎟⎟⎠
⎞⎜⎜⎝
⎛=
s
dseeiso P
PRTmW ln, && (3.82)
The actual power input to the compressor for only gas compression is
calculated from the area of the indicator diagram. The indicator diagram is the actual
power for compression work, which is obtained from an experimentally measured p-v
curve. This curve may be obtained through the difficult and expensive process of
conducting compressor tests with pressure transducers located within the pair of
cavities. Alternatively, the power can be estimated in terms of enthalpy gain of the
flow and the heat transfer rate, assuming that we can measure the discharge and
suction temperatures accurately. This estimate may be expressed as shown below.
)(, sdpeeact TTcmW −= && (3.83) +Qremoved (Heat leaving the system) -Qadded (Heat entering the system)
The temperature difference (Td-Ts) is the experimentally measured difference
between the discharge and suction temperatures. It is common to ignore the heat
transfer in the above equation because of the difficulty in its quantification and also
because, in the event of rapid compression, the heat flux per cycle is generally small
with respect to the change in gas enthalpy. This assumption may produce gross
errors in the estimate of actual power.
The efficiency definitions based on the above descriptions are:
Theoretical adiabatic efficiency, eact
adad W
W
,&
&=η (3.84)
89

Experimental adiabatic efficiency, eact
eadead W
W
,
,, &
&=η (3.85)
Theoretical isothermal efficiency, eact
isoiso W
W
,&
&=η (3.86)
Experimental isothermal efficiency, eact
eisoeiso W
W
,
,, &
&=η (3.87)
To overcome all these practical difficulties, the efficiency is defined in terms
of system power, which can be measured reasonably accurately by an energy meter.
The system power is the power required for an entire compression system and is the
sum of the shaft power and several additional power requirements due to the
presence of controllers and other peripheral systems. Based on the experimental
shaft power, the overall efficiency can be defined as:
Overall theoretical adiabatic efficiency, esys
adadover W
W
,, &
&=η (3.88)
Overall experimental adiabatic efficiency, esys
eadeadover W
W
,
,,, &
&=η (3.89)
Overall theoretical isothermal efficiency, esys
isoisoover W
W
,, &
&=η (3.90)
Overall experimental isothermal efficiency, esys
eisoeisoover W
W
,
,,, &
&=η (3.91)
A more appropriate efficiency definition is specific overall efficiency, which is defined
as follows.
90

Specific overall adiabatic efficiency,
⎟⎟
⎠
⎞
⎜⎜
⎝
⎛
⎟⎟⎠
⎞⎜⎜⎝
⎛
=−
e
sys
dt
ad
adover
mW
mW
&
&
&
&
,η (3.92)
Specific overall isothermal efficiency,
⎟⎟
⎠
⎞
⎜⎜
⎝
⎛
⎟⎟⎠
⎞⎜⎜⎝
⎛
=−
e
sys
dt
iso
isoover
mW
mW
&
&
&
&
,η (3.93)
Equations (3.88) and (3.89) have been used to calculate the theoretical and
experimental adiabatic efficiencies in the study, the results being presented in
Chapter IV and V.
91

Chapter IV
NUMERICAL MODEL
Rotary twin-screw compressors are widely used in industry, particularly in
refrigeration and cryogenic plants and for generating compressed air in industrial
applications. Unlike other compressors, the compression mechanism in oil injected
twin-screw compressor is complex. Hence it is difficult to estimate compressor
performance analytically. Experimental investigations, on the other hand become too
expensive because the manufacturing deviations from one compressor to another for
the same capacity and for the same use are significant. Also, large number of
specimen rotors have to be fabricated and tested to arrive at any reasonable
conclusion. For example, interlobe clearance which has significant influence on
volumetric efficiency can hardly be kept constant among different types of test
rotors.
The operation of any compressor requires an input of mechanical work, which
is eventually converted to heat, principally the heat of compression. The operation of
compressor also results in mechanical, dynamic and frictional losses. Therefore, the
efficiency of compressor is mainly dependent on the quality of rotor design. Apart
from flow through leakage gaps, the quantity and type of lubricant used have
significant effect.
The pressure and temperature of inducted gas and the temperature of
injected oil have direct effect on temperature of the gas in suction cavities. Oil to gas
mass ratio, pressure ratio, interlobe clearance, blowhole area, male wrap angle, and
rotational speed of male rotor determine volumetric and adiabatic efficiencies. In this
chapter, we have analysed the influence of these operating parameters on
volumetric efficiency basing on the solution of governing equations derived in
chapter III. As an example, data on particular compressors available in our
laboratory have been taken as input parameters.

4.1 Evaluation of Heat transfer Coefficient
The value of the heat transfer coefficient between gas and oil is essential for
simulation of the compression process. Fujiwara and Osada [64] determined the heat
transfer coefficient using experimental performance data. The same methodology has
been followed in this study. The heat transfer coefficient is determined from an
experimental plot of the relative volumetric efficiency versus the suction temperature
for four working fluids: air, nitrogen, argon and helium.
The expression for heat transfer coefficient as given by equation (3.39) in
chapter III, is rewritten as:
s
ev
s
ts
dTd
AtkVkP
hη
)1(1
−= (4.1)
where k is ratio of specific heats, ts is suction time, evη is experimental volumetric
efficiency and Ts is suction temperature.
The heat transfer coefficient is related to gradient of volumetric efficiency
which is assumed to be constant for constant heat transfer coefficient. At present,
the estimation of volumetric efficiency is not essential to determine its gradient. This
value can be easily obtained from the gradient of the relative volumetric efficiency.
The relative efficiency is defined as the ratio of volumetric efficiency at a given
temperature to the volumetric efficiency at a reference temperature.
stdev
evevrel
,, η
ηη = (4.1a)
evrel ,η = {(Vact at a given temperature)/ (Volume of the suction cavities)}/ {(Vact at
reference temperature)/(Volume of the suction cavities)}
= (Volume flow rate at a given temperature)/ (Volume flow rate at a reference
temperature)
Then
s
evrelstdev
s
ts
dTd
AtkVkP
h ,,
1
)1(
ηη
−= (4.1b)
93

stdev ,η is an unknown but is expected have a value between 0.8 and 1. Considering
the large uncertainty in the value of oil surface area, it is not worthwhile to determine
h to very high accuracy. We may take a value of stdev ,η to be unity for the purpose of
calculating the value of heat transfer coefficient h. Then the working form of equation
(4.1) becomes:
s
evrel
s
ts
dTd
AtkVkP
h ,1
)1(
η−
= (4.1c)
The actual volume flow rate can be measured by rotameter at suction side for
different suction temperatures. Using experimentally measured flow rate, relative
volumetric efficiency as a function of inlet gas temperature for air, nitrogen argon, and
helium are presented in Figures 4.1 to 4.4 respectively. It is observed that the
relationships are linear in all four cases. The slopes of these lines give s
evrel
dTd ,η
for the
four working fluids. These values can be directly substituted in equation (4.1) to yield
the heat transfer coefficient between gas and oil. The values of s
evrel
dTd ,η
for air,
nitrogen, argon, and helium are estimated to be 0.0026K-1, 0.0027K-1, 0.0026K-1 and
0.0025K-1 respectively. (Equations of the straight lines are given in their respective
figures)
94

Pd/Ps=8.65;Tli=308K
y = 0.0026x + 0.2416
0.99
1
1.01
1.02
1.03
1.04
1.05
1.06
292 296 300 304 308 312 316 320
Suction temperature(K)
Rel
ativ
e vo
lum
etric
effi
cenc
yAir
Figure 4.1: Experimental volumetric efficiency curve against suction temperature with air (efficiencies are relative to suction temperature of 294K).
Pd/Ps=8.65;Tli=308K
y = 0.0027x + 0.1791
0.99
1
1.01
1.02
1.03
1.04
1.05
1.06
1.07
298 302 306 310 314 318 322 326
Suction temperature (K)
Rel
ativ
e vo
lum
etric
effi
cien
cy
Nitrogen
Figure 4.2: Experimental volumetric efficiency curve against suction temperature with nitrogen (efficiencies are relative to suction temperature of 300K).
95

Pd/Ps=8.65;Tli=308K
y = 0.0026x + 0.24
0.99
1
1.01
1.02
1.03
1.04
1.05
1.06
1.07
296 300 304 308 312 316 320 324 328Suction temperature(K)
Rel
ativ
e vo
lum
etric
effi
cien
cyArgon
Figure 4.3: Experimental volumetric efficiency curve against suction temperature with argon (efficiencies are relative to suction temperature of 298K).
Pd/Ps=8.65;Tli=308K
y = 0.0025x + 0.2299
0.98
0.99
1
1.01
1.02
1.03
1.04
1.05
1.06
300 304 308 312 316 320 324
Suction temperature(K)
Rel
ativ
e vo
lum
etric
effi
cien
cy
Helium
Figure 4.4: Experimental volumetric efficiency curve against suction temperature with helium (efficiencies are relative to suction temperature of 302K).
96

4.2. Summary of Governing Equations
The set of equations derived in chapter III are rewritten here before solving
them. The leakage gas and oil flow rates and the state properties of gas during the
compression and discharge process can be found with respect to time using these
algebraic and differential equations. Temperature T1 is the final temperature at the
end of the suction step, but the initial temperature at the starting of the compression
step.
The set of first order differential equations (3.43), (3.54), (3.55), (3.58),
(3.59), and (3.68) and the algebraic equation (3.30) are reproduced here for ready
reference. They have been renumbered for clarity of presentation.
[ ] 0TMct)TT(hATMcTMcTTMc 2s1tpssoilsilps1tp1
21ilp =−−−++− (4.2)
l
li
l
log mmdtdV
dtdV
ρρ
&&−+= (4.3)
)](
)()([1
lgggv
ggo
g
g
gigg
ggb
l
libb
l
lo
g
TTTMChAPV
mMPV
k
mMTPVT
km
PPkPm
dtdVkP
VdtdP
−−−
++−++−=
&
&&&
ρρ (4.4)
)](
)1()()()1(
[
lggv
gg
goggb
g
gi
l
lo
l
lib
g
gg
TTMC
hA
TkMm
TkTMmmm
PP
dtdV
VTk
dtdT
−−
−−−++−−
−=&&&&
ρρ (4.5)
)TT(cM
hAMm
)TT(dtdT
lglll
lillb
l −+−= (4.6)
gogig mm
dtdM
&& −= (4.7)
lolil mm
dtdM && −= (4.8)
97

The set of six differential equations (4.3) to (4.8) describe the six variables
Vg, P, Tg, Tl, Mg and Ml as function of time, during compassion-discharge process, the
algebraic equation (4.2) giving the initial temperature T1. The variable V and hence
dtdV
, are known functions of time. The set of differential equations can be written in
their respective functional form as:
⎟⎠
⎞⎜⎝
⎛= llolig mm
dtdVf
dtdV
ρ,,,1&& (4.9)
⎟⎠
⎞⎜⎝
⎛= lloligogigbblggg mmmmTPdtdVTMPVTf
dtdP ρ,,,,,,,,,,,,2
&&&& (4.10)
⎟⎠
⎞⎜⎝
⎛= lloligogigbblgggg mmmmTP
dtdVTMPVTf
dtdT
ρ,,,,,,,,,,,,3&&&& (4.11)
( )lillblgl mMTTTf
dtdT &,,,,4= (4.12)
( gogig mmf
dtdM
&,5= ) (4.13)
( lolil mmf
dtdM &,6= ) (4.14)
The variables Pb , Tgb , Tlb , the subscript b stantding for locations beyond the
working chamber, refer to the cavities that are ahead of and behind the cavities
being analysed. The pressure and temperature of gas and oil in these cavities need
to be known at time t for calculating of gas and oil leakage into and out of the
working chamber. The values of the variables Pb , Tgb , Tlb in the lagging chamber at
time t are equal to those of P, Tg , Tl at a time mmnN
t 1− , while those in the leading
chamber are equal to the value of P, Tg , Tl at a time mmnN
t 1+ . The leakage flow
rates of gas and oil are calculated from equations (3.15), (3.16a), (3.17), and (3.20).
Equation (4.2) is utilized to determine T1 , the fluid temperature at the end of
the suction process, once the leakage flow rates of gas and oil are established. This
98

temperature is an input parameter for calculation of gas leakage. The density of oil
(ρl) can be assumed to be constant and independent of oil temperature. Thus, in the
above set of equations the variables Vg, P, Tg, Tl, Mg, and Ml are to be evaluated from
six differential equations. Set of these equations poses the initial value problem
which can be solved by a standard iterative algorithm until all the parameters are
converged.
The theoretical volumetric and adiabatic efficiencies of twin-screw compressor
are estimated after computing the leakage flow rates of gas and oil. Numerically it is
convenient to find the volumetric efficiency in terms of mass flow rate rather than
volume flow rate. Theoretical volumetric efficiency of twin-screw compressor is
redefined at condition (Ps ,T1) as:
( )
1
11 )(
t
sglt
t
ilt
t
dtrv M
tmMM
MMmm &
&
& −=
−==η (4.15)
Similarly, the experimental volumetric efficiency is redefined as:
t
erev m
m&
&=η (4.16)
The theoretical adiabatic efficiency is defined as the ratio of theoretical work required
to compress the gas adiabatically to the actual power input to the compressor
system and is written as:
esys
adra W
W
,&
&=η (4.17)
The experimental adiabatic efficiency of the compressor is expressed as:
esys
eadrae W
W
,
,
&
&=η (4.18)
4.3 Input and output Parameters
Simulation of compressor performance needs input data on the geometrical
and process parameters. A list of parameters is given in tables 4.1 to 4.11 for 5.5 kW
and 37 kW compressors.
99

Table 4.1: Rotor specifications of 5.5 kW prototype compressor
Name of constant Value Units
Number of lobes on the male rotor 5 none
Number of lobes on the female rotor 6 none
Male wrap angle 300 degree
Diameter of male rotor 72 mm
Diameter of female rotor 54 mm
Length of the rotor 90 mm
Cross sectional area of male rotor groove 210 mm2
Cross sectional area of female rotor groove 170 mm2
Lobe tip width of male rotor 0.5 mm
Lobe tip width of female rotor 1.8 mm
Rotational speed of male rotor 4350 rpm
Table 4.2: Clearances and Sealing line lengths obtained from experiment/actual measurements of 5.5 kW compressor
Constants Value Unit
Inter lobe clearance 0.027 mm
Rotor tip-housing clearance 0.03 mm
Clearance between rotor and discharge end face plate 0.03 mm
Leading blowhole area 2 mm2
Trailing blowhole area 2 mm2
Interlobe sealing line length 36 mm
Sealing line length of rotor tip housing of male rotor 180 mm
Sealing line length of rotor tip housing of female rotor 143 mm
Sealing line length at leading discharge end face of male rotor 18 mm
Sealing line length at leading discharge end face of female rotor 16 mm
Sealing line length at lagging discharge end face of male rotor 28 mm
Sealing line length at lagging discharge end face of female rotor 20 mm
100

Table 4.3 Flow coefficients in 5.5 kW compressor
Leakage path name value Units
Inter lobe clearance 0.65 none
Clearance between lobe tip and casing bore 0.7 none
Clearance between rotor and discharge end face plate 0.4 none
Leading blowhole 0.7 none
Trailing blowhole 0.6 none
Table 4.4: Input constants in 5.5 kW compressor
Name of constant Value Units
Heat transfer area between gas and oil (eq. 3.40) 0.00489 m2
Density of oil (supplier’s specifications) 843 kg/m3
Specific heat of the oil (measured) 1.86 kJ/kg-K
Volume of a pair of male and female cavities 34.2×10⁻⁵ m3
Table 4.5: Rotor specifications of 37 kW prototype compressor
Name of constant Value Units
Number of lobes on the male rotor 5 none
Number of lobes on the female rotor 6 none
Male wrap angle 300 degree
Diameter of male rotor 152 mm
Diameter of female rotor 118 mm
Length of the rotor 235 mm
Cross sectional area of male rotor groove 1075 mm2
Cross sectional area of female rotor groove 1020 mm2
Lobe tip width of male rotor 0.9 mm
Lobe tip width of female rotor 2.6 mm
Rotational speed of male rotor 2950 rpm
101

Table 4.6: Clearances and sealing line lengths obtained from experiment/actual measurements on 37 kW compressor
Constants Value Unit
Inter lobe clearance 0.035 mm
Rotor tip-housing clearance 0.03 mm
Clearance between rotor and discharge end face plate 0.029 mm
Leading blowhole area 3.3 mm2
Trailing blowhole area 3.3 mm2
Interlobe sealing line length 74 mm
Sealing line length of rotor tip housing of male rotor 460 mm
Sealing line length of rotor tip housing of female rotor 345 mm
Sealing line length at leading discharge end face of male rotor 34.5 mm
Sealing line length at leading discharge end face of female rotor 30 mm
Sealing line length at lagging discharge end face of male rotor 62.5 mm
Sealing line length at lagging discharge end face of female rotor 44 mm
Table 4.7: Flow coefficients in 37 kW compressor
Leakage path name value Units
Inter lobe clearance 0.62 none
Clearance between lobe tip and casing bore 0.67 none
Clearance between rotor and discharge end face plate 0.36 none
Leading blowhole 0.67 none
Trailing blowhole 0.58 none
Table 4.8: Input constants in 37 kW compressor
Name of constant Value Units
Heat transfer area between gas and oil (eq. 3.40) 0.02895 m2
Density of oil (supplier’s specifications) 843 kg/m3
Specific heat of the oil (measured) 1.86 kJ/kg-K
Volume of a pair of male and female cavities 49.2×10⁻⁴ m3
102

Table 4.9: Input variables to be calculated
Name of constant Notation Units
Modified gas constant for oil and gas mixture Rm J/kg-K
Specific heat ratio of oil and gas mixture β none
Specific heat ratio of gas k none
Heat transfer coefficient between gas and oil h W/m2-K
Time required for suction process ts sec
Time required for compression and discharge process Γ sec
Gas constant R J/kg K
Oil to gas mass ratio φ none
Male rotor tip speed Um m/sec
Female rotor tip speed Uf m/sec
Table 4.10: Operating variables
Parameter Notation Units
Discharge pressure of working gas Pd N/m2
Inlet pressure of working gas Ps N/m2
Inlet temperature of the gas Ts K
Inlet temperature of the oil Tli K
RPS of the male rotor Nm rev/sec
Supplied Oil rate moil kg/sec
Density of gas ρg kg/m3
Specific heat of gas at constant pressure Cp J/kg-K
Specific heat of gas at constant volume Cv J/kg-K
103

Table 4.11: Output Parameters
Parameter Notation Units
Pressure in the working space P N/m2
Volume of the working space V m3
Volume of gas in the working space Vg m3
Temperature of gas in the working space Tg K
Temperature of oil in the working space Tl K
Mass of gas in the working space Mg kg
Mass of oil in the working space Ml kg
Leakage gas mass flow rate in to the cavity mgi kg/sec
Leakage gas mass flow rate out of the cavity mgo kg/sec
Leakage oil mass flow rate in to the cavity mli kg/sec
Leakage oil mass flow rate out of the cavity mlo kg/sec
4.4 Solution of governing equations
The values of the variables Pb, Tgb , Tlb , mgi , mgo , mli , and mlo are known
at different time intervals from the results on the variables P, Tg, Tl over the full
time duration for a known value of dtdV
as discussed in the section 4.2. The flow
coefficients can also be assumed to match with volumetric efficiency. Hence, the set
of equations (4.9) to (4.14) can be reduced to another functional form consisting of
six dependent variables Vg, P, Tg, Tl, Mg, and Ml. These equations represent the
formulation of numerical solution by Runge-Kutta 4th order method as:
( )lglggg MMTTPVtF
dtdV
,,,,,,1= (4.19)
( )lglgg MMTTPVtFdtdP
,,,,,,2= (4.20)
( )lglggg MMTTPVtF
dtdT
,,,,,,3= (4.21)
104

( )lglggl MMTTPVtF
dtdT
,,,,,,4= (4.22)
( )lglggg MMTTPVtF
dtdM
,,,,,,5= (4.23)
( )lglggl MMTTPVtF
dtdM
,,,,,,1= (4.24)
With their respective initial conditions at defined, 40000000
,,,,,, lglgg MMTTPVt th order
Runge-Kutta method can be used to solve equations (4.19) to (4.24) for an incremental
time step h=∆t as outlined below. For convenience, the suffix i (i=1 to 6) is used to
represent the k values of Vg, P, Tg, Tl, Mg and Ml respectively.
(4.25) ),,,,,,()(0000000
1 lglggi MMTTPVthFik =
]
2)6(
,2
)5(
,2
)4(,
2)3(
,2
)2(,
2)1(
,2
[)(
10
1
01
01
01
01
00
2
kM
k
Mk
Tk
Tk
Pk
VhthFik
l
glggi
+
++++++= (4.26)
]
2)6(
,2
)5(
,4
)4(,
2)3(
,2
)2(,
2)1(
,2
[)(
20
2
02
0
12
02
02
00
3
kM
k
Mk
Tk
Tk
Pk
VhthFik
l
gggi
+
++++++= (4.27)
)]6(),5(
),4(),3(),2(),1(,[)(
3
0
3
0
3
0
3
0
3
0
3
00
4
kMk
MkTkTkPkVhthFik
l
glggi
+
++++++= (4.28)
[ ]4321 )(2)(2)(61
)( kikikikik +++= (4.29)
Hence, the values of six parameters after the first time step are,
105

)1(01
kVV gg += (4.30)
) (4.31) 2(01
kPP +=
)3(01
kTT gg += (4.32)
)4(01
kTT ll += (4.33)
(4.34) )5(01
kMM gg +=
) (4.35) 6(01
kMM ll +=
To compute the variables 222222
,,,,, lglgg MMTTPV at second time step, the variables
000000,,,,, lglgg MMTTPV are replaced by
111111,,,,, lglgg MMTTPV .
The calculation of compression process is done by taking small male rotor
rotation angle ‘δθ’ in terms of time. It is assumed that the compression process starts
when the suction process is completed and the tooth gap volume has reached its
maximum. The compression-discharge time for 5.5 kW compressor at 4350 rpm is
0.01425 s for a wrap angle of 3000. For 10 number of time steps, the time for each
step (∆t) is approximately 0.001425 s. At steady state, all the changes in the
compressor working chamber/cavities are related to rotor turning and the state in a
groove varies as function of rotor turning angle or time. Therefore, if the change in a
state of one pair of grooves is calculated, the states in all other grooves can be known.
All the governing equations summarized above are used for suction and discharge
process simulation. Due to the overlapping of discharge processes over the discharge
port area, the outlet pressure (discharge over certain angle of rotation of male rotor) is
assumed to be constant. Thus for time step of 10 divisions, compression process is
assumed to be 8 divisions and discharge process is 2 divisions with 600 overlap. Also
106

based on built-in volume ratio, the compression process is completed when the built in
volume ratio reaches 5/6th of the initial volume.
To calculate the leakage flow rate, the state of the grooves beyond the leakage
path must be known a priori. But this information is not available at the beginning of
the calculation. Therefore, to start with, the state in the grooves is computed assuming
no leakage. Subsequently the leakage flow is calculated and the state is corrected
following the Runge-Kutta procedure. This calculation is iterated until the system
converges. Finally the volumetric and adiabatic efficiencies are calculated. An over view
of the flow chart is given in Figure 4.5. A more elaborate step by step solution
procedure is given below.
Step 1: Assuming no leakage initially. The initial values of Tgb =Tg =Tl=300 K,
Pb= P=1.0132 bar, Vg=suction gas volume are assumed. Also
appropriate values of flow coefficients are assumed to match with
experimental volumetric efficiency.
Step 2: With the time steps of ∆t = 0.001425 s, equations (4.19) to (4.24) is
solved by Range-Kutta 4th order method. The functional relations for
solution are given by equations (4.3) to (4.8). The equation (4.2) is
solved for the suction temperature, T1.
Step 3: The step 2 is repeated for the up gradation of variables Tg, Vg , P, Tl ,
Mg , Ml , and T1 to achieve local convergence.
Step 4: If the change in all six variables in step 3 between two successive
iterations is less than 10-6, the local convergence criteria is assumed
to be satisfied for that time division.
Step 5: For the subsequent time step ∆t, the steps 2 to 4 are carried out till
the end of compression process.
Step 6: If all the variables satisfy the convergence criteria between two
successive iterations for the compression process, the programme is
assumed to be independent of time divisions and it is globally
converged. Otherwise, the time step is halved and the steps 2 to 6 are
repeated.
Step 7: Since the values of relevant variables for the calculation of leakage
are available at time (t-∆t), t and (t+∆t), these variables are again
107

recalculated in the presence of leakages. The leakage values are
calculated from equations (3.15), (3.16a), (3.17), and (3.20).
Step 8: The steps 2 to 7 are repeated.
Step 9: The volumetric efficiency is calculated and compared with the
experimental values.
Step 10: If the difference in volumetric efficiency is not acceptable, then a set
of new flow coefficients are assumed.
Step 11: The steps 2 to 10 are repeated.
Step 12: The programme is terminated when the convergence criteria are
satisfied in the steps 4, 6 and 10.
Start
Input
Initialize
Calculate suction process
Calculate compression and discharge process using step by step procedure
Converged No
YesCalculate volumetric
efficiency
Stop
Figure 4.5: Flow diagram for numerical solution
108

4.5 Results and Conclusions
A numerical model of the oil injected twin-screw compressor has been
developed covering both suction and compression-discharge processes to predict the
performance of an oil injected twin screw compressor applied to compression of
different working gases. Heat transfer coefficient between gas and oil used in
numerical calculations is determined from experimental observations. The flow
coefficients have been determined from experimentally obtained compressor
efficiencies.
The objective of the present investigation is to evaluate the performance and
study the possible effects of operational parameters on performance of commercially
available air compressor with different working gases. All the selected gases are tested
with two compressors of similar type but different capacities. Air is a mixture of
nitrogen, oxygen, moisture and traces of other gases, with a molecular weight
approximately 29. The thermophysical properties of nitrogen are nearer to that of air.
In addition to air and nitrogen, we have used to two monatomic gases: argon and
helium.
The influence of interlobe clearance on the p-v diagram profile with all four
working gases is presented in Figures 4.6 to 4.9. These figures show that the area of
the p-v diagram decreases with increase of interlobe clearance for all the working
gases. This decrease is more severe for helium as shown in Figure 4.9. This is because
of higher leakage rate from the compression chamber by interlobe leakage.
Figure 4.10 gives the temperature history of all four working gases during the
compression and discharge process. The rise in temperature of all the gases during
compression process appears higher than that observed in practice. It is because of
the assumption that heat is transferred from gas to oil only. In reality, a significant
portion of the heat generated will be transferred to the screw rotors and the casing in
addition to the injected oil. The temperature profile for air and nitrogen are almost
identical because of the near equality of their thermophysical properties. The rise in
gas temperature in case of argon is highest due to the monatomic nature of the gas
and high molecular weight. Temperature rise with helium is small because of low
molecular weight and low density. The influence of oil to gas mass ratio on gas
temperature rise for all the four working gases during compression process is
109

presented in Figures 4.11 to 4.14. It may be observed that the effect of oil to gas mass
ratio beyond a certain limit has little effect on gas temperature.
The leakage of gas and oil through interlobe clearance goes directly to the
suction chamber and reduces the charging efficiency. The variation of volumetric
efficiency with interlobe clearance at a fixed injected oil temperature and at different
rotational speeds of male rotor with different working gases is shown in Figures 4.15
to 4.18. The variation of volumetric efficiency of helium is relatively higher due to
higher leakage rate. Variation of volumetric efficiency with interlobe clearance for
different gases at fixed male rotor rotational speed, pressure ratio and injected oil
temperature is presented in Figure 4.19. The influence of interlobe clearance on
volumetric efficiency is relatively higher for helium than for the other three gases.
Figure 4.20 helps to visualize the influence of rotational speed of male rotor on
volumetric efficiency with different working gases at fixed interlobe clearance, suction
conditions and injected oil temperature. At lower rotational speed the volumetric
efficiency of compressor with helium is less than that with the other gases. At higher
rotational speed, the efficiency difference among working gases is low.
The influence of wrap angle on volumetric efficiency of a compressor is shown
in Figure 4.21. It shows that the effect of male wrap angle on volumetric efficiency is
small as seen in the figure. The effect of blowhole area on volumetric efficiency is
shown in Figure 4.22. The variation of volumetric efficiency with increase in blowhole
area with air, nitrogen and argon is relatively small at fixed rpm. But the effect is
significant with helium as the working gas.
110

Air;Tli=308K;RPM=4350
0
1
2
3
4
5
6
7
8
9
10
11
0 0.1 0.2 0.3 0.4 0.5 0.6 0.7 0.8 0.9 1
Vg/Vt1
P d/P
s
e=0.03mme=0.09mme=0.12mm
Discharge port opens
Figure 4.6: Effect of interlobe clearance (e) on p-v diagram with air at a fixed
injected oil temperature and inlet condition.
Nitogen;Tli=308K;RPM=4350
0
1
2
3
4
5
6
7
8
9
10
11
0 0.1 0.2 0.3 0.4 0.5 0.6 0.7 0.8 0.9 1
Vg/Vt1
P d/P
s
e=0.03mme=0.09mme=0.12mm
Discharge port opens
Figure 4.7: Effect of interlobe clearance (e) on p-v diagram with nitrogen at a
fixed injected oil temperature and inlet condition.
111

Argon;Tli=308K;RPM=4350
0
1
2
3
4
5
6
7
8
9
10
11
0 0.1 0.2 0.3 0.4 0.5 0.6 0.7 0.8 0.9 1
Vg/Vt1
P d/P
s
e=0.03mme=0.09mme=0.12mm
Discharge port opens
Figure 4.8: Effect of interlobe clearance (e) on p-v diagram with argon at a fixed injected oil temperature and inlet condition.
Helium;Tli=308K;RPM=4350
0
1
2
3
4
5
6
7
8
9
10
11
0 0.1 0.2 0.3 0.4 0.5 0.6 0.7 0.8 0.9 1
Vg/Vt1
P d/P
s
e=0.03mme=0.09mme=0.12mm
Discharge port opens
Figure 4.9: Effect of interlobe clearance (e) on p-v diagram with helium at a fixed
injected oil temperature and inlet condition.
112

Pd
250
300
350
400
450
500
550
600
650
0 0.002 0.003 0.005 0.006 0.008 0.009 0.011 0.012 0.014 0.015
Compression time(s)
Tem
pera
ture
(K)
Oil:Air=22:1Oil:N2=22:1Oil:Arg=19:1Oil:He=120:1
/Ps=8.65;RPM=4350
Discharge port opens
Air & Nitrogen
Figure 4.10: Comparison of working gas temperatures during compression-discharge process at their experimental oil-gas mass ratio.
Air;Pd/Ps=8.65;RPM=4350
300
325
350
375
400
425
450
475
500
525
550
575
600
0 0.0015 0.003 0.0045 0.006 0.0075 0.009 0.0105 0.012 0.0135 0.015
Compression time (s)
Tem
pera
ture
(K)
Tg, Ml/Mg=10Tl, Ml/Mg=10Tg, Ml/Mg=12Tl, Ml/Mg=12Tg, Ml/Mg=14Tl, Ml/Mg=14Tg, Ml/Mg=16Tl, Ml/Mg=16Tg, Ml/Mg=18Tl, Ml/Mg=18Tg, Ml/Mg=20Tl, Ml/Mg=20Tg, Ml/Mg=22Tl, Ml/Mg=22Tg, Ml/Mg=24Tl, Ml/Mg=24Tg, Ml/Mg=26Tl, Ml/Mg=26
Discharge port opens
Figure 4.11: Variation of gas and oil temperature during compression-
discharge process with air at different oil-gas mass ratio (Ml/Mg) and at a fixed pressure ratio and rotational speed.
113

Nitrogen;Pd/Ps=8.65;RPM=4350
300
325
350
375
400
425
450
475
500
525
550
0 0.0015 0.003 0.0045 0.006 0.0075 0.009 0.0105 0.012 0.0135 0.015
Compression time(s)
Tem
pera
ture
(K)
Tg, Ml/Mg=10Tl, Ml/Mg=10Tg, Ml/Mg=12Tl, Ml/Mg=12Tg, Ml/Mg=14Tl, Ml/Mg=14Tg, Ml/Mg=16Tl, Ml/Mg=16Tg, Ml/Mg=18Tl, Ml/Mg=18Tg, Ml/Mg=20Tl, Ml/Mg=20Tg, Ml/Mg=22Tl, Ml/Mg=22Tg, Ml/Mg=24Tl, Ml/Mg=24Tg, Ml/Mg=26Tl, Ml/Mg=26
Discharge port opens
Figure 4.12: Variation of gas and oil temperature during compression-
discharge process with nitrogen at different oil-gas mass ratio (Ml/Mg) and at a fixed pressure ratio and rotational speed.
Argon;Pd/Ps=8.65;RPM=4350
300325350375400425450475500525550575600625650
0 0.0015 0.003 0.0045 0.006 0.0075 0.009 0.0105 0.012 0.0135 0.015
Compression time (s)
Tem
pera
ture
(K)
Tg, Ml/Mg=10Tl. Ml/Mg=10Tg, Ml/Mg=12Tl, Ml/Mg=12Tg, Ml/Mg=14Tl, Ml/Mg=14Tg, Ml/Mg=16Tl, Ml/Mg=16Tg, Ml/Mg=18Tl, Ml/Mg=18Tg, Ml/Mg=20Tl, Ml/Mg=20Tg, Ml/Mg=22Tl, Ml/Mg=22Tg, Ml/Mg=24Tl, Ml/Mg=24
Discharge port opens
Figure 4.13: Variation of gas and oil temperature during compression-
discharge process with argon at different oil-gas mass ratio (Ml/Mg) and at a fixed pressure ratio and rotational speed.
114

Pd/Ps=8.65;RPM=4350
300325350375400425450475500525550575600625650
0 0.002 0.003 0.005 0.006 0.008 0.009 0.011 0.012 0.014 0.015
Compression time (s)
Tem
pera
ture
(K)
Tg, Ml/Mg=40Tl, Ml/Mg=40Tg, Ml/Mg=50Tl, Ml/Mg=50Tg, Ml/Mg=60Tl, Ml/Mg=60Tg, Ml/Mg=70Tl, Ml/Mg=70Tg, Ml/Mg=80Tl, Ml/Mg=80Tg, Ml/Mg=90Tl, Ml/Mg=90Tg, Ml/Mg=100Tl, Ml/Mg=100Tg, Ml/Mg=110Tl, Ml/Mg=110Tg, Ml/Mg=120Tl, Ml/Mg=120
Discharge port opens
Figure 4.14: Variation of gas and oil temperature during compression-discharge process with helium at different oil-gas mass ratio (Ml/Mg) and at a fixed pressure ratio and rotational speed.
Air; Pd/Ps=8.65
55
60
65
70
75
80
85
90
95
100
0 0.02 0.04 0.06 0.08 0.1 0.12 0.14 0.16
Interlobe clearance(mm)
( ηrv
%)
RPM=2000RPM=3000RPM=4350RPM=5000RPM=6000
Figure 4.15: Influence of interlobe clearance and rotational speed on
volumetric efficiency with air at constant injected oil temperature and suction condition.
115

Nitrogen; Pd/Ps=8.65
55
60
65
70
75
80
85
90
95
100
0 0.02 0.04 0.06 0.08 0.1 0.12 0.14 0.16
Interlobe clearance(mm)
( ηrv
%)
RPM=2000RPM=3000RPM=4350RPM=5000RPM=6000
Figure 4.16: Influence of interlobe clearance and rotational speed on
volumetric efficiency with nitrogen at fixed injected oil temperature and suction condition.
Argon; Pd/Ps=8.65
60
65
70
75
80
85
90
95
0 0.02 0.04 0.06 0.08 0.1 0.12 0.14 0.16Interlobe clearance(mm)
( ηrv
%)
RPM=2000RPM=3000RPM=4350RPM=5000RPM=6000
Figure 4.17: Influence of interlobe clearance and rotational speed on
volumetric efficiency with argon at fixed injected oil temperature and suction condition.
116

Helium; Pd/Ps=8.65
35
45
55
65
75
85
95
0 0.02 0.04 0.06 0.08 0.1 0.12 0.14 0.16Interlobe clearance(mm)
( ηrv
%)
RPM=2000RPM=3000RPM=4350RPM=5000RPM=6000
Figure 4.18: Influence of interlobe clearance and rotational speed on
volumetric efficiency with helium at fixed injected oil temperature and suction condition.
Pd/Ps=8.65;RPM=4350
40
46
52
58
64
70
76
82
88
94
100
0 0.02 0.04 0.06 0.08 0.1 0.12 0.14 0.16
Interlobe clearance(mm)
( ηrv
%)
AirNitrogenArgonHelium
Figure 4.19: Variation of volumetric efficiency with interlobe clearance with
different working gases at fixed rotational speed and injected oil temperature and at constant suction condition.
117

Pd/Ps=8.65;Tli=308K;e=0.03mm
65
69
73
77
81
85
89
93
97
1500 2500 3500 4500 5500 6500
Rotational speed of male rotor(RPM)
(η r
v%
)
AirNitrogenArgonHelium
Figure 4.20: Variation of volumetric efficiency with different working gases at
different rotational speeds at a fixed interlobe clearance and injected oil temperature and at a constant suction condition.
Pd/Ps=8.65;RPM=4350
88
89
90
91
92
93
94
95
96
150 200 250 300 350
Male wrap angle (degrees)
(η r
v%
)
AirNitrogenArgonHelium
Figure 4.21: Influence of male wrap angle on volumetric efficiency with
different working gases at fixed injected oil temperature and pressure ratio.
118

Pd/Ps=8.65;RPM=4350
85
87
89
91
93
95
0 1 2 3 4 5 6 7 8 9 10 11 12 13
Blowhole area (mm2)
(η r
v%
)AirNitrogenArgonHelium
Figure 4.22: Effect of blowhole area on volumetric efficiency with different
working gases at a fixed injected oil temperature and pressure ratio.
119

Chapter V
EXPERIMENTAL APPARATUS
Electrical power spent on compressors often accounts for the bulk of the
energy requirement in a process industry. To minimize the power and maintenance
cost, special care should be exercised when selecting such equipment. Commonly
employed indicators of compressor performance are its volumetric and power
efficiencies. Additionally, temperature rise to avoid condensation of moisture during
air compression and temperature response of lubricants and coolants used are some
of the major parameters to be considered. This chapter describes the features of the
test system, instrumentation, calibration and measurement of volumetric and
adiabatic efficiencies.
5.1 Compressor Test Rigs
The main motive of the present test is to study the performance of the
lubricated twin-screw compressor under varying operating conditions, particularly its
response to variation of the working gas. Two test benches have been installed in
the laboratory which are identical in all aspects except for the compressor capacities.
Two Kaeser (Germany) make air compressors of capacity 5.5 kW (Model SM 8) and
37 kW (Model BSD 72) are used for the experimental purpose. An upstream pressure
regulating valve is provided at the discharge end of the compressor to regulate
discharge pressure (5.5 bar to 11 bar) and a downstream pressure reducing valve is
provided to regulate the suction pressure between 1.1 bar and 1.6 bar. The
schematic diagram of the experimental test rig using a 5.5 kW compressor is shown
in Figure 5.1. To maintain the purity of working gases, the entire circuit has been
evacuated before charging the gases.

5.5 kW Compressor Test Set up:
The internal circuit of the model SM 8 compressor (41 m3/hr, 5.5 kW) with
piping, instrumentation and control units has been shown in Figure 5.2. The pressure
controllers regulate the pressure at inlet and discharge of the machine at different
operating conditions. The nomenclature of all the built-in components of the
compressor is listed in Table 5.1. Photographs of compressor test bench are given in
Figures 5.3 and 5.4 and a photograph of the screw rotors is given in Figure 5.5.
Table 5.1: Components of the Kaeser (Model SM 8) compressor system 1. Air filter
2. Inlet valve
2.1. Oil filter with plug
3. Drive motor
4. Air end
4.1. Strainer
4.2. Pressure switch-wrong direction of
rotation
5.2. PT100 sensor
6. Oil separation tank
6.1. Pressure gauge
6.2. Hose coupling (oil end)
6.3. Hose coupling (air end)
6.6. Shut off valve-Oil drain
6.9. Oil level sight glass (Min./Max. oil level)
7. Pressure relief valve
8. Oil separator cartridge
9. Oil temperature controller
10. Oil filter
11. Oil cooler
12. Minimum pressure check valve
13. Air cooler
16. Dirt trap
17. Nozzle
18/19.Combined control/vent valve
18. Control valve
19. Vent valve
20. Shut off valve-Vent line
21. Silencer
59.1. Pressure measuring transducer-
air main pressure
121

122

Figu
re 5
.2:
Pip
e an
d in
stru
men
tatio
n (in
side
com
pres
sor
cabi
net)
dia
gram
of
SM 8
com
pres
sor
syst
em
123

(a)
Receivers
Pressure reducing valve Heat Exchanger
Figure 5.3: Experimental test setup with SM 8 compressor.
(b)
Pressure Transducer Temp.Indicator
Pressure Indicator
Gas Rotameter
Figure 5.4: Close up view of compressor test rig using SM 8 compressor.
124

Suction port
Discharge port
Male Rotor
Female Rotor
Figure 5.5: Photograph of screws & casing of SM 8 compressor air end.
37 kW Compressor Set up:
The larger set up is built around a Kaeser Model BSD 72 compressor of 37 kW
capacity and free air delivery of 336 m3/hr. The 37 kW test bench is similar to that of
the SM 8 compressor test setup except for the compressor capacity. The schematic
diagram of 37 kW experimental test setup has been shown in Figure 5.6. The
internal circuit of the compressor with internal piping, instrumentation and control
units are shown in Figure 5.7. Controllers are used to regulate the compressor
package for safe operation at different operating conditions. The nomenclature of all
the built-in components within the compressor cabinet is listed in Table 5.2.
Photographs of the experimental setup have been shown in Figures 5.8 to 5.11.
Because of the larger size of the equipment, gas reservoirs, connecting pipes and the
components of the set up are distributed over two rooms and the outdoors. Figure
5.12 shows the screws of the BSD 72 compressor. Figure 5.13 shows the rotors of
the larger and smaller compressors to give a perspective of the relative sizes.
125

Table 5.2: Components of the Kaeser (Model BSD 72) compressor system 1. Air filter
1.1. Vacuum switch-Air filter
1.2. Dust collector
2. Inlet valve
2.1. Oil filter with plug
3. Drive motor
3.1. Fan motor
4. Air end
4.2. Pressure switch-wrong direction
of rotation
5.2. PT100 sensor
6. Oil separator tank
6.1. Pressure gauge
6.2. Hose coupling (oil end)
6.3. Hose coupling (air end)
6.6. Shut off valve with hose coupling-
oil drain
6.13. Oil level indicator
7. Pressure relief valve
8. Oil separator cartridge
9. Oil temperature controller
10. Oil filter
10.1. Differential pressure switch-oil filter
10.3 Oil flow reduction valve
11. Oil cooler
11.6. Shut off valve with hose coupling-
oil drain
12. Minimum pressure check valve
13. Air cooler
13.1. Hose coupling
16. Dirt trap
17. Nozzle
18/19. Combined control/vent valve
18. Control valve
19. Vent valve
20. Shut off valve-Vent line
21. Silencer
53. Coupling
59.1. Pressure measuring transducer-Air
main pressure
59.2. Pressure measuring transducer-
Internal pressure
126

127
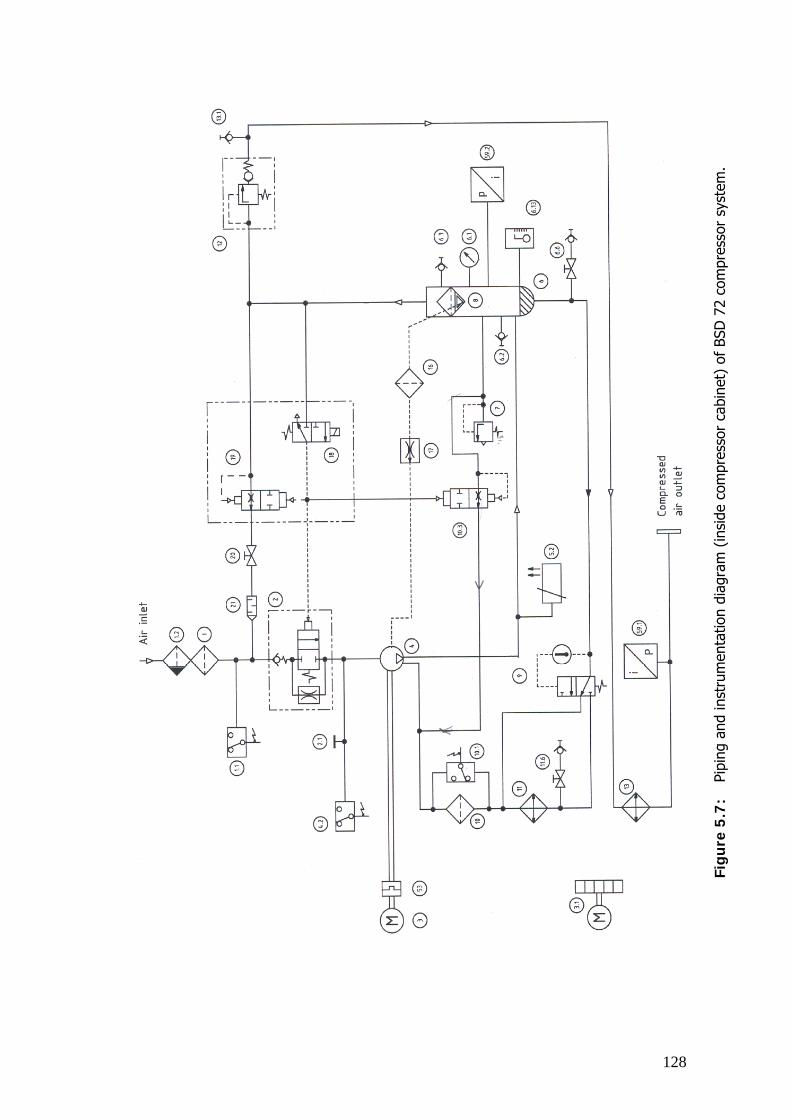
Figu
re 5
.7:
Pipi
ng a
nd in
stru
men
tatio
n di
agra
m (
insi
de c
ompr
esso
r ca
bine
t) o
f BS
D 7
2 co
mpr
esso
r sy
stem
.
128

Fine filters
Rough filter
Oil Rotameter
Figure 5.8: Photograph of 37 kW compressor test rig (partial).
Pressure Indicator
Temp.Indicator
Heat Exchanger
Figure 5.9: Photograph of 37 kW compressor test rig (another view).
129

Pressure regulating Valves
Pressure Transducer
Figure 5.10: Photograph of piping and instrumentation of 37 kW compressor test
rig (partial).
Figure 5.11: Photograph of 37 kW compressor receivers.
130

Female RotorMale Rotor
Figure 5.12: Screws of 37 kW compressor.
5.5 kW rotors & casing
37 kW rotors & casing
Figure 5.13: Photograph of 5.5 kW and 37 kW compressor rotors and their casings.
The oil flow system
Lubricating oil plays a special role in screw compressors. It removes the heat
of compression of the gas, lubricates the contacting surfaces and seals the gaps
between the rotors and the casing. In air compressors, it helps in maintaining the
operating temperature above 800C to ensure that even under discharge conditions,
131

the moisture does not condense. This situation is ensured in air compressors by
deliberately undersizing the oil cooling heat exchanger and using a temperature
regulator. In case of gas compression applications, where there is no moisture to
condense, this special provision can be dispensed with. In stead, an additional heat
exchanger is added to the existing heat exchanger to cool the lubricating oil to as
low temperature as possible.
The oil flow system with secondary cooler has been shown in Figure 5.14.
After passing through the inbuilt heat exchanger of the compressor, the lubricating
oil flows to the externally connected heat exchanger before being injected into the
compressor. Oil flow can be regulated with the help of externally connected oil flow
control valves. The flow rate of oil is measured with a rotameter.
Rotam eter
PS
PG
P T100
3 /4”
PT100
O il separator
O il F ilter
Inbu ilt O il Coo ler
Externa l HE
Com pressor
O il flow contro l va lve
O il flow contro l va lve
Figure 5.14: Schematic of the oil flow system for SM 8 and BSD 72 compressors.
5.2 Selection of equipment
The following are the specifications of various equipment, instruments and
other accessories used in building the experimental test setup.
(i) Compressor 1
Make : Kaeser (Germany)
Model : SM 8
Profile of screw : Sigma
Free air delivery : 41 m3/ hr (at designed discharge pressure)
132

Suction pressure : Atmospheric
Maximum Pressure : 11 bar
Motor : 5.5 kW, 20 amp, 3Φ, 50Hz, 400V±10%, 3000 rpm
(belt driven)
Oil capacity : 5 L
Cooling : Air
(ii) Compressor 2
Make : Kaeser (Germany)
Model : BSD 72
Profile of screw : Sigma
Free air delivery : 336 m3 /hr (at designed discharge pressure)
Suction pressure : Atmospheric
Maximum Pressure : 12 bar
Motor : 37 kW, 74 amps, 3 Φ, 50 Hz, 415V±10%, 3000 rpm
(direct coupled)
Oil capacity : 24 L
Cooling : Air
(iii) Filters
Particulate filter
Make : Kaeser (Germany)
Model : FD-48
Separated Practical size : > 1 µm
Efficiency : 99.99999% (manufacturers’ specification)
Oil content : ≤ 1 mg/m3
Pressure drop : 0.07 bar
Activated carbon combination filter
Make : Kaeser Compressors (Germany)
Model : FFG-10
Separated Practical size : > 0.01 µm
Oil content : ≤ 0.001 mg/m3
133

Oil vapour content : 0.003 mg/m3
Pressure drop : 0.21 bar
(iv) Self operated pressure control valves
Excess pressure regulating valve
Make : Samson Controls Pvt Ltd
Type : 41-73, upstream pressure control
Size : 3/4”, 1”
Actuator size : 40 cm2
Set pressure range : 5.5 to 10 bar
Max. Allowable leakage at 16 bar : 0.1 LPM
Material
a) Body : A216 WCB
b) Seat : SS 316
Figure 5.15: Assembled view of self operated excess pressure regulating valve.
Pressure reducing valve
Make : Samson Controls Pvt Ltd
Type : 41-23, down stream pressure control
Size : 1”, 2 ½”
134

Actuator size : 640 cm2
Set pressure range : 1.1 to 1.6 bar
Max. Allowable Leakage at 11 bar : 0.4 LPM
Material
a) Body : A216 WCB
b) Seat : SS316ST6
Figure 5.16: Assembled view of self operated pressure reducing valve.
(v) Lubricating oil
Name : Sigma fluid plus
Make : Kaeser (Germany)
Type : Synthetic poly-alpha-olefins
Viscosity at 400C : 70 mm2 /s
Viscosity at 1000C : 10.6 mm2 /s
Density at 150C : 843 kg/m3
Specific heat : 1.8683 kJ/kg
Flash point : 2600C
Pour point : -390C
135

(vi) Testing gases
Three testing gases have been selected to test the compressors apart from air.
Nitrogen
The nitrogen gas produced in the Cryogenics Laboratory has been used for
testing. The purity of the nitrogen gas produced is 98% (nitrogen generator
manufacturer’s specification)
Argon (supplier’s specifications)
Argon minimum percentage per mole : 99.985
Moister : 23.0 ppm
Oxygen : 50 ppm
Nitrogen : 50 ppm
Hydrogen : 50 ppm
Helium (supplier’s specifications)
Grade : 4.5
Minimum purity : 99.995%
Oxygen : 10 ppm (max.)
Nitrogen : 20 ppm (max.)
Moister : 4.0 ppm (max.)
Hydrocarbon/CH4 : 0.5 ppm (max.)
(vii) Pipes
Pipes, tubes and fittings have been procured from local market. Stainless
steel pipes and valves are used for 37 kW compressor test rig and GI pipes and MS
valves have been used for 5.5 kW compressor test setup.
5.3 Instrumentation
The instrumentation system comprises of instruments to measure gas and oil
flow rate, electrical energy input, temperature, and pressure at relevant stations. A
136

rotameter has been used for gas flow rate measurement in the 5.5 kW compressor
and orifice meter for 37 kW compressor. Excess pressure regulating and pressure
reducing valves have been used to regulate the pressures. Pressure gauges and
pressure transducers have been used on both the compressor test rigs at relevant
stations for pressure measurement. Platinum resistance thermometers have been
used for the measurement of surface temperature of compressors and of gas and oil
streams. A tachometer has been used for the measurement of rotational speed of
the compressors. Energy meter and stop watch for measurement of electrical input
to the compressors. The specific instruments are as follows.
(a) Rotameter for gas flow measurement
Make : Alflow
Range : 0 to 1250 LPM
Accuracy : ±12 L/min
(b) Rotameter for oil flow measurement
Make : Alflow
Range : 0 to 50 LPM, 0 to 200 LPM
Accuracy : ±1 L/min
(c) Orifice meter
Make : Rosemount Inc.
Type : Plate type, squire edged, corner tapping,
Line size : 2 ½” inch
Orifice bore size :1.67 inch
Discharge coefficient :0.6082
Flow rate
Minimum accurate flow : 0.01 m3/sec
Maximum :0.12 m3/sec
(d) Pressure Sensors
Make : Honeywell
Model : 24PC Series
Type : Differential pressure sensors
137

Range : From 3 bar to 18 bar
Accuracy : ±0.01 bar
Figure 5.17: Photograph of pressure transducer with mechanical fittings.
(e) Temperature Sensors
Make : Omega
Model : PT100
Type : Thin film
Accuracy : ±0.3C
Figure 5.18: A thin film type platinum resistance temperature sensor (PT100).
138

5.4 Measurement of Volumetric and Adiabatic efficiencies
Volumetric Efficiency
Volumetric efficiency of a compressor is defined as the actual amount of gas
volume delivered at some reference condition to the theoretical volume of gas
delivered at the same condition. The experimental volumetric efficiency equation
(4.16) at condition (Ps,T1) is reproduced below for ready reference.
t
erev m
m&
&=η (5.1)
where is the experimentally measured flow rate and is the ideal flow rate
compatible with machine geometry and speed. The actual gas volume flow rate
is measured with a rotameter, which has been calibrated for volume flow rate at
reference condition (Pr ,Tr) . The mass flow rate of compressor at condition (Ps ,T1) is
obtained by using the formula [119]:
em& tm&
em&
sr
rsmse TP
TPVm
××
= ρ& (5.2)
where, ρs is the density of gas at (Ps ,T1) and Vm is the volume flow rate of the gas.
The gas density has been taken from standard thermodynamic tables [120]. The
theoretical mass flow rate is calculated using the equation of state for perfect gas at
condition (Ps ,T1) and is given by the equation:
mms
tst Nn
RTVP
m 1=& (5.3)
where nm , Nm are the number of lobes and rotational speed (rps) of male rotor
respectively.
139

Adiabatic efficiency
The theoretical adiabatic efficiency is defined at condition (Ps ,T1) as:
esys
adra W
W
,&
&=η (5.4)
where esysW ,& is the power consumed by the compressor system. The adiabatic
compression work adW& is estimated by using the standard relation [118]:
⎥⎥⎥
⎦
⎤
⎢⎢⎢
⎣
⎡−⎟⎟
⎠
⎞⎜⎜⎝
⎛=
−
1
1
1
kk
s
dpdtad P
PTcmW && (5.5)
The power consumed by the compressor system is measured either with a
three phase Wattmeter or with an energy meter plus a watch. We have used the
later approach.
e
e
eesys t
nN
W 3600, =& (5.6)
where Ne is the energy meter constant and te is the time taken for ne revolutions of
energy meter disc.
140

Chapter VI
EXPERIMENTAL RESULTS AND CONCLUSIONS
This chapter presents the results of experimental studies that have been
discussed in chapter V. Procedure for actual measurements and data reduction have
been presented. The operating parameters covered under the study are:
Suction temperature
Suction pressure
Discharge pressure or pressure ratio
Injected oil temperature
Oil injection rate
6.1. Measurement of Volumetric Efficiency
The volumetric efficiency of the compressors under different operating
parameters is presented in Figures 4.1 to 4.12. During experimentation, maximum
care has been taken to maintain the purity of gas in the closed loop test rig. To
ascertain the purity of gas in the test rig, the entire circuit was evacuated before
charging different working gases. During experimentation, the maximum discharge
pressure was maintained at 10 bar, the maximum designed discharge pressure of the
compressor being 11 bar. It has been observed that the calculated volumetric
efficiency (%) was more than the experimentally measured volumetric efficiency by
approximately 2% in almost all cases. This is attributed to the assumption in the
numerical model that the volume occupied by the oil in the compressor cavities is
negligible. The other non idealities such as ideal gas assumption and values of
coefficient of leakage may also be contributing to this difference. The difference is
within the experimental uncertainties.

Figure 6.1 gives the influence of inducted gas temperature on volumetric
efficiency with different working gases at a fixed pressure ratio and injected oil
temperature in the SM 8 (5.5 kW) compressor. It is observed that the volumetric
efficiency increases with inlet temperature. This effect is attributed to the fact that
the actual inlet mass flow rate remains almost constant during the experiment, the
large mass of the oil imposing a thermostatic effect. Hence, in the expression of
volumetric efficiency, the numerator remains nearly constant while the denominator
decreases with increase of inlet temperature, which leads to higher volumetric r
efficiency.
The variation of experimentally measured volumetric efficiency with suction
gas temperature in the 5.5 kW and 37 kW compressors has been shown in Figure
6.2. It has been observed that the volumetric efficiency of 37 kW compressor is
somewhat lower than that of the 5.5 kW compressor for all working gases. This may
be due to manufacturing deviations of the 37 kW compressor. Figures 6.3 to 6.5 give
the variation of volumetric efficiency with suction gas pressure at a fixed pressure
ratio in the same compressors. The increase in volumetric efficiency with increase in
suction pressure may be assigned to the increase in volume flow rate of gas without
proportionate increase in oil flow rate.
The influence of injected oil temperature on different working gases at a fixed
pressure ratio is shown in Figure 6.6. From the figure, it is observed that lower
injected oil temperature results in better volumetric efficiency. The influence of
injected oil quantity at a fixed pressure ratio and injected oil temperature is
presented in Figures 6.7 and 6.8 for different working gases. It may be observed
that the influence of oil injection rate on volumetric efficiency is not same for
different working gases. The influence of injection quantity on volumetric efficiency is
relatively stronger with helium than with the other three gases in both the
compressors.
The variation of volumetric efficiency with pressure ratio is shown in Figures
6.9 to 6.12. This variation is due to the fact that increase in pressure ratio enhances
the leakage and thus degrades the efficiency. It has also been seen from the figures
that volumetric efficiency can be improved by lowering the injected oil temperature.
Volumetric efficiency decreases with increase in pressure ratio and decreases with
increases of oil inlet temperature. For the same pressure ratio and the same oil
injection temperature, volumetric efficiency is the lowest for helium followed by
142

argon, nitrogen and air. This may be due to the fact that helium is a light gas and
leaks more easily. On the other hand, monatomic gas generates higher temperature
leading to decrease in oil viscosity and consequently higher leakage rate. This is the
case with argon. The variation of volumetric efficiency with oil to gas mass ratio has
been presented in Figures 6.13 and 6.14. It is observed that increase in volumetric
efficiency with mass ratio is marginal for air, nitrogen and argon in the range of mass
ratio between 15 and 18. Helium being a lighter gas, operating oil to gas mass ratio
is nearly 7 times of that with air.
The gas delivery rates of both the compressors have been presented in
Figures 6.15 to 6.17. Experiments have been conducted at two different injected oil
temperatures on 5.5 kW compressor keeping the inlet gas pressure constant. It is
observed that the gas volume delivery rate decreases with increase in pressure ratio
and with increase of oil injection temperature. The causes are the increase of
leakage rate at higher pressures and reduction of inducted volume at higher
temperature. These figures also show the relative variation of volume flow rates of
different working gases. The lowest gas delivery rate is with helium followed by
argon, nitrogen and air.
Pd/Ps=8.65;Tli=308K
82
84
86
88
90
92
94
96
98
292 295 298 301 304 307 310 313 316 319 322 325
Suction temperature(K)
( ηre
v% &
η rv%
)
Air(exp)Air(calculated)Nitrogen(exp)Nitrogen(calculated)Argon(exp)Argon(calculated)Helium(exp)Helium(calculated)
Figure 6.1: Influence of inlet gas temperature on volumetric efficiency with
different working gases of 5.5 kW compressor at fixed injected oil temperature
143

Pd/Ps=8.65;Tli=343K
82
83
84
85
86
87
88
89
90
91
92
292 296 300 304 308 312 316 320 324 328
Suction temperature(Ts K)
( ηre
v%)
Air(5.5kW)Air(37kW)Nitrogen(5.5kW)Nitrogen(37kW)Argon(5.5kW)Argon(37kW)Helium(5.5kW)Helium(37kW)
Figure 6.2: Variation of experimentally measured volumetric efficiency with inlet
gas temperature with different working gases of 5.5 kW and 37 kW compressors at fixed suction pressure and injected oil temperature.
Pd/Ps=6;Tli=308K
86
88
90
92
94
96
98
100
0 0.1 0.2 0.3 0.4 0.5 0.6 0.7 0.8
Suction pressure (Ps bar(g))
( ηre
v%&
η rv%
)
Air(exp)Air(calculated)Nitrogen(exp)Nitrogen(calculated)Argon(exp)Argon(calculated)Helium(exp)Helium(calculated)
Figure 6.3: Effect of suction pressure on volumetric efficiency with different
working gases of 5.5 kW compressor at fixed injected oil temperature.
144

Pd/Ps=6
84
86
88
90
92
94
96
98
0 0.1 0.2 0.3 0.4 0.5 0.6 0.7 0.8
Suction pressure(Ps bar(g))
( η r
ev%
)Tli=308K(air)Tli=343K(air)Tli=308K(nitrogen)Tli=343K(nitrogen)Tli=308K(argon)Tli=343K(Argon)Tli=308K(helium)Tli=343K(helium)
Figure 6.4: Effect of injected oil temperature on experimentally measured
volumetric efficiency of 5.5 kW compressor.
Pd/Ps=6;Tli=343K
82
84
86
88
90
92
94
96
0 0.1 0.2 0.3 0.4 0.5 0.6 0
Suction pressure(Ps bar(g))
( η re
v%
)
.7
Air(5.5kW)Air(37kW)Nitrogen(5.5kW)Nitrogen(37kW)Argon(5.5kW)Argon(37kW)Helium(5.5kW)Helium(37kW)
Figure 6.5: Comparison of experimentally measured volumetric efficiencies of 5.5
& 37 kW compressors at fixed injected oil temperature.
145

Pd/Ps=8.65
82
84
86
88
90
92
94
300 310 320 330 340 350 360 370
Injected oil temperature(K)
( ηre
v%&
η rv
%)
Air(exp)Air(calculated)Nitrogen(exp)Nitrogen(calculated)Argon(exp)Argon(calculated)Helium(exp)Helium(calculated)
Figure 6.6: Influence of injected oil temperature on volumetric efficiency with different working gases of 5.5 kW compressor at constant suction pressure.
Tli=308K,Pd/Ps=8.65
78
80
82
84
86
88
90
92
94
6 8 10 12 14 16 18 20
Oil injection rate(L/min)
( ηre
v%
&η
rv%
)
Air(exp)Air(calculated)Nitrogen(exp)Nitrogen(calculated)Argon(exp)Argon(calculated)Helium(exp)Helium(calculated)
Figure 6.7: Influence of injected oil quantity on volumetric efficiency of 5.5 kW compressor at constant suction pressure.
146

Pd/Ps=8.65;Tli=343K
80
82
84
86
88
90
92
50 55 60 65 70 75 80 85 90 95 100 105 110
Oil injection rate(L/min)
( ηre
v%&
η rv
%)
Air(exp)Air(calculated)Nitrogen(exp)Nitrogen(calculated)Argon(exp)Argon(calculated)Helium(exp)Helium(calculated)
Figure 6.8: Influence of injected oil quantity on volumetric efficiency of 37 kW
compressor at constant suction pressure.
Tli=308K
84
86
88
90
92
94
96
2 3 4 5 6 7 8 9
Pressure ratio(Pd/Ps)
( ηre
v%&
η r v
%)
Air(exp)Air (calculated)Nitrogen(exp)Nitrogen(calculated)Argon(exp)Argon(calculated)Helium(exp)Helium(calculated)
Figure 6.9: Variation of volumetric efficiency of 5.5 kW compressor with pressure
ratio at fixed injected oil temperature and suction pressure .
147

Tli=343K
82
84
86
88
90
92
94
2 3 4 5 6 7 8 9
Pressure ratio(Pd/Ps)
( ηre
v%
&η
r v%
)
Air(exp)Air (calculated)Nitrogen(exp)Nitrogen(calculated)Argon(exp)Argon(calculated)Helium(exp)Helium(calculated)
Figure 6.10: Variation of volumetric efficiency of 37 kW compressor with pressure
ratio at fixed oil injected temperature and suction pressure .
82
84
86
88
90
92
94
96
2 3 4 5 6 7 8 9Pressure ratio(Pd/Ps)
( η re
v%
)
Air(Tli=308K)Air(Tli=343K)Nitrogen(Tli=308K)Nitrogen(Tli=343K)Argon(Tli=308K)Argon(Tli=343K)Helium(Tli=308K)Helium(Tli=343K)
Figure 6.11: Variation of experimentally measured volumetric efficiency of 5.5 kW
compressor at two different injected oil temperatures.
148

Tli=343K
80
82
84
86
88
90
92
2 3 4 5 6 7 8 9 10
Pressure ratio(Pd/Ps)
( η r
ev %
)
11
Air(exp)5.5kWAir(exp)37kWNitrogen(exp)5.5kWNtirogen(exp)37kWArgon(exp)5.5kWArgon(exp)37kWHelium(exp)5.5kWHelium(exp)37kW
Figure 6.12: Variation of experimentally measured volumetric efficiency of 5.5 kW
& 37 kW compressors with pressure ratio at fixed injected oil temperature and at constant suction pressure.
Pd/Ps=8.65;Tli=308K
82
84
86
88
90
92
94
7 8 9 10 11 12 13 14 15 16 17 18 19
Oil to gas mass ratio(ml/mg)
( ηre
v%)
Air(exp)Air(calculated)Nitrogen(exp)Nitrogen(calculated)Argon(exp)Argon(calculated)
Figure 6.13: Influence of oil to gas mass ratio on volumetric efficiency of 5.5 kW
compressor with different working gases at constant pressure ratio, fixed oil injection temperature and at constant suction pressure.
149

Pd/Ps=8.65;Tli=308K
79
80
81
82
83
84
85
86
87
40 50 60 70 80 90 100 110 120 130
Oil to gas mass ratio(ml/mg)
( ηre
v%
)
Helium(exp)Helium(calculated)
Figure 6.14: Influence of oil to gas mass ratio on volumetric efficiency of 5.5 kW compressor with helium as working gas at constant pressure ratio and at fixed injected oil temperature with constant suction pressure.
Tli=308K
0.65
0.66
0.67
0.68
0.69
0.7
0.71
0.72
2 3 4 5 6 7 8 9Pressure ratio(Pd/Ps)
Gas
del
iver
y ra
te(m
3 /m
in)
Air(exp)Air(calculated)Nitrogen(exp)Nitrogen(calculated)Argon(exp)Argon(calculated)Helium(exp)Helium(calculated)
Figure 6.15: Variation of gas flow rate in 5.5 kW compressor with pressure ratio at fixed injected oil temperature and suction pressure.
150

0.65
0.66
0.67
0.68
0.69
0.7
0.71
0.72
2 3 4 5 6 7 8 9Pressure ratio(Pd/Ps)
Gas
del
iver
y ra
te(m
3 /m
in)
Tli=343K(Air)Tli=308K(Air)Tli=343K(Nitrogen)Tli=308K(Nitrogen)Tli=343K(Argon)Tli=308K(Argon)Tli=343K(Helium)Tli=308K(Helium)
Figure 6.16: Variation of gas flow rate in 5.5 kW compressor with pressure
ratio at two different injected oil temperatures and fixed suction pressure.
RPM=2953; Tli=343K
5.06
5.07
5.08
5.09
5.1
5.11
5.12
5.13
2 3 4 5 6 7 8 9
Pressure ratio (Pd/Ps)
Gas
del
iver
y ra
te (
m3 /m
in)
AirNitrogenArgonHelium
Figure 6.17: Variation of working gas flow rate in 37 kW compressor with
pressure ratio at fixed injected oil temperature and suction pressure.
151

6.2. Effect on Adiabatic Efficiency Results on measurement of adiabatic efficiency of 5.5 kW and 37 kW
compressors are presented in Figures 6.18 to 6. 31. Adiabatic efficiency is calculated
at condition (Ps ,T1) instead of suction condition (Ps ,Ts), because it is easier to
compare numerical results with the experimental values. Influence of inducted gas
temperature on adiabatic efficiency with different working gases is shown in Figures
6.18 and 6.19. The nature of variation with inducted gas temperature is similar for all
the working gases. The increase of adiabatic efficiency for a particular gas species is
due to the increase in volumetric efficiency which decreases the actual amount of
work consumed per unit mass of gas. Adiabatic efficiency is highest for argon and
decreases for air, helium and nitrogen.
The variation of adiabatic efficiency with suction pressure is shown in Figures
6.20 to 6.22. In case of low oil injection temperature, helium shows lower adiabatic
efficiency than nitrogen gas. However at higher injection temperature and at higher
suction pressure, adiabatic efficiency with helium exceeds that with nitrogen. But
helium has lower volume flow rate due to low volumetric efficiency and much lower
mass flow rate due to its lower molecular weight compared to nitrogen.
The variation of adiabatic efficiency of both the compressors with suction
temperature and suction pressure at a fixed injected oil temperature and pressure
ratio is shown in Figures 6.19 and 6.22. The adiabatic efficiency is less for 37 kW
compressor as compared to 5.5 kW compressor. This may be due to the low
volumetric efficiency of the higher capacity compressor as explained in section 6.1.
Influence of injected oil temperature on adiabatic efficiency at a fixed
pressure ratio with the 5.5 kW compressor is presented in Figure 6.23. It may be
observed that the increase in efficiency with decrease in injected oil temperature is
an obvious consequence of the increase in volumetric efficiency and it is similar for
all the gases. The variation of adiabatic efficiency with injected oil temperature at
constant pressure ratio has been studied on both the compressors and results are
compared in Figure 6.24.
Variation of adiabatic efficiency with oil injection rate at fixed pressure ratio
and fixed injection temperature is shown in Figures 6.25 and 6.26. The influence of
oil injection rate on adiabatic efficiency, while compressing air, nitrogen or argon is
rather weak beyond a certain injection rate. But it plays a significant role in
152

determining adiabatic efficiency while compressing a light gas like helium which can
easily leak through narrow gaps if sufficient oil is not available to seal the gaps.
Additionally, helium being a monatomic gas develops higher temperature on
compression, which requires higher oil injection rate to maintain acceptable
temperature.
The relation between adiabatic efficiency and pressure ratio for all the
working gases at two different injected oil temperatures have been shown in Figures
6.27 to 6.29. It has been observed from the results that the nature of variation is
similar for all the working gases. It may be observed from the figures that adiabatic
efficiency curves show maximum values at different pressure ratios for different
working gases. This is due to the fact that adiabatic efficiency increases with
pressure ratio and volumetric efficiency decreases with pressure ratio. At higher
pressure ratios, there is decrease in mass flow due to fall in volumetric efficiency,
which in turn lowers the adiabatic efficiency. The variation of adiabatic efficiency
with oil to gas mass ratio is shown in Figures 6.30 and 6.31. It may be observed that
the operating oil to gas mass ratio is in the range of 15 to 18 for air, nitrogen and
argon, whereas that for helium is nearly 7 times higher due to its low molecular
weight.
The specific power consumption of the compressors against pressure ratio is
shown in Figures 6.32 to 6.34. It may be observed that it is highest with helium
followed by argon, nitrogen and air. Helium has the highest specific power
consumption in mass terms due to higher work of compression for a lower volume
flow rate, as well as its low density.
Apart form volumetric and adiabatic efficiencies, the oil and gas mixture
temperature at compressor discharge for all the working gases at a fixed pressure
ratio and oil injection temperature is presented in Figures 6.35 and 6.36 as a
function of oil injection rate. It is seen from the figures that the oil and gas mixture
temperature decreases for all the gases with oil injection rate. As expected, argon, a
monatomic gas with high molecular weight shows the highest discharge
temperature. At higher injected oil temperature, mixture temperatures are
indistinguishable for the different working gases because the high oil to gas mass
ratio dominates the prevailing temperature. The influence of working gas on the
surface temperature of the air ends of the compressors has been presented in
Figures 6.37 and 6.38. The nature of the curves is similar to that depicting the
153

dependence of discharge temperature of oil and gas mixture as shown in Figures
6.31 and 6.32. It is observed that the air end surface temperature is relatively higher
when compressing helium and argon than when compressing diatomic gases like
nitrogen and air.
Pd/Ps=8.65; Tli=308K
55
56
57
58
59
60
61
62
63
290 295 300 305 310 315 320
Suction temperature(K)
( ηre
a%&
η ra%
)
Air(exp)Air(calculated)Nitrogen(exp)Nitrogen(calculated)Argon(exp)Argon(calculated)Helium(exp)Helium(calculated)
Figure 6.18: Influence of inducted gas temperature on adiabatic efficiency at
constant suction pressure and injected oil rate in 5.5 kW compressor.
Pd/Ps=8.65;Tli=343K
52
53
54
55
56
57
58
59
60
61
290 295 300 305 310 315 320 325 330
Suction temperature(Ts K)
( η re
a%)
Air(5.5kW)Air(37kW)Ntrogen(5.5kW)Nitrogen(37kW)Argon(5.5kW)Argon(37kW)Helium(5.5kW)Helium(37kW)
Figure 6.19: Comparison of adiabatic efficiency of 5.5 kW and 37 kW compressors
at constant suction pressure and fixed injected oil temperature.
154

Pd/Ps=6;Tli=308K
51
53
55
57
59
61
63
0 0.1 0.2 0.3 0.4 0.5 0.6 0.7
Suction pressure(Ps bar(g))
( ηre
a%&
η ra%
)
Air(exp)Air(calculated)Nitrogen(exp)Nitrogen(calculated)Argon(exp)Argon(calculated)Helium(exp)Helium(calculated)
Figure 6.20: Influence of suction pressure of 5.5 kW compressor on different working gases at fixed injected oil temperature.
Pd/Ps=6
49
51
53
55
57
59
61
0 0.1 0.2 0.3 0.4 0.5 0.6 0.7
Suction pressure(Ps bar(g))
( ηre
a%)
Air(Tli=308K)Air(Tli=343K)Nitrogan(Tli=308K)Nitrogen(Tli=343K)Argon(Tli=308K)Argon(Tli=343K)Helium(Tli=308K)Helium(Tli=343K)
Figure 6.21: Influence of injected oil temperature on adiabatic efficiency of 5.5 kW compressor at different suction pressures with different working gases.
155

Pd/Ps=6;Tli=343K
49
51
53
55
57
59
61
0 0.1 0.2 0.3 0.4 0.5 0.6 0.7
Suction pressure(Ps bar(g))
( ηre
a%) Air(5.5kW)
Air(37kW)Nitrogen(5.5kW)Nitrogen(37kW)Argon(5.5kW)Argon(37kW)Helium(5.5kW)Helium(37kW)
Figure 6.22: Variation of adiabatic efficiency with compressor capacity at fixed injected oil temperature and pressure ratio.
Pd/Ps=8.65
54
55
56
57
58
59
60
61
62
63
64
300 310 320 330 340 350 360 370
Injected oil temperature(K)
( ηre
a%&
η ra%
)
Air(exp)Air(calculated)Nitrogen(exp)Nitrogen(calculated)Argon(exp)Argon(calculated)Helium(exp)Helium(calculated)
Figure 6.23: Influence of injected oil temperature on efficiency of 5.5 kW
compressor with different working gases at fixed pressure ratio.
156

Pd/Ps=8.65
51
52
53
54
55
56
57
58
59
60
300 310 320 330 340 350 360 370 380 390
Injected oil temperature(Tli K)
( η re
a%)
Air(5.5kW)Air(37kW)Nitrogen(5.5kW)Nitrogen(37kW)Argon(5.5kW)Argon(37kW)Helium(5.5kW)Helium(37kW)
Figure 6.24: Variation of experimentally measured adiabatic efficiency with
injected oil temperature at constant pressure ratio.
Pd/Ps=8.65;Tli=308K
53
54
55
56
57
58
59
60
61
62
6 8 10 12 14 16 18 20Oil injection rate(L/min)
( ηre
a%&
η ra%
)
Air(exp)Air(caluculated)Nitrogen(exp)Nitrogen(calculated)Argon(exp)Argon(calculated)Helium(exp)Helium(calculated)
Figure 6.25: Influence of oil injection quantity on adiabatic efficiency at constant pressure ratio and fixed injected oil temperature in 5.5 kW compressor.
157

Pd/Ps=8.65;Tli=343K
51
52
53
54
55
56
57
58
55 60 65 70 75 80 85 90 95 100 105 110
Oil injection rate(L/min)
(ηre
a%&
η ra%
)
Air(exp)Air(calculated)Nitrogan(exp)Nitrogen(calculated)Argon(exp)Argon(calculated)Helium(exp)Helium(calculated)
Figure 6.26: Influence of oil injection quantity on adiabatic efficiency of 37 kW
compressor with different working gases at constant pressure ratio and fixed injected oil temperature.
Tli=308K
30
34
38
42
46
50
54
58
62
2 3 4 5 6 7 8 9Pressure ratio(Pd/Ps)
( ηre
a%&
η ra%
)
air(exp)Air(calculated)Nitrogen(exp)Nitrogen(calculated)Argon(exp)Argon(calculated)Helium(exp)Helium(calculated)
Figure 6.27: Variation of adiabatic efficiency of 5.5 kW compressor
with pressure ratio at fixed injected oil temperature.
158

28
32
36
40
44
48
52
56
60
64
2 3 4 5 6 7 8 9
Pressure ratio(Pd/Ps)
( ηr e
a%)
Air(Tli=308K)Air(Tli=343K)Nitrogen(Tli=308K)Nitrogen(Tli=343K)Argon(Tli=308K)Argon(Tli=343K)Helium(Tli=308K)Helium(Tli=343K)
Figure 6.28: Comparison of experimentally measured adiabatic efficiencies of
5.5 kW compressor at different injected oil temperatures.
Tli=343K
20
24
28
32
36
40
44
48
52
56
60
64
2 3 4 5 6 7 8
Pressure ratio(Pd/Ps)
(η re
a%)
9
Air(5.5kW)Air(37kW)Helium(5.5kW)Helium(37kW)Nitrogen(5.5kW)Nitrogen(37kW)Argon(5.5kW)Argon(37kW)
Figure 6.29: Variation of experimentally measured adiabatic efficiency with compressor capacity at fixed injected oil temperature.
159

Pd/Ps=8.65;Tli=308K
53
54
55
56
57
58
59
60
61
7 8 9 10 11 12 13 14 15 16 17 18 19Oil to gas mass ratio(ml/mg)
(η r
ea%
)AirNitrogenArgon
Figure 6.30: Variation of experimentally measured adiabatic efficiency with
oil to gas mass ratio at fixed injected oil temperature and pressure ratio.
Pd/Ps=8.65;Tli=308K
53
54
55
56
57
40 50 60 70 80 90 100 110 120 130
Oil to gas mass ratio(ml/mg)
(η r
ea %
)
Helium
Figure 6.31: Variation of experimentally measured adiabatic efficiency with oil to gas mass ratio at fixed injected oil temperature and pressure ratio.
160

Tli=308K
5
6
7
8
9
10
11
12
2 3 4 5 6 7 8Pressure ratio(Pd/Ps)
Spec
ific
pow
er (
kW/(
m3 /m
in))
9
Air(exp)Air(calculated)Nitrogen(exp)Nitrogen(calculated)Argon(exp)Argon(calculated)Helium(exp)Helium(calculated)
Figure 6.32: Variation of specific power in 5.5 kW compressor with pressure ratio with different working gases at fixed injected oil temperature and constant suction pressure.
5
6
7
8
9
10
11
12
2 3 4 5 6 7 8Pressure ratio(Pd/Ps)
Spec
ific
pow
er(k
W/(
m3 /m
in))
9
Air(Tli=308K)Air(Tli=343K)Nitrogen(Tli=308K)Nitrogen(Tli=343K)Argon(Tli=308K)Argon(Tli=343K)Helium(Tli=308K)Helium(Tli=343K)
Figure 6.33: Comparison of specific power at two different injected oil
Temperatures with different working gases at constant suction pressure in 5.5 kW compressor.
161

Tli=343K
5
6
7
8
9
10
11
12
3 4 5 6 7 8 9
Pressure ratio (Pd/Ps)
Spec
ifice
pow
er (
(kW
/(m3 /m
in))
Air(37kW)Air(5.5kW)Nitrogen(37kW)Nitrogen(5.5kW)Argon(37kW)Argon(5.5kW)Helium(37kW)Helium(5.5kW)
Figure 6.34: Variation of specific power with pressure ratio in two different
compressors at fixed injected oil temperature and constant suction pressure.
Pd/Ps=8.65;Tli=308K
348
350
352
354
356
358
360
362
364
10 12 14 16 18 20 22 24Oil injection rate(l/min)
Oil&
gas
mix
ture
tem
pera
ture
at
com
pres
sor
disc
harg
e(T m
ix K
)
AirNitrogenArgonHelium
Figure 6.35: Variation of oil and gas mixture temperature at compressor discharge
with oil injection rate at fixed injected oil temperature and constant suction pressure in 5.5 kW compressor.
162

Tli=343K
362
364
366
368
370
372
374
60 65 70 75 80 85 90 95 100 105 110
Oil injection rate(L/min)
Oil&
gas
mix
ture
tem
pera
ture
at
com
pres
sor
disc
harg
e(T m
ix K
)AirNitrogenArgonHelium
Figure 6.36: Variation of oil and gas mixture temperature at compressor discharge
with oil injection rate at fixed injected oil temperature and constant suction pressure in 37 kW compressor.
Tli=308K
332
334
336
338
340
342
344
346
348
10 12 14 16 18 20 22 24
Oil injection rate(L/min)
Aver
age
com
pres
sor
surf
ace
tem
pera
ture
(Tsr
K)
AirNitrogenArgonHelium
Figure 6.37: Variation of compressor surface temperature with oil injection
rate at fixed injected oil temperature and constant suction pressure in 5.5 kW compressor.
163

Tli=343K
342
344
346
348
350
352
354
356
60 65 70 75 80 85 90 95 100 105 110
Oil injection rate(L/min)
Aver
age
com
pres
sor
surf
ace
tem
pera
ture
(TsrK)
AirNitrogenArgonHelium
Figure 6.38: Influence of oil injection rate on compressor surface temperature at fixed injected oil temperature in 37 kW compressor.
6.3. Error Estimation in Experimental Results
The error in the measurement of volumetric and adiabatic efficiencies has
been estimated from the measurement of individual variables for one set of data.
The following major sources of bias and random errors are identified in our
experimental system:
(i) Installation effects of rotameter that consists of pulsating flow, pipe geometry
and the location of rotameter, pressure and temperature taps.
(ii) The fluid properties which are determined from pressure and temperature
measurements
(iii) Environmental considerations which may affect the performance of measuring
instruments. (These include the ambient temperature, pressure and
humidity.)
(iv) The uncertainty in calibration of sensors and gauges is estimated to be of the
order of ± 0.01 bar for pressure transducers, ±0.015 bar for pressure gauges
and ±0.0050C for temperature sensors (as per manufacturers’ specifications).
164

(v) An error in calibration of energy meter is found to be ±5 W.s and the
tachometer has ±15rpm (calibrated in the laboratory)
(vi) The bias associated with the measurement of theoretical volume of one pair
of male and female rotor grooves, which is found to be ±0.5 cm3
All the individual variables which influence the result (volumetric and
adiabatic efficiencies) have been measured N times and the associated precision
error XS along with other variables is shown in Table 6.1. Bias and random errors in
the measurement of volumetric and adiabatic efficiencies have been calculated using
the values listed in table 6.1. The table is specific for calculation of volumetric and
adiabatic efficiency. This error estimation can be extended to yield an average error
in the experimental procedure for the determination of volumetric and adiabatic
efficiency.
Table 6.1: Average values and their error values for N samples
Parameter Average
value( X )
Bias
error
(Br)
Precision
error
( XS )
Sample
Size
(N)
Suction pressure (Ps) bar
Suction Temperature(Ts) 0C
Discharge pressure(Pd) bar
Speed of male rotor(Nm) rpm
Volume flow rate of gas(Vm) L/min
Volume of a pair cavities(Vt1) cm3
No.of revolutions of energy meter(ne)
Time for ne rotations of energy
meter disc (te) sec
Experimental mass flow rate(me) kg/s
Theoretical mass flow rate(mt) kg/s
Experimental adiabatic power(Wade) kW
Experimental system power(Wsys) kW
1.113
308
9.65
4350
675
342
5
38
0.0139
0.0156
3.642
6.3
0.015
0.005
0.015
15
25
0.5
0.05
0.1
-
-
-
0.023
0.3
0.25
20
12
1
0.2
0.5
-
-
-
6
6
6
6
6
6
6
6
-
-
-
165

Bias in the measurement of volumetric efficiency
Gas flow rate has been measured with rotameter which has been calibrated
for air. The gas density and gas characteristic constant has been taken from
standard tables [120]. The volumetric efficiency equation is rewritten as:
t
erev m
m&
&=η (6.5)
The bias in the measurement of volumetric efficiency can be estimated by using the
relation:
222
⎟⎟⎠
⎞⎜⎜⎝
⎛ ∆+⎟⎟
⎠
⎞⎜⎜⎝
⎛ ∆=⎟⎟
⎠
⎞⎜⎜⎝
⎛ ∆
t
t
e
e
rev
rev
mm
mm
&
&
&
&
ηη (6.6)
The rotameter employed for measurement of gas volume flow rate has been
calibrated at reference conditions (Tr ,Pr). The volume measured at the time of
experimentation is different from the reference conditions due to dynamic nature of
the environment. Hence, the mass flow rate of the compressor at suction conditions
can be obtained by using the formula:
sr
rsmssse TP
TPVVm
××
== ρρ& (6.7)
The bias in the measurement of mass flow rate is estimated by using the relation:
2222
21
21
⎟⎟⎠
⎞⎜⎜⎝
⎛ ∆+⎟⎟
⎠
⎞⎜⎜⎝
⎛ ∆+⎟⎟
⎠
⎞⎜⎜⎝
⎛ ∆=⎟⎟
⎠
⎞⎜⎜⎝
⎛ ∆
s
s
s
s
m
m
e
e
TT
PP
VV
mm&
& (6.8)
The density of gas and the gas constant are taken at suction condition from
standard tables/charts. Assuming that the uncertainties in the measurement of
reference temperature and thermo-physical properties are negligible, the bias in the
experimental mass flow rate is calculated as,
166

2222
308005.0
21
11325.1015.0
21
67525
⎟⎠
⎞⎜⎝
⎛ ×+⎟⎠
⎞⎜⎝
⎛ ×+⎟⎠
⎞⎜⎝
⎛=⎟⎟⎠
⎞⎜⎜⎝
⎛ ∆
e
e
mm&
& (6.9a)
=⎟⎟⎠
⎞⎜⎜⎝
⎛ ∆2
e
e
mm&
&0.00137+0.0000454+0.000000000066=0.00142 (6.9b)
The theoretical mass flow rate is calculated using the equation of state for perfect
gas at same conditions and is given by the equation:
mms
tst Nn
RTVP
m 1=& (6.10)
The bias associated with measurement of the theoretical mass flow rate is in
the measurement of theoretical volume of one pair of male and female rotor
grooves, speed measurement of the male rotor, and suction conditions. The bias in
the determination of gas constant is assumed to be negligible. Hence, the bias in the
measurement of theoretical mass flow rate is estimated by the relation:
2222
1
12
⎟⎟⎠
⎞⎜⎜⎝
⎛ ∆+⎟⎟
⎠
⎞⎜⎜⎝
⎛ ∆+⎟⎟
⎠
⎞⎜⎜⎝
⎛ ∆+⎟⎟
⎠
⎞⎜⎜⎝
⎛ ∆=⎟⎟
⎠
⎞⎜⎜⎝
⎛ ∆
m
m
s
s
s
s
t
t
t
t
NN
TT
PP
VV
mm&
& (6.11)
22222
435015
308005.0
11325.1015.0
2.345.0
⎟⎠
⎞⎜⎝
⎛+⎟⎠
⎞⎜⎝
⎛+⎟⎠
⎞⎜⎝
⎛+⎟⎠
⎞⎜⎝
⎛=⎟⎟⎠
⎞⎜⎜⎝
⎛ ∆
t
t
mm&
& (6.12a)
=⎟⎟⎠
⎞⎜⎜⎝
⎛ ∆2
t
t
mm&
&0.0002137+0.0001816+0.00000000026+0.000012
=0.0004073 (6.12b)
Substituting the values from equations (6.9b) and (6.12b) in equation (6. 6), the bias
in the measurement of volumetric efficiency is:
167

=⎟⎟⎠
⎞⎜⎜⎝
⎛ ∆2
rev
rev
ηη 0.00142+0.0004073 =0.001827 (6.13a)
=×⎟⎟⎠
⎞⎜⎜⎝
⎛ ∆100
rev
rev
ηη ±4.27% (6.13b)
Precession error in the measurement of volumetric efficiency
The randomness in the determination of volumetric efficiency can be written as:
222
⎟⎟⎠
⎞⎜⎜⎝
⎛ ∆+⎟⎟
⎠
⎞⎜⎜⎝
⎛ ∆=⎟⎟
⎠
⎞⎜⎜⎝
⎛ ∆
t
t
e
e
rev
rev
mm
mm
&
&
&
&
ηη (6.14)
The precision error in the measurement of experimental mass flow rate is estimated
from the relation:
2222
21
21
⎟⎟⎠
⎞⎜⎜⎝
⎛ ∆+⎟⎟
⎠
⎞⎜⎜⎝
⎛ ∆+⎟⎟
⎠
⎞⎜⎜⎝
⎛ ∆=⎟⎟
⎠
⎞⎜⎜⎝
⎛ ∆
s
s
s
s
m
m
e
e
TT
PP
VV
mm&
& (6.15)
2222
3083.0
21
11325.1023.0
21
67512
⎟⎠
⎞⎜⎝
⎛ ×+⎟⎠
⎞⎜⎝
⎛ ×+⎟⎠
⎞⎜⎝
⎛=⎟⎟⎠
⎞⎜⎜⎝
⎛ ∆
e
e
mm&
& (6.16a)
=⎟⎟⎠
⎞⎜⎜⎝
⎛ ∆2
e
e
mm&
&0.000316+0.000107+0.000000237=0.000142 (6.16b)
The precision error in the measurement of theoretical mass flow rate is estimated by:
2222
1
12
⎟⎟⎠
⎞⎜⎜⎝
⎛ ∆+⎟⎟
⎠
⎞⎜⎜⎝
⎛ ∆+⎟⎟
⎠
⎞⎜⎜⎝
⎛ ∆+⎟⎟
⎠
⎞⎜⎜⎝
⎛ ∆=⎟⎟
⎠
⎞⎜⎜⎝
⎛ ∆
m
m
s
s
s
s
t
t
t
t
NN
TT
PP
VV
mm&
& (6.17)
22222
435020
3083.0
11325.1023.0
2.342
⎟⎠
⎞⎜⎝
⎛+⎟⎠
⎞⎜⎝
⎛+⎟⎠
⎞⎜⎝
⎛+⎟⎠
⎞⎜⎝
⎛=⎟⎟⎠
⎞⎜⎜⎝
⎛ ∆
t
t
mm&
& (6.18a)
168

=⎟⎟⎠
⎞⎜⎜⎝
⎛ ∆2
t
t
mm&
&0.00342+0.000427+0.00000095+0.000021=0.00386 (6.18b)
Substituting the values of ⎟⎟⎠
⎞⎜⎜⎝
⎛ ∆
e
e
mm&
& and ⎟⎟
⎠
⎞⎜⎜⎝
⎛ ∆
t
t
mm&
& from equations (6.16b) and (6.18b) in
equation (6.14), the random error in volumetric efficiency measurement is given as:
=⎟⎟⎠
⎞⎜⎜⎝
⎛ ∆2
rev
rev
ηη
0.000142+0.00386 =0.00401 (6.19a)
=×⎟⎟⎠
⎞⎜⎜⎝
⎛ ∆100
rev
rev
ηη ±6.33% (6.19b)
The number of degrees of freedom υr associated with combined precision Pr is found
by using the Welch-Satterthwaite formula [121].
[ ] [ ]∑∑
∑
==
= =⎥⎦
⎤⎢⎣
⎡
=J
iiii
rJ
iiii
J
iii
r
P
P
P
P
1
4
4
1
4
2
1
2
/)(/)(
)(
υθυθ
θυ (6.20)
The numerator of the above equation can be defined as:
22222
1
12
4
⎥⎥⎦
⎤
⎢⎢⎣
⎡⎟⎟⎠
⎞⎜⎜⎝
⎛ ∆+⎟⎟
⎠
⎞⎜⎜⎝
⎛ ∆+⎟⎟
⎠
⎞⎜⎜⎝
⎛ ∆+⎟⎟
⎠
⎞⎜⎜⎝
⎛ ∆+⎟⎟
⎠
⎞⎜⎜⎝
⎛ ∆=
m
m
s
s
s
s
t
t
m
mr N
NTT
PP
VV
VV
P
=222222
435020
3083.0
1132.1023.0
2.342
67512
⎥⎥⎦
⎤
⎢⎢⎣
⎡⎟⎠
⎞⎜⎝
⎛+⎟⎠
⎞⎜⎝
⎛+⎟⎠
⎞⎜⎝
⎛+⎟⎠
⎞⎜⎝
⎛+⎟⎠
⎞⎜⎝
⎛
= [3.16×10⁻⁴+0.00342+4.27×10⁻⁴+9.48×10⁻⁷+2.114×10⁻⁵]2
= [0.004184]2=1.751×10⁻⁵ (6.20a)
169

For all the individual variables, the experiment has been repeated six times to
measure the precession error. For the sample size of 6 the degree of freedom υi =5,
[since υi = (N-1) =5].
The denominator of equation (6.20) is rewritten as:
∑=
J
iiii P
1
4 /)( υθ (6.20b)
where υi = υm= υt1= υs= υts= υnm=5
Equation (6.20b) can be redefined in another form as:
⎥⎥⎦
⎤
⎢⎢⎣
⎡⎟⎟⎠
⎞⎜⎜⎝
⎛ ∆+⎟⎟
⎠
⎞⎜⎜⎝
⎛ ∆+⎟⎟
⎠
⎞⎜⎜⎝
⎛ ∆+⎟⎟
⎠
⎞⎜⎜⎝
⎛ ∆+⎟⎟
⎠
⎞⎜⎜⎝
⎛ ∆= nm
m
mts
s
ss
s
st
t
tm
m
m
NN
TT
PP
VV
VV
υυυυυ /////444
1
4
1
14
=⎥⎥⎦
⎤
⎢⎢⎣
⎡⎟⎠
⎞⎜⎝
⎛+⎟⎠
⎞⎜⎝
⎛+⎟⎠
⎞⎜⎝
⎛+⎟⎠
⎞⎜⎝
⎛+⎟⎠
⎞⎜⎝
⎛44444
435020
3083.0
1132.1023.0
2.342
67512
51
=1/5[9.989×10-8+1.17×10-5+1.82×10-7+9.00×10-13+4.47×10-10]
=1/5[1.19×10-5]=4.4×10-6
Substituting the values from (6.20a) and (6.20b) in equation (6.20), the combined
degree of freedom for the measurement of volumetric efficiency is calculated as:
[ ]==
∑=
J
iiii
rr
P
P
1
4
4
/)( υθυ 1.751×10⁻⁵/4.4×10-6=3.98 ≈ 4
From t- distribution table [121] for the degree of freedom 4, the t- value at
95% confidence level is 2.776. The combined uncertainty in the measurement of
volumetric efficiency is estimated by using the equation [121] as:
170

( )[ ]2122rrrRSS PtBU ×+= (6.21)
21
22 ])33.6776.2()27.4[( ×+=rRSSU =18.08%
Therefore, the uncertainty in the measurement of volumetric efficiency is:
=⎟⎟⎠
⎞⎜⎜⎝
⎛ ∆
rev
rev
ηη ±18.08%
Bias in the measurement of adiabatic efficiency
The bias in the measurement of adiabatic efficiency has also been computed
in the similar fashion as that of volumetric efficiency. The adiabatic efficiency is
rewritten as:
esys
eadrea W
W
,
,
&
&=η (6.22)
The bias in adiabatic efficiency determination can be written as:
222
⎟⎟
⎠
⎞
⎜⎜
⎝
⎛ ∆+⎟
⎟⎠
⎞⎜⎜⎝
⎛ ∆=⎟⎟
⎠
⎞⎜⎜⎝
⎛ ∆
sys
sys
ade
ade
rea
rea
W
W
WW
&
&
&
&
ηη (6.23)
The experimental adiabatic efficiency is:
⎥⎥⎥
⎦
⎤
⎢⎢⎢
⎣
⎡−⎟⎟
⎠
⎞⎜⎜⎝
⎛=
−
1
1
,
γγ
s
dspeead P
PTcmW && (6.24)
The bias in the measurement of experimental adiabatic power is obtained by the
relation:
171

22222)1()1(
⎟⎟⎠
⎞⎜⎜⎝
⎛ ∆×
−+⎟⎟
⎠
⎞⎜⎜⎝
⎛ ∆×
−+⎟⎟
⎠
⎞⎜⎜⎝
⎛ ∆+⎟⎟
⎠
⎞⎜⎜⎝
⎛ ∆=⎟
⎟⎠
⎞⎜⎜⎝
⎛ ∆
s
s
d
d
s
s
e
e
ade
ade
PP
PP
TT
mm
WW
γγ
γγ
&
&
&
& (6.25a)
=⎟⎟⎠
⎞⎜⎜⎝
⎛ ∆2
ade
ade
WW&
&0.00168+0.000000000264+0.00000242+0.00001482
= 0.001694 (6.25b)
The power consumed by the compressor system is rewritten as:
e
e
eesys t
nN
W 3600, =& (6.26)
The bias associated with measurement of the system power is:
222
⎟⎟⎠
⎞⎜⎜⎝
⎛ ∆+⎟⎟
⎠
⎞⎜⎜⎝
⎛ ∆=
⎟⎟
⎠
⎞
⎜⎜
⎝
⎛ ∆
e
e
e
e
sys
sys
tt
nn
W
W&
& (6.27a)
222
381.0
505.0
⎟⎠
⎞⎜⎝
⎛+⎟⎠
⎞⎜⎝
⎛=⎟⎟⎠
⎞⎜⎜⎝
⎛ ∆
sys
sys
WW&
&=0.0001+0.0000069=0.000107 (6.27b)
Substituting the values from equations (6.25b) and (6.27b) in equation (6.23), the
bias in adiabatic efficiency measurement is given by:
=⎟⎟⎠
⎞⎜⎜⎝
⎛ ∆2
rea
rea
ηη 0.001694+0.000107=0.0018 (6.28)
=×⎟⎟⎠
⎞⎜⎜⎝
⎛ ∆100
rea
rea
ηη ±4.24%
172

Precession error in the measurement of adiabatic efficiency
The randomness in the measurement of adiabatic efficiency can also be
computed following the above procedure. The precision error in the measurement of
adiabatic efficiency is:
222
⎟⎟
⎠
⎞
⎜⎜
⎝
⎛ ∆+⎟
⎟⎠
⎞⎜⎜⎝
⎛ ∆=⎟⎟
⎠
⎞⎜⎜⎝
⎛ ∆
sys
sys
ade
ade
rea
rea
W
W
WW
&
&
&
&
ηη (6.29)
where
22222
)1()1(⎟⎟⎠
⎞⎜⎜⎝
⎛ ∆×
−+⎟⎟
⎠
⎞⎜⎜⎝
⎛ ∆×
−+⎟⎟
⎠
⎞⎜⎜⎝
⎛ ∆+⎟⎟
⎠
⎞⎜⎜⎝
⎛ ∆=⎟
⎟⎠
⎞⎜⎜⎝
⎛ ∆
s
s
d
d
s
s
e
e
ade
ade
PP
PP
TT
mm
WW
γγ
γγ
&
&
&
& (6.30a)
=⎟⎟⎠
⎞⎜⎜⎝
⎛ ∆2
ade
ade
WW&
&0.000142+9.48×10⁻⁷+0.0000548+0.0000348=0.000232 (6.30b)
The precision error associated with measurement of the system power is:
222
⎟⎟⎠
⎞⎜⎜⎝
⎛ ∆+⎟⎟
⎠
⎞⎜⎜⎝
⎛ ∆=
⎟⎟
⎠
⎞
⎜⎜
⎝
⎛ ∆
e
e
e
e
sys
sys
tt
nn
W
W&
& (6.31a)
222
385.0
52.0
⎟⎠
⎞⎜⎝
⎛+⎟⎠
⎞⎜⎝
⎛=⎟⎟
⎠
⎞
⎜⎜
⎝
⎛ ∆
sys
sys
W
W&
&=0.0016+0.00017=0.00177 (6.31b)
Substituting the values of ⎟⎟⎠
⎞⎜⎜⎝
⎛ ∆
ade
ade
WW&
& and
⎟⎟
⎠
⎞
⎜⎜
⎝
⎛ ∆
sys
sys
W
W&
& from equations (6.30b) and
(6.31b) in equation (6.29), the precision error in measuring adiabatic efficiency is:
=⎟⎟⎠
⎞⎜⎜⎝
⎛ ∆2
rea
rea
ηη
0.000232+0.00177=0.002002 (6.32a)
173

=×⎟⎟⎠
⎞⎜⎜⎝
⎛ ∆100
rea
rea
ηη 4.5% (6.32b)
The number of degrees of freedom υr associated with combined precision Pr is also
found by using equation (6.20) and is rewritten as:
[ ] [ ]∑∑
∑
==
= =⎥⎦
⎤⎢⎣
⎡
=J
iiii
rJ
iiii
J
iii
r
P
P
P
P
1
4
4
1
4
2
1
2
/)(/)(
)(
υθυθ
θυ
where the numerator of the equation is defined as:
2222224
⎥⎥⎦
⎤
⎢⎢⎣
⎡⎟⎟⎠
⎞⎜⎜⎝
⎛ ∆+⎟⎟
⎠
⎞⎜⎜⎝
⎛ ∆+⎟⎟
⎠
⎞⎜⎜⎝
⎛ ∆+⎟⎟
⎠
⎞⎜⎜⎝
⎛ ∆+⎟⎟
⎠
⎞⎜⎜⎝
⎛ ∆+⎟⎟
⎠
⎞⎜⎜⎝
⎛ ∆=
e
e
e
e
s
s
s
s
d
d
e
er t
tnn
TT
PP
PP
mm
P&
&
= [0.000142+0.000671+0.000427+9.48×10⁻⁷+0.0016+0.00017]2
= [3.01×10⁻³]2=9.06×10⁻⁶
and the denominator is rewritten as:
∑=
J
iiii P
1
4 /)( υθ
where υi = υm= υpd= υps= υts= υn= υte= 5
The denominator of the combined degree of freedom expression is defined as:
⎥⎥⎦
⎤
⎢⎢⎣
⎡⎟⎟⎠
⎞⎜⎜⎝
⎛ ∆+⎟⎟
⎠
⎞⎜⎜⎝
⎛ ∆+⎟⎟
⎠
⎞⎜⎜⎝
⎛ ∆+⎟⎟
⎠
⎞⎜⎜⎝
⎛ ∆+⎟⎟
⎠
⎞⎜⎜⎝
⎛ ∆+⎟⎟
⎠
⎞⎜⎜⎝
⎛ ∆= te
e
en
e
ets
s
sps
s
spd
d
dm
e
e
tt
nn
TT
PP
PP
mm
υυυυυυ //////444444
&
&
=1/5[2.01×10-8+4.5×10-7+1.82×10-7+8.98×10-13+2.56×10-6+2.89×10-8]
=1/5[3.241×10-6]=6.48×10-7
174

Substituting the numerator and denominator values in equation (6.20), the combined
degree of freedom for the measurement of adiabatic efficiency is found to be:
[ ]==
∑=
J
iiii
rr
P
P
1
4
4
/)( υθυ 9.06×10⁻⁶/6.48×10-7=13.98 ≈ 14
From t-distribution table [121] using degrees of freedom value14, the t-value at 95%
confidence level is 2.145. The combined uncertainty in the measurement of adiabatic
efficiency using equation (6.21) is:
( )[ ]2122rrrRSS PtBU ×+=
21
22 ])5.4145.2()24.4[( ×+=rRSSU
=10.54%
Hence, the uncertainty in the measurement of adiabatic efficiency is:
=⎟⎟⎠
⎞⎜⎜⎝
⎛ ∆
rev
rev
ηη ±10.54%
6.4. Conclusions
Inlet temperature of gas and oil, oil injection rate, oil to gas mass ratio,
suction pressure and pressure ratio have been taken as operating parameters to
present the variation of volumetric and adiabatic efficiencies on 5.5 kW and 37 kW
air compressors. Apart from air as a working gas, the effect of using other working
gases such as nitrogen, argon and helium are studied both experimentally and
numerically. In the previous section, the results and the possible explanations have
been widely discussed. The conclusions of the discussions have been briefly
summarized in this section.
The numerical calculation of volumetric and adiabatic efficiencies (%) by
computer simulation differs from their experimental values by a margin of 2%.
175

One of the major sources of this discrepancy is the volume of oil which has not
been considered in the computer simulation. The other sources are the
assumptions of ideal conditions which deviate from the actual ones.
Volumetric efficiency increases with increase in inlet gas temperature. This is due
to the fact that inducted mass almost remains constant with inlet oil temperature
and the theoretical inducted gas mass decreases with temperature.
Due to the increase in volumetric efficiency, the adiabatic efficiency also
increases with inlet temperature.
Volumetric efficiency also increases with increase in suction pressure due to the
increase in the actual inducted volume of gas, the theoretical inducted volume
remaining constant.
The increase in adiabatic efficiency with suction pressure is due to the increase in
volumetric efficiency.
The volumetric and adiabatic efficiencies increase with lowering of injected oil
temperature. The volumetric and adiabatic efficiencies are increasing over a
certain range of oil injection rate. This result shows that lowering of oil inlet
temperature is more effective than injecting a higher quantity of oil. This may be
due to the fact that more resident oil obstructs the volume flow of working gas.
Volumetric efficiency decreases with pressure ratio because higher pressure ratio
enhances gas leakage which decreases volumetric efficiency.
Adiabatic efficiency undergoes a maximum with pressure ratio. This is because
adiabatic efficiency initially increases with increase in pressure ratio due to
proportionately reduced role of inefficiencies, but after certain pressure ratio
adiabatic efficiency declines due to higher leakage.
The gas delivery rate decreases with increase of pressure ratio due to leakage.
The above conclusions have been observed with gases such as air, nitrogen,
argon and helium. Molecular configuration (monatomic vs diatomic) and
molecular weight also have a strong role in the behaviour of the efficiency terms.
Specific power increases with pressure ratio. Due to low volumetric efficiency
caused by leakage, helium has the highest value of specific power followed by
argon. The characteristics of air and nitrogen are indistinguishable and
intermediate between those two values.
The variation of oil and gas mixture temperature with oil injection rate is within
the range of 30C for different gases.
176

The plots of average surface temperature with oil injection rate shows that
helium has the highest compressor surface temperature followed by argon due to
their monatomic nature. The surface temperature in case of air and nitrogen are
indistinguishable and are lower than those for helium and argon.
The variation of volumetric efficiency with suction temperature, suction pressure,
injected oil temperature, oil injection rate and pressure ratio has been studied.
Helium shows the lowest efficiency followed by argon, nitrogen and air in
ascending order. This is because helium being both light and monatomic in
nature has highest rate and attains highest temperature on discharge. This is
followed by argon which is a monatomic gas although it has a high molecular
weight. The higher values of volumetric efficiency with nitrogen and air are due
to their higher molecular weight.
Variation of adiabatic efficiency with suction temperature, suction pressure,
injected oil temperature, oil injection rate and pressure ratio has been carried
out. In comparison, argon shows the highest efficiency followed that of air,
helium and nitrogen in the descending order. It is because argon is a monatomic
gas and has high molecular weight.
It is recommended that increase in oil mass flow rate should be restricted to that
necessary for sealing of working gas and any further improvement in efficiency
should be done by decreasing oil injection temperature.
Although the present experiment lacks the facility to increase the rotational
speed, it is presumed that increasing the speed will improve the volumetric
efficiency.
In compressing atmospheric air, the discharge temperature should be at least 10
to 200C above the due point temperature to avoid condensation of moisture. But
that is not a requirement for compressing other gases.
An analysis of uncertainty in experimental measurement shows that the
associated uncertainty in the measurement of volumetric efficiency is around
18%, where as the uncertainty in that of adiabatic efficiency is around 11%.
177

Chapter VII
REMARKS AND SCOPE FOR FUTURE WORK
Oil injected twin screw compressors have found extensive application in
industry, particularly in refrigeration, cryogenics and chemical processes. Still, the
technology of screw compressor has remained largely proprietary. The work reported
in this thesis is an attempt to understand the working of oil injected twin-screw
compressor through experimentation and numerical analysis. One of the objectives
of the research is to study the behaviour of commercially available low cost air
compressors employed for compressing other gases. Three different gases nitrogen,
argon, and helium have been used in the experimental study. In order to understand
size effect if any, the experiments have been carried out on two compressors with
capacities of 5.5 kW and 37 kW.
7.1. Concluding Remarks
Detailed conclusions based on the numerical and experimental results have
been presented at the end of chapter VI. This section provides a brief summary of the
work and a few concluding remarks. The following may be seen as the significant
contributions of the project.
• The thesis presents an exhaustive review of literature on the subject of screw
compressors, their design and performance. It can serve as a ready reference for
other researchers in this field.
• The governing equations based on the control volume analysis have been derived
for numerical simulation.
• A complete numerical model has been developed for the oil injected twin-screw
compressor covering both the suction and the compression-discharge steps.
• The influence of interlobe clearance on the p-v diagram is analyzed.

• The area of p-v diagram decreases with increase of interlobe clearance for all
working gases. It has been observed that the decrease is more severe for helium
because of higher interlobe leakage. It is concluded that for helium applications,
the interlobe clearance should be smaller to reduce interlobe leakage and to
maintain proper volumetric and adiabatic efficiencies.
• The temperature history of the working gas and the injected oil during
compression-discharge process has been studied and presented for all four
working gases.
• The influence of important design parameters such as interlobe clearance,
rotational speed of male rotor, male wrap angle, blowhole area etc. on volumetric
and adiabatic efficiencies has been examined and quantitative results have been
presented for all four working gases.
• Two experimental test set ups have been constructed in the Cryogenics Laboratory
of NIT Rourkela to study the behaviour of small and medium size twin-screw air
compressors. Experiments with two compressors of widely differing capacities
helps in studying size effects in addition to other studies.
• Both the compressors have been tested with air, nitrogen, argon, and helium
under different oil to gas mass ratio, oil injection quantity, injection temperature
and other operating parameters.
• Heat transfer coefficient between working gas and oil has been determined from
experimental observations for use in the numerical simulation.
• Flow coefficients necessary for numerical simulation have been determined for all
the gases by matching with experimentally obtained efficiencies.
• It is generally observed that experimental volumetric efficiency is generally about
2% less than the numerical values for all the four working gases. This value is well
within the experimental uncertainties.
• From experimental results, it has been observed that lowering the injected oil
temperature is more effective than increasing injected oil quantity for improving
volumetric efficiency.
• An uncertainty analysis has been carried out to compute the uncertainty in
experimental results. The uncertainty in the measurement of volumetric and
adiabatic efficiencies is found to be 18% and 11% respectively.
179

7.2. Scope for future work
This thesis constitutes a portion of a continuous process towards
understanding the working mechanism of an oil injected twin-screw compressor
particularly in Indian context. A small beginning has been made. It is hoped that in the
near future, a much stronger programme will be built on the topic in the Cryogenics
Laboratory. The following are some of the future plans that are to be taken up in the
coming years.
Determination of fluid flow and heat transfer characteristics of oil injected twin
screw compressor using a commercially available CFD package and its
experimental validation.
Influence of injected oil properties, injection position and droplet size of
injected oil on compressor performance.
Incorporation of capacity control mechanism under different operating
conditions.
Development of a comprehensive design methodology of screw rotors for
achieving optimum efficiency.
180

VG
vp
Buffer -1
PG
F low M eter
P G
EPRV, 1 .5 ” 5 .5 to 11 bar
Com presso r
M V, 1” PRV , 2 .5 ’’1 .1 to 1 .6 bar
PGSRV
TI S R V
M V, 1”
IV , 4”
IV , 1 .5”
R V
IV , 1 /2 ”
1 .5”
1 .5 ”
PG TI
1 .5”
A ir F ilter
Buffer-2
EPRV : Excess pressu re Regu lating V alve PRV : Pressu re Reducing Va lve IV : Iso lation Valve M V : M anual Valve RV : Regu lating Va lve VP : Vacuum Pum p VG : Vacuum gauge SRV : Safety re lief va lve T I : Tem perature sen sor PG : P ressu re gauge
IV , 2 .5”
O il F ilte rs, FD -48 , FFG -48
Gas cy linder fo r m ake up gas
1 .5”
2 .5” Rou
gh filt
er
PG
IV , 4 ”
Figure 5.6: Schematic of the experimental test setup of Model BSD 72 compressor
127

VG
vp
Buffer -1
PG
Flow Meter
EPRV, 1” 5.5 to 11 bar
pressor
MV, ½ ” PRV, 1.5’’1.1 to 1.6 bar
PGSRV
TI SRV
MV, ½ ”
IV , 1”
IV, 3/4”
RV
”
1”
3/4”
PG TI
1”
3/4”
Air Filter
Buff
EPRV : Excess pressure Regulating Valve PRV : Pressure Reducing Valve IV : Isolation Valve MV : Manual Valve RV : Regulating Valve VP : Vacuum Pump VG : Vacuum gauge SRV : Safety relief valve TI : Temperature Indicator PG : Pressure gauge
IV , 1” Oil Filter FE-6
Gas cylinder for make up gas
Figure 5.1: Schematic of the experimental tes of Model, SM 8 compressor
122
PG
Com
IV, 1/2
er-2
t setup

References
[1] Arbon, I. M. The Design and Application of Rotary Twin-Shaft Compressors
in the Oil and the Gas Process Industry, Mechanical Engineering Publication Limited, London (1994)
[2] Brown, R. N. Compressor: Selection and Sizing, Gulf Publishing Company
Book Division, (1986) [3] Taft, G.L. Selection and Application of the Industrial Screw Compressors,
Proceedings of the Purdue Compressor Technology Conference, Purdue, USA (1972), 306-310
[4] www.arielcorp.com [5] Stosic, N., Smith, I.K., Kovacevic, A. Optimization of Screw Compressor
Design, International Compressor Conference, Purdue, USA (2002), C21-23, 1177-1195. 71
[6] Paul, C.H. Compressors Hand Book, McGraw Hill, (2001) [7] Stocker, W. F. Industrial Refrigeration Hand Book, McGraw Hill, (1998) [8] Pillis, J.W. Basics of Operation, Application and Troubleshooting of Screw
Compressors, January 1998, (www.petroassist.com) [9] Singh, P.J., Bowman, J.L. Effect of Design Parameters on Oil Flooded
Screw Compressor Performance, Proceedings of the International Compressor Engineering Conference, Purdue, USA (1986), Vol.I, 71-88
[10] Stosic, N. Screw Compressors: Future Developments, Published on Internet;
(1999) (www.city.ac.uk/~sj376). [11] Stosic, N., Smith, I.K., Kovacevic, A. Opportunities for Innovation with
Screw Compressors, (www.city-compressors.co.uk) [12] Stosic, N., Smith, I., Kovacevic, A. Screw Compressors: Mathematical
Modelling and Performance Calculation, Springer (2005) [13] Kaiser, H., Kruse, H. An Investigation on Reciprocating and Rotary
Refrigeration Compressors, Proceedings of the International Compressor Engineering Conference, Purdue, USA (1984), 568-575
[14] Villadsen, V., Flemming, B. V. A Balanced View of Reciprocating and
Screw Compressor Efficiencies, Proceedings of the Purdue Compressor Technology Conference, Purdue, USA (1980), 26-32

[15] Sjoholm, L. Different Operational Modes for Refrigeration Twin Screw Compressors, Proceedings of the Compressor Engineering Conference, Purdue, USA (1986), Vol.I, 89-104
[16] Bennewitz, C. Software Support for Screw Rotor Design, Manufacture
and Quality Control, International Compressor Engineering Conference Purdue, USA (1992), Vol.I, 431-438
[17] Tang, Y., Fleming, J.S. Obtaining the Optimum Geometrical Parameters of
Refrigeration Helical Screw Compressor, Proceedings of the International Compressor Engineering Conference, Purdue, USA (1992), Vol.I, 221-227
[18] Sjoholm, L. Important Parameters for Small Twin Screw Refrigeration
Compressors, Proceedings of the International Compressor Engineering Conference, Purdue, USA (1986), Vol.I, 1129-1144
[19] Singh, P.J., Schwartz, J.R. Exact Analytical Representation of
Screw Compressor Rotor Geometry, International Compressor Engineering Conference Purdue, USA (1990), Vol.I, 925-937
[20] Zhang, L., Hamilton, J.F. Main Geometric Characteristics of Twin
Screw Compressors, International Compressor Engineering Conference Purdue, USA (1992), Vol.I, 449-456
[21] You, C.X., Tang, Y., Fleming, J.S. Optimum Rotor Geometrical Parameters
in Refrigeration Helical Twin Screw Compressor, International Compressor Engineering Conference, Purdue, USA (1996), Vol.I, 1-6
[22] Zaytsev, D., Ferreira, I.C.A. Profile Generation Method for Twin Screw
Compressor Rotors Based on the Meshing Line, International Journal of Refrigeration, Volume 28, 5 744–755, Aug (2005)
[23] Stosic, N., Hanjalic, K. General Method for Screw Compressor
Profile Generation, International Compressor Engineering Conference, Purdue, USA (1996), Vol.I, 57-162
[24] Stosic, N., Hanjalic, K. Development and Optimization of Screw Machines
With a Simulation Model-Part I, Profile Generation, Journal of Fluid Engineering, (1997), 119, 659-662
[25] Stosic, N., Hanjalic, K. Development and Optimization of Screw Engine
Rotor Pairs on the Basis of Computer Modelling, Purdue Engineering Conference, Purdue, USA (1994), Vol.I, 55-60
[26] Stosic, N., Smith, I K., Kovacevic, A. Rotor Interference as a Criterion for
Screw Compressor Design, J. Engg. Design, Vol.14, 2 June (2003), 209–220 [27] Singh, P.J., Onuschak, A.D. A Comprehensive, Computerized Method for
Twin Screw Rotor Profile Generation and Analysis, Proceedings of the Purdue Compressor Technology Conference, Purdue, USA (1984), 519-527
182

[28] Stosic, N., Smith, I.K., Kovacevic A., Aldis, C.A. The Design of a Twin Screw Compressor Based on a New Rotor Profile, Journal of Engineering Design, (1997), Vol. 8, 4 389-399
[29] Mccreath, P., Stosic, N., Smith, I.K., Kovacevic, A. The Design of
Efficient Screw Compressors for Delivery of Dry Air, International Conference, Compressors and their Systems, London, (2001)
[30] Xing, Z., Peng, X., Shu, P. Development and Application of a Software
Package for the Design of Twin-Screw Compressors, International Compressor Engineering Conference, Purdue, USA (2000), 1011-1018
[31] Mould, R., Richmond, G., Thrall, D. Computer Aided Manufacture of
Original Equipment Manufacturer Screw Compressor Rotors Design, Proceedings of the Purdue Compressor Technology Conference, USA (1982), 174-177
[32] Zhou, Z. Computer Aided Design of a Twin Rotor Screw Refrigerant
Compressor, International Compressor Engineering Conference, Purdue, USA (1992), Vol.I, 457-466
[33] Xing, Z., Deng, D., Shu, P. A Computer Aided Design System for Twin-
Screw Compressors, Proceedings of the International Compressor Engineering Conference, Purdue, USA (1992), Vol.I, 239-248
[34] Faydor, L., Litvin, Feng, P.H. Computerized Design, Generation and
Simulation of Meshing of Rotors of Screw Compressor, Mechanism and Machine Theory, (1997), Vol.32, 2 137-160
[35] Xiao, D. Z., Li, K. B., Wang, Z.Q., Liu, D.M. Computer Aided Design
Software Package for Conjugate Helical Surfaces, Journal of Materials Processing Technology Vol. 61, Issue 1-2, August (1996), 72-77
[36] Xiao, D. Z., Liu, D. T. Computer Aided Curvature Analysis along the Contact
Line of Conjugate Helical Surfaces, Journal of Materials Processing Technology, 61, (1996), 67-71
[37] Fleming, J.S., Tang, Y., And Anderson, H. Optimization Techniques
Applied to the Design of a Refrigeration Twin Screw Compressor, International Compressor Engineering Conference, Purdue, USA (1994), Vol.I, 641-646
[38] You, C.X., Tang, Y., and Fleming, J.S. Optimum Lobe Tip Designs in Oil
Injected Helical Twin Screw Compressors, International Compressor Engineering Conference, Purdue, USA, (1996), Vol.I, 7-11
[39] Xing, Z., Wu, H., Shu, P. The Design of a New Generation of Twin-Screw
Refrigeration Compressors, 16th International Compressor Engineering Conference Purdue, USA, (2002), C21-5
183

[40] Venumadhav, K., Stosic, N., Smith, I.K., Kovacevic, A. The Design of a family of Screw Compressors for Oil Flooded Operation, (www.city.ac.uk/~sj376)
[41] Stosic, N., Smith, I.K., Kovacevic, A. Optimization of Screw Compressors,
Applied Thermal Engineering, 23 (2003) 1177-1195 [42] Stosic, N. On Gearing of Helical Screw Compressor Rotors, I Mech E, Journal
of Mechanical Engineering Science, (1998), Vol.212, 588-594 [43] Stosic, N., Smith, I.K., Kovacevic, A. Retrofit ‘N’ Rotors for Efficient
Oil Flooded Screw Compressors, International Compressor Conference, Purdue, USA (2000), 917-924
[44] Hattori, H., Kawashima, N. Dynamic Analysis of Rotor Journal
Bearing System for Twin Rotary Screw Compressors, International Compressor Engineering Conference Purdue, USA (1990), Vol.I, 750-760
[45] Zhou, Z., Wang, D., Zhu, T., and Mao, J. Analysis of the Applied Forces in
Twin Screw Refrigerant Compressors, International Compressor Engineering Conference, Purdue, USA (1990), Vol.I, 8-17
[46] Fujiwara, A., and Sakurai, N. Experimental Analysis of Screw Compressor
Noise and Vibration, Proceedings of The 1986 International Compressor Engineering Conference, Purdue, USA (1986), Vol.I, 566-582
[47] Adams, G.P., Soedel, W. Dynamic Simulation of Rotor Contact Forces
in Twin Screw Compressors, International Compressor Engineering Conference, Purdue, USA, (1994), Vol.I, 73-78.
[48] You, C.X., Tang, Y., Fleming, J.S. A Generalized Computer Program
for Calculating the Bearing Loads in Helical Twin-Screw Compressors, International Compressor Engineering Conference, Purdue, USA (1994), Vol.I, 653-658
[49] Adams, G.P., and Qin, Z.H. Compression Load Transmission in Screw
Compressors, Journal of Sound and Vibration, (1997), 207 5, 671-691 [50] Adams, G.P., Soedel, W. A Method for Computing the Compression Loads
in Twin-Screw Compressor, International Compressor Engineering Conference Purdue, U.S.A (1994), Vol.I, 67-72
[51] Adams, G., Soedel, W. Remarks on Oscillating Baring Loads in Twin
Screw Compressors, International Compressor Engineering Conference Purdue, USA (1992), Vol.I, 439-448
[52] Stosic, N., Kovacevic, A., Smith, I.K. Modelling of Screw
Compressor Capacity Control, International Compressor Engineering Conference, Purdue, U.S.A (1998), Vol.I, 607-612
184

[53] Alyokhin, N.B., Malakhov, V.P. Compressor Capacity Control, International Compressor Engineering Conference, Purdue, USA (1996), Vol.I, 19-24
[54] Sjoholm, L. Variable Volume Ratio and Capacity Control in Twin-Screw
Compressors, Proceedings of the International Compressor Engineering Conference, Purdue, USA (1986), Vol.I, 494-508
[55] Sauls, J. Design of Unloader System for Moderate Capacity
Refrigeration Screw Compressors, International Compressor Engineering Conference, Purdue, USA (1998), Vol.I, 583-588
[56] Mark, A. Firnhaber., Donald., Szarkowicz, S. Modelling and Simulation of
Rotary Screw Compressors, Proceedings of the Purdue Compressor Technology Conference, Purdue, USA (1980), 305-310
[57] Barblik, J., And Praha, C.K.D. Analytical Model of an Oil Free
Screw Compressor, Proceedings of the Purdue Compressor Technology Conference, Purdue, USA (1982), 356-364
[58] Alday, J.H., Hood, J.A. A Program for Mathematical Modelling and Analysis
of Rotary Screw Compressor Performance, Proceedings of the International Compressor Engineering Conference, Purdue, USA Vol.I, (1992), 249-258
[59] Sangfors, B. Analytical Modelling of Helical Screw Machine for Analysis and
Performance Prediction, Proceedings of the Purdue Compressor Technology Conference, Purdue, USA (1982), 135-139
[60] Zenan, Z., Jiashen, Z., Zhaolin, W. D. G. The Application of Micro
Computer in Optimum Design and Performance Forecast of Screw Compressor, Proceedings of the International Compressor Engineering Conference, Purdue, USA (1988), 244-249
[61] Pandeya, P., Soedel, W., Ray, W. A Generalized Approach towards
Compressor Performance Analysis, Proceedings of the Purdue Compressor Technology Conference, Purdue, USA (1978), 135-143
[62] Lundberg, A.A. Comparison of SRM and Globoid Type Screw Compressors at
Part Load, Proceedings of the Purdue Compressor Technology Conference, Purdue, USA (1978), 359-362
[63] Lundberg, A. A. Comparison of SRM and Globoid type Screw Compressors
at full Load, Proceedings of the Purdue Compressor Technology Conference, USA (1978), 353-358
[64] Fujiwara, M., Osada, Y. Performance Analysis of Oil Injected Screw
Compressor and its Application, International Journal of Refrigeration, (1995), Vol.18, 4 220-227
185

[65] Fujiwara, M., Kasuya, K., Matsunaga, T., Makoto, W. Computer Modelling for Performance Analysis of Rotary Screw Compressor, Proceedings of the Purdue Compressor Technology Conference, Purdue, USA (1984), 536-543
[66] Fujiwara, M., Mori, H., And Suwama, T. Prediction of the Oil free Screw
Compressor Performance using Digital Computers, Proceedings of the Purdue Compressor Technology Conference, Purdue, USA (1974), 186-189
[67] Singh, P.J., and Patel, G.C. A Generalized Performance Computer Program
for Oil Flooded Twin-Screw Compressors, Proceedings of the Purdue Compressor Technology Conference, Purdue, USA (1984), 544-553
[68] Xiao, D., Xiong, Z., and Yu, Y.Z. The Computer Simulation of Oil Flooded
Refrigeration Twin-Screw Compressors, Proceedings of the Purdue Compressor Technology Conference, Purdue, USA (1986), Vol.I, 349-361
[69] Sangfors, B. Computer Simulation of Oil Injected Twin-Screw Compressor,
Proceedings of the Purdue Compressor Technology Conference, Purdue, USA (1984), 528-535
[70] Peng, N., Xing, Z., Deng, D., Shu, P. New Rotor Profile and its
Performance Prediction of Screw Compressor, International Compressor Engineering Conference, Purdue, USA Vol.I, (1990), 18-23
[71] Kishi, T., Nishio., T., Matsui, A., Ino, N. The Improvement of Screw
Compressor Performance Using a Newly Developed Rotor Profile, Advances in Cryogenic Engineering, (1993), Vol.39A, 879-885
[72] Kivotada, M. Analysis of Screw Compressor Performance based on Indicator
Diagrams, Proceedings of the International Compressor Engineering Conference, Purdue, USA (1992), Vol.I, 259-268
[73] Zhang, Z., Tan, Y., Shi, G. And Qian, Z. Experimental Study of the Oil
Injection Screw Air Compressor, Compressor Conference, Purdue, USA (2002), C19-4
[74] Sauls, J. Development of a Comprehensive Thermodynamic
Modelling System for Refrigerant Screw Compressors, International Compressor Engineering Conference, Purdue, USA (1996), Vol.I, 151-156
[75] Ignatiev, K.M., Tang, Y., Fleming, J.S. Thermal Interaction in a
Refrigeration Twin Screw Compressor during Compression Process, International Compressor Engineering Conference, Purdue, USA (1994), Vol.I, 629-634
[76] Huagen, W., Ziwen, X., Pengcheng, S. Theoretical and Experimental
Study on Indicator Diagram of Twin Screw Refrigeration Compressor, International Journal of Refrigeration, Vol.27, 4 (2004), 331-338
186

[77] Haugland, K. Pressure Indication of Twin-Screw Compressor, International Compressor Engineering Conference, Purdue, USA (1990), Vol.I, 450-456
[78] Hanjalic, K., Stosic, N. Development and Optimization of Screw Machines
With a Simulation Model-Part II, Thermodynamic Performance Simulation and Design Optimization, ASME, Transactions, Journal of Fluids Engineering, 119, (1997), 664-670
[79] Stosic, N., Smith, I.K., and Kovacevic, A. Numerical Simulation of Fluid
Flow and Solid Structure in Screw Compressors, ASME, International Mechanical Engineering Congress, New Orleans, USA (2002), 17-22
[80] Stosic, N., Smith, I.K., Zagorac, S. C.F.D. Studies of Flow in Screw and
Scroll Compressor, International Compressor Engineering Conference, Purdue, USA (1996), Vol.I, 181-186
[81] Singh, P. J., Bowman, J.L. Heat Transfer in Oil Flooded Screw
Compressors, Proceedings of the Compressor Engineering Conference, Purdue, USA (1986), Vol.I, 135-152
[82] Stosic, N., Kovacevic, A., Hanjalic, K., And Milutinovic, L. Mathematical
Modelling of the Oil Influence upon the Working Cycle of Screw Compressors, Proceedings of the Purdue Compressor Technology Conference, Purdue, USA (1988), 354-361
[83] Stosic, N., Milutinovic, L., Hanjalic, K., And, Kovacevic, A.
Investigation of the Influence of the Oil Injection upon the Screw Compressor Working Process, International Journal of Refrigeration, 15, No. 4, (1992), 205-219
[84] Stosic, N., Milutinovic, L., Hanjalic, K., and, Kovacevic, A.
Experimental Investigation of the Influence of Oil Injection upon the Screw Compressor Working Process, Proceedings of the Purdue Compressor Technology Conference, Purdue, USA (1990), 34-43.
[85] Peng, X., Xing, Z., Zang, X., Cui, T., and Shu, P. Experimental Study of
Oil Injection and its effect on Performance of Twin Screw Compressors, International Compressor Engineering Conference, Purdue, USA (2000), 1003-1010
[86] Hammerl, K., Tinder, L., Frank, M. K. Modification in the Design of the Oil
Injection System for Screw Compressors, International Compressor Engineering Conference, Purdue, USA (2000), 987-994
[87] Sangfors, B. Computer Simulation of Effects from Injection of
Different Liquids in Screw Compressors, International Compressor Engineering Conference, Purdue, USA (1998), Vol.I, 595-600
[88] Sjoholm, L.I., Short, G.D. Twin Screw Compressor Performance and
Complex Ester Lubricants with HCFC-22, International Compressor Engineering Conference, Purdue, USA (1990), Vol.I, 724-732
187

[89] Sjoholm, L.I., Short, G.D. Twin-Screw Compressor Performance and Suitable Lubricants with HFC-134a, International Compressor Engineering Conference, Purdue, USA (1990), Vol.I, 733-740
[90] Tang, Y., and Fleming, J.S. Simulation of the Working Process of an Oil
Flooded Helical Screw Compressor with Liquid Refrigerant Injection, Proceedings of the International Compressor Engineering Conference, Purdue, USA (1992), Vol.I, 213-220
[91] Kangping, C., Zhenwu, T., and Hengyi, C. The Development and
Application of Water-Injected Twin Screw Compressor, Proceedings of the International Compressor Engineering Conference, Purdue, USA (1992), Vol.I, 269-277
[92] Westphal, C.R., and Bell, H.S. Design and Development of a Water
Flooded Screw Compressor Packaged Air Supply System, Proceedings of the Purdue Compressor Technology Conference, USA (1978), 341-352
[93] Ducruet, C., Hivet, B., Boone, J., Torreilles, M. Test on a Twin-Screw
Compressor: Comparison between Two Cooling Modes; Proceedings of the International Compressor Engineering Conference, Purdue, USA Vol.I, (1996), 175-180
[94] Tree, D.R., and Fresco, A. Efficiency Study of Oil Cooling of a Screw
Compressor, Proceedings of the UNSC/IIR Purdue Refrigeration Conference, Purdue, USA (1990), Vol.I, 110-119
[95] Depaepe, M., Bogaert, W., Mertens, D. Cooling of Oil-Infected
Compressors by Oil Atomization, Applied Thermal Engineering, Vol.25, Issues 17-18, December (2005), 2653-3202
[96] Stosic, N., Smith, I.K., and Kovacevic, A. CFD Analysis of Screw
Compressor Suction Flow, International Compressor Conference, Purdue, USA (2000), Vol.I, 909-916
[97] Sjoholm, L.I., Muralidhar, A. Measurement of the Discharge Port for a
Screw Compressor, Fifteenth International Compressor Engineering Conference, Purdue, USA (2000), 995-1002
[98] Koai, K.L., Soedel, W. Gas Pulsations in Twin Screw Compressors, Part-I,
Determination of Port Flow and Interpretation of Periodic Volume Source, International Compressor Engineering Conference, Purdue, USA (1990), Vol.I, 369-377
[99] Koai, K.L., Soedel, W. Gas Pulsations in Twin Screw Compressors, Part-II,
Dynamics of Discharge System and its Interaction with Port flow, International Compressor Engineering Conference Purdue, USA (1990), Vol.I, 378-387
[100] Koelet, P. Industrial Refrigeration, Principles, Design and Applications, Mc
Graw Hill, (1992).
188

[101] Xiong, Z. The Dynamic Measurement and Mating Design of a Screw Compressor Rotor Pair, Proceedings of the International Compressor Engineering Conference, Purdue, USA (1984), 554-558
[102] Prins, J., and Farreira, I. C.A. Quasi one Dimensional Steady State Models
for Gas Leakage, Part-I: Comparison and Validation, International Compressor Engineering Conference, Purdue, USA (1998), Vol.I, 571-576
[103] Prins J., and Farreira, I.C.A. Quasi One Dimensional Steady State Models
for Gas Leakage, Part-II: Improvement of the Viscous Modelling, International Compressor Engineering Conference, Purdue, USA (1998), Vol.I, 577-582
[104] Hangiqi, L., Guangxi, J. Research on Discharge Port of Oil Flooded Rotary
Compressors, International Compressor Engineering Conference, Purdue, USA (1990), Vol.I, 292-299
[105] Singh, P.J., Bowman, J.L. Calculation of Blowhole Area for Screw
Compressors, International Compressor Engineering Conference, Purdue, USA (1990), Vol.I, 938-948
[106] Xiong, Z., And Xiao,D. Study on Actual Profile Surface and Engaging
Clearance of Screw Compressor Rotors, Proceedings of the International Compressor Engineering Conference, Purdue, USA (1986), Vol.I, 305-311,
[107] Vimmer, J. Mathematical Modelling of Compressible Invicid Fluid Flow
Through a Sealing Gap in the Screw Compressor, Journal of Mathematics and Computers in Simulation, 61, (2003), 187-197
[108] Zaytsev, D., and Ferreira, I.C.A. Aspects of Two Phase Flow Screw
Compressor Modelling, Part I: Leakage Flow and Rotor Tip Friction, International Compressor Engineering Conference, Purdue, USA (2000), 893-900
[109] Fleming, J.S., Tang, Y. Analysis of Leakage in a Twin Screw Compressor
and its Application to Performance Improvement, Proceedings of The Institution of Mechanical Engineers, Part E: Journal of Process Mechanical Engineering, Vol.209, E2, (1995), 125-136
[110] Abu-Hijlleh, B., Tu, J., Subic, A., Li, H., Ilie, K. CFD Comparison of
Clearance Flow in a Rotor-Casing Assembly using Asymmetric Vs Symmetric Lobe Rotors, American Society of Mechanical Engineers, Fluids Engineering Division (FED), Vol.259, (2003), 327-330
[111] Prins, J., Carlos, A., Ferreira, I. Leakage Experiments on a Running Twin-
Screw Compressor, International Compressor Engineering Conference, Purdue, USA (2002), C19-3
189

[112] Lee, K.S., Kim, W. S., Kim, K.Y., Kim, C.H. A Study of the Leakage Performance for the Plain Seal with Injection, Proceedings of The International Compressor Engineering Conference, Purdue, USA (1992), Vol.I, 229-238
[113] www.howdencompressos.co.uk [114] Shaw, D.N. Screw Compressors, Control of ‘Vi’ and Capacity, the Conflict,
Proceedings of the International Compressor Engineering Conference, Purdue, USA (1988), Vol.I, 236-243
[115] Pietsch, A., and Nowotny, S. Thermodynamic Calculation of a Duel Screw
Compressor based on Experimentally Measured Values Taking Supercharge into Account, International Compressor Engineering Conference, Purdue, USA (1990), Vol.I, 44-50
[116] Yahya, S.M. Fundamentals of Compressible Flow, New Age International
Pvt. Ltd. (1996) [117] Fox, R. W., Mcdonald, A. T. Introduction to Fluid Mechanics, 2nd Edition,
John Wiley & Sons (1973) [118] Ueno, K., Hunter, K.S. Compressor Efficiency Definitions, (2003)
(www.vairex.com) [119] www.me.ua.edu [120] ALLPROPS: Thermodynamic Property Packages
(Http://Www.Engr.Uidaho.Edu/Cats/Software) [121] Coleman, H.W., Steele, W.G. Experimentation and Uncertainty Analysis for
Engineers, John Wiley &Sons, (1989) [122] Kegel, T. Uncertainty Issues Associated with a Volumetric Primary Flow
Standard for Compressible Flow Measurement (www.ceesi.com) [123] Taylor, R.P., Hodge, B.K., James, C.A. Estimating Uncertainty in Thermal
Systems Analysis and Design, Applied Thermal Engineering, (1999) 19, 51-73 [124] Moffat, R.J. Describing the Uncertainties in Experimental Results Experimental
Thermal and Fluid Science (1998) 1 (1) 3-17 [125] Brown, K.K., Coleman, H.W., Steele, W.G. A Methodology for Determining
Experimental Uncertainties in Regressions, Proceedings of the ASME Fluids Engineering Division, ASME (1996) FED- Vol. 242, 263-273
[126] Youngs, W. Screw Compressors: A Comparison of Applications and Features
to Conventional Types of Machines, (www.gasprocessors.com) [127] Arkharov, A., Marfenina, I., Trans, M.Ye., Kuznetsov, B.V. Theory and
Design of Cryogenic Systems, Mir Publishers, Moscow (1981)
190

[128] Martinez, A., And Pallaver, C.B. Test of an Improved Oil Injected Helium
Screw Compressor at Fermi Lab, Advances in Cryogenic Engineering, (1993), Vol. 39A, 887-892
[129] Martinez, A., and Pallaver, C.B. Operation and Maintenance of Fermi
Laboratory’s 300kw Helium Screw Compressors, Cryogenic Engineering Conference and International Cryogenic Material Conference, Columbus, Ohio, (1995)
[130] Shaw, D.N. Twin Screws of the Future for Air Conditioning and Refrigeration,
International Compressor Engineering Conference, Purdue, USA, (1990), Vol.I, 1-7
[131] Mosemann, D., Krienke, S., and Nowotny, S. Improvements of
Refrigerating Screw Compressors of Large Capacity, Proceedings of the International Compressor Engineering Conference, Purdue, USA (1988), 250-255
[132] Mori, H., Kasuya, K., Suzuki, A., Takahashi, Y., Aoki, M. Single Stage
Oil Free Screw Compressor with a Compression Ratio of “Eight”, Proceedings of the International Compressor Engineering Conference, Purdue, USA (1986), Vol.I, 105-118
[133] Moshe, Y., Dreksler, P.E. The Two-Stage Compound Screw Low
Molecular Weight Gas Compressor, Proceedings of the International Compressor Engineering Conference, Purdue, USA (1992), Vol.I, 31-40
[134] www.gcbtechnicold.com [135] Xiong, Z. Use The Method of Magnetic Score to Measure the Dynamic
Parameters of the Screw Compressors, Proceedings of the International Compressor Engineering Conference, Purdue, USA (1986), Vol.I, 321-333
[136] Wu, H., Peng, X., Xing, Z., Shu, P. Experimental Study on P-V Indicator
Diagrams of Twin Screw Refrigeration Compressor with Economizer, Applied Thermal Engineering, Vol. 24, 10 July (2004), 1491-1500
[137] Edstorm, S.E. Modern way to Good Screw Rotors, International Compressor
Engineering Conference, Purdue, USA (1992), Vol.I, 421-430 [138] Wardle, F.P., Jacobson, B., Dolfsma, H., Hoglund, E., and Jonsson, U.
The Effects of Refrigerants on the Lubrication-Rolling Element Bearings used in Screw Compressors, Proceedings of the International Compressor Engineering Conference, Purdue, USA (1992), Vol.I, 523-534
[139] Jacobson, B. Lubrication of Screw Compressor Bearings in the Presence of
Refrigerants, International Compressor Engineering Conference Purdue, USA (1994), Vol.I, 115-120
191

[140] Stosic, N., Smith, I.K., Kovacevic, A. A Twin Screw Combined Compressor and Expander for CO2 Refrigeration System, International Compressor Engineering Conference Purdue, USA (2002), Vol.I, C 21-2
[141] Kovacevic, A., Stosic, N., And Smith, I.K. CFD Analysis of Screw
Compressor Performance (www.city.ac.uk/~sj376) [142] Kovacevic, A., Stosic, N., and Smith, I.K. The Influence of Rotor
Deflection upon Screw Compressor Performance (www.city.ac.uk/~sj376) [143] Fleming, J.S., Tang, Y., Cook, G. The Twin Helical Screw Compressor Part
2: A Mathematical Model of the Working Process, Proceedings of the Institution of Mechanical Engineers, Part C: Journal of Mechanical Engineering Science, Vol. 212, 5 (1998), 369 - 380
[144] Bowater, F.J. Large Screw Compressors in Refrigeration Industry,
(www.fjb.co.uk) [145] Laplante, J.R. Rotary Compression Process; Prepared for the Gas Machinery
Research Council Conference, (2003), (www.gmrc.org)
192