Combining Experimental and Analytical Substructures With ...

1
ExperimentalandanalyticalstudyofconcreteblockssubjectedtoconcentratedloadswithanapplicationtoTBM‐constructed
tunnels
Abstract
TogenerateenoughthrustforaTunnelBoringMachine(TBM)toexcavateasoilandadvance,severaljacksaretypicallyusedtoapplyforcetothelastinstalledringthatactsasareaction frame. These loads generate bursting stresses that might cause cracks in thelongitudinaldirectionofthesegments.Manystudiesdedicatedtoevaluatingthisphenomenonfocusmainly on elementswith similar height‐to‐length ratios. To cover thewide variety ofdimensionsandloadapplicationpatterns,additionalexperimentalassessmentsarerequired.Theobjectivesofthepresentpaperaretoextendthestudyofwithdifferentheight‐to‐lengthratios subjected to concentrated loads and to validate analytical formulations for theverification of concrete segments in SLS and ULS. To accomplish this, an experimentalprogramwasconstructedusingsmall‐scalespecimenswithandwithoutfibrereinforcement.The results obtainedwere used to validate the formulations derived from a struts‐and‐tiesmodel. Finally, an application of the formulation proposed to the case study of Line 9 inBarcelona is presented. This study represents a contribution towards the development ofsimplifiedtoolsforthedesignofsegmentedliningsbothintheSLSandintheULS.
Keywords
concentratedload,precastsegment,crackpattern,strutandtiemodel,structuraldesign

2
1. Introduction
Togenerate enough thrust for aTunnelBoringMachine (TBM) to excavate soil andadvance,severaljacksaretypicallyusedtoapplyforcetothelastinstalledringthatactsasareaction frame. If the loads are excessively high, crack patternsmight arise in traditionallyreinforced and in fibre reinforced concrete segments, as presented in Figure 1 [1] fordifferentconfigurationsofthethrustjacks.Althoughsomeofthecracksmightbeexplainedbyan imperfect support of the segments [2‐4], others are related to the application ofconcentrated loads. In the latter case, compressive and splitting stresses appear under thepads of the jacks. These stresses are derived from a triaxial state that spreads over thedisturbancezonethroughcompressiontrajectories.Thesetrajectoriesareinternallybalancedbytensiletrajectories,leadingtosplittingstresses(i.e.,burstingstresses)thatcausethemainvertical cracks through the depth of the segment. Similarly, as a result of the convex–deformedgeometry,spallingstressescouldappearandgeneratesecondarycracks.
Figure1.Generalstresspatternsfordifferentthrustjack’sconfigurations:(a)German;and(b)JapaneseandFrenchsystems.
Eventhoughtheopeningofsecondarycracksshouldalsofulfiltheservicelimitstate(SLS) requirements, bursting stresses are of special interest to the design of the structurebecausetheydeterminethereinforcementstrategy.Currently,thesecrackpatterns(Figure1)aretypicallycontrolledbyusingtraditionalsteelbars.However, ithasbeenproventhattheuseofacertainamountofstructuralfibresmayenhancetheperformanceinSLS[5],leadingtocostandtimesavings[6].
Itiswellknownthattheapplicationofconcentratedloadsinducesacomplex3‐Dstateofstresses,which isdifficult toevaluatedueto theexistenceofadisturbancezonebeneaththe load transfer area. The phenomenon was initially evaluated and applied to supportsystems [7‐9] and pre‐stress transfer zones [10]. Investigations for the particular case oftunnelsconstructedwithaTBMandconcretesegments[1,3,11‐12]arealsointheliterature.Table 1 gathers experimental programs from the literature related to the behaviour ofconcreteelementssubjectedtoconcentratedloads.
ThestudiespresentedinTable1compriseconcreteblocks(B)andprecastconcretesegments(PS).Someofthesestudiesexaminedrealtunnels(e.g.,theBarcelonaMetroLine9in Spain [15],Hydraulic Tunnel ofMontelirio inPanama [17, 20], theBrennerBaseTunneljoining Italy and Austria [21] and the Prague Metro Line [21‐22]), while the rest areassociatedwithresearchprojects[13‐14,18,23‐24]).Othersalsoincludeplainconcrete(PC),
Spallingstresses(secondarycracks)
Burstingstresses(maincracks)
(a)
Compressivestresses
Compressivestresses
Burstingstresses
Spallingstresses
(b)

3
reinforcedconcrete(RC)orfibrereinforcedconcreteelements.Table1.PreviousresearchfocusedonFRCelementssubjectedtoconcentratedloads
Elementsfc
(MPa)Dimensions
(mm) MaterialCf
(kg/m3) Фf/λf Tests LoadNumericalsimulation Ref.
PS(RP) 60
3000x1000x300(panels)
RC ‐ ‐
4 Centredjack 3D‐FE(ANSYS) [13]SFRC
35 0.65/60
600.65/600.92/65
B(RP) 60 350x350x700 SFRC
35 0.65/600.92/60 12
Centredlineandpointloads
(1)3D‐FE(ANSYS)and(2)strut‐tie
models[14]
60PS(MT)
50 900x520x175(panels)
RC+SFRC 301.00/65 4 Centred&
eccentricjack3D‐FEelasticmodel(ANSYS)
[15]SFRC 60
PS(RP)
75‐100 3150x1420x300RC ‐ ‐
5 Centredjack
(1)3D‐FE(ABAQUS)and(2)strut‐tiemodels
[16]SFRC 60 1.00/50
PS(HT) 35 1840x1200x250 SFRC 40 0.75/80 1 Centredjack None [17]
PS(RP)
60 2359x1400x350
PC ‐ ‐
9
Centredjackoncantileveredsupportedsegment
None [18]SPFRC
30+1 0.75/80+
PPfibres40+1PS(RT)
50 3400x1500x200RC ‐ ‐
2 Centredjack None [19]SFRC 40 0.35/85
PS(HT) 35 1840x1200x250 SFRC 40
0.35/853 Centredjack
DesignwithMC2010
[20]0.60/500.75/40
PT(MT) 60 2570x1500x250 SFRC
40 15
Centredjackonuniformlyandcantileveredsupportedsegment
(1)2D‐FE(ATENA)and(2)3D‐FEforthefull‐scaletestson
precastsegments
[21] [22]
50 0.75/80
B(RP)
75‐95 300x150x150
PC ‐ ‐
96
Differentloaded‐arearatioswithvaryingpositions
oftheconcentrated
load
3D‐FE(MSC‐Marc) [23]SFRC
400.75/8060
80
600.90/650.71/850.55/55
PS(RP)
150‐1701000x500x100(reducedscale)
UHPC ‐ ‐2
CentredTBMjacksimulation
None [24]UHSFRC 236 0.20/80
PS:precastconcretesegment;B:concreteblock;RP:researchproject;MT:metrotunnel;HT:hydraulictunnel;RT:roadtunnel;RC:reinforcedconcrete;SFRC:steelfibrereinforcedconcrete;PC:plainconcrete;Cf:amountoffibres;Фf:diameterofthefibre;andλf:slendernessratioofthefibre.
In general, the forces from aTBM’s thrust jackswere emulated in the experimentalprogramsfromTable1ascentredloadsappliedbylaboratorytestingmachines,exceptin[15]and[23],whichalso includedtheeccentricityofthe loadasaparameter. Although inmostcasestheelementswereuniformlysupported,severalauthors[18,21‐22]testedanimperfectsupport between a placed ring and a segment being installed with a cantileveredconfiguration. Conversely, [23] analysed the effect of different loaded area ratios andpositionsoftheload.
The influenceofthediameter(Фf)andaspectratio(λf)ofthefibreswerestudied in

4
severalexperimentalprograms.Bothparametersrangedfrom0.20mmto1.00mmandfrom40 to85, respectively. Inalmostall testsexcept for [18], steel fibreswithhookedendsandamountsrangingfrom35to80kg/m3wereused.Effectsonthevariabilityonthestructuralresponseduetothefibredistributionandorientationwerestudiedby[16]and[23].Aspecialmention should be made to the experimental program conducted by [24] to evaluate theultra‐highperformancesteel fibrereinforcedconcrete(UHPSFRC)asapotentialmaterial toenhanceboth themechanical anddurabilityperformanceof tunnel segments. In that study,UHPSFRCs with compressive strengths from 150 to 170 N/mm2 and 236 kg/m3 (3% byvolume)ofstraightsteelfibreswerestudied.
Concerningthedesign,itshouldbenotedthat3Dfiniteelementmodelswithsmearedcrackhasbeentheprimaryapproachusedbyresearchers[13‐16,21‐24]tosimulatethejackthrustofaTBMnumerically.Themostcommonsoftwarepackagesapplied for thispurposewere ABAQUS [25], ANSYS [26], ATENA [27] and MSC‐Marc [28] (see Table 1). Othernumerical studies have been performed by [29] and [30] in which different fibrereinforcement ratios and load configurations were evaluated. Particularly, in [29], a realfailureofasegmentusedattheMetroLine9ofBarcelonawasreproducednumerically.
Analytical models based on the struts and ties models (STMs) have also beenrecommended as a safe alternative to evaluate the splitting stresses and the reinforcementrequirements of element subjected to concentrated loads [31‐33], particularly for precastconcrete segments [34‐38]. This simplified approach is interesting due to its easyimplementationandadaptability to reproduce the stresspatterns causedbyTBMthrust. In[14], a study was performed to adjust the analytical expressions considering the fibrecontributionintheresistantmechanismaswellastoadjustthedepthofthedisturbancezone.
Despitethemanystudiesintheliterature,moststudyelementswithsimilarheight‐to‐length ratios. To cover the wide variety of dimensions and loading patterns, additionalexperimental assessments are yet required. These studies could support the calibration ofanalytical formulations to assess the cracking and the failure load depending on thedimensionsoftheelements.
Theobjective of the present paper is to extend the study of elements subjected toconcentrated loads by considering different height‐to‐length ratios with and without fibrereinforcement.ThegoalofthisstudyistovalidatesimplifiedanalyticalformulationsthatmaybeappliedfortheverificationofconcretesegmentsinSLSandULS.Anexperimentalprogramwasalsoconductedwithsmall‐scalespecimens;theassociatedresultswereusedtovalidatethe formulationsderivedusing similar studies from the literature. Finally, an applicationoftheformulationisproposedtothecasestudyofLine9inBarcelonaispresented.Thisstudyrepresents a contribution toward thedevelopment of simplified tools for thedesign of SLSandULSsegmentedlinings.
2. EXPERIMENTALPROGRAM
Theexperimentalprogramconsistedoftheassessmentofthemechanicalresponseofsmall‐scaleconcretespecimenswithdifferentdimensionssubjectedtoconcentratedloads.Toconsider the typical variety ofmaterials applied in segmented linings, specimenswere castwith4concreteserieswiththecompositionsindicatedinTable2.TheseriesPC‐40andPC‐

5
50 correspond to plain concretewith compressive strengths [39] (fc) of 40N/mm2 and 50N/mm2, respectively. The series SFRC‐40 and SFRC‐50 correspond to steel‐fibre‐reinforcedconcretewith equivalent strength class.Hooked–end steel fibreswith60mmof length (lf),0.75mmofdiameter(Фf)andyieldmodulus(ff)of1050N/mm2wereusedinthelattertype.
Table2.Compositionofconcreteseries(inkg/m3)Material PC‐40 SFRC‐40 PC‐50 SFRC‐50
CementCEMI52,5R 300 300 400 400Marblepowder 350 350 250 250Sand0‐3(mm) 510 510 510 510Aggregate2.5/6(mm) 400 400 400 400Aggregate6/15(mm) 520 520 520 520ADVAFlow400 12 12 12 12Water 150 150 178 178Steelfibres ‐ 40 ‐ 40
Intotal,32concreteblockswerecastwiththedimensionsshowninFigure2.Inthis
sense,a,bandhTrepresentthelength,widthandheightoftheconcreteblocks,respectively.a1,b1andh1correspondtothelength,widthandheightofthesupportplate,respectively.Theconcretewas poured directly into a four‐compartmentmould (seeFigure3a) placed on avibrating table.As shown inFigure3b,metal bushingswere installed onboth sides of thelargermoulds.
Figure2.(a)Three‐viewplanschematicoftheinstrumentset‐up;and(b)dimensionsoftheblocksandsupportplates.
In addition to the elements used in the concentrated load tests, 12 cylindricalspecimens(Ф15×30cm),12cylindricalspecimens(Ф15×30cm)and16cylindricalspecimens(Ф15×15cm)werecastandused toassess thecompressiveand tensile strengthsusing theBrazilian test [40] and the residual using the Barcelona test [41‐43], respectively. Allspecimenswereproducedon the sameday in the sameambient conditions.Thespecimenswerestoredundercontrolledconditionsatatemperatureof20±1°CandanaveragerelativehumidityHR≥95%untiltesting.
During the tests, theblockswere supportedby a rigid steel plate, and the loadwasappliedbythesystempresentedinFigure4.Similarly,twoTemposonicdisplacementsensorswerefastenedtotheblockinahorizontalorientationatthemiddleonbothsides.Theloading
a1
b
a
LVDT
Steelplate
b1
h1
hT
a)a a1 b b1 hT h1
200 150* 150 150 300 50
250 150* 150 150 300 50
400 150 150 150 300 50
750 150 150 150 300 50
*FortheseriesSFRC40withthelengtha=200and250mm,thewidthoftheplateisa1=50mm.
b)
6
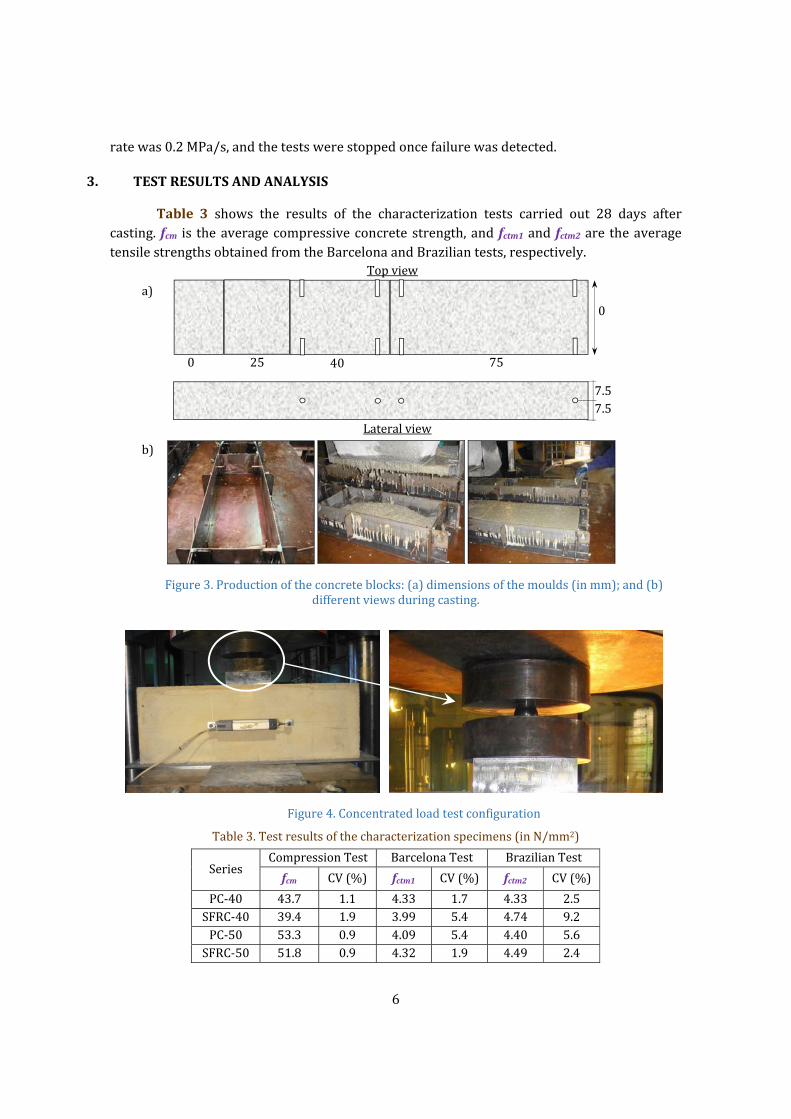
ratewas0.2MPa/s,andthetestswerestoppedoncefailurewasdetected.
3. TESTRESULTSANDANALYSIS
Table 3 shows the results of the characterization tests carried out 28 days aftercasting. fcm is theaveragecompressiveconcretestrength,and fctm1and fctm2are theaveragetensilestrengthsobtainedfromtheBarcelonaandBraziliantests,respectively.
Figure3.Productionoftheconcreteblocks:(a)dimensionsofthemoulds(inmm);and(b)differentviewsduringcasting.
Figure4.Concentratedloadtestconfiguration
Table3.Testresultsofthecharacterizationspecimens(inN/mm2)
SeriesCompressionTest BarcelonaTest BrazilianTest
fcm CV(%) fctm1 CV(%) fctm2 CV(%)
PC‐40 43.7 1.1 4.33 1.7 4.33 2.5SFRC‐40 39.4 1.9 3.99 5.4 4.74 9.2PC‐50 53.3 0.9 4.09 5.4 4.40 5.6SFRC‐50 51.8 0.9 4.32 1.9 4.49 2.4
0 25
0
7.57.5
Lateralview
Topview
7540
a)
b)

7
Asexpected,thePCspecimenspresentedslightlyhigherstrengthspresumablyduetotheoccludedairthattheuseoffibresleadstoinSFRCs.Thecompressivestrengthsthatwereexpected based on the materials’ compositions were achieved (Table 2). It is worthmentioningthattheBarcelonatestspresentedlowervaluesofthecoefficientofvariation(CV)thanthosefromtheBraziliantests.
It was observed that most of the blocks cracked in three stages during theconcentrated load tests. As shown in Figure5, in the first stage, a crack is caused due tobursting according to the equilibrium conditions. This is the main crack that progressesthroughthedepthofthespecimenastheloadincreases.Inthesecondstage,diagonalcracks(i.e., secondary cracks with angle β) appear as a result of compatibility demands on thedeformedshape;theyappeartostartattheuppersupportplateandendatthebottomoftheblock and are likely caused by spalling stress. Finally, in the third stage, a cone wedge isformedbeneaththeloadtransmissionplateduetothetriaxialcompressivestress.Thiswedgepenetratesthroughthemainburstingcrack,provokingthephysicalseparationoftwosemi‐blocksanddecreasingthebearingload. However,thethirdstagewasnotalwayspresentinplainconcreteblocksduetoabrittleruptureinthesecondstage.Thisismainlycausedbythelack of reinforcement, which reduces internal equilibrium restoring capacity after the firstburstingcrackoccurs.
Figure5.DifferentcrackpatternsobservedinthetestsduringtheloadingprocessTheload‐verticaldisplacement(δ)curvesoftheconcreteblocksgroupedbythesame
blocklengthaarepresentedintheFigure6.Thecurvescorrespondtotheaveragevaluesofeachseries.Similarly,Table4showstheresultsofthefirstcrackload(Fcr)andthemaximumload(Fmax).Thenomenclatureestablishedtorefertotheconcreteblocksis“ConcreteType‐fc‐a‐a/a1”.
Figs.6aand6bandTable4showthattheseriesSFRC‐40‐200‐4.0andSFRC‐40‐250‐5.0(grey‐shaded),forwhicha50x150x50m3steelplatewasusedinsteadofthe150x150x50mm3steelplateusedfortheotherseries,havealowerloadbearingcapacitythantheseriesPC‐40‐200‐1.3 and PC‐40‐250‐1.7. Considering that both series present similar tensileconcrete strengths (Table3), this effect couldbeattributed to the ratioa/a1as it hasbeenprovennumerically [9]andexperimentally [23]. Inthisregard, thedecreaseofa1 leadstoa
I II
α
IISpallingcracks
IBurstingcrack
β
IIIWedge
F
δ
III

8
stressconcentrationabovethesteelplateandanincreaseoftheburstingstresses.Conversely,theresultsalsoshowthatthebearingcapacityincreaseswiththelengthof
theblockandthattheloadFmaxrangesfrom2.0to3.0timestheloadFcr.Theseresultsrevealthehighinternalcapacityofthesystemtoredistributestressesbymeansofbothequilibriumand compatibility cracks.These load increasesarealsoobserved forbothunreinforcedandfibrereinforcedconcreteblocks.Theuseof40kg/m3ofsteel fibreshasalsobeenshowntoleadtoslightdifferencesinFmaxwithrespecttothePCseries.However,PCblockspresentedonly 3main cracks (1 bursting and 2 spalling cracks), as shown inFigure7a, while SFRCblocks (seeFigure7b) exhibit this same crack patternwithmore secondary cracks due tofromthehigherinternaldistributioncapacityproducedbythefibres.Thisfactisinterestinginterms of crack width and service limit state of the precast segments during the TBM jackaction.
Figure6.Load‐displacementcurvesoftheconcreteblocks
Table4.ExperimentalloadsFcrandFmaxmeasured(inkN)
Lengthoftheblock(a)Series Load 200mm 250mm 400mm 750mm
PC‐40Fcr 401 412 398 421 640 625 708 780Fmax 1049 1038 976 1081 1287 1200 1340 ‐
SFRC‐40Fcr 396 415 372 376 611 650 672 647Fmax 536 570 535 571 1250 1305 1299 1360
PC‐50Fcr 417 417 416 452 ‐ ‐ ‐ ‐Fmax 1166 1107 1167 1108 ‐ ‐ ‐ ‐
SFRC‐50Fcr 435 423 520 533 630 652 712 718Fmax 1250 1150 1225 ‐ 1485 1450 1604 1459
Tocalibratethemodelpresentedinthispaper,additionalmeasurementsofthecrack
0
200
400
600
800
1000
1200
1400
0 0,1 0,2 0,3 0,4 0,5
Loa
d(k
N)
δ (mm)
PC‐40‐200‐1.3 PC‐50‐200‐1.3
SFRC‐40‐200‐5.0 SFRC‐50‐200‐1.30
200
400
600
800
1000
1200
1400
0,0 0,1 0,2 0,3 0,4 0,5
Loa
d (k
N)
δ (mm)
PC‐40‐250‐1.7 PC‐50‐250‐1.7
SFRC‐40‐250‐4.0 SFRC‐50‐250‐1.7
0
200
400
600
800
1000
1200
1400
0,0 0,1 0,2 0,3 0,4 0,5
Load
(kN
)
δ (mm)
PC‐40‐400‐2.7 PC‐50‐400‐2.7
SFRC‐40‐400‐2.7 SFRC‐50‐400‐2.7
0
200
400
600
800
1000
1200
1400
0,0 0,1 0,2 0,3 0,4 0,5
Load
(kN
)
δ (mm)
PC‐40‐750‐5.0 PC‐50‐750‐5.0
SFRC‐40‐750‐5.0 SFRC‐50‐750‐5.0
(a) (b)
(c) (d)

9
h≈a1
0.33a1
G
α αa1
patternswereperformed. Specifically, the angleβ of the secondary cracks starting beneaththesteelplateweremeasuredinalltestedspecimens,yieldinganaveragevalueof23°withaCVof9.2%.Similarly,thedimensionsoftheconewedge(seeFigure8)formedduringthe3rdloading stage (Figure5) were alsomeasured. It was observed that the height of the conewedge(h)wasapproximatelyequaltothelengthofthesupportplate(a1).Theaveragevalueoftheangleαformedbetweentheupperfaceoftheblockandthelateralsurfaceoftheconewas63°(CV=2.2%).
Figure7.Crackpatternsobservedin:(a)aPC‐40‐750block;and(b)anSFRC‐40‐750block
Figure8.Conewedgeformedduringthelastloadingstage
4. PROPOSEDSTRUTANDTIEMODELSTOASSESSFcrandFmax
4.1. Introduction
Based on the analysis of the experimental results previously made, a strut‐and‐tiemodel(STM)wasadoptedtoassessthevalueoftheloadsFcrandFmax.Thesedependontherelationshipbetweenthetotalblockheight(hT)anditslength(a).Thus,theconcreteblocksweredividedintotwogroups:shortblocks(hT≥a)andlongblocks(hT<a).
Inshortblocks,Fcanbedistributedalongadisturbancelength,namelyh,andreachauniformlydistributedstresspattern(σ)withinthetotallengthoftheblockhT[8];therefore,thisstresspatternisalsouniformatthesupportoftheblock.Conversely,inlongblocks,thisstresspatternisnon‐uniformatthebase.
According to this classification, the blockswitha = 200 and 250mmbelong to theshort block group, and those with a = 400 and 750 mm belong to the long block group.Therefore,theproposedmodelwasdiscussedinaccordancewiththesetwogroups.
β=20°
(a)
β=27°β=23°
(b)

10
θ2hT3
F/2
h/2
h/2
σ (uniform)
a/4
F/2
a
T
F/2
k1a1
a1/4
a)
S
S
b)
4.2. CrackingLoadFcr
4.2.1. ShortblockshTa
In the shortblock series, the STM depicted inFigure9a was used. This consists ofcompressionmembers(i.e.,struts)andtensionmembers(i.e., ties),whichweredepictedbydashed and solid line, respectively. Considering the symmetry of the problem, F can bedecomposedintoloadsF/2actingatadistancea1/4fromtheverticalsymmetryaxis.
Undertheloadingarea,aconfinedzonewasassumedtoexistwherethecompressivestresses are uniform and constant;k1a1 was assumed to be the depth of this zone. Thek1coefficient can be defined based on experimental results or in accordance with existingregulations. Additionally,h,which is also called the fictitiousheight or disturbance length,represents the required depth that guarantees a uniform distribution of stresses; h ≈ aaccordingtoSaint–Venant.
Figure9.(a)ProposedSTMforshortblocks;and(b)thedeterminationofh
The equilibrium equation resulting from the lattice system presented in Figure9aresultsinEq.(1)thatpermitsthecalculationofT.
4 2
1
Assumingaparabolicdistributionofthetensilestressesactingperpendicularlyalongtheverticalaxisandestablishingtheproperboundaryconditions,themaximumtensilestressσct,max=3T/2Acanbederived[44]withA=b(h‐k1a1)beingtheareasubjectedtothisstresspattern.Thus,fromEq.(1)andσct,max,Eq.(2)canbeobtained.
,3
2 2 2
ThecrackingloadFcrcanbecalculatedbycombiningEqs.(1)and(2)andlettingthatσctmax=fct,obtainingEq.(3).
h =0,88a -0,10a ln(a1/a)R² = 0,63
0,0
0,2
0,4
0,6
0,8
1,0
1,2
1,4
0,0 0,2 0,4 0,6 0,8 1,0
hexp
/a
a1/a
Back-graníticaBack-areniscaSahoo y otrosMörschLog. (tendencia)

11
8 2
3 3
Forthisresearchproject,k1=0.33wasadoptedbecausetheparametricstudyof[45]showed that this value is themost representative the triaxial compressive state generatedbelowtheloadingplate.Afunctionh=f(a,a1)hasalsobeencalibratedfromtheexperimentalresultspresented in [8,46‐47] (Figure9b). In these studies,different concreteblockswithvarying dimensions, concrete strengths and load typeswere investigated. The values ofFcrobtainedintheseexperimentsinconjunctionwithEq.(3)havebeenusedtocalibrateEq.(4).
0.88 0.10 4
Eq. (4) is consistent because fora1≈ 0 (i.e., a point load), thedisturbance length isinfinitewhilefora1≈a,andtheratioh/atendsto0.88.Saint–Venantalsoproposedh/a≈1independentlyoftheloadedarearatio.
4.2.2. Longblocks(hT<a)
Forlongblocks,accordingtotheSaint‐Venantprinciple,thestresspatternatthebaseoftheblockisnon‐uniform(seeFigure10)becauseh>hT.Additionally,ithasbeenobservedexperimentallythatthemechanismcanberepresentedbytwoblocks:(1)anactiveblockwitha lengtha3compressedwithinthetwocracksinclinedatanangleβ, which isresponsiblethetransmissionoftheexternal loadF transmission;and(2)twolateralblocksthatconfinetheinternalactiveblocklaterallyandcontributetothetransferoftheshearstresseseitherbytheaggregateinterlockmechanismsorbytheactionofthefibres.
Figure10.ProposedSTMforlongblocks
The model proposed assumes that the maximum pressure q1 is reached at theintersectionofthebasewiththeverticalsymmetryaxis.Thispressuredecreaselinearlytoq1
θ
hT
T
F/2
h/2a1/4
q1
a2
F/2
Semi‐activeblockboundary
q2 h/2
qa=F/a3b(uniform)
F/2
k1a1
a/2
a3/2
T
F/2
q2
qa1=F/a1b

12
attheedgeoftheactiveblock.Thisstressdistributionresults inbothF/2forces,whicharelocated close to the vertical axis; consequently, the internal equilibrium forces reduce itsmagnitudetoTwithrespecttothoseforcesobtainedinshortblocks.
Additional hypotheses should be established to determine the magnitude of T: (1)thereisafictitiousheighth>hTinwhichthestressqa=F/a3bisuniformlydistributed;and(2)thesupportpressuresq1andq2varybetweenqa1=F/a1bandqa.Assumingthesehypotheses,Eqs.(5)and(6)canbederivedtoassessq1andq2,respectively.
1 5
6
Toobtainq2 <0 inEq. (6), the stressdistribution canbe assumed tobe triangular;thus, thepressuresbecomeq2=0andq1=2F/a3b anda2 =a3/6.Furthermore,byapplyinggeometricalconsiderations,therestrictionexpressedbyEq.(7)canbeestablished.
2 7
Byimposingtheresultingforcefromthenon‐uniformpressurepatternequaltoF/2,Eq.(8)canbeobtained.Thisallowsthecalculationofa2.
6
2 8
FollowingthesamecriteriaestablishedtoderiveEqs.(1‐3)forshortblocks,Eq.(9)canbededucedtoobtainthevalueofFcrforlongblocks.
8 2
3 4 9
UsingtheexperimentalvaluesofFcrforlongblocksin[2],thecalibratedEq.(10)canbeusedtoassessthevalueofh.
0.71 0.22 10
4.3. MaximumloadFmax
It has been observed experimentally that the blocks were divided into two mainsections after cracking (Figure 11). This causes a drastic change in the internal stressdistribution that is difficult to assess analytically. In such a situation, the two parts aresubjectedtoloadswithaneccentricityk2a,whichleadstoaflexural‐compressionstateineachindependentpart.

13
Figure11.Theoreticalschemeofthefissureformedduringtheblocktest
By imposing the classical formula of mechanics of the materials, the maximumcompressivestressσcc,maxactingatthecentralpartoftheblockcanbeassessed(Eq.(11)).
,2⁄
2⁄2⁄ 4⁄ 2⁄
2⁄ 12⁄ 44 6 11
Assuming that the failure of the block is reached when the maximum compressivestress equals thecompressive strengthof theconcrete (σcc,max= fc), thevalueofFmaxcanbederivedfromEq.(11)obtainingEq.(12).
4 6
12
Itshouldbehighlighted thatFmaxdependson thegeometricvariables(b,a1anda3),the concretecompressive strength fc and theeccentricity factork2 of the load in the failureregime.Itisalsoimportanttonotethatthecontributionofthefibresisnottakenintoaccountin the failurestatebecauseof theirminimal impact,as shown inTable4bycomparing thevaluesofFmax forPCandSFRCblocks.With largeramountsof fibres, the failuremechanismmight change, and the contribution of the fibres should be considered in the analysis;otherwise, the value of Fmax assessed would be underestimated. Additionally, the precastsegmentsaredesignedsothatthecrackingisnotallowedduringtheplacingoperations.
In Eq. (12), a3 can be determined by Eq. (7); k2 should be derived from Eq. (13)(Figure12),whichhasbeencalibratedwiththeexperimentalvaluesofFmaxpresentedin[8]andconsideringEq.(12):
.
13
Eq.(13)isshowntobeconsistentwiththephysicalphenomena:forapointload(a1≈0),theratioa1/a3≈0,andconsequently,k2≈1.0,meaningthattheloadF/2isappliedattheinternaledgeoftheplateinthefailureregime.Contrarily,ifa1=a3(a1/a3=1.0),thenk2tendstowards0.5,andtherefore,F/2isappliedatadistancea1/4fromtheverticalaxisoftheblock,whichcoincideswiththecentralpointofthesymmetryaxisoftheloadingsemi‐plate.
σmáx
a/2
k1a1/2Fmax/2
hT
F/2 k2a F/2
a/2
a3
Ⅰ
a1/2a1/2
Ⅱ
σmax
Active blockboundary

14
k2 =e‐0,7(a1/a3)
(R2=0,96)
0,0
0,2
0,4
0,6
0,8
1,0
0,0 0,2 0,4 0,6 0,8 1,0
k 2
a1 /a3
Figure12.Valuesofk2derivedfromtheexperimentalvaluesofFmaxpresentedin[2]
4.4. ComparingtheexperimentalandtheoreticalvaluesofFcrandFmax
Tables5and6presentboththeexperimentalresultsandthetheoreticalvaluesofFcrandFmaxestimatedusingEqs.(3)and(9)forFcrandEq.(12)forFmax.
Table5.ComparisonbetweentheoreticalandexperimentalaveragevaluesforFcr(relativeerrorin%)
Specimen Exp. Th. Specimen Exp. Th.
PC‐40‐200‐1.3 407 379(6.9) PC‐50‐200‐1.3 417 358(14.1)PC‐40‐250‐1.7 409 425(‐3.9) PC‐50‐250‐1.7 434 401(7.6)PC‐40‐400‐2.7 633 725(‐14.5) PC‐50‐400‐2.7 ‐ ‐PC‐40‐750‐5.0 744 750(‐0.8) PC‐50‐750‐5.0 ‐ ‐SFRC‐40‐200‐5.0 406 340(16.3) SFRC‐50‐200‐1.3 429 378(11.9)
SFRC‐40‐250‐4.0 374 441(‐17.9) SFRC‐50‐250‐1.7 527 424(19.5)
SFRC‐40‐400‐2.7 631 668(‐5.9) SFRC‐50‐400‐2.7 641 724(‐12.9)
SFRC‐40‐750‐5.0 660 691(‐4.7) SFRC‐50‐750‐5.0 715 748(‐4.6)
Table6.ComparisonbetweentheoreticalandaverageexperimentalvaluesforFmax(relativeerrorin%)
Specimen Exp. Th. Specimen Exp. Th.
PC‐40‐200‐1.3 1044 980(6.1) PC‐50‐200‐1.3 1137 1195(5.1)
PC‐40‐250‐1.7 1029 1003(2.5) PC‐50‐250‐1.7 1138 1223(7.5)PC‐40‐400‐2.7 1244 1156(7.1) PC‐50‐400‐2.7 ‐ ‐
PC‐40‐750‐5.0 1340 1162(13.3) PC‐50‐750‐5.0 ‐ ‐SFRC‐40‐200‐5.0 553 431(22.1) SFRC‐50‐200‐1.3 1200 1161(3.3)
SFRC‐40‐250‐4.0 553 500(9.6) SFRC‐50‐250‐1.7 1225 1187(3.1)
SFRC‐40‐400‐2.7 1278 1041(18.5) SFRC‐50‐400‐2.7 1468 1368(6.8)
SFRC‐40‐750‐5.0 1330 1047(21.3) SFRC‐50‐750‐5.0 1532 1375(10.2)
Theresultspresented intheTable5highlight thesuitabilityof theanalyticalmodel
proposed to assess Fcr of both short and long blocks. The STM leads to a maximumunderestimationforFcrof16.3%(SFRC‐40‐200‐5.0)withrespecttotheexperimentalvalue;conversely, maximum overestimation of ‐17.9% (SFRC‐40‐250‐4.0) is also calculated. The

15
absoluteaveragerelativeerrorofFcrwascalculatedtobe10.1%.Consideringtheseresults,itcan be assumed that these are satisfactory in terms of design because, although there is acertain deviation of the proposed model, these errors are limited and lower than thoseinherenterrorsacceptedforthematerials’strengths.DespitebeinganSLS,safetyfactorsforFcrappliedduringthedesignprocedureusuallyexceed1.5.
It can be confirmed from the results of Table 6 that the agreement between theexperimentalandtheoreticresultsofobtainedwiththeproposedSTMareevenbetterwithrespecttothoseofFcr.Themaximumandminimumrelativeerrorsare22.1%(SFRC‐40‐200‐5.0)and2.5%(PC‐40‐250‐1.7),respectively,andtheaverage is9.8%.Therefore, taking intoaccounttheaforementionedforFcr,theseresultsalsohighlightthesuitabilityoftheanalyticalmodeltoassessthevalueofFmax.TheassessmentofloadisthusnotrelevanttothecalculationofFcrinthedesignofprecastconcretesegments.
5. APPLICATIONTOLINE9INBARCELONA
Because the formulations that estimate the cracking and ultimate loads have beenproposed,anapplicationisnowconsideredregardingthesegmentedlininginMetroLine9inBarcelona.ThetunnelisconstructedwithanEPBTBMthatexcavatesanexternaldiameterof11890mm.Thereinforcedconcretering installedhasan internaldiameterof10900mm,athicknessof350mmandanaveragewidthof1800mm.AsshowninFigure13,theTBMiscomposedby7segmentsandakey.Theratiobetweenthethicknessandthediameteroftheringisapproximately31,whereasmosttunnelshavethesameparameterbetween20and25.ThehighslendernessoftheringfromtheMetroLine9inBarcelonaincomparisonwithothertunnelsmayleadtotheapplicationofhigherstresslevelstothesegment.Togetherwiththepossibleeccentricityofthejacks,thismightincreasetheriskofburstingcracks.
Figure13.Detailofring(a),front(b)andtopview(c)ofloadapplicationinthesegment
During the construction process, the load required to generate enough pressure toexcavatethefrontfaceandtoadvancetheTBMisgeneratedby15pairsofthrustjacks.Eachpairtransmitstheforcestoa20mmthicksteelplate,knownasapad.Thepadstransmitthisforcetotherecentlyinstalledringthatactslikeareactionframe.SegmentsA1,A2,A3,A4,A5,BandCreceivetheloadfromtwopads,whereasthekeysegmentreceivestheloadfromonlyone pad. Figures13b and13c depict a front view and a top view of the load application
(b)(a) Maximum width
Distances in mm
(c)

16
points.Notice that adesigneccentricityof79mmtowards thecentreof thering is already
considered in the project (Figure13c). Such eccentricity is intentionally used to generatecompressive forces in the longitudinal joints, thus reducing the risk of collapse when thesegmentsarestillinsidetheTBM,andonlyasmallcompressionexists.Themagnitudeoftheloadappliedbythethrustjacksduringtheconstructionprocesswilldependonthepropertiesofthegroundexcavated,thepositionofthesegmentinsidethering,andthecurvatureofthestretch,amongotherfactors.In[47],thereisanextensivestudyofthevariabilityoftheforcesappliedinLine9inBarcelona.Theresultssuggestthattheaverageloadduringconstructionis2600kN/pad.However,in[48],themaximumloadisfoundtobeapproximately4660kN/pad.Thelatteristakenasareferenceforthecalculationsperformedhere.
Dependingonthemagnitudeoftheloadandthesupportconditionsofthesegments,different typesof damage couldoccur in the segmentsduring construction.Accordingwiththe study performed by the Japanese Society of Civil Engineers,most damage is associatedwith the handling of the segments and with the application of the thrust forces when thesegmentsareleavingtheshield[49].Althoughnotthemostfrequenttype,oneofthepossibletypesofdamagethatmightoccurinthislastsituationisdepictedinFigure14.
Figure14showsonlyhalfofthetopviewofthesegmentfromLine9inBarcelonawithacrackparalleltothewidththatstartsclosertothepointofapplicationoftheloadfromthethrust jacks. Themechanism of crack formation in this case is similar to that described inSections3and4ofthisstudy.Duetothedimensionsofthesegmentandthereducedareaofthepads,thesegmentbehaveslikeablocksubjectedtoconcentratedloads.Infact,theseloadsproducetensilestressesthatmightcrackandevenproduceafailureofthesegments.Noticethatevenifthesupportprovidedbythepreviousringinstalledwasperfect,failuremightstilltakeplace.
The formulation developed here might be used to predict the safety factor (SF) inservice and in ultimate limit states related with this type of damage. To perform thisestimationfollowingtheprojectspecifications,itisassumedthatasegmentshouldnotcrackin service. Additionally, the characteristic compressive (fc) and tensile (fct) strengths ofconcreteare50N/mm2and2.7N/mm2, respectively.Theheightof the segmenthT is1800mm, the length of the load application a1 equals that of the pad (i.e., 1300 mm), theeccentricityofforcesa2 is574mm,thelengthofthesegment(a)consideringthesymmetryaxisis2356mm,thecoefficientk1thatdeterminesthelengthoftheconfinedzoneis0.3andthedepthbelowwhichinternalstressesbecomeuniform(h)is1981mm.
BecausehTissmallerthana,Eq.(9)isusedtoestimateacrackingloadFcrof7161kN.Conversely,Eq.(12)isusedtoassessthemaximumloadFmax,whichis23559kN.TheSFinaservice‐limitstate(SLS)isobtainedbydividingFcrbythemaximumloadperpad.ThisgivesanSFof1.54.Thesameisperformedfortheultimatelimitstate(ULS)usingFmax.Asaresult,anSFof5.06isobtained.

17
Figure14.SymmetrictopviewofasegmentfromLine9inBarcelonawithacrack
Following [50], an SFof2.0 is recommended toavoid theuseofany reinforcement.AlthoughsmallervaluesareobtainedinSLS,itisimportanttoconsiderthatthetypicalSFinserviceisassumedtobe1.0andthatmorethanenoughsafetymarginremainsregardingtheULS.Itisalsonecessarytoconsiderthatthemaximumloadfromthethrustjackswereusedinthecalculationandthatalowriskofcollapseisassociatedwiththistypeofcrackingoncethering leaves the shield. Based on these considerations, it is possible justify that noreinforcement isrequired;however,acombinationofreinforcingbarsandsteel fibreswereusedintheseprecastsegmentsduetotherelativelyhighbendingmomentsexpectedinsomelengthsofthetunnel.
AnextensiveexperimentalprogramwasperformedintheMetroLine9inBarcelonatoevaluatethepossibilityofreplacingthetraditionalreinforcedconcretesegmentbyafibre‐reinforced concrete equivalent [47]. During the experimental program, 30 rings reinforcedsolelywith steel fibreswere installed ina curvedstretch.The inspectionof these segmentsshowedthatnolongitudinalcracksoccurredduetoburstingstresses.Thisisconsistentwiththeresultsobtainedthroughtheapplicationoftheanalyticalmodel.
6. Conclusions
Anexperimental investigationwasperformed to study themechanical behaviour ofconcreteblockswithdifferentdimensionswithandwithoutsteel fibresunderconcentratedloads. Through the study, three simplified analytical formulations based on STM wereproposed.Tofullyunderstandtheproposedmodel,acasestudyatMetroLine9inBarcelonawasdiscussed.
Themainconclusionsofthisstudyaredescribedbelow:
Asasimpleandaccuratemethodforstructuralanalysis,thestrut‐and‐tiemodelshowsa reliableability toanalyse concentrated loadsonconcreteblocks.Thedepthof theconfinedareaoftheblockssignificantlyaffectstheformoftheproposedformulationstopredictthemechanicalbehaviouroftheconcreteblocks.
a1=1300
hT=1800mm
a=2356mm
TT
F/2 F/2
F/2 F/2
k1a

18
Inblockswithgreater lengththanheight,onlyaportionof theblocks isresponsiblefor transmitting the applied loads. The area that effectively contributes to thetransmissionofstressisdefinedbyanangleequalto23°,accordingtoexperimentalresults.
From the comparisons of theoretical and experimental values ofFfis andFrup, it hasbeenverifiedthattheformulationsproposedcouldpredictthemechanicalbehaviouroftheblocksintheexperimentalstudy.
Duetoitssimplicityandaccuracy,theformulationsdevelopedinthisworkcouldserveas a basis for predicting the mechanical behaviour of concrete blocks subjected toconcentratedloads.
TheapplicationoftheformulationsdevelopedforLine9inBarcelonaindicatesthatasafetyfactorof1.51and5.06existintheSLSandtheULS,respectively.Theseresultssuggestthatnospecificreinforcementshouldbeplacedtoresistthetensileforcesthatariseduetotheconcentratedloadsappliedbythethrustjackpads.
Acknowledgements
The authorswant to thank theMinistryof Science and Innovation for the economicsupportreceivedthroughResearchProjectBIA2010‐17478:Constructionprocessesbymeansof fibre reinforced concretes. The first author would like to acknowledge the scholarshipreceivedfromtheChinaScholarshipCouncil.
References
1. Waal,R.G.A.de.1999.“Steelfibrereinforcedtunnelsegments”,Delft,ISBN90‐407‐1965‐9,DelftUniversityofTechnology.
2. Cavalaro, S H P, Blom, C BM,Walraven, J C, Aguado, A.. Structural analysis of contactdeficiencies in segmented lining. Tunnelling andUnderground SpaceTechnology2011.26(6):734‐749
3. Cavalaro, S H P, Blom, C B M, Aguado, A, Walraven, J C. New Design Method for theProductionTolerancesofConcreteTunnelSegments.
4. Cavalaro, S H P, Blom, C B M, Walraven, J C, Aguado, A. Formation and accumulation of contact deficiencies in a tunnel segmented lining. Applied Mathematical Modelling 2012. 36 (9):4422‐4438
5. Walraven, J., 2009.Highperformance fibre reinforced concrete: progress in knowledgeanddesigncodes.RILEMMaterialsStructures42(9),1247‐1260.
6. delaFuente,A.,Pujadas,P.,Blanco,A.,Aguado,A.,2011.Experiences inBarcelonawiththeuseoffibresinsegmentallinings.TunnelingandUndergroundSpaceTechnology27(2012)60–71.
7. Ritter,W. (1899).DieBauweiseHennebique (ConstructionTechniquesofHennebique).SchweizerischeBauseitung.Zurich,February.

19
8. Mörsch, Emil (1902). Der Eisenbetonbau, seine Theorie und Anwendung (ReinforcedConcrete,TheoryandApllication).Stuggart.Germany.
9. Leonhardt,F. (1965).ÜberdieKunstdesBewehrensvonStahlbetontragwerken.Beton‐undStahlbetonbau60,H.8,pp.181;H.9,pp.212.
10. Iyengar, K.T.S.R.; Yogananda, C.V. (1966). A three dimensional stress distributionproblem in the end zones of pre‐stressed beams. Magazine of Concrete Research, 18,75.84.
11. Kooiman,A.G.,2000.Modellingsteelfibrereinforcedconcreteforstructuraldesign.Ph.D.thesis,DelftUniversityofTechnology.
12. Blom C.B.M. 2002. “Design philosophy of concrete linings in soft soils”, ISBN 90‐407‐2366‐4,DelftUniversityofTechnology.
13. HemmyO.2001.BriteEuramProgramonSteelFibreConcrete,Subtask:SplittingofSFRCinducedbylocalforces,“Investigationoftunnelsegmentswithoutcurvature”,UniversityofBraunschweig(Germany).
14. Schnüntger g., Erdem E. 2001. Brite Euram Program on Steel Fibre Concrete, Subtask:SplittingofSFRCinducedbylocalforces,Ruhr‐University,Bochum(Germany).
15. Gettu, R., Barragán, B., García, T., Ramos, G., Fernández, C., and Oliver, R., 2004. “SteelFiberReinforcedConcretefortheBarcelonaMetroLine9TunnelLining.”InBEFIB2004,Procofthe6thRILEMSymposiumonFRC,Varenna(Italy),September20‐22,RILEMPRO39,pp.141‐156.
16. Sorelli L., Toutlemonde F. On the design of steel fiber reinforced concrete tunnel liningsegments. 11th International Conference on Fracture, Turin (Italy), March 20‐25, 2005.ExtendedAbstract
17. de Rivaz B. 2008. Steel fibre reinforced concrete (SFRC): The use of SFRC in precastsegment for tunnel lining. In: World Tunnel Congress ITA‐AITES 2008, Agra, India,September22–24,pp.2007–2017.
18. PohnJ.,TanKH,PetersonGL.,WenD:Structuraltestingofsteelfibrereinforcedconcrete(SFRC)tunnelliningsegmentsinSingapore,WTC2009,Budapest,Hungary
19. Caratelli, A., Meda, A., Rinaldi, Z., Romualdi, P. Structural behaviour of precast tunnelsegments in fiber reinforced concrete. Tunnelling and Underground Space Technology2011,26(2):284–291
20. Caratelli,A.,Meda,A.,Rinaldi,Z.DesignaccordingtoMC2010offibre‐reinforcedconcretetunnelinMonteLirio,Panama.StructuralConcrete2012,13(3):166‐173
21. HilarM., Vítek P. Experimental loading tests of steel fibre reinforced and traditionallyreinforced precast concrete segments for tunnel linings. Tunnelling and UndergroundSpaceTechnology2012.21(4):54‐65.

20
22. Beno J.,HilarM.Steelfibrereinforcedconcretefortunnellining–verificationbyextensivelaboratorytestingandnumericalmodelling.ActaPolytechnia53(4):329‐337,2013.
23. BreitenbücherR.,MeschkeG.,SongF.,HofmanM.,ZhanY.Experimentalandnumericalstudyon the load‐bearingbehaviorofsteel fiber reinforcedconcrete forprecast tunnellining segments under concentrated loads. FRC 2014 Joint ACI‐fib InternationalWorkshop. FibreReinforcedConcreteApplications. 24‐25 July 2014,Montreal, Canada.pp.417‐429.
24. Abbas S., Soliman A., Nehdi M. Structural behaviour of ultra‐high performance fibrereinforced concrete tunnel lining segments. FRC 2014 Joint ACI‐fib InternationalWorkshop. FibreReinforcedConcreteApplications. 24‐25 July 2014,Montreal, Canada.pp.532‐543.
25. ABAQUS/STANDARD,User'sManual,Hibbitt,Karlsson&Sorensen,Inc.,Pawtucket.1995
26. AnsysRev.5.5,UserManual,SwansonAnalysisSystems,Houston
27. Cervenka V., Jendele L., Cervenka J. ATENA Program documentation. Prague, CzeckRepublic,2013.CervenkaConsultings.r.o.
28. MarcUser’sGuide,U.S.A,2008.
29. Burgers, R.,Walraven, J.C., Plizzari, G.A., Tiberti G., 2007. Structural Behaviour of SFRCTunnel Segments during TBM Operations. Underground Space the 4th Dimension ofMetropolises: Proceedings of the World Tunnel Congress 2007 and 33rd ITA/AITESAnnualGeneralAssembly,London,England,pp.1461–1467.
30. TibertiG.,PlizzariG.StructuralbehaviourofprecasttunnelsegmentsunderTBMthrustactions.WorldTunnellingCongress:TunnelsforaBetterLife(WTC2014),9–15ofMay2014,FozdoIguaçu,Brazil.ISBN978‐85‐67950‐00‐6.TextinCDofProceedings.
31. Ramirez,J.A.,andBreen,J.E.,1991,“EvaluationofaModifiedTruss‐ModelApproachforBeamsinShear,”ACIStructuralJournal,V.88,No.5,Sept.‐Oct.,pp.562–571.
32. Reineck, K.‐H., 1982, “Models for the Design of Reinforced and Prestressed ConcreteMembers,”CEBBulletin146,Paris,pp.43‐96.
33. ACI‐ASCE Committee 445, 2000, Recent Approaches to Shear Design of StructuralConcrete,pp.445R,38‐47.
34. Toutlemonde, F., 'Analyse des résultats des essais de voussoirs de tunnel par desméthodesdedimensionnementapprochées'.2000,NationalProjectBEFIM,report,LCPC.
35. Toutlemonde F., Quiertant M., Dubroca S. Justification du reinforcement des voussoirsprefabriques de tunnels: Expérimentations sur voissoirs en béton armé et béton defibres.Tunnelsetouvragessouterrains,n.162,Nov/Dec2000.
36. Haring, F.P., Stresses in assemblyphase and serviceability phase in the lining of shielddriventunnels‐DelftUniversityofTechnology,TheNetherlands,2002.
21
37. Groeneweg TW. Shield driven in ultra‐high strength concrete: reduction of the tunnelliningthickness.MinorThesis,DelftUniversityofTechnology.2007.
38. Bakhshi M., Nasri V. Developments in design for fiber reinforced concrete tunnelsegments. FRC 2014 Joint ACI‐fib International Workshop. Fibre Reinforced ConcreteApplications.24‐25July2014,Montreal,Canada.pp.441‐452.
39. UNE‐EN12390‐3 (2011). Testing hardened concrete ‐ Part 3: Compressive strength oftest specimens. Compression test. Spanish Association for Standardization andCertification,AENOR.
40. UNE‐EN12390‐6(2010).Testinghardenedconcrete‐Part6:Tensilesplittingstrengthoftestspecimens.Braziliantest.SpanishAssociationforStandardizationandCertification,AENOR.
41. UNE 83515 (2010). Fibre reinforced concrete. Determination of cracking strength,ductility and residual tensile strength. Barcelona test. Spanish Association forStandardizationandCertification,AENOR.
42. .PujadasP.,BlancoA.,CavalaroSHP.,delaFuenteA.,AguadoA.Multidirectionaldoublepunchtestto assess thepost – crackingbehaviour and fibreorientationofFRC. Construction andBuildingmaterials2014;58:214‐224.
43. A.Blanco,P. Pujadas, S.H.P. Cavalaro,A. de laFuente yA.Aguado, “Constitutivemodel for fibrereinforcedconcretebasedontheBarcelonatest”,CementandConcreteComposites2014;54:327‐340.
44. GarcíaM. (2012). Experimental program on concrete blocks subjected to concentratedloads.M.Sc.Thesis,PolytechnicUniversityofCatalonia(UPCBarcelonaTECH),Barcelona(Spain).[InSpanish].
45. Bach, Carl (1903). Zeitschrift des Vereins Deutscher Ingenieure (Tests with granitearticulations and Sandstone. Mitteilungen über Forschunsarbeiten. Publicados por laAsociacióndeIngenierosAlemanes.
46. Sahoo,D.K.;Singh,B.;Bhargava,P.(2011).Minimumreinforcementforpreventingfailureinbottle‐shapedstruts.ACIStructuralJournal,v.108,nº2,pp.206‐216.
47. Infante, R.M. (2006). Evaluación de las Necesidades de Refuerzo de Armadura de lasDovelasPrefabricadasdelSostenimientodelaLínea9delMetrodeBarcelonaSometidasal Empuje de la Tuneladora. Minor Thesis, Polytechnical University of Catalonia (UPCBarcelonaTECH),126p.
48. Cavalaro,S.H.P.,Aguado,A.(2012).Packerbehaviorundersimpleandcoupledstresses.TunnellingandUndergroundSpaceTechnology,Volume28,Pages159‐173
49. Sugimoto, M. (2006). “Causes of shield segment damages during construction”.InternationalSymposiumonUndergroundExcavationandTunnelling.Bangkok,Thailand.

22
50. MösrchE.(1952).TeoríayPrácticadelHormigónArmado.Ed.G.GiliS.A.,BuenosAires.448p.

23
ANNEXA.TableswiththeparametersinvolvedintheSTMproposedmodels
TableA.1.ValuesoftheparametersinvolvedintheassessmentofFcraccordingtotheSTMproposed
Specimen k1[]
a(mm)
a1(mm)
a2(mm)
a3(mm)
q1(N/mm2)
q2(N/mm2)
b(mm)
hT(mm)
h(mm)
fct(N/mm2)
Fcr(kN)
PC‐40‐200‐1.3
0.33
200
150
‐ ‐ ‐ ‐
150 300
182
4,33
379PC‐40‐250‐1.7 250 ‐ ‐ ‐ ‐ 233 425PC‐40‐400‐2.7 400 89 400 15.92 8.27 370 725PC‐40‐750‐5.0 750 90 405 16.57 8.12 376 750
PC‐50‐200‐1.3
0.33
200
150
‐ ‐ ‐ ‐
150 300
182
4,09
358
PC‐50‐250‐1.7 250 ‐ ‐ ‐ ‐ 233 401
PC‐50‐400‐2.7 400 89 400 15.04 7.81 370 685
PC‐50‐750‐5.0 750 90 405 15.65 7.67 376 708
SFRC‐40‐200‐5.0
0.33
20050
‐ ‐ ‐ ‐
150 300
204
3,99
340
SFRC‐40‐250‐4.0 250 ‐ ‐ ‐ ‐ 260 441
SFRC‐40‐400‐2.7 400150
89 400 14.67 7.62 370 668
SFRC‐40‐750‐5.0 750 90 405 15.27 7.49 376 691
SFRC‐50‐20‐5.0
0.33
200
150
‐ ‐ ‐ ‐
150 300
182
4,32
378
SFRC‐50‐25‐4.0 250 ‐ ‐ ‐ ‐ 233 424
SFRC‐50‐40‐2.7 400 89 400 15.88 8.25 370 724
SFRC‐50‐75‐5.0 750 90 405 16.53 8.11 376 748
TableA.2.ValuesoftheparametersinvolvedintheassessmentofFmaxaccordingtotheSTMproposed
Specimenk2[]
a(mm)
a1(mm)
a3(mm)
b(mm)
hT(mm)
fc(mm)
Fmax(kN)
PC‐40‐200‐1.3 0.59 200
150
200
150 300 43.7
980
PC‐40‐250‐1.7 0.66 250 250 1003
PC‐40‐400‐2.7 0.77 400 400 1156
PC‐40‐750‐5.0 0.77 750 405 1162
PC‐50‐200‐1.3 0.59 200
150
200
150 300 53.3
1195
PC‐50‐250‐1.7 0.66 250 250 1223
PC‐50‐400‐2.7 0.77 400 400 1409
PC‐50‐750‐5.0 0.77 750 405 1417
SFRC‐40‐200‐5.0 0.84 20050
200
150 300 39.4
431
SFRC‐40‐250‐4.0 0.87 250 250 500
SFRC‐40‐400‐2.7 0.77 400150
400 1041
SFRC‐40‐750‐5.0 0.77 750 405 1047
SFRC‐50‐200‐5.0 0.59 200
150
200
150 300 51.8
1161
SFRC‐50‐250‐4.0 0.66 250 250 1187
SFRC‐50‐400‐2.7 0.77 400 400 1368
SFRC‐50‐750‐5.0 0.77 750 405 1375