Playback delay in p2p streaming s ystems with random packet forwarding
Experimental Analysis and Characterization of
Packet Delay in UMTS Networks
Jose Manuel Cano-Garcia, Eva Gonzalez-Parada, and Eduardo Casilari
Electronic Technology Department. University of [email protected]
Abstract. This paper presents the results of a set of experiments aimingto characterize the behaviour of the IP data service over a real UMTSnetwork. According to our empirical measurements, packet losses arenot frequent, meaning that UMTS link-level retransmission mechanismsare adequate to cope with data corruption through the wireless link.However, ARQ loss recovery mechanisms produce a high variability ofthe packet delay, which can also affect the performance of the IP dataservice. By analysing actual UMTS traces, we explore the behaviour ofthe packet delay through the UMTS network, explaining the effects ofthe underlying mechanisms. Finally, we derive a simple model to imitatethe behaviour of UMTS Internet access. This model could be very usefulin simulation or emulation experiments.
1 Introduction
Third generation Universal Mobile Telecommunication Systems (UMTS) havebeen specifically designed to face up the challenges of providing high performancemobile access to the Internet. Wireless links have singular characteristics thataffect the performance of transport protocols, such as a variable bandwidth anddelay, corruption losses, asymmetry, etc. It is well known that the congestioncontrol of the Transport Control Protocol (TCP) reacts to packet losses on theassumption that they are the result of network congestion, which reduces itsperformance when this is not the case.
The last decade has witnessed a massive research effort devoted to designsolutions both to improve TCP behaviour over wireless links [1, 2], and to op-timize the protocols of cellular systems for mobile Internet access ([3, 4]). Toassure a better controllability of the scenario, these studies are often carried outby simulations. Since UMTS topology is complex, simulation studies usually fo-cus on accurately modeling the wireless interface, because it is assumed to bethe bottleneck link. However, despite of this simplification, simulation modelsinvolving all the protocols of the UMTS radio interface are still complex andcomprise a high number of parameters. Therefore, the research community ontransport protocols have become more and more interested in developing sim-ple models of the data transmission over mobile cellular networks based on thebehaviour observed in real links [5]. Experimental testing of data transport overoperative cellular networks is now possible, and several practical studies, mainly

2
focused on the evaluation of the performance of TCP over GPRS, can be foundin the literature [6, 7]. In addition, there is a solid research background on theempirical characterization and modeling of Internet (see for example [8–10] fordelay characterization). Models of wireless links and practical measurements arenot only useful for transport protocol performance evaluation, but also for theconsideration and design of new enhancements and protocols.
This paper presents an empirical evaluation and characterization of the In-ternet access over UMTS. The study is not only aimed at the evaluation ofend-to-end performance of the Internet access, but also at developing a simpleand general UMTS link model that can be used in the simulation of transportprotocols. The analysis included in this paper is mainly focused on delay varia-tion, because of the low loss rate and the negligible packet reordering that havebeen observed.
This paper is structured as follows: Section 2 provides an overview of UMTSarchitecture. The utilized testbed is presented in section 3. Section 4 discussesthe measurement results and their implications for the link characterization. Amodel for UMTS link simulation is subsequently proposed in section 5. Finally,section 6 summarizes the main conclusions.
2 UMTS Overview
UMTS is a standard for the deployment of third generation cellular networksbased on Wideband Code Division Multiple Access (WCDMA). The UMTSnetwork is divided into the Core Network (CN), the Radio Access Network(UTRAN) and the User Equipment (UE), in order to facilitate the migrationfrom 2G to 3G networks by allowing the coexistence of different access techniquesand core network technologies [11]. The User equipment (UE) is connected tothe UTRAN through the Uu radio interface, which supports both FDD andTDD mode operation, although only the FDD mode is usually used on currentlydeployed 3G networks. For both modes the same network architecture and thesame protocols are used. The radio interface protocol architecture is divided intothe physical, the data link (L2) and the network layers [12]. L2 is further dividedinto the Medium Access Control (MAC), the Radio Link Control (RLC) and thePacket Data Convergence Protocol.
In the physical layer of the Uu Interface a WCDMA multiple access schemeis used to divide the available bandwidth into physical channels on which trans-port channels information is mapped. Physical layer operation requires a tem-porization, which is set by establishing 10 ms frames. Due to block-coding andinterleaving, transport channels are clocked at multiples of this period, knownas Transmission Time Interval (TTI). Every TTI, information blocks (transportblocks, TB) are delivered by the upper protocols to the physical layer for trans-mission over the wireless link. Usually, the TTI can be 1, 2 or 4 frames, dependingon the service configuration. The size of the data that can be transferred everyTTI varies depending on the configured data rate. As we explore in the next

3
section, the TTI temporization clearly affects the end-to-end delay experiencedby IP packets transferred over UMTS.
The MAC sublayer maps logical channels onto the transport channels offeredby the physical layer, while the RLC sublayer [13] comprises all the mechanismsneeded to the fragmentation and reassembly of upper layer Data packets (ServiceData Units, SDUs) into smaller data blocks (Packet Data Units, PDUs) so thatthey can be transmitted through the radio interface by the lower layers. This sub-layer provides transparent, unacknowledged (UM) or acknowledged (AM) modedata transfer to the upper layers. For Internet data transport, RLC AM modewith in-order delivery is used. The acknowledged mode uses a sliding windowprotocol with a selective repeat mechanism to guarantee error free data trans-missions. According to this mechanism, the receiving RLC entity, under certainconditions, sends back status reports to the transmitting RLC entity, pointingout which PDUs have been correctly received and which ones are missing. Basingon this information, the transmitting RLC entity decides either the retransmis-sion of previously sent PDUs or the transmission of new ones. In order to avoidstalling, the RLC transmitting entity can also poll the peer receiving entity andrequest a status report. The RLC AM mode hides radio packet corruption fromupper layers, but at the cost of introducing packet delay variability.
3 Measurement Infrastructure
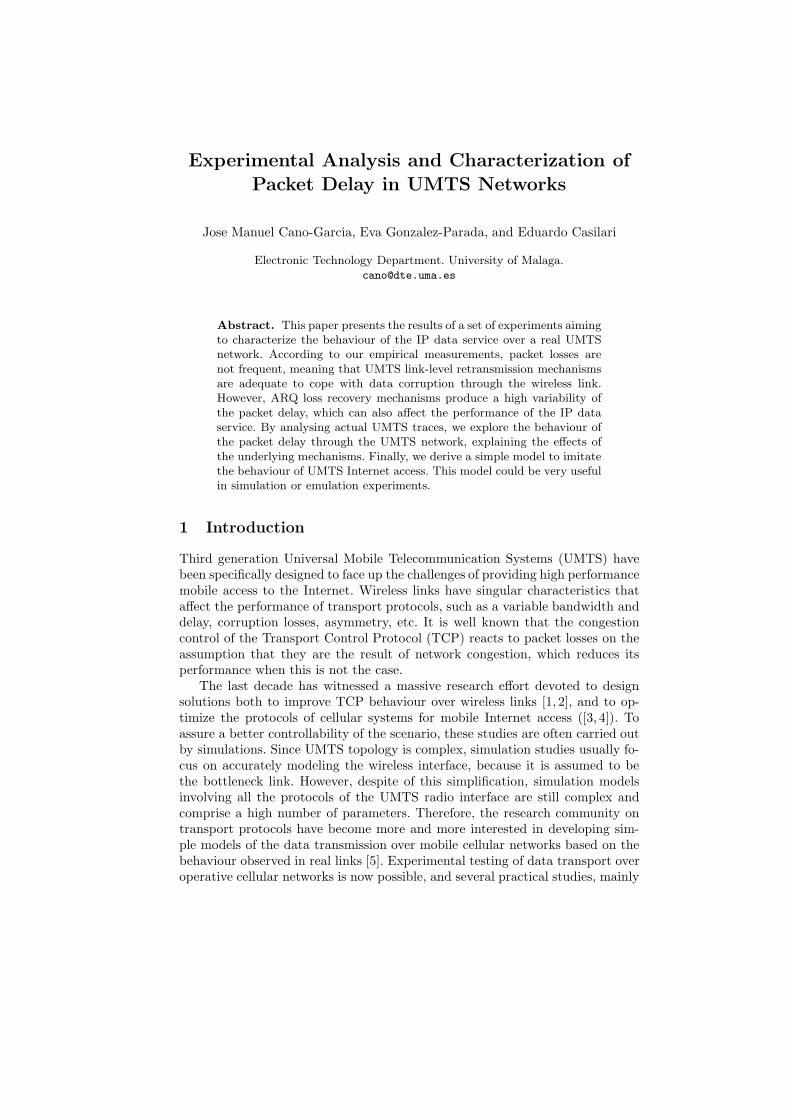
The main goal of our testbed setup is to analyse the end-to-end packet delayand losses. To carry out the characterization, we have developed a softwaretool able to periodically transmit IP probe packets through the UMTS accessto measure the delay and losses that they experience. In order to do this ina simple way, our measurement software is not divided between a transmitterside and a sender side, but it is located in a probe laptop with 2 networksinterfaces, as shown in fig. 1. This probe laptop has access to UMTS through a 3GSony Ericsson V800 handheld device connected to the laptop by mean of a USBinterface. The laptop is also equipped with an Ethernet network card connectedto our University corporate network. The UMTS Internet access provided bythe network operator sets up a dedicated channel with up to 64 kbps and 384kbps for uplink and downlink transmissions respectively, which is the QoS mostcommonly offered by current UMTS providers. By using this configuration, ourmeasurement software is capable of injecting packets in the UMTS interfaceand receiving them through the Ethernet link, and viceversa. This allows us toaccurately measure one-way packet delay and analyze the loss process for uplinkand downlink directions independently.
It should be highlighted that it is not possible to send packets through oneof the interfaces (for example the UMTS) directly addressed to the other (forexample the Ethernet link), because the network protocols of the operating sys-tem running in the laptop PC (Linux) would detect that the packet is addressedto the local machine, and, therefore, it would deliver them immediately to theupper layers instead of sending them to the network. To solve this problem,
4
Internet
CNUTRAN
UMTS
IP NAT Router
Uplink packetsProbeLaptop
CorporateNetwork
Downlink packets100Mbps Ethernet
Links
Internet
CNUTRAN
UMTS
IP NAT Router
Uplink packetsProbeLaptop
CorporateNetwork
Downlink packets100Mbps Ethernet
Links
Internet
CNUTRAN
UMTS
IP NAT Router
Uplink packetsProbeLaptop
CorporateNetwork
Downlink packets100Mbps Ethernet
Links
Fig. 1. Measurement testbet
we have used an intermediate Network Address Translation (NAT) router. TheLaptop addresses the packets to the NAT router, so they are sent through theappropriate interface by the network protocols and received by the NAT, whichis configured to alter the source and destination addresses of the received pack-ets, so they can be redirected to the probe laptop (see fig. 1). The NAT routeris simply a Linux desktop computer with two Ethernet interfaces, one attachedto our corporate network and the other directly connected to the probe laptop.Source and destination NAT is provided by the Linux kernel and configuredthrough the iptables command.
The advantage of the proposed schema over a two-side measurement strategy(i. e. using two different desktops, one connected through UMTS and otherattached to our corporate network) is that only one clock (the probe laptop clock)is employed to estimate the delay, which avoids any problem of synchronizationbetween the origin and the target nodes of the packets. It should be notedthat the additional delay produced by the NAT processing and redirection atthe intermediate router is negligible when compared to the total end-to-enddelay. The major error source of our measurement testbed, which would alsobe present if we had used a two-side measurement schema, is provoked by thepath between the GGSN and our corporate network. Packet journey throughthis path is unavoidable, since we have no direct access to the GGSN, andmay not only increase the measured packet delay, but can also generate delayfluctuations, packet losses and reordering. However, observations outlined in thenext section indicate that the these effects can also be neglected, allowing anadequate observation of different features of the packet delay process. In orderto evaluate how much the packet delay is increased in the segment between theGGSN and our network, we have used the traceroute tool to determine thenumber of hops (routers) in the path and the median round trip time (RTT) toeach router in the path. The number of hops detected is 14. The RTT betweenthe probe laptop and the first node seen, which is presumably the GGSN orother node belonging to the access provider (nodes of the core network aretransparent to the user) was estimated to be 119 ms. On the other hand, theRTT between the probe laptop and the last node (our NAT router) is 140 ms.According to the trace presented by traceroute, the 20 ms difference in roundtrip delay between these nodes are mainly spent in the Spanish Universitiesbackbone (RedIris) between Madrid and Malaga.

5
The probe laptop is also a Linux computer, in order to take advantage of thebunch of free network testing tools available, including packet sending tools likeping or hping2, packet capture tools such as tcpdump, and bandwidth estimationtools (pathchar, pathrate, pathchirp, etc.). Using available open source code,we have developed a customized tool capable of periodically sending UDP orfake-TCP packets at small intervals (up to 10ms) to characterize end to endpacket behaviour. Each transmitted packet is marked with a sequence number,and its departure time is stored in order to measure one-way delay and losses.Packet size can be configured to test its effect on end-to-end performance.
Although in this paper we have particularly focused on studying end-to-endpacket behaviour, our testbed setup is also valid to study other traffic aspectssuch as the available bandwidth or TCP performance over UMTS. Our intentionis to tackle these issues in further work, with the goal of expanding the studypresented in this paper.
4 Results and Discussion
Using the testbet setup and the software tool described in the previous sec-tion, we have accomplished several set of measurements in a commercial UMTSnetwork to study end-to-end packet behaviour. The data traces analysed in thispaper were captured in three different days of November and December 2005. Forall three data set a fixed interval of 20 ms between probe packets was configured,while the packet size was set up to 40 bytes, thus yielding a data rate of about16 kbps, which is below both the uplink and the downlink maximum data rate(64 and 384 kbps respectively). The two first data sets were acquired using fakeTCP packets, whereas the third data set corresponds to UDP data traffic. Bothtrace 2 and 3 are 10 hour long (1,800,000 packets) and were captured overnight.Trace 1 is 5 hour long and was captured in the morning. Data sets features andmeasurements in both uplink and downlink directions are summarized in table1. These data sets and the measurement software will be publicly available inour web site [14].
Downlink UplinkData Set 1 2 3 1 2 3
Mean Packet Delay (ms) 101.3 94.2 108.3 105.9 98.1 101.10Packet Delay Standard Deviation (ms) 61.17 63.2 66.5 77.4 72.9 70.3
Packet Delay Median (ms) 81.4 72.4 83.1 79.9 74.2 78.2
Number of Detected Spikes 11508 26244 29076 14043 25859 26118
Mean Spike duration(ms) 217.5 216.3 217.4 232.7 232.7 235.9Standard Deviation of spike duration(ms) 82.8 78.8 77.6 101.5 95.6 93.8
Median of spike duration (ms) 200 199.7 199.4 210 207.9 212.9
Mean Time between spikes (s) 1.56 1.37 1.19 1.28 1.4 1.3Standard Deviation of Time between spikes(s) 1.5 1.35 0.94 1.46 1.45 1.35
Median of Time between spikes (s) 1.16 1.0 1 0.76 0.82 0.88
Table 1. Dataset features and basic measured parameters

6
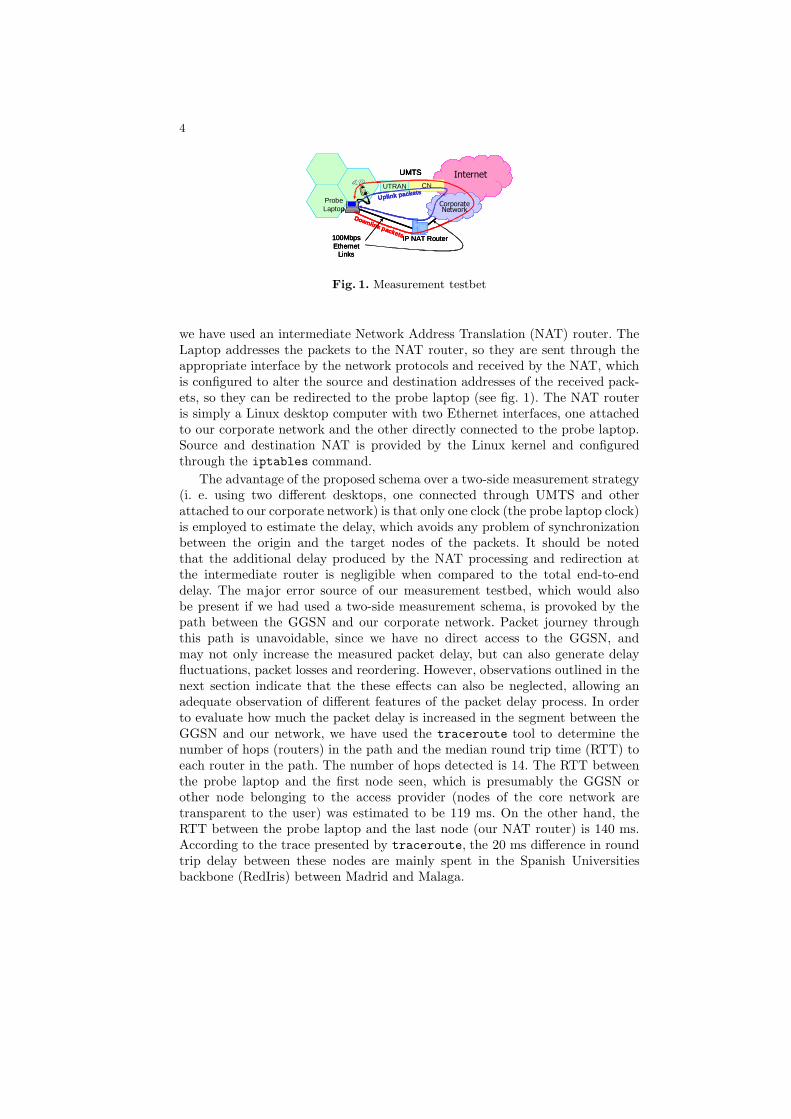
A first glance of the results can be obtained in figs. 2.a-d, where selected partsof the captured data are represented for a better view of different details. In allthe four plots, each dot represents the estimated delay of a single packet. Packetdelay is represented in the Y-axis versus the packet departure time representedin the X-axis. Figure 2.a shows a 10 minute length segment of dataset 2 (30,000packets), whereas plots b-d display shorter periods to magnify certain details.From these plots we can observe that packet delay is highly variable. Althoughan important fraction of the packets experience a delay around 80 ms, there isa significative amount of packets that exhibit a higher latency. Similar results(not included in fig. 2) are obtained for uplink. If we take a closer look (fig.2.b-c), we can appreciate that the delay variation is mainly due to the presenceof delay spikes, which are present in both uplink and downlink directions. Asit can be clearly appreciated in the figures, each packet in a spike experiencesa delay 20 ms lower than the previous one, which is precisely the periodicityof the packet emission. This suggests that the spikes are produced by the ARQmechanisms used by the RLC sublayer to assure reliable and in-order delivery.When a block is lost over the wireless link, no data is delivered by the RLC to theupper layers until the ARQ mechanism has recovered the lost frames. When theloss is recovered, all data stored in the receiver-side reconstruction buffer of theRLC are delivered in one go to the upper layers. Since a packet is sent every 20ms, each packet affected by the recovery process has spent in the reconstructionbuffer 20 ms less than the previous one, which explains the shape of the delayspike when represented in the plot.
Besides, a sawtooth pattern can be observed for packets not affected by thedelay spikes (fig. 2.d). A slow drift and a periodic hop of 20 ms can be observedfor uplink packets, whereas downlink packets follow a similar pattern, but withan amplitude of 10 ms. This pattern is a measurement artifact caused by the driftof the measurement computer timer with respect to the UMTS physical layertemporization, and should not be modelled. As explained in previous section,the physical layer takes data from the upper layer every TTI for transmissionover the wireless link. TTI is a configurable parameter, but it can be set only to1, 2 or 4 radio frames of 10 ms. Probe Packets are periodically sent through thenetwork every 20 ms. Since the network clock and the measuring computer timerare not synchronous, their frequency can be slightly different and therefore thephase difference between them may change linearly, yielding a linear variationof the delay. When the phase difference reaches a certain threshold, the datatransmission skips one idle TTI, thus producing the one-TTI ”step” or abruptchange in the sawtooth pattern. By the observation of the amplitude of these”steps” in both directions we can deduce that the TTI is set to 2 frames forthe uplink and 1 frame for the downlink, which is consistent with the defaultconfiguration suggested by [15] for background traffic over a dedicated channel.
From the measurements, we can also conclude that packet reordering is veryrare. For example, for the second trace only 20 of the almost 2 million uplinkpackets are out of order, while no reordered downlink packets were found. Infact, evidence suggests that the observed packet reordering occurs in the journey
7
0 100 200 300 400 500 6000
100
200
300
400
500
600
700
Time (s)
Dow
nlin
k pa
cket
del
ay (
ms)
0 1 2 3 4 5 650
100
150
200
250
300
350
400
450
500
550
Time (s)
Dow
nlin
k pa
cket
del
ay (
ms)
20ms
Delay Spike
0 1 2 3 4 5 650
100
150
200
250
300
350
400
Time (s)
Upl
ink
pack
et d
elay
(m
s) 20ms
Delay spike
a) Downlink packet delay b) Downlink delay (detail) c) Uplink delay (detail)
0 0.5 1 1.5 2 2.5 350
60
70
80
90
100
110
120
130
140
150
Time (s)
Upl
ink
pack
et d
elay
(m
s)
20ms
100 200 300 400 500 600 700
0
100
200
300
400
500
600
Time (s)
Diff
eren
ce o
f upl
ink
pack
et d
elay
s (m
s)
100 200 300 400 500 600 700
0
100
200
300
400
500
600
Time (s)
Diff
eren
ce o
f dow
nlin
k pa
cket
del
ays
(ms)
d) Uplink delay (detail) e) Uplink delay difference f) Downlink delay difference
Fig. 2. Delay plots for uplink and downlink directions
through the Internet, and not in the UMTS segment. As previously commented,RLC ARQ mechanisms can deliver to upper layers several consecutive packets inone go when a lost PDU is recovered. When this burst of packets has to traversethe Internet, which is the case of the uplink transmission, they are prone tobe reordered under certain circumstances. With regard to packet loss, we canconclude that UMTS ARQ mechanisms are quite efficient, since the percentageof lost packets is lower than 0.5%. Given these facts, and considering that abouta 15 % of the packets are affected by delay spikes in all the presented data sets,we have decided to focus the study on the characterization of this phenomenonrather than on packet loss.
A plausible solution to model packet delay behaviour is to characterize thespike arrival process (i. e., the length of loss-free periods) and the spike duration(i.e., the time required to recover from a transmission loss). In order to charac-terize both parameters, we can compute the difference of the delay of consecutivepackets (i.e. diff(d[n]) = d[n + 1] − d[n], where d[n] is the delay of the n − thpacket) and set up a threshold to discriminate between the delay increments cor-responding to a spike and those produced by other causes. Figs. 2.e-f show thisdifference for a subset of consecutive uplink and downlink packets from one ofthe datasets. Figure 2.e (uplink) reveals that packets not affected by delay spikesare usually clustered around 0 ms, except for the packets suffering a 20 ms delayincrement provoked by the sawtooth pattern, which are clustered around 20 ms.Packets affected by delay spikes are clustered at -20 ms, with the exception ofthe first packet of each spike, which are the dots with bigger positive values. Itshould be noted that these values are a good estimate of the spike duration (i.e.the time needed by the RLC mechanisms to recover from a loss). These points
8
can be easily discriminated from the others by setting a reasonable threshold ,since in both figures a dot-free area exists between 20 and 120 ms. Results infigure 2.f (downlink) are similar but, as the TTI is 10 ms, packets affected bythe sawtooth pattern are clustered around this value.
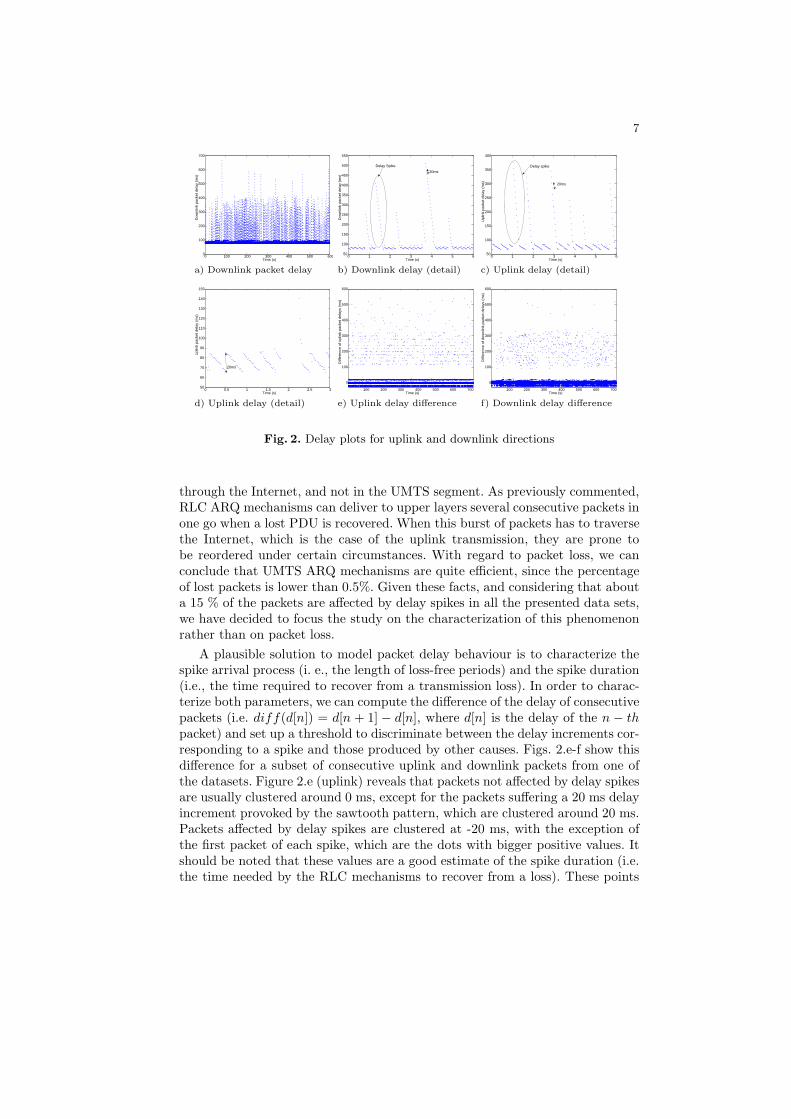
If we analyse the spike duration by computing its histogram, we can easily ob-serve that its nature is clearly discrete (see fig. 3.a-b). This discretization is dueto the temporization of the UMTS link, because the RLC layer always requiresan integer number of TTIs to recover from a loss. The detected discretization is10 ms for downlink and 20 for uplink, which is consistent with previous infer-ences. It should be highlighted that the fact of being able to neatly observe thediscretization originated by the physical layer temporization in uplink packetssuggests that the path between the GGSN and our corporate network has aminor impact on the delay fluctuation.
100 150 200 250 300 3500
50
100
150
200
Spike length (ms)
Ocu
rren
ces
100 200 300 400 500 600 7000
200
400
600
800
1000
1200
1400
1600
Spike length (ms)
Ocu
rren
ces
a) Downlink b) Uplink
Fig. 3. Histogram of the spike duration (RLC loss-recovery time)
0 10 20 30 40 50 600
0.01
0.02
0.03
0.04
0.05
0.06
Number of Downlink TTI (10ms)
Pro
babi
lity
Set 1Set 2Set 3
0 5 10 15 20 25 300
0.02
0.04
0.06
0.08
0.1
0.12
0.14
Number of Uplink TTI (20ms)
Pro
babi
lity
Set 1Set 2Set 3
a) Downlink b) Uplink
Fig. 4. Probability function of the spike duration (RLC loss-recovery time)
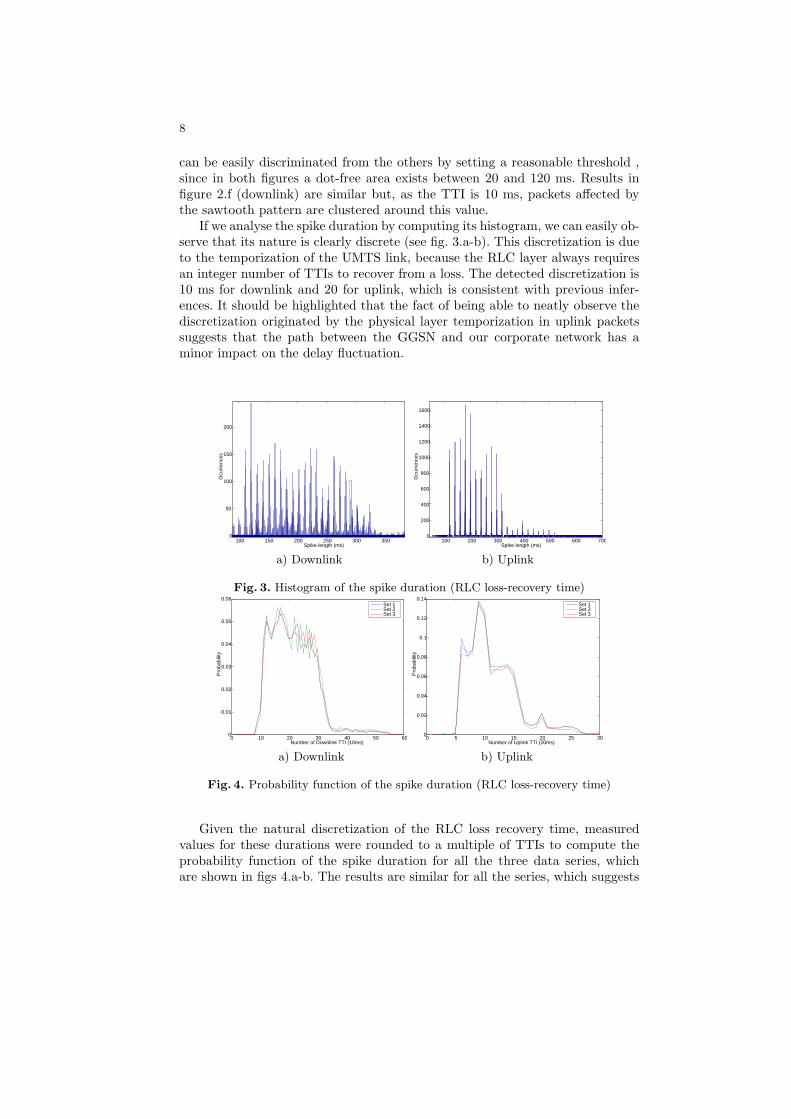
Given the natural discretization of the RLC loss recovery time, measuredvalues for these durations were rounded to a multiple of TTIs to compute theprobability function of the spike duration for all the three data series, whichare shown in figs 4.a-b. The results are similar for all the series, which suggests
9
that this process is quite stable. The amount of time needed by the RLC torecover from a loss depends on its configuration and is variable because differentmechanisms to trigger and inhibit status reports are simultaneously active in theRLC. In any case, the minimum time required to recover from a loss seems to be6 TTI (120 ms) for the uplink, and 10-11 TTIs (100-110 ms) for the downlink.These limits are approximately consistent with theoretical values derived by [16]using the delay budgets suggested in [17]. In addition to the probability functionof the RLC recovery time, we have also explored the autocorrelation of thisprocess (i.e. if there is a dependence between the duration of two consecutiveloss episodes), and we have found that each recovery can be assumed to beindependent from the previous one, since no correlation is observed.
0 1000 2000 3000 4000 5000 6000 7000 8000 9000 100000
1
2
3
4
5
6
7
8x 10⁻⁴
Time between arrivals (ms)
Pro
babi
lity
dens
ity
Set 1Set 2Set 3
0 1000 2000 3000 4000 5000 6000 7000 8000 9000 100000
0.1
0.2
0.3
0.4
0.5
0.6
0.7
0.8
0.9
1x 10⁻³
Time between arrivals (ms)
Pro
babi
lity
dens
ity
Set 1Set 2Set 3
a) Downlink b) Uplink
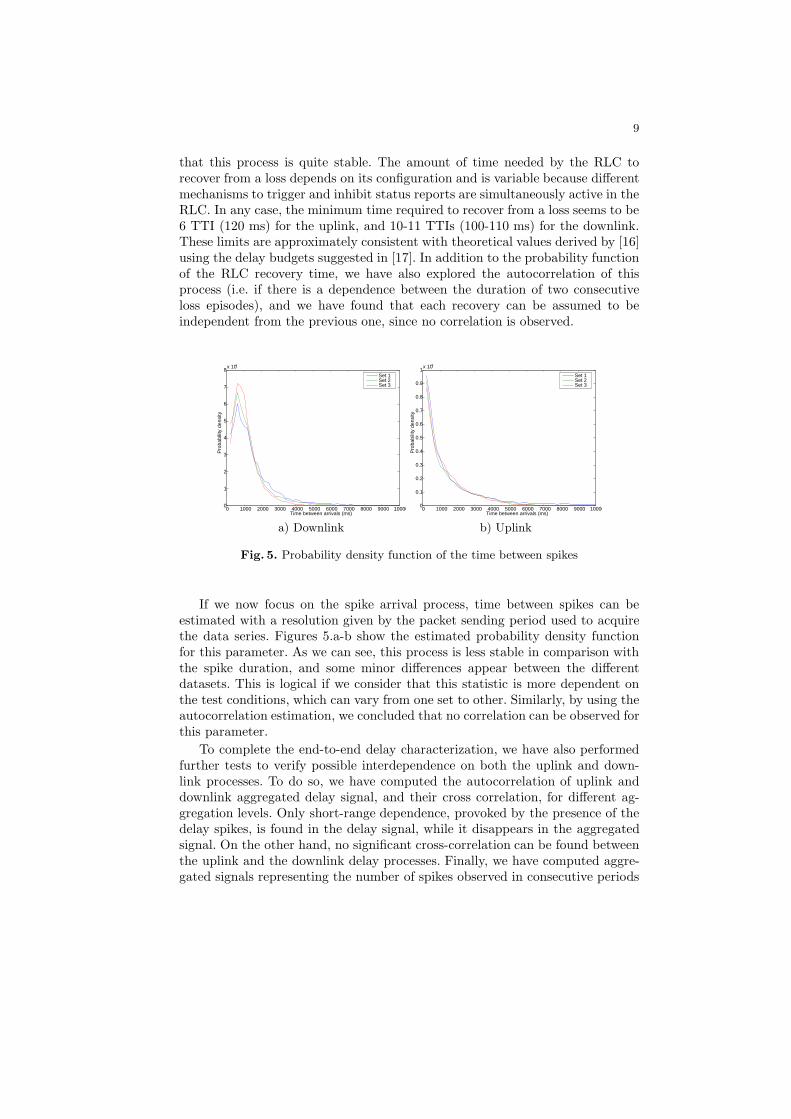
Fig. 5. Probability density function of the time between spikes
If we now focus on the spike arrival process, time between spikes can beestimated with a resolution given by the packet sending period used to acquirethe data series. Figures 5.a-b show the estimated probability density functionfor this parameter. As we can see, this process is less stable in comparison withthe spike duration, and some minor differences appear between the differentdatasets. This is logical if we consider that this statistic is more dependent onthe test conditions, which can vary from one set to other. Similarly, by using theautocorrelation estimation, we concluded that no correlation can be observed forthis parameter.
To complete the end-to-end delay characterization, we have also performedfurther tests to verify possible interdependence on both the uplink and down-link processes. To do so, we have computed the autocorrelation of uplink anddownlink aggregated delay signal, and their cross correlation, for different ag-gregation levels. Only short-range dependence, provoked by the presence of thedelay spikes, is found in the delay signal, while it disappears in the aggregatedsignal. On the other hand, no significant cross-correlation can be found betweenthe uplink and the downlink delay processes. Finally, we have computed aggre-gated signals representing the number of spikes observed in consecutive periods

10
of a given duration. This signals have been used to analyse the autocorrela-tion and cross correlation of uplink and downlink spike interarrival process. Noevidence of significant correlation have been found using this analysis.
TTI controlled constantrate server
Constant Delay(about 60-70ms)
Spike generator(two state model)
Loss Free LossRecovery
TTI controlled constantrate server
Constant Delay(about 60-70ms)
Spike generator(two state model)
Loss Free LossRecovery
Loss Free LossRecovery
Fig. 6. Proposed model for UMTS simulation/emulation
500 1000 1500 2000 2500 3000 3500 4000
500
1000
1500
2000
2500
3000
3500
4000
Original signal quantiles
Mod
el q
uant
iles
Real signal (ideal fit)Gamma (a=0.0013654,b=1.632)Weibull (a=1291.6431,b=1.2876)Log−normal (muy=6.8472,siy=0.69133)Exponential (mu=1195.2825)
1000 2000 3000 4000 5000 6000
1000
2000
3000
4000
5000
6000
Original signal quantiles
Mod
el q
uant
iles
Real signal (ideal fit)Gamma (a=0.00072667,b=0.96684)Weibull (a=1320.8717,b=0.98332)Log−normal (muy=6.8382,siy=0.8427)Exponential (mu=1330.5004)
a) Time between spikes in ms (Downlink) b) Time between spikes in ms (Uplink)
5 10 15 20 25 30 35 40 45 500
20
40
60
80
100
120
Original signal quantiles
Mod
el q
uant
iles
Real signal (ideal fit)Geommetric (p=0.044649)Poisson (beta=21.397)Negative Binomial (p=0.36057,r=12.0654)
0 5 10 15 20 250
10
20
30
40
50
60
Original signal quantiles
Mod
el q
uant
iles
Real signal (ideal fit)Geommetric (p=0.087353)Poisson (beta=10.4478)Negative Binomial (p=0.47108,r=9.3051)
c) Spike duration in TTIs (Downlink) d) Spike duration (Uplink)
Fig. 7. Fit of different distribution for model parameters
5 Proposal of an UMTS delay model
In this section we propose a simple simulation/emulation model for UMTS basedon the observations performed in the previous section. This model is intended tobe used in preliminary simulation or emulation experiments to evaluate the per-formance of transport and application protocols and can be easily implementedfor both environments. The model structure is summarized in figure 6, and is

11
valid for both uplink and downlink directions (only one direction is representedin the figure). Uplink and downlink models are independent from each other.The first stage of the model is a constant bit rate server with a temporizationbased on the TTI. Packets arriving at the system are queued, and every TTI agiven amount of data are served depending on the link bitrate. When all datain the packet have been served, the packet is delivered to the next stage, whichis introduced to reproduce the delay spikes observed in the previous section.
The spike generation stage can be modelled as a two state system. In the loss-free state, all packets delivered to this stage are immediately sent to the next,which is simply a constant delay. In the loss-recovery state, all packets arrivingto this stage are stored in a buffer, until the state changes to loss-free. Whenthis occurs, all packets stored in the buffer are sent in one go to the next stage.The amount of time spent in each state is random and statistically modelled bya distribution function derived from the analysis of the characterization of thetime between spikes (loss free state) and the spike length (loss recovery state).Both processes are independent and identically distributed.
Given the evident discrete nature of the spike duration (it is a limited num-ber or TTIs), we have tested discrete distributions to characterize it. On theother hand, we have considered continuous distributions for the characterizationof the time between spikes. In order to determine which distribution performsthe best fit of the empirically measured parameters, we have used quantile plots.In these plots, the ideal fit is represented by a straight line. The curves closerto this line are the best fitted distributions. The results are shown in figures7.a-d. Spike duration (loss-recovery period) are adequately modelled by a nega-tive binomial distribution both in uplink and downlink. Similarly, time betweendownlink spikes can be reasonably adjusted by a lognormal distribution, whereasthe best fit for the uplink process is an exponential distribution.
6 Conclusions
In this paper we have presented a testbed setup to evaluate end-to-end perfor-mance of real UMTS networks. Using this testbed, we have conducted a set ofmeasuments to analyse the end to end behaviour of Internet access based onUMTS. Our study has mainly focused on the analysis and characterization ofpacket delay. By periodically sending packets and monitoring their end-to-enddelay, we are able to infer several aspects of the configuration and operation ofthe UMTS network. Using these relatively simple measurements we have devel-oped a parsimonious model of UMTS end-to-end behaviour that can be used innetwork simulation or emulation experiments.
The work presented in this paper can be expanded in different ways. Firstlyconclusions derived from the analysis of the measurements and the proposedmodel, should be validated by further and more extensive tests. Additional ex-periments using different packets sizes and sending periods should be executed todetermine the influence of these parameters in the end-to-end behaviour. Also,the study of the effect of the link quality and handovers on the observed results

12
should be considered. On the other hand, the measurement testbed can be usedto extend the analysis to other parameters. A deeper study of packet losses, andan analysis of the available bandwidth behaviour should be also accomplished toenhance the characterization of the UMTS Internet access. Tests involving TCPconnection performance analysis can also be interesting in order to validate theconclusions derived by using the methodology proposed in this paper.
Acknowledgements
This paper has been partially supported by Spanish public research fund pro-gram under project TIC2003-07953-C02-01.
References
1. C. Casetti et al., “TCP westwood: end to end bandwidth estimation for enhancedtransport over wireless links,” Wireless Networks, vol. 8, pp. 467–479, 2002.
2. M. Chan and R. Ramjee, “Improving TCP/IP performance over third generationwireless networks,” in IEEE INFOCOM, May 2004.
3. F. Vacirca, A. D. Vendictis, A. Todini, and A. Baiocchi, “On the effect of ARQmechanisms on TCP performance in wireless enviroments,” in IEEE Globecom,December 2003.
4. C. Chiasserini and M. Meo, “Impact of ARQ protocols on QoS in 3GPP systems,”IEEE Transactions on Vehicular Technology, vol. 52, no. 1, pp. 205–215, January2003.
5. A. Gurtov and S. Floyd, “Modeling wireless links for transport protocols,” ACMComputer communication Review, vol. 34, no. 2, pp. 85–96, April 2004.
6. P. Benko, G. Malicsko, and A. Veres, “A large-scale, pasive analysis of end to endTCP performance over GPRS,” in IEEE INFOCOM, May 2004.
7. R. Chakravorty, J. Cartwright, and I. Pratt, “Practical experience with TCP overGPRS,” in IEEE GLOBECOM, November 2002.
8. Y. Zhang, N. Duffield, V. Paxson, and S. Shenker, “On the constancy of inter-net path properties,” in Proceedings of ACM SIGCOMM Internet MeasurementWorkshop (IMW’2001), November 2001.
9. L. Carbone, F. Coccetti, P. Dini, R. Percacci, and A. Vespignani, “The spectrumof internet performance,” in Pasive and Active Measurements (PAM2003), 2003.
10. H. Jiang and C. Dovrolis, “Passive estimation of tcp round-trip times,” SIGCOMMComput. Commun. Rev., vol. 32, no. 3, pp. 75–88, 2002.
11. “Network architecture,” 3GPP, Technical Specification 25401, 2000.12. “Radio interface protocol architecture,” 3GPP, Technical Specification 25.301-
v4.3.0 Release 4, June 2002.13. “RLC protocol specification,” 3GPP, Technical Specification 25.322-v4.5.0 Release
4, June 2002.14. “Diana research group web page.” [Online]. Available: http://pc21te.dte.uma.es15. “Common test environments for user equipment (UE),” 3GPP, Technical Specifi-
cation 34.108-Release 4, May 2002.16. A. Mutter, M. C. Necker, and S. Lck, “IP packet service time distributions in
UMTS radio access networks,” in EUNICE 2004, 2004.17. “Delay budget within the access stratum,” 3GPP, Technical Specification 25.853-
Release 4, March 2001.