Experiment Report Form - ftp.esrf.euftp.esrf.eu/pub/smis2.esrf.fr/57669_A.pdf2 Experiment title:...
5
1 EUROPEAN SYNCHROTRON RADIATION FACILITY INSTALLATION EUROPEENNE DE RAYONNEMENT SYNCHROTRON Experiment Report Form The double page inside this form is to be filled in by all users or groups of users who have had access to beam time for measurements at the ESRF. Once completed, the report should be submitted electronically to the User Office via the User Portal: https://wwws.esrf.fr/misapps/SMISWebClient/protected/welcome.do Reports supporting requests for additional beam time Reports can be submitted independently of new proposals – it is necessary simply to indicate the number of the report(s) supporting a new proposal on the proposal form. The Review Committees reserve the right to reject new proposals from groups who have not reported on the use of beam time allocated previously. Reports on experiments relating to long term projects Proposers awarded beam time for a long term project are required to submit an interim report at the end of each year, irrespective of the number of shifts of beam time they have used. Published papers All users must give proper credit to ESRF staff members and proper mention to ESRF facilities which were essential for the results described in any ensuing publication. Further, they are obliged to send to the Joint ESRF/ ILL library the complete reference and the abstract of all papers appearing in print, and resulting from the use of the ESRF. Should you wish to make more general comments on the experiment, please note them on the User Evaluation Form, and send both the Report and the Evaluation Form to the User Office. Deadlines for submission of Experimental Reports - 1st March for experiments carried out up until June of the previous year; - 1st September for experiments carried out up until January of the same year. Instructions for preparing your Report fill in a separate form for each project or series of measurements. type your report, in English. include the reference number of the proposal to which the report refers. make sure that the text, tables and figures fit into the space available. if your work is published or is in press, you may prefer to paste in the abstract, and add full reference details. If the abstract is in a language other than English, please include an English translation.
Transcript of Experiment Report Form - ftp.esrf.euftp.esrf.eu/pub/smis2.esrf.fr/57669_A.pdf2 Experiment title:...
1
EUROPEAN SYNCHROTRON RADIATION FACILITY INSTALLATION EUROPEENNE DE RAYONNEMENT SYNCHROTRON
Experiment Report Form
The double page inside this form is to be filled in by all users or groups of users who have had access to beam time for measurements at the ESRF.
Once completed, the report should be submitted electronically to the User Office via the User Portal:
https://wwws.esrf.fr/misapps/SMISWebClient/protected/welcome.do
Reports supporting requests for additional beam time
Reports can be submitted independently of new proposals – it is necessary simply to indicate the number of the report(s) supporting a new proposal on the proposal form.
The Review Committees reserve the right to reject new proposals from groups who have not reported on the use of beam time allocated previously.
Reports on experiments relating to long term projects
Proposers awarded beam time for a long term project are required to submit an interim report at the end of each year, irrespective of the number of shifts of beam time they have used.
Published papers
All users must give proper credit to ESRF staff members and proper mention to ESRF facilities which were essential for the results described in any ensuing publication. Further, they are obliged to send to the Joint ESRF/ ILL library the complete reference and the abstract of all papers appearing in print, and resulting from the use of the ESRF.
Should you wish to make more general comments on the experiment, please note them on the User Evaluation Form, and send both the Report and the Evaluation Form to the User Office.
Deadlines for submission of Experimental Reports
- 1st March for experiments carried out up until June of the previous year;
- 1st September for experiments carried out up until January of the same year.
Instructions for preparing your Report
fill in a separate form for each project or series of measurements.
type your report, in English.
include the reference number of the proposal to which the report refers.
make sure that the text, tables and figures fit into the space available.
if your work is published or is in press, you may prefer to paste in the abstract, and add full
reference details. If the abstract is in a language other than English, please include an English
translation.

2
Experiment title:
Study of the physico-chemical parameters influencing the chromatic alteration and destabilization of cadmium sulfide-based pigments
Experiment
number:
HG-64
Beamline:
ID21
Date of experiment:
from: 25/11/2015 to: 01/12/2015
Date of report:
04/03/2016
Shifts:
18
Local contact(s):
Marine Cotte
Received at ESRF:
Names and affiliations of applicants (* indicates experimentalists):
*Letizia Monico, CNR-ISTM, Perugia, Italy
*Annalisa Chieli, Department of Chemistry, University of Perugia, Italy
*Frederik Vanmeert, Department of Chemistry, Antwerp University, Belgium
1. INTRODUCTION Cadmium sulfide-based yellow-orange-red pigments is a class of
compounds of different composition (CdS/Cd1-xZnxS/CdSxSe1-x) and
crystalline structure (hexagonal, cubic or amorphous), widely used by many
painters of late 19th
C-early 20th
C. [1-3] The fading of CdS-based yellow
paints, has been already documented for masterpieces by Ensor, [4] Van
Gogh, [5] and Matisse. [6-8] In these case studies, Cd-sulfates, oxalates,
carbonates, chlorides have been identified and suggested as possible
degradation products, originated by a process that starts with a photo-
activated step. Additives and other environmental factors have been also
suggested as other possible triggering factors for the degradation of CdS-
based pigments.
Nevertheless, these hypotheses have been never experimentally proved by
accelerated aging tests.
With the final aim to assess the physico-chemical parameters influencing
the chromatic alteration and/or destabilization of CdS-based pigments, this
experiment has focused on the investigations of a series of oil paint models
composed of commercial/historical CdS-based pigments of different
composition (with additives and/or synthesis residues) before and after
exposure to light or different relative humidity (RH) conditions.
The study of the model paints was also combined with the analysis of
several micro-samples (Figure 1) obtained from the painting Alchemy
(1947) by J. Pollock.
Figure 1. Optical microscope pictures of
two of the paint microsamples taken from
the painting Alchemy by J. Pollock (1947,
Peggy Guggenheim collection, Venice).
250 μm
250 μm
3
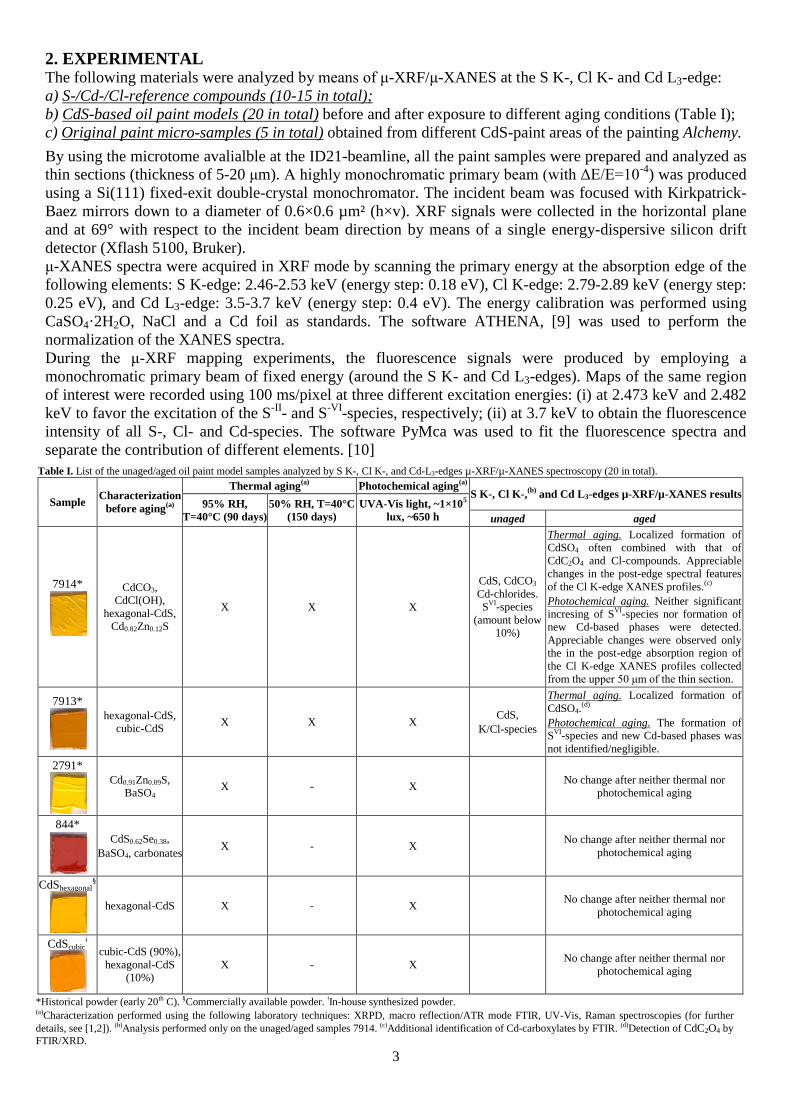
2. EXPERIMENTAL The following materials were analyzed by means of μ-XRF/μ-XANES at the S K-, Cl K- and Cd L3-edge:
a) S-/Cd-/Cl-reference compounds (10-15 in total);
b) CdS-based oil paint models (20 in total) before and after exposure to different aging conditions (Table I);
c) Original paint micro-samples (5 in total) obtained from different CdS-paint areas of the painting Alchemy.
By using the microtome avalialble at the ID21-beamline, all the paint samples were prepared and analyzed as
thin sections (thickness of 5-20 μm). A highly monochromatic primary beam (with ΔE/E=10-4
) was produced
using a Si(111) fixed-exit double-crystal monochromator. The incident beam was focused with Kirkpatrick-
Baez mirrors down to a diameter of 0.6×0.6 µm² (h×v). XRF signals were collected in the horizontal plane
and at 69° with respect to the incident beam direction by means of a single energy-dispersive silicon drift
detector (Xflash 5100, Bruker).
μ-XANES spectra were acquired in XRF mode by scanning the primary energy at the absorption edge of the
following elements: S K-edge: 2.46-2.53 keV (energy step: 0.18 eV), Cl K-edge: 2.79-2.89 keV (energy step:
0.25 eV), and Cd L3-edge: 3.5-3.7 keV (energy step: 0.4 eV). The energy calibration was performed using
CaSO4·2H2O, NaCl and a Cd foil as standards. The software ATHENA, [9] was used to perform the
normalization of the XANES spectra.
During the μ-XRF mapping experiments, the fluorescence signals were produced by employing a
monochromatic primary beam of fixed energy (around the S K- and Cd L3-edges). Maps of the same region
of interest were recorded using 100 ms/pixel at three different excitation energies: (i) at 2.473 keV and 2.482
keV to favor the excitation of the S-II
- and S-VI
-species, respectively; (ii) at 3.7 keV to obtain the fluorescence
intensity of all S-, Cl- and Cd-species. The software PyMca was used to fit the fluorescence spectra and
separate the contribution of different elements. [10]
Table I. List of the unaged/aged oil paint model samples analyzed by S K-, Cl K-, and Cd-L3-edges µ-XRF/µ-XANES spectroscopy (20 in total).
Sample Characterization
before aging(a)
Thermal aging(a)
Photochemical aging(a)
S K-, Cl K-,
(b) and Cd L3-edges µ-XRF/µ-XANES results
95% RH,
T=40°C (90 days)
50% RH, T=40°C
(150 days)
UVA-Vis light, ~1×10⁵
lux, ~650 h unaged aged
7914*
CdCO3,
CdCl(OH),
hexagonal-CdS,
Cd0.82Zn0.12S
X X X
CdS, CdCO3
Cd-chlorides.
SVI
-species
(amount below
10%)
Thermal aging. Localized formation of
CdSO4 often combined with that of
CdC2O4 and Cl-compounds. Appreciable
changes in the post-edge spectral features
of the Cl K-edge XANES profiles.(c)
Photochemical aging. Neither significant
incresing of SVI
-species nor formation of
new Cd-based phases were detected.
Appreciable changes were observed only
the in the post-edge absorption region of
the Cl K-edge XANES profiles collected
from the upper 50 μm of the thin section.
7913*
hexagonal-CdS,
cubic-CdS X X X
CdS,
K/Cl-species
Thermal aging. Localized formation of
CdSO4.(d)
Photochemical aging. The formation of
SVI
-species and new Cd-based phases was
not identified/negligible.
2791*
Cd0.91Zn0.09S,
BaSO4 X - X
No change after neither thermal nor
photochemical aging
844*
CdS0.62Se0.38,
BaSO4, carbonates X - X
No change after neither thermal nor
photochemical aging
CdShexagonal§
hexagonal-CdS X - X No change after neither thermal nor
photochemical aging
CdScubicǂ
cubic-CdS (90%),
hexagonal-CdS
(10%)
X - X No change after neither thermal nor
photochemical aging
*Historical powder (early 20th C). §Commercially available powder. ǂIn-house synthesized powder. (a)Characterization performed using the following laboratory techniques: XRPD, macro reflection/ATR mode FTIR, UV-Vis, Raman spectroscopies (for further
details, see [1,2]). (b)Analysis performed only on the unaged/aged samples 7914. (c)Additional identification of Cd-carboxylates by FTIR. (d)Detection of CdC2O4 by
FTIR/XRD.
4
3. RESULTS 3.1. Artificially aged CdS-based paint models. An overview of the SR μ-XANES and μ-XRF results obtained
from the analyzed paint models samples is summarized in Table I.
S- and Cd-speciation results obtained from samples 2791, 844, CdShexagonal and CdScubic (not shown) did not reveal
significant changes after neither light exposure nor treatment with moisture. A mixture of CdS and BaSO4 was
identified in samples 2791 and 844, while only CdS was detected in CdShexagonal and CdScubic.
On the contrary, clear indications about the local S-II → SO42- conversion and the formation of new organo-Cd-
compounds (i.e., oxalates– result also supported by μ-FTIR and μ-XRD) were observed for the samples
containing Cl-compounds (i.e., 7914 and 7913) and aged with different relative humidity conditions. In both
samples, chlorides are likely present as additives/residues of early synthesis procedures.[1,3]
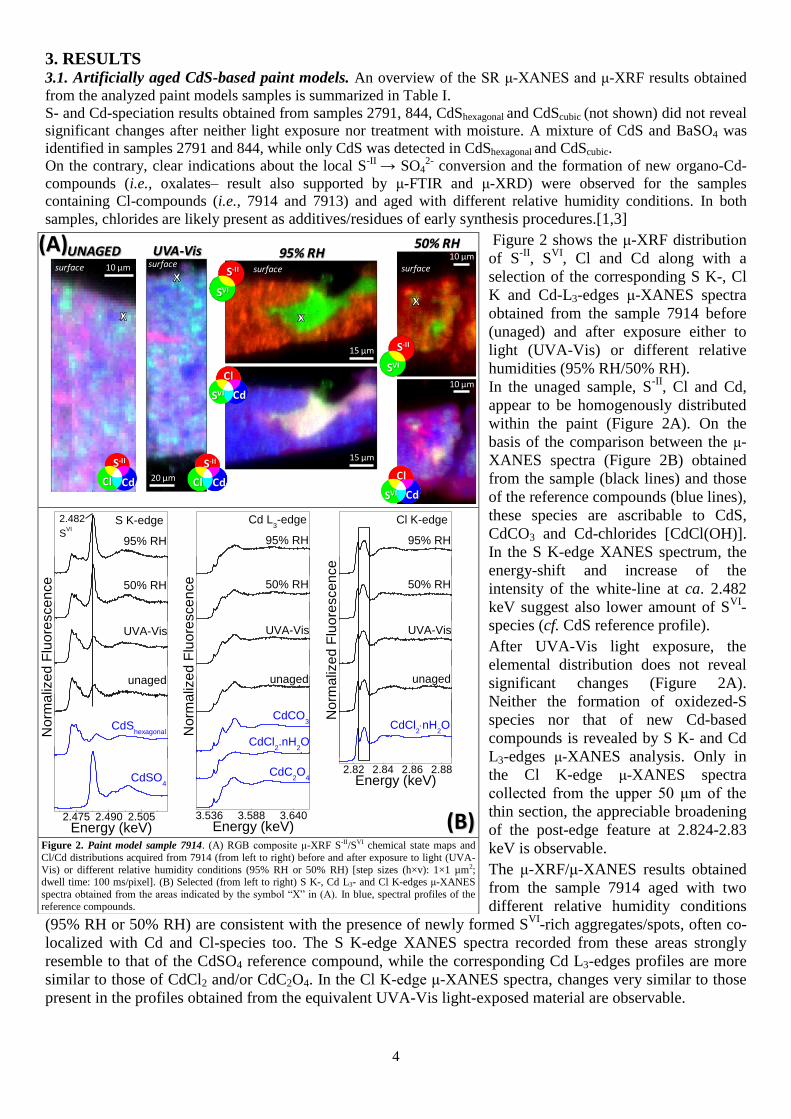
Figure 2 shows the μ-XRF distribution
of S-II
, SVI
, Cl and Cd along with a
selection of the corresponding S K-, Cl
K and Cd-L3-edges μ-XANES spectra
obtained from the sample 7914 before
(unaged) and after exposure either to
light (UVA-Vis) or different relative
humidities (95% RH/50% RH).
In the unaged sample, S-II
, Cl and Cd,
appear to be homogenously distributed
within the paint (Figure 2A). On the
basis of the comparison between the μ-
XANES spectra (Figure 2B) obtained
from the sample (black lines) and those
of the reference compounds (blue lines),
these species are ascribable to CdS,
CdCO3 and Cd-chlorides [CdCl(OH)].
In the S K-edge XANES spectrum, the
energy-shift and increase of the
intensity of the white-line at ca. 2.482
keV suggest also lower amount of SVI
-
species (cf. CdS reference profile).
After UVA-Vis light exposure, the
elemental distribution does not reveal
significant changes (Figure 2A).
Neither the formation of oxidezed-S
species nor that of new Cd-based
compounds is revealed by S K- and Cd
L3-edges μ-XANES analysis. Only in
the Cl K-edge μ-XANES spectra
collected from the upper 50 μm of the
thin section, the appreciable broadening
of the post-edge feature at 2.824-2.83
keV is observable.
The μ-XRF/μ-XANES results obtained
from the sample 7914 aged with two
different relative humidity conditions
(95% RH or 50% RH) are consistent with the presence of newly formed SVI
-rich aggregates/spots, often co-
localized with Cd and Cl-species too. The S K-edge XANES spectra recorded from these areas strongly
resemble to that of the CdSO4 reference compound, while the corresponding Cd L3-edges profiles are more
similar to those of CdCl2 and/or CdC2O4. In the Cl K-edge μ-XANES spectra, changes very similar to those
present in the profiles obtained from the equivalent UVA-Vis light-exposed material are observable.
2.475 2.490 2.505
S K-edge
No
rma
lize
d F
luo
resce
nce
2.482
SVI
CdShexagonal
CdSO4
Energy (keV)
95% RH
unaged
UVA-Vis
50% RH
Figure 2. Paint model sample 7914. (A) RGB composite μ-XRF S-II/SVI chemical state maps and
Cl/Cd distributions acquired from 7914 (from left to right) before and after exposure to light (UVA-
Vis) or different relative humidity conditions (95% RH or 50% RH) [step sizes (h×v): 1×1 µm2; dwell time: 100 ms/pixel]. (B) Selected (from left to right) S K-, Cd L3- and Cl K-edges μ-XANES
spectra obtained from the areas indicated by the symbol “X” in (A). In blue, spectral profiles of the
reference compounds.
15 μm
Cl
SVI Cd
15 μm
SVI
S-II
95% RHsurface
10 μm
10 μm
SVI
S-II
Cl
SVI Cd
50% RH
surface
S-II
Cl Cd
10 μmsurface
UNAGED
20 μm
surfaceUVA-Vis
S-II
Cl Cd
((BB)) 3.536 3.588 3.640
95% RH
Cd L3-edge
No
rma
lize
d F
luo
resce
nce
unaged
CdCO3
CdC2O
4
Energy (keV)
UVA-Vis
50% RH
CdCl2.nH
2O
2.82 2.84 2.86 2.88
Cl K-edge
No
rma
lize
d F
luo
resce
nce
CdCl2nH
2O
Energy (keV)
95% RH
unaged
UVA-Vis
50% RH
((AA))

5
In Figure 3, the S and Cd-speciation results obtained from
the sample 7913 before (unaged) and after exposure to high
relative humidity conditions (95% RH) are reported.
In the unaged sample, CdS is the main consitutent of the
yellow-orange paints. K and Cl-particles are also widespread
within the paint (Figure 3A, top). Similarly to the sample
7914, neither the formation of oxided-S species nor that of
new Cd-based compounds was detected after UVA-Vis light
exposure (results not reported), while the in situ formation
of CdSO4 is detectable after exposure to moisture (Figure
3A, bottom; Figure 3B).
3.2 Original paint micro-samples from “Alchemy” (results
not shown). S and Cd-speciation investigations of four out five
analyzed samples (Figure 1, top) revealed that CdS and BaSO4
are the main constituents of the yellow layer. In the remaining
sample (Figure 1, bottom), the yellow pigment, strongly diluted
in a Cl/Pb-rich matrix, was found to be composed of CdS and
CdCO3. No evidence of other S/Cd/Cl-based compounds
ascribable to the degradation of the original CdS-yellow
pigments were identified.
4. SUMMARY AND CONCLUSIONS The results obtained from this experiment (to be published soon) have revealed that: a) the CdS-pigments are
stable under UVA-Vis light exposure; b) the composition and crystalline structure of the pigment itself do not
influence its stability; c) the formation of Cd-alteration products (CdSO4, CdC2O4, and Cd-carboxylates)
appears to occur only for historical pigments containing Cl-compounds (residues of early synthesis
procedures) and that it is favored under exposure to high relative humidity condition (≥50% RH). These
experimental findings open up the way to additional investigations that will focus on the role of Cl-
compounds in the mechanism of oxidation of Cd-yellows.
REFERENCES [1] F. Rosi et al., Microchemical Journal 124 (2016), 856-867.
[2] C. Grazia et al., Microchemical Journal 125 (2016), 279-289.
[3] I. Fiedler, M. A. Bayard, “Cadmium Yellows, Oranges and Reds”, in Artists’ Pigments. A Handbook of Their History and
Characteristics, Vol. 1: Feller, R. L. (Ed.) Oxford University Press 1986, pp. 65-108.
[4] G. Van der Snickt et al., Analytical Chemistry 81 (2009), 2600-2610.
[5] G. Van der Snickt et. al., Analytical Chemistry 84 (2012), 10221–10228.
[6] J. Mass et al., Applied Physics A 111 (2013), 59-68.
[7] J. Mass et al., Analyst 138 (2013), 6032-6043.
[8] E. Pouyet et al., Applied Physics A 121 (2015), 967-980.
[9] B. Ravel, M. Newville Journal of Synchrotron Radiation 12 (2005), 537–541.
[10] V. A. Solé et al., Spectrochimica Acta B 62 (2007), 63–68.
2.475 2.490 2.505
unaged
S K-edge
No
rma
lize
d F
luo
resce
nce
95% RH
CdShexagonal
CdSO4
Energy (keV)
3.536 3.588 3.640
unaged
Cd L3-edge
No
rma
lize
d F
luo
resce
nce
95% RH
CdSO4
Energy (keV)
CdShexagonal
Figure 3. Paint model sample 7913. (A) RGB composite μ-XRF
S-II/SVI chemical state maps and Cl/K/Cd distributions acquired from
7913 (top) before and (B) after exposure to high relative humidity conditions (95% RH) [step sizes (h×v): 1×1 µm2; dwell time: 100
ms/pixel]. (B) Selected (top) S K- and (bottom) Cd L3-edges
μ-XANES spectra obtained from the areas shown by “X” in (A). In blue, spectral profiles of the reference compounds.
S-II
SVI Cd
20 μm
20 μmCd
S-II
20 μmK
Cl
UNAGED
95% RH
surface
surface
((AA)) ((BB))