Experiment HP-11: Background Multisensory Reaction Times€¦ · Multisensory Reaction Times. ......
15
iWorx Physiology Lab Experiment iWorx Systems, Inc. www.iworx.com iWorx Systems, Inc. 62 Littleworth Road, Dover, New Hampshire 03820 (T) 800-234-1757 / 603-742-2492 (F) 603-742-2455 LabScribe2 is a trademark of iWorx Systems, Inc. ©2013 iWorx Systems, Inc. Experiment HP-11: Background Multisensory Reaction Times
Transcript of Experiment HP-11: Background Multisensory Reaction Times€¦ · Multisensory Reaction Times. ......
iWorx Physiology Lab Experiment
iWorx Systems, Inc.
www.iworx.com
iWorx Systems, Inc.
62 Littleworth Road, Dover, New Hampshire 03820
(T) 800-234-1757 / 603-742-2492 (F) 603-742-2455
LabScribe2 is a trademark of iWorx Systems, Inc.
©2013 iWorx Systems, Inc.
Experiment HP-11: Background
Multisensory Reaction Times

Experiment HP-11: Multisensory Reaction Times
Lab written and contributed by: Tracy M. Hodgson, Program in Biological Sciences, Northwestern
University, Evanston, IL and Martha Cammarata, Department of Biology, North Park University,
Chicago, IL
NOTE – This is a multi-day experiment. Students should be prepared to work on this for three
lab periods.
Responding quickly and appropriately to external stimuli is an important component of life for any
organism. The goal of this lab is to measure volitional reaction times in humans, which reflect the
amount of time the nervous system requires to process sensory information (i.e. visual cues), select an
appropriate motor command, and send that command to the skeletal muscles. During the first part of
this lab, you will perform basic experiments to measure visual, somatosensory and auditory reaction
times. Then, you will design your own multisensory reaction time experiment.
Day 1 - Exercise 1: Ruler Drop (you will not be using LabScribe for this portion of the experiment)
Aim: To perform a reaction time experiment using a ruler drop protocol, create bar graphs of class data,
and analyze class data using T Tests in Excel or another statistical program.
Procedure
1. Assign roles: experimenter, subject, and recorder for groups of 3, or experimenter and subject
for groups of 2.
2. The experimenter holds the ruler near the 30cm mark and lets it hang vertically. Meanwhile, the
subject places his/her thumb and index finger on either side of the 0 cm mark ready to catch it
when it falls. His/her fingers should not touch the ruler.
3. Without warning, the experimenter lets go and the subject tries to catch the ruler as quickly as
possible.
4. The recorder should note and record the level (in cm) just above the subject’s finger where the
ruler was caught.
5. Use the formula shown below to convert distance into time:
Reaction time can be calculated as follows: t is reaction time (in seconds), d is the distance the ruler fell
(in cm), and g is gravity (980 cm/s2).
6. Repeat this procedure to get at least 10 data points (replicates) with the same subject.
7. Repeat steps 2-7, but give a cue (“get ready”) 1-2 seconds before dropping the ruler.
8. Switch roles and repeat, acquiring 10 cued and 10 uncued reaction times for each subject in
your lab group.
9. Enter an ID (could be initials or a number), biographical information and the mean cued and
uncued reaction times for each subject in the Excel worksheet on your computer desktop. We
will graph and statistically analyze this data later in the lab period.
Human Psychophysiology – Multisensory Reaction Times – Labs HP-11-1

10. Follow the directions in the Appendix for calculating a T-Test with Excel.
Day 2 – Multisensory Reactions
1. Perform experiments measuring reaction time to visual, auditory and somatosensory stimuli
using the LabScribe data acquisition system.
2. Formulate hypotheses and create an experimental protocol with your lab group, and discuss
your protocol with your professor or TA before leaving lab.
• Experimental considerations: Before you start collecting data, it is important to decide
what type of information you will be collecting. Some factors to consider:
• What information about your subject do you want to record? These should be
factors that you think will be pertinent to reaction time (i.e. age, height, weight,
etc).
• Once you decide what information you want to collect, you can design an excel
spreadsheet where you will record your data. At a minimum, you will need to
include a subject identifier, treatment condition (i.e. visual/auditory), and the
reaction time.
• The settings file you are using today is set up to run 10 presentations of stimuli
per reaction time experiment. When you design your own experiments you may
decide to run more or fewer stimulus presentations per experiment.
3. As a group, you can discuss and decide:
• Should the subject be allowed to have one or more practice trials?
• How do you ensure the best possible stimulus for the subject (i.e. minimizing extraneous
cues)
• Should the stimulus cues be presented in a predictable fashion or with randomly spaced
intervals? The settings file you are working with today will present stimuli at randomly
spaced intervals, but you may decide to test predictable cues with the subjects for your
experiments.
Hardware Setup – using the SI-200
The cables have already been connected as in the Setup directions.
1. Make sure the SI-200 is turned on, but not armed (the stimulators have a safety feature in that
two buttons must be pushed in order to produce a pulse).
2. We will be using the stimulators to provide either a visual stimulus (a square wave on the
LabScribe acquisition screen), a somatosensory stimulus (a slight pulse on the skin when the
electrodes are attached to the forearm) or both, so they should be adjusted to produce the
minimum amplitude necessary for the subject to detect the stimulus. If the stimulus
amplitude is too high, the somatosensory stimulus will be a distracting shock rather than a
simple touch, which will affect reaction time.
Human Psychophysiology – Multisensory Reaction Times – Labs HP-11-2

Exercise 1: Reaction Time and Visual Cues
Aim: To measure the reaction time of a subject to a visual cue.
Procedure
1. Read all instructions carefully before beginning to record.
2. Assign roles within your lab group:
• Research subject – Person whose reaction time will be measured
• Experimenter/Computer Tech – Will control the stimulator, run the computer and assist
the subject
3. Information for the subject:
• Instruct the subject to sit in a chair and face the computer screen.
• He or she should position a hand on the keyboard in a manner that enables the subject to
push the F1 key as quickly as possible.
• Watch the right side of the computer screen for a sqaure wave to appear and quickly
press the F1 key on the keyboard when the signal generated by the stimulator first
appears.
4. Directions for the other student(s):
• Annotate the data trace with the subject’s name and the treatment condition (i.e.
<Subject’s Name> Visual Cues). Marks can be added to a data file in one of three
ways:
• Type in a comment in the space next to the Mark button, then, while the trace is
running, click Mark when you come to a point in the trace where you want the
comment to be.
• Click the Mark button during data acquisition, wherever you want a comment to
appear later. After you finish acquiring data, go into the menu and click on
“Marks”. Highlight the mark you want, type your comment in the blank space
next to the EDIT button, then click the EDIT button, then OK.
• You can also click the Mark button after data acquisition is completed to place a
comment – go to a single cursor, place it where you wish the comment to go,
then click the Mark button.
NOTE: It is crucial to annotate your chart frequently! You will need to come back to specific places
in the chart when you analyze the data later on in this exercise.
5. Make sure the SI200 stimulator amplitude dial is turned down to minimum and that the
stimulator is “ARMED”. Press the “Arm” button if it is not.
Human Psychophysiology – Multisensory Reaction Times – Labs HP-11-3

6. Click “Sequences”.
• Choose the sequence called “Visual + Somatosensory” and then
• Click OK. At the top of the main acquisition screen, to the right of the row of icons should
be a button labeled with the sequence you are currently using, in this case “Visual and/or
Somatosensory”. If the button says “Seq:Off”, click the down arrow to the right, click on
the appropriate sequence, and also click on “Run Sequence” (Figure HP-11-L1)
• When you click “Record”, the words “Visual and/or Somatosensory” should turn bright
green. If they don’t, click on “Run Sequence” again and start the recording again.
Figure HP-11-L1: Sequences menu selection.
7. Click on the Record button.
8. Type <Subject’s Name> Visual Cues in the Mark box to the right of the Mark button. Press the
Enter key or “Mark” to mark the recording.
9. Instruct the subject to press the F1 key to mark the recording as soon as he or she sees the visual
cue (square wave) on the right side of the computer screen (Figure HP-1-L2).
10. Instruct the subject that the exercise has begun and that a visual cue could appear on the screen
at any time. Sometimes immediately after pressing record, a cue appears, this one can be
ignored.
11. The stimulator is set to deliver ten visual cues to the subject. The cues are variable, but
generally not be less than one second nor more than ten seconds apart.
12. After the tenth cue, click Stop to halt recording.
13. Select Save As in the File menu, type a name for the file. Choose a destination on the computer
in which to save the file, like your lab group folder. Designate the file type as *.iwxdata. Click
on the Save button to save the data file.
Human Psychophysiology – Multisensory Reaction Times – Labs HP-11-4
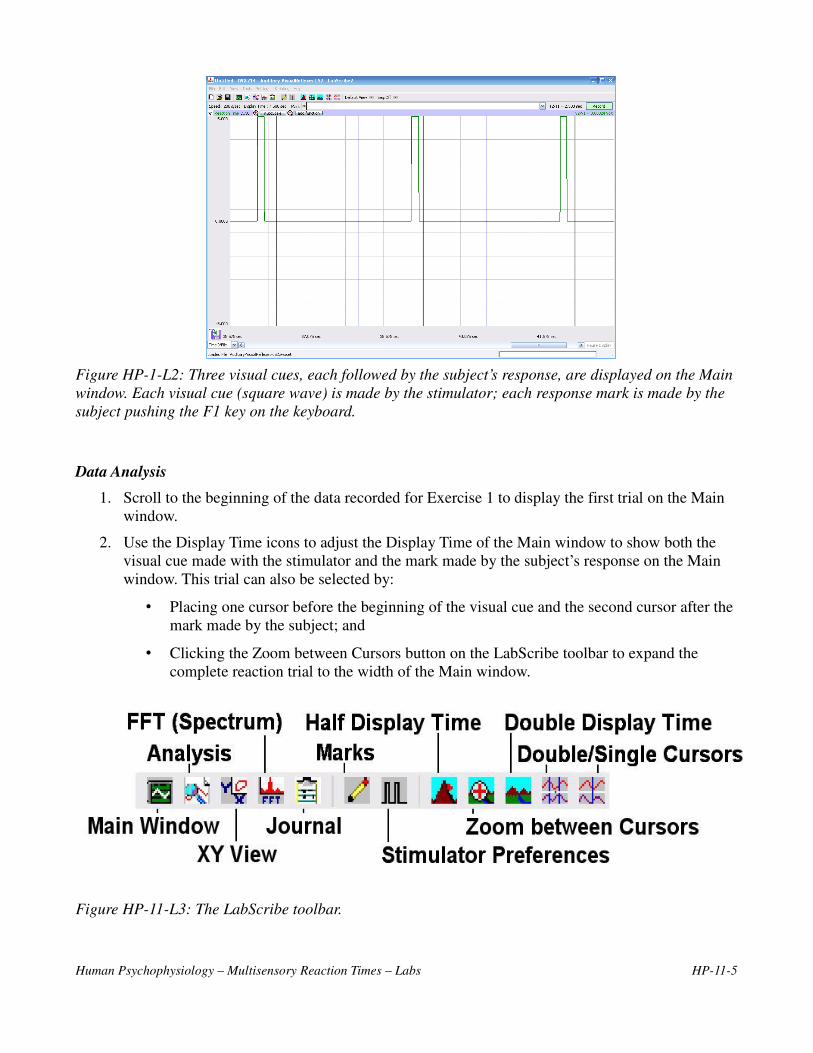
Figure HP-1-L2: Three visual cues, each followed by the subject’s response, are displayed on the Main
window. Each visual cue (square wave) is made by the stimulator; each response mark is made by the
subject pushing the F1 key on the keyboard.
Data Analysis
1. Scroll to the beginning of the data recorded for Exercise 1 to display the first trial on the Main
window.
2. Use the Display Time icons to adjust the Display Time of the Main window to show both the
visual cue made with the stimulator and the mark made by the subject’s response on the Main
window. This trial can also be selected by:
• Placing one cursor before the beginning of the visual cue and the second cursor after the
mark made by the subject; and
• Clicking the Zoom between Cursors button on the LabScribe toolbar to expand the
complete reaction trial to the width of the Main window.
Figure HP-11-L3: The LabScribe toolbar.
Human Psychophysiology – Multisensory Reaction Times – Labs HP-11-5

3. Click on the Analysis window icon in the toolbar (Figure HP-11-L3) or select Analysis from the
Windows menu to transfer the data displayed in the Main window to the Analysis window
(Figure HP-11-L4). NOTE: The AutoFind function will not work properly from the Main
acquisition screen – you MUST be in the Analysis screen).
4. Toward the upper left of the screen, make sure “T2-T1” is showing. If not, choose it from the
Add Functions - General menu.
5. Make sure there are two corsors on screen. Place both cursors in front of the first stimulus
square wave to be analyzed.
6. Click the “Marks” icon to open the Marks Dialog.
• In the “Marks” Dialog, change the names of all events to be analyzed to something other
than “Mark” (doesn’t matter what it is, could be one letter or the initials of your subject,
for example; it does need to be the same name for every event in a trial/block of data).
• Click OK. Verify that the names of the marks in the Analysis window have changed then
SAVE YOUR DATA FILE AGAIN.
Figure HP-11-L4: A visual cue, followed by the subject’s response, are displayed on the Analysis
window. The two cursors are positioned at the beginning of the visual cue and on the mark for
measurement of the subject’s reaction time (T2-T1) in this trial.
7. Click on “Tools”, then “AutoFind”.
• At the top of the AutoFind dialog, next to “New Cursor 1 Position”, choose “Next
Positive Threshold”.
• In the same line, to the right, next to the “+” sign, type in 0.05 seconds.
• Next to “Channel”, choose “Visual Cue” – square waves should appear in the box below.
Human Psychophysiology – Multisensory Reaction Times – Labs HP-11-6

• Set Thresholds: move the two horizontal blue lines anywhere within the stimulus square
waves - one near the top of the waves, the other near the bottom.
• Set “New Cursor 2 Position” to “Mark”. In the same line, to the right, next to the “+”
sign, type in 0.05 seconds.
• In the line below, to the right of the word “Mark”, type in the first letter of the name of
the events (marks) you wish to analyze. NOTE: If any events are unmarked or have a
different name within the events you are measuring, the AutoFind function will stop at
that point.
• Set “Repeat Until” to “Document Limits” to analyze every event in a data file (across
blocks), or choose “Block Limits” to analyze only those events in a single block
(delineated by the thick black lines that indicate where data acquisition was started then
stopped).
• Click the Export button and choose “Export to File”, then create a file on the desktop for
the text file of reaction times for this experiment.
• Click “Find”.
• Copy and paste the reaction times (T2-T1) from the text file on the Desktop into an
Excel spreadsheet.
8. Once the reaction times in all ten trials have been measured and recorded, open the Journal or
use Excel. Use the values to determine the mean reaction time of the subject. Discard the
longest and shortest times from the data set, and determine the average of the eight remaining
reaction times. Record the mean reaction time for this exercise in Table HP-11-L1.
Exercise 2: Reaction Time and Auditory Cues
Aim: To measure the reaction time of a subject to an auditory cue.
Procedure
1. Follow the procedure described in the Visual Reaction time experiment with the following
modifications:
• The computer screen should be out of view of the subject (either covered with paper or
turned away from the subject)
• The computer tech should ensure that the data trace is correctly annotated with
<Subject’s name> Auditory cues.
• To deliver an auditory cue, under LabScribe Preferences, click on “Sequences”.
• Choose the sequence called “Visual Auditory Somatosensory”.
• Make sure that the appropriate sequence is showing in the Main acquisition
screen at the top. It may be necessary to click “Run Sequence” within the
Sequence menu at the top of the Main acquisition screen. The sequence will
present the square waves paired with a computer generated tone.
Human Psychophysiology – Multisensory Reaction Times – Labs HP-11-7

• Choose a .wav file from your computer to generate the sound you want the
subject to hear. (See notes below for adding .wav files).
2. Click on the Record button.
3. Instruct the subject that the exercise has begun and that a auditory cue could be heard at any
time.
4. The stimulator is programmed to deliver ten auditory cues to the subject. The cues are variable
but should not be less than one second nor more than ten seconds apart.
5. Instruct the subject to press the F1 key to mark the recording as soon as he or she hears the
auditory cue.
6. After the tenth cue, click Stop to halt recording.
7. Select Save in the File menu.
Data Analysis
1. Use the same technique explained in Exercise 1 to measure and record the reaction times of the
subject presented with auditory cues.
2. Enter the mean reaction time for this exercise in Table HP-11-L1.
Questions
1. How does the subject’s mean reaction time to visual cues compare to his or her mean reaction
time to auditory cues?
2. What would cause a longer reaction time to one type of cue as compared to another?
3. How do your subject’s mean reaction times compare to those of other subjects?
4. Do all subjects respond more quickly to the same cue?
Exercise 3: Somatosensory Reaction Time
Aim: To measure the reaction time of a subject to a more complex somatosensory stimulus.
Procedure
1. Follow the procedure described above with the following modifications:
• The computer screen should be out of view of the subject (either covered with paper or
turned away from the subject).
• The computer tech should ensure that the data trace is correctly annotated with
<Subject’s name> Somatosensory cues.
• To deliver a somatosensory cue, under LabScribe Preferences, click on “Sequences”.
Choose the sequence called “Visual and/or Somatosensory”.
Human Psychophysiology – Multisensory Reaction Times – Labs HP-11-8

• Attach electrodes to the subject’s forearm.
• Before acquiring data with LabScribe you will need to adjust the amplitude of the
stimulus to the point where the subject can just feel the stimulus, but does not
experience a “shock”.
• When using the SI-200, make sure the stimulator is “ARMED”. The dial for the
SI-200 is in milliamps of current, so a very low amplitude stimulus (1 milliamp
or so) will probably be sufficient.
• Click the Record button on LabScribe to run the sequence. While the sequence is
running, if needed adjust the current on the stimulator until the subject reports
that they can feel the stimulus, but that it is not painful. You are now ready to
record reaction times for the somatosensory stimulus.
2. Click the record button on LabScribe to run the sequence.
Data Analysis
1. Use the same technique explained in Exercises 1 and 2 to measure and record the reaction times
of the subject presented with somatosensory stimuli.
2. Enter the mean reaction time for this exercise in Table HP-11-L1.
Table HP-11-L1: Mean Reaction Times for Different Cues.
Cue
Mean Reaction
Time of Your
Subject (ms)
Mean Reaction
Time of All
Subjects (ms)
Shortest Mean
Reaction Time in
Class (ms)
Longest Mean
Reaction Time in
Class (ms)
Visual
Auditory
Somatosensory
Hypothesis
Human Psychophysiology – Multisensory Reaction Times – Labs HP-11-9

Day 3 - Creating your Own Multisensory Reaction Experimental Procedure
Aim: To design your own multisensory reaction time experiment.
Procedure
1. Discuss with your group members and design your own multisensory reaction experiment.
2. Now that you’ve completed some basic experiments, brainstorm factors that could influence
reaction times to unimodal as compared to multimodal stimuli. Then, devise hypotheses and
experimental protocols to test at least one of these factors.Include an educated guess as to where
in the nervous system this factor exerts its effect.
3. Create one (or more if necessary) hypotheses for your multisensory experiment – how will each
factor affect reaction time? Produce a sentence or two with an educated guess as to where in the
nervous system you think these factors are exerting their effects and how (changing synaptic
interactions in some way?).
4. Create an experimental protocol – a set of instructions that is detailed enough so that anyone
else who reads your protocol could perform your experiment. In your proposal, be sure to
indicate:
• How many experimental subjects will you use? Since the class is small, you will
probably need to recruit all your fellow students plus the TAs as subjects.
• How many replicates will you perform on each subject?
• What are your control experiments?
• What equipment do you need?
• How will you graph and analyze the data?
5. Perform your experiment and present your findings as required by your professor.
Suggestions for multisensory experiments:
• Experiment with the effect of predictable cues (e.g., every 5 seconds) vs. cues at randomly
spaced intervals. Do you observe any learning effects? In other words, do your subjects‘
reaction times shorten with repeated trials, especially if the cues are predictably spaced?
• Is there a difference between reaction time to visual as compared to auditory and somatosensory
stimuli? In other words, does sensory modality affect reaction time?
• How does the reaction time to bimodal stimuli compare with unimodal or even trimodal
stimuli? Is there a particular combination of sensory modalities that produces the
shortest/longest reaction time (visual-auditory vs. visual-somatosensory for example)?
Creating your own Sequences and Settings Files in LabScribe
You can perform your experiments using the Settings file already created in LabScribe, but you may
want to design your own set of sequences for the presentation of stimuli. If so, you will need to create
at least one Settings file in LabScribe.
Human Psychophysiology – Multisensory Reaction Times – Labs HP-11-10

Creating Settings Files in LabScribe
Once you have chosen all the parameters for your settings file using the LabScribe-Preferences menus
(see below), Click “Save As”, choose your file location (on the Desktop or in a folder), then be sure to
choose the settings file extension (.iwxset) from the drop down menu at the bottom of the File screen.
When you want to use your settings file, you MUST launch LabScribe from your settings file.
Creating Your Own Sequences in LabScribe
The easiest way to do this is to add a new Sequence to the settings file “SomatosensoryReflexes”,
and then rename and resave the settings file. The SomatosensoryReflexes settings file already has
the Stimulator settings needed to control the stimulator for your experiments. Refer Figure HP-11-L5
and Figure HP-11-L6:
1. Go to Edit – Preferences – Sequences.
2. Select “New”, then type a new name for your sequence in the box.
3. The “Wait” button sets the delay before a stimulus is presented.
• Select “sec” (default is in msec), then the number of seconds you want for a delay, then
click “Wait”. The wait time will appear in the Sequence window.
4. Click on “Fire”, then the “Add State to Sequence” button – this will signal the stimulator to
produce a pulse, which will show up on the recording screen as a square wave.
5. If you want to add a computer generated tone to your Sequence, scroll down the list of states on
the left side of the Sequence menu to find Sound.wav files.
• Click on any of the Sound files shown (they will all play the same tone), then “Add State
to Sequence”.
6. Continue adding “Wait ____ sec” states, “Fire” commands and Sound.wav states to your
sequence. When you are finished click “OK”, then be sure to save the Settings file again.
7. If you want to change the sound the computer makes, several different sounds are available
as .wav files on your computer or your can look online and save the .wav files to your
LabScribe folder.
Human Psychophysiology – Multisensory Reaction Times – Labs HP-11-11
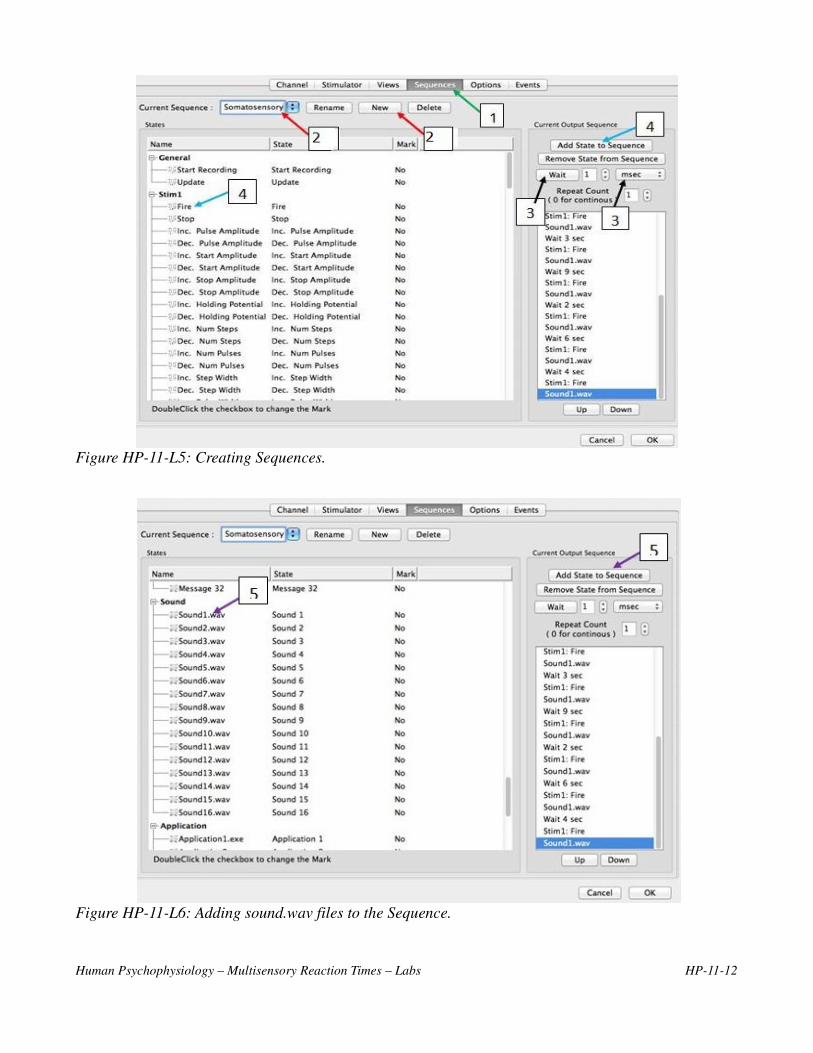
Figure HP-11-L5: Creating Sequences.
Figure HP-11-L6: Adding sound.wav files to the Sequence.
Human Psychophysiology – Multisensory Reaction Times – Labs HP-11-12
Experiment HP-11: Multisensory Reaction Times
Lab written and contributed by: Tracy M. Hodgson, Program in Biological Sciences, Northwestern
University, Evanston, IL and Martha Cammarata, Department of Biology, North Park University,
Chicago, IL
Background
Using Human Reaction Time to Investigate Multisensory Integration
Nearly every experience we have in life is a multisensory one. Understanding speech involves not only
listening but also watching the lips and face of the speaker. The enjoyment of food involves all of the
senses, not just taste. This laboratory exercise will explore how our brains respond to multisensory
stimuli by measuring the reaction time to a stimulus from one sensory modality (a visual, auditory or
somatosensory stimulus presented alone), and comparing it to the reaction time to combinations of two
or three sensory modalities presented simultaneously.
Sensory neurons from all the senses, except olfaction, synapse with interneurons in the thalamus, a
structure in the midbrain. Some neurons in the thalamus respond to stimuli from one sensory modality
only whereas others respond to multisensory stimuli. The thalamus participates in the generation and
control of eye and head movements that turn our attention toward interesting sensory stimuli. Sensory
information then travels from the thalamus to areas within the cortex, where there are other neurons
that respond to only one sensory modality (in the visual or auditory cortex, for example), and
multisensory neurons in association cortex. These multisensory neurons have been shown to respond
best to simultaneous inputs from more than one sensory modality, and allow us to associate various
types of sensory information with an “idea”, for example: the sight of a tool + the sound of pounding =
“hammer”.
The multisensory neurons in the thalamus and association cortex help determine what sensory
information is relevant, and what can be ignored. A weak sensory stimulus from one sensory modality
produces a small response, whereas two weak stimuli occurring together in time and space will produce
a much stronger response. Research has shown that these types of neurons follow 3 “rules” when
responding to stimuli from more than one sensory modality:
1. Spatial rule: The sensory stimuli must be close together in space (have overlapping receptive
fields)
2. Temporal rule: The sensory stimuli must occur close together in time
3. Superadditivity rule: The response of a multisensory neuron to the simultaneous input from two
or more weak stimuli is greater than the sum of the responses to each weak stimulus alone.
For example, imagine you are in the park talking with a friend when you see a dog approaching you out
of the corner of your eye. You continue to talk to your friend until you hear barking near you. Your
head turns toward the sound of the barking and the sight of the dog running toward you, causing you to
lose track of what your friend is saying. This scenario is illustrated in the figure on the next page, along
with the graded potentials and action potentials produced by a multisensory neuron in the thalamus.
Human Psychophysiology – Multisensory Reaction Times – Background HP-11-1
In this lab you will design your own experiments to measure human reaction time to stimuli from one
sensory modality (auditory, visual or somatosensory) as compared to combinations of two or three
stimuli presented simultaneously (multisensory stimuli).
1. How does the combination of more than one sensory modality affect reaction time?
2. Do certain combinations of stimuli produce a reaction time that is slower or faster than the sum
of the reaction times to each sensory modality presented on its own?
3. Does it make a difference if the interstimulus intervals are predictable or random?
4. Can human reaction time be used to demonstrate the spatial, temporal and superadditivity rules
of multisensory neurons?
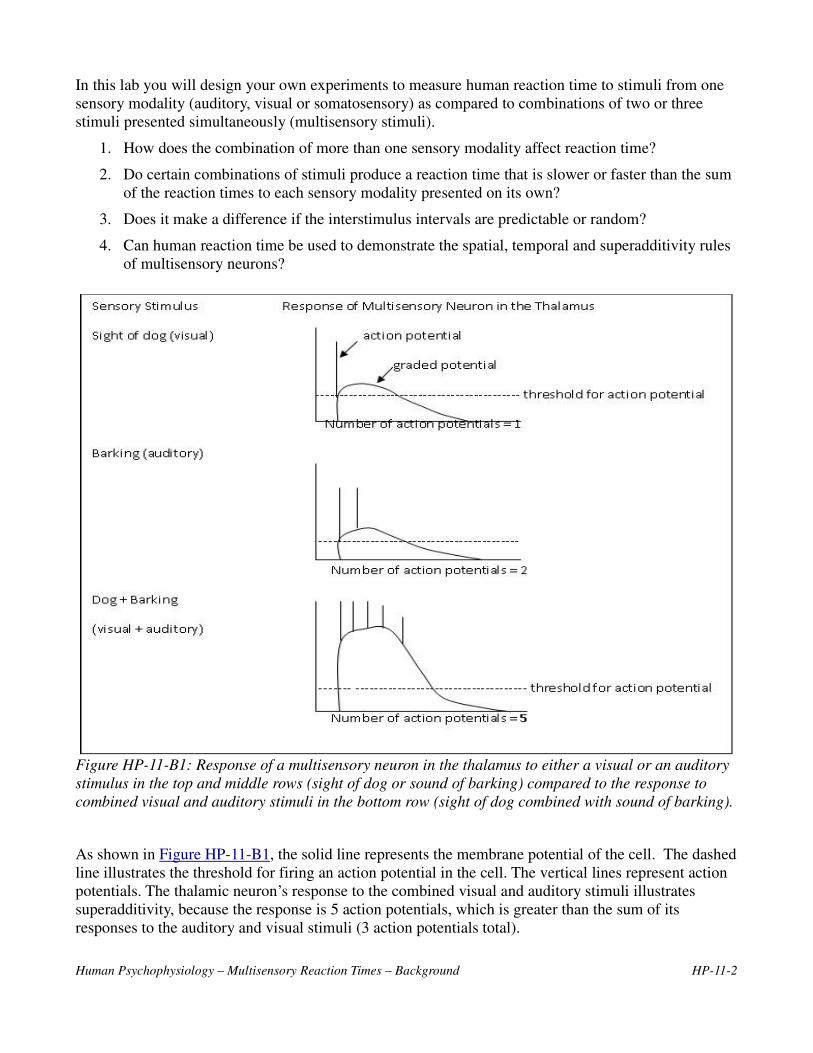
Figure HP-11-B1: Response of a multisensory neuron in the thalamus to either a visual or an auditory
stimulus in the top and middle rows (sight of dog or sound of barking) compared to the response to
combined visual and auditory stimuli in the bottom row (sight of dog combined with sound of barking).
As shown in Figure HP-11-B1, the solid line represents the membrane potential of the cell. The dashed
line illustrates the threshold for firing an action potential in the cell. The vertical lines represent action
potentials. The thalamic neuron’s response to the combined visual and auditory stimuli illustrates
superadditivity, because the response is 5 action potentials, which is greater than the sum of its
responses to the auditory and visual stimuli (3 action potentials total).
Human Psychophysiology – Multisensory Reaction Times – Background HP-11-2