
Experiment, Explore, Design: A Sensor Based … an initial, guided experimental component, in which...
14
AC 2007-1630: EXPERIMENT, EXPLORE, DESIGN: A SENSOR-BASED INTRODUCTORY ECE LABORATORY Lisa Huettel, Duke University LISA G. HUETTEL, Ph.D., is an Assistant Professor of the Practice and Director of Undergraduate Laboratories in the Department of Electrical and Computer Engineering at Duke University. Her research interests include engineering education and the application of statistical signal processing to remote sensing. She received her M.S. and Ph.D. in Electrical Engineering from Duke University. Kip Coonley, Duke University KIP D. COONLEY, M.S., is the Undergraduate Laboratory Manager in the Department of Electrical and Computer Engineering at Duke University. His interests include undergraduate engineering education, power electronics, plasma physics, and thin-films. He received his M.S. in Electrical Engineering from Dartmouth College. Michael Gustafson, Duke University MICHAEL R. GUSTAFSON II, Ph.D., is an Assistant Professor of the Practice in the Department of Electrical and Computer Engineering at Duke University. His research interests include linear and non-linear control systems as well as curriculum development. He received his Ph.D. in Mechanical Engineering from Duke University. Jungsang Kim, Duke University JUNGSANG KIM, Ph.D., is an Assistant Professor in the Department of Electrical and Computer Engineering at Duke University. His research interests include quantum information science, photonic devices, micro and nano fabrication technologies, and MEMS technologies. He received his Ph.D. from Stanford University. Gary Ybarra, Duke University GARY A. YBARRA, Ph.D., is a Professor of the Practice in the Department of Electrical and Computer Engineering at Duke University. His research interests include K-12 engineering outreach, engineering education, microwave imaging and electrical impedance tomography. He received his Ph.D. in Electrical and Computer Engineering from North Carolina State University. Leslie Collins, Duke University LESLIE M. COLLINS, Ph.D., is an Associate Professor in the Department of Electrical and Computer Engineering at Duke University. Her research interests lie in physics-based statistical signal processing with applications in remote sensing and auditory prostheses. She received her Ph.D. in Electrical Engineering: Systems from the University of Michigan. © American Society for Engineering Education, 2007 Page 12.718.1
Transcript of Experiment, Explore, Design: A Sensor Based … an initial, guided experimental component, in which...

AC 2007-1630: EXPERIMENT, EXPLORE, DESIGN: A SENSOR-BASEDINTRODUCTORY ECE LABORATORY
Lisa Huettel, Duke UniversityLISA G. HUETTEL, Ph.D., is an Assistant Professor of the Practice and Director ofUndergraduate Laboratories in the Department of Electrical and Computer Engineering at DukeUniversity. Her research interests include engineering education and the application of statisticalsignal processing to remote sensing. She received her M.S. and Ph.D. in Electrical Engineeringfrom Duke University.
Kip Coonley, Duke UniversityKIP D. COONLEY, M.S., is the Undergraduate Laboratory Manager in the Department ofElectrical and Computer Engineering at Duke University. His interests include undergraduateengineering education, power electronics, plasma physics, and thin-films. He received his M.S. inElectrical Engineering from Dartmouth College.
Michael Gustafson, Duke UniversityMICHAEL R. GUSTAFSON II, Ph.D., is an Assistant Professor of the Practice in theDepartment of Electrical and Computer Engineering at Duke University. His research interestsinclude linear and non-linear control systems as well as curriculum development. He received hisPh.D. in Mechanical Engineering from Duke University.
Jungsang Kim, Duke UniversityJUNGSANG KIM, Ph.D., is an Assistant Professor in the Department of Electrical and ComputerEngineering at Duke University. His research interests include quantum information science,photonic devices, micro and nano fabrication technologies, and MEMS technologies. He receivedhis Ph.D. from Stanford University.
Gary Ybarra, Duke UniversityGARY A. YBARRA, Ph.D., is a Professor of the Practice in the Department of Electrical andComputer Engineering at Duke University. His research interests include K-12 engineeringoutreach, engineering education, microwave imaging and electrical impedance tomography. Hereceived his Ph.D. in Electrical and Computer Engineering from North Carolina State University.
Leslie Collins, Duke UniversityLESLIE M. COLLINS, Ph.D., is an Associate Professor in the Department of Electrical andComputer Engineering at Duke University. Her research interests lie in physics-based statisticalsignal processing with applications in remote sensing and auditory prostheses. She received herPh.D. in Electrical Engineering: Systems from the University of Michigan.
© American Society for Engineering Education, 2007
Page 12.718.1

Experiment, Explore, Design:
A Sensor-based Introductory ECE Laboratory
Abstract
A new introductory course, Fundamentals of Electrical and Computer Engineering (ECE), has
been designed to provide a rigorous, integrated introduction to the ECE field. The course
laboratory, described in this paper, both promotes concept integration and provides a mechanism
by which students can explore applications. Consistent with the curricular theme of Integrated
Sensing and Information Processing (ISIP), a microcontroller-based robotic platform that
includes a suite of sensors was selected as the foundation of all laboratory exercises. To develop
both the students’ conceptual understanding and their design skills, each laboratory session
includes an initial, guided experimental component, in which basic concepts are investigated,
and a subsequent open-ended exploration component, during which students are challenged to
design a robot that completes a real-world task. After students complete a series of eight such
laboratory sessions, the experience culminates in a five-week Integrated Design Challenge
(IDC). To successfully complete the IDC, students have to go beyond the knowledge developed
in previous weekly laboratory activities, assimilating new knowledge and using new sensors or
processing data in new ways. The IDC is structured to not only emphasize technical
accomplishments, but also to promote the development of project management, team
organization, and communication skills.
This paper elaborates on the philosophy behind the design of the laboratory experience, describes
specific laboratory activities (including the IDC), and provides an assessment of the course based
on data from several semesters. These data indicate that the more integrative, design-oriented,
sensor-based approach benefits students in a variety of ways such as reinforcing fundamental
concepts, motivating the study of ECE, and providing an opportunity to develop creative
problem solving skills. In addition, the laboratory experience has been shown to have a
significant positive impact on the achievement of several ABET criteria.
1. Introduction
As part of broad curriculum reform, a new introductory course entitled Fundamentals of
Electrical and Computer Engineering has been developed and established as the cornerstone of
the ECE curriculum at Duke University. The Fundamentals course introduces core concepts that
span all of ECE: how to interface with the physical world; how to transfer and transmit energy
and information; and how to extract, analyze, and interpret information. These concepts are
developed within the context of the curricular theme of Integrated Sensing and Information
Processing (ISIP), introducing the framework that provides a roadmap for the remainder of the
curriculum.
Key findings in engineering education literature have shown that both student interest and
pedagogical effectiveness are increased when students have the opportunity to solve practical
problems, particularly when those problems are presented within open-ended design challenges1-
5. Thus, two primary curricular objectives of the Fundamentals course are to link theoretical
Page 12.718.2

concepts to real-world applications and to provide design experience early in the curriculum.
Key to achieving these objectives is the laboratory experience, which occurs in weekly, 3-hour
sessions that complement the twice-a-week, 75-minute lectures.
This paper describes the “Experiment, Explore, Design” approach used in the laboratory to
challenge students to integrate and apply new knowledge in the service of realistic design
problems. First, the overall philosophy of the approach is described, along with the key goals for
each of the three components. Next, a set of specific examples are provided to illustrate how
exercises have been implemented and how the laboratory differs from a traditional approach.
Finally, assessment results are presented that indicate the success of the approach in improving
student confidence and understanding, increasing student interest and motivation, and meeting
several ABET criteria.
2. Laboratory Philosophy
Many introductory ECE courses include a hands-on laboratory experience. Most often, the
constituent experiments consist of step-by-step progressions through exercises that enable
students to observe or verify fundamental concepts. While this approach can be an effective
method of teaching and reinforcing theoretical concepts, many students do not find it particularly
motivating or insightful.
To promote concept integration throughout the semester, all Fundamentals laboratory exercises
are based on a single platform. In selecting the platform, several criteria were critical. First, the
ideal platform would enable the exploration of a broad range of ECE concepts. Second, this
platform must be flexible to encourage the creativity inspired by open-ended problems. Third,
the platform had to easily interact with its environment to facilitate the exploration and solution
of real-world challenges. Finally, the platform must be easily connected to the ISIP curricular
theme. The Parallax BASIC Stamp microcontroller and robotic platform meet these criteria. This
platform has a broad variety of accessories (particularly sensors), yet remains simple to program
and operate. These characteristics allow students to focus on the sensors and system design,
rather than having to spend a disproportionate amount of their time programming the robot.
The laboratory experience for the Fundamentals course is organized into eight 1-week laboratory
experiments, followed by a 5-week Integrated Design Challenge. The more traditional, guided
experiment approach is still utilized in the 1-week laboratory sessions. However, these
experiments are supplemented by exploration activities which provide students an opportunity to
immediately apply the fundamental concepts that they have just investigated to solve a practical
challenge. Gradually, over the course of the first eight weeks, the emphasis of the laboratory
sessions shifts from guided experimentation to self-directed exploration. This evolution prepares
students for the final test of their knowledge and skills: the Integrated Design Challenge.
2.1. Experiment
Our first goal is for students to verify fundamental theories and to validate key concepts through
experimentation. We recognize that few of our students will have prior experience with – or even
good intuitions about – experimental testing of ideas. Instead, they are more used to having key
information given to them by their instructors. In our view, this makes it more important, not
Page 12.718.3
less, that the students learn basic engineering principles by a process of discovery. A key role of
the instructors is that of a guide: they lead the students by indicating what observations need to
be made, but the students collect the data themselves.
2.2. Explore
A second aspect of our philosophy is that laboratory activities should be open-ended, not fully
specified, so that students ask their own questions. This emphasis has several advantages. Most
notably, it requires students to take fundamental concepts from laboratory and find their practical
uses. As they make such links, students will be increasingly motivated and excited by the
laboratory, feeling a real sense of accomplishment. Furthermore, the students not only build
something that works in each exercise, but they also develop specific skills (and learn about
specific sensors within the ISIP theme) that increase their capabilities for solving the Integrated
Design Challenge.
2.3. Design
Finally, we want to include real design problems in the laboratories. To solve problems
effectively, students are challenged to integrate simpler components into a more complex project.
Laboratory design projects also provide an opportunity for engineering students to develop non-
technical skills: how to manage a complex project, how to cooperate with other students (and
compete with other teams), and how to solve short-term problems while considering long-term
goals and constraints. These skills are critical for success in real-world engineering
environments.
3. Illustrative Examples
In this section, several laboratory experiments are described in detail in order to illustrate how
the pedagogical philosophy and objectives discussed in Section 2 were implemented. The
evolution from Experiment, to Exploration, to Design is also highlighted through these examples
taken from the beginning (Laboratory #2), middle (Laboratory #5), and end (Integrated Design
Challenge) of the semester.
3.1. Exploring Digital Logic: A Scrolling Display
Exploring Digital Logic is the second laboratory exercise that students perform. Students come
to this laboratory session having been introduced to basic circuit variables and circuit elements
(current, voltage, independent sources, and resistors), Ohm’s Law, logic gates and functions, and
logic function minimization and implementation.
In the context of the overall laboratory experience, the goals of this laboratory session include
introducing students to the Parallax platform (microcontroller and PBASIC programming) and
introducing them to a display device that could be generally used to convey information (e.g.,
about the state of the robot or a decision that had been made). Within this broader context, the
laboratory exercises have specific goals related to the fundamental theories and concepts that
have been introduced in the lecture. In service of these goals, after completing this laboratory
exercise, students are expected to be able to:
‚ Construct and minimize two- and three-variable logic functions,
Page 12.718.4
‚ Design, model, and build logic circuits with up to three input variables and seven output
variables using a fixed number of TTL gates and,
‚ Design, model, and build logic circuits to drive a standard 7-segment display.
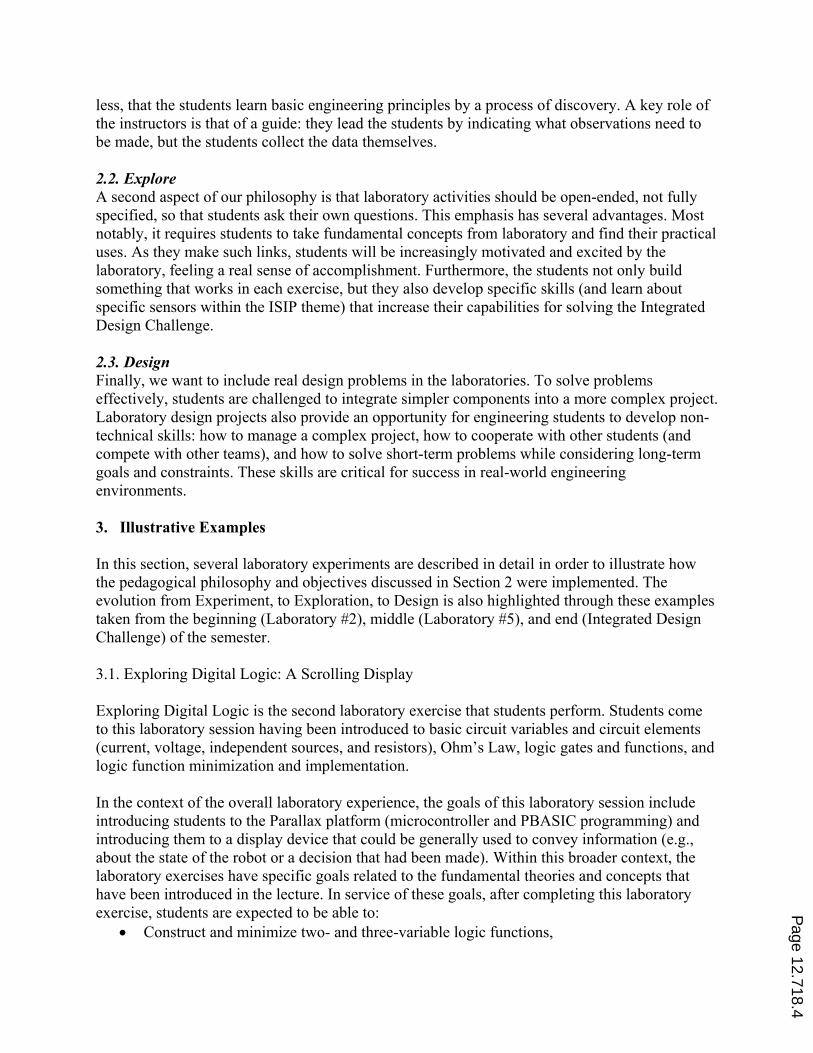
The Experimental section of this laboratory exercise begins with an introduction to the Digital
Logic Trainer board (shown in Figure 1), on which students will construct their first project.
Care is taken to describe each component and feature of the board: input devices (pushbutton,
rocker switches), output devices (LEDs, speaker), the microcontroller and logic ICs, graphical
depictions of various logic gates and how to relate the images to the actual electrical connections,
and the breadboard workspace.
FIGURE 1. The Parallax Digital Logic Trainer board.
The first experimental activity is an investigation of basic logic gates: AND, OR, and NOT. By
this time, students have a theoretical understanding of the operation of these gates, having
derived truth tables in lecture. In this activity, students wire up pushbuttons to the input(s) of
each gate and connect the output of the gate to an LED. Stepping through all possible input
combinations, the truth table for each gate is verified. This not only reinforces the theoretical
concepts, especially for those students who have a more sensory, active learning style, but
introduces students to wiring and illustrates how a simple device such as an LED can be very
useful in verifying circuit operation and in debugging a circuit.
In order to complete the Exploration component of this laboratory exercise (a scrolling 7-
segment display), students must be able to use the microcontroller, rather than the pushbuttons,
to control the gate inputs. Thus, in the next experiment, students build a simple counter (to scroll
through the “frames” of the display) using the microcontroller. The microcontroller is
programmed (using PBASIC) to toggle two LEDs to indicate the current (binary) count, starting
with a one-bit counter (LED on or off) and followed by an expansion to a two-bit counter. As
students do not yet have experience programming the microcontroller, the simple code is
provided for them, along with a detailed explanation of each command. In this way, students are
gradually introduced to various PBASIC commands so that eventually they are able to program
the microcontroller independently.
Page 12.718.5
At this point, students are familiar with the operation of the basic logic gates and have built a
simple two-bit counter. The next step is to combine these fundamental pieces to implement a
useful application: a scrolling 7-segment display. After being provided with some background on
the functioning of a 7-segment display, students are guided through an exercise in which they
build a circuit that scrolls the letters “E”, “C”, and “E” across the display. Throughout this part of
the exercise, students are provided with significant guidance to aid them in learning how to
approach the solution of a problem. However, later in the Exploration section, students are
expected to extend what they have learned through this guided experiment to implement a
related, but much more challenging project.
The first step in the problem is to derive the logic needed to display each character. Since there
are four characters (“E”, “C”, “E”, and a blank space), the two-bit counter can be used to
determine which character to display. In other words, the counter can be used to tell the display
which of four “frames” to display. This observation immediately links the prior development of a
counter to the current project goal. Next, it is necessary to derive the logic required to display a
particular character in a given frame (i.e., which of the 7 segments should be on for each letter?).
This leads to the derivation of the following table:
Frame Character P13 P12 A B C D E F G H
0 E 0 0 1 0 0 1 1 1 1 0
1 C 0 1 1 0 0 1 1 1 0 0
2 E 1 0 1 0 0 1 1 1 1 0
3 space 1 1 0 0 0 0 0 0 0 0
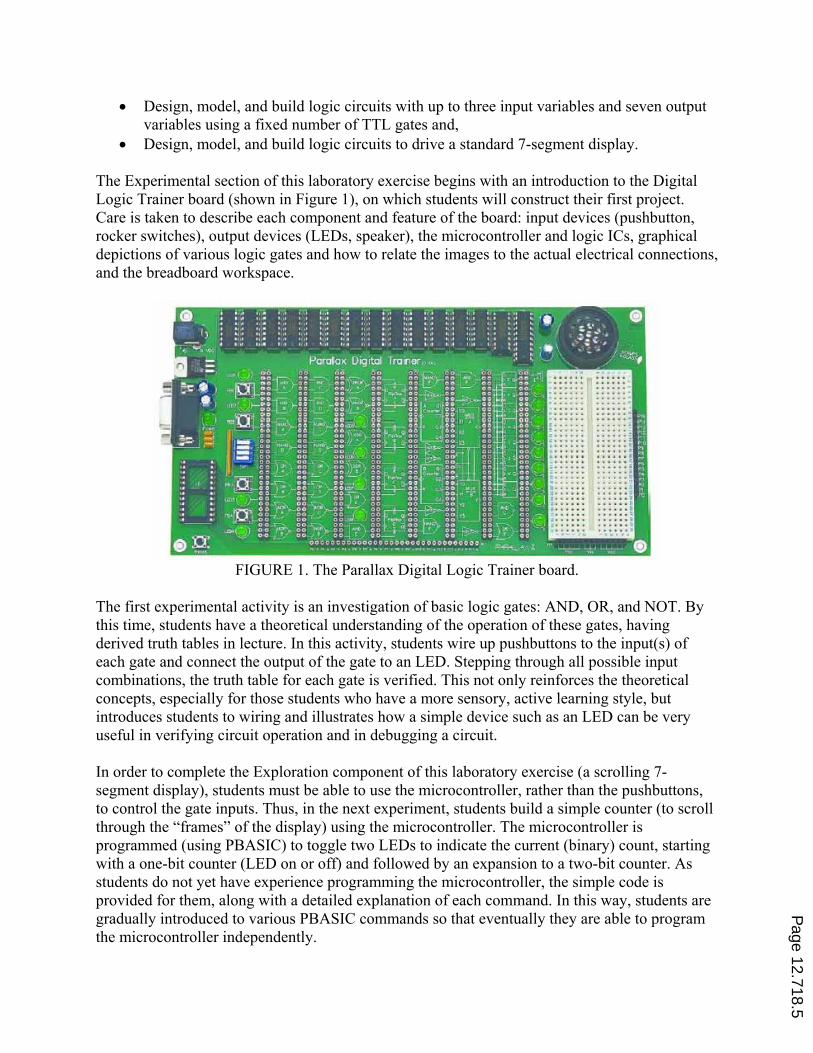
Note that P13 and P12 are the output pins of the microcontroller (used in the two-bit counter)
and the letters A-H correspond to the 7 segments of the 7-segment display. At this point, students
have the opportunity to apply another theoretical concept introduced in lecture: logic function
minimization, specifically using Karnaugh maps. Students are given a jump-start on this process
by providing them with the maps for segments A through D (such as the one shown in Figure 2),
but are expected to build the maps for the remaining segments on their own. This approach is in
keeping with the philosophy behind the Experimental section of the laboratory exercise of
providing students with significant guidance regarding implementation and observations to aid
them in developing their problem solving skills, which student must then apply to a more open-
ended challenge, with little guidance, in the Exploration section of the exercise.
FIGURE 2. Karnaugh maps for segments A through D.
Students are told that the next step is to minimize the logic for each segment to derive eight logic
functions. The result for one segment is provided to them. Armed with this set of functions,
Page 12.718.6

students are ready to build the scrolling display using the basic logic gates of the Digital Trainer
Board and the two-bit counter which was previously built. In the end, students are rewarded with
a scrolling display that demonstrates a practical application of many of the fundamental concepts
of digital logic.
Having been guided through the solution to a two-bit counter-controlled scrolling display,
students are asked to apply what they have learned to build a display that scrolls the word
“robocoP” (or other seven-letter word of their choosing, provided there are sufficient gates on
the Digital Logic Trainer board to implement). As “robocoP” requires six different characters
(including a space) over eight frames, the two-bit counter must be extended to a three-bit
counter. As before, a truth table, the logic for each segment, and the minimized functions must
be derived and then implemented using the microcontroller and logic gates. As this is one of the
first Exploration activities of the semester, this exercise is an extension of the Experimental
activities to a more difficult version of the same application, rather than the use of fundamental
concepts to solve an entirely new challenge, as is expected in later Explorations (such as the
Tune Generator described in Section 3.2). However, in keeping with the overarching goals of the
Exploration component, it does begin to establish the expectation that students will be able to
apply the concepts and problem solving approach they have learned with relatively little
guidance, provides a motivating practical application, and is open-ended enough that student
creativity and curiosity are encouraged.
3.2. A Light-Controlled Tone Generator
By the time students reach the fifth laboratory exercise, A Light-Controlled Tone Generator, they
have studied basic circuit devices and analysis, as well as digital logic. In the laboratory, they
have progressed from implementing gate-level logic to drive LEDs and seven-segment displays
(as described in Section 3.1), to building and testing systems that use input from a variety of
sensors (e.g., temperature, pressure, and tactile sensors) to control the output response of the
system (e.g., LEDs and seven-segment displays). Each week, the Experiment has focused on a
set of fundamental concepts while the Exploration has strived to provide an opportunity for
students to both apply new concepts and integrate all that has been learned previously.
The conceptual focus of the Light-Controlled Tone Generator is RC circuit design and analysis
and time-varying signals. In addition, this laboratory exercise introduces students to a new sensor
(a photoresistor) and a new output device (a piezoelectric speaker). After performing this
laboratory exercise, students are able to:
‚ Explain what an RC time constant is and how it is determined in a circuit,
‚ Construct and perform a threshold detection using a photoresistor-based detection circuit,
‚ Explain how a piezoelectric device can be used to generate sounds, and
‚ Design a system which causes the BOE-Bot to respond to changes in light levels.
The Experimental section of this laboratory exercise begins with an investigation of the
piezoelectric speaker. The speaker was used in previous laboratory sessions, but the device was
treated as a black box and its functionality was not explored. With the introduction of sinusoidal
signals and frequency in lecture, students now have the background needed to understand how
the speaker operates. Students are introduced to a new PBASIC command which generates a
Page 12.718.7

sinusoidal signal and must determine the meaning of each parameter (Duration and Frequency)
and write a program to generate tones of varying duration and frequency.
The second phase of the Experimental section involves the analysis of a series RC circuit. In
lecture, a simple RC circuit has been analyzed and concepts such as the response to a time-
varying signal and the time constant have been introduced and derived. Students choose a
resistor and capacitor and calculate the theoretical value of the time constant for their series
circuit. Using the function generator and oscilloscope (which were introduced in the previous
laboratory session), a square wave signal is used as the input to the RC circuit and the
oscilloscope is used to monitor and measure both the input voltage signal and the voltage across
the capacitor. Students verify that the circuit input is a square wave and then observe that the
output voltage (across the capacitor) is no longer square. Rather, the sharp edges have been
replaced by an exponential rise and fall (as seen in Figure 3). Using the output waveform,
students calculate the experimental value of the RC time constant and compare this to the
theoretical valued computer earlier.
FIGURE 3. (a) Square wave input and (b) voltage across the series resistor (dashed line) and
series capacitor (solid line), used as basis for measuring the RC time constant.
Students further explore the RC time constant and response of the circuit to a square wave by
varying the frequency of the input signal. Students observe that as the frequency of the square
wave increases, the maximum amplitude of the voltage across the capacitor decreases. However,
the rate of rise and decay (i.e., the time constant) does not change. Although the concept of
frequency response has not yet been introduced in class at this point in the semester, this
exercise, couched in terms of the RC time constant and focused on time-domain waveform
observations, provides a nice reference point and bridge to this topic when it is presented in the
subsequent lecture.
The third area of experimentation in this laboratory session is the building and testing of a
photoresistor circuit. To facilitate later integration of this sensor with the autonomous robot that
will be built for the Integrated Design Challenge, the photoresistor is introduced in the context of
robotic “eyes”. Students first build a simple circuit with two resistors in series (a photoresistor
followed by a fixed resistor), using the voltage measured across the fixed resistor as the input to
the microcontroller. Students are reminded of the concept of voltage division introduced earlier
in the semester and are asked to calculate the voltage across the fixed resistor in terms of R, the
Page 12.718.8

variable resistance of the photoresistor. Students combine this with their knowledge of the
threshold voltage of the microcontroller’s I/O pins and observe that as the light intensity varies
(thereby changing the resistance of the photoresistor), the logic state of the I/O pin should be
either 1 (when there is much light) or 0 (when little light is detected by the photoresistor). Using
a piezospeaker which turns on and off depending on the state of the I/O pin, this theoretical
observation is confirmed.
Students are led to observe one limitation of the previous circuit: the microcontroller can only
determine if the light level is above or below a threshold. In the subsequent experiment, the
circuit is modified by removing the fixed resistor and placing a capacitor in parallel with the
photoresistor. The result is a circuit with a light level-dependent RC time constant. The I/O pin is
set to measure the voltage across the capacitor. However, a new command is introduced,
RCTIME, which measures the RC decay time of a circuit by applying a high (5V) voltage to
charge the capacitor, then measures the time it takes for the voltage to decay to the threshold
voltage (1.4V). Since the resistance of the photoresistor, and therefore the RC time constant,
varies with light level, it is now possible for the microcontroller to know more about the light
level in its environment, going beyond the binary states of greater than or less than a threshold.
Having experimented with the piezospeaker, a photoresistor, and RC series and parallel circuits,
the students are prepared to embark on the Exploration component of this laboratory exercise. In
contrast to the Scrolling Display Exploration (described in Section 3.1), this Exploration requires
students to tackle a challenge that is more than just a more difficult version of the Experiment. In
this Exploration, students are challenged to build a BOE-Bot that “sings”. Moving one step
closer to the open-endedness of the Integrated Design Challenge, the only information provided
to the students is the following set of design specifications:
‚ The frequency of the tone generated by the speaker should be proportional to the intensity
of light.
‚ The frequency of the tone generated by the speaker should not exceed 3000 Hz.
‚ The system should be designed such that the entire range of frequencies from 0 to 3000
Hz is generated as the intensity of light is varied.
Although the students have all the building blocks needed to complete the project, they quickly
realize the importance of carefully interpreting design specifications and the challenges of
system integration.
3.3. The Integrated Design Challenge: Mission Possible (Spring 2006)
The laboratory experience culminates in a 5-week design project, called the Integrated Design
Challenge (IDC). Over the preceding eight laboratory sessions, student have experimented,
verified, and explored a new set of fundamental concepts each week. In each session, new
sensors and I/O devices have been introduced in the context of these concepts. Students have
developed the skills needed to identify and define a problem and the technical knowledge (circuit
design and analysis, programming, debugging and troubleshooting) needed to tackle a more
challenging problem.
Page 12.718.9

FIGURE 4. Preliminary intelligence provided to student teams for the IDC.
The theme of the Spring 2006 IDC was “Mission Possible”. Students were informed on the first
day of the IDC that the school mascot had been kidnapped. They were provided with preliminary
intelligence (i.e., problem specification and constraints) that described the “compound” in which
the mascot was being held and the various obstacles that had to be overcome to safely rescue the
mascot (see Figure 4). Students were surveyed prior to the start of the IDC to determine their
strengths, weaknesses, and particular interests to aid the instructor in forming balanced sub-
teams (of 2 to 3 students) within each laboratory group.
The mission had four phases, to be sequentially completed by different robots, each requiring a
different set of sensors. Between phases, the robots had to communicate to indicate the
successful completion of one phase and signal the initiation of the next. Each phase was designed
so that there were multiple solutions, although in some cases, a particular solution may have
been better than all other alternatives. The phases were:
1. Perimeter Scouting. In Phase 1, the robot had to follow a black line on a white
background for approximately 15 feet around fixed obstacles, up and down hills, and
around sharp turns, stopping at the edge of a cliff. To solve the challenges of this phase,
students used IR emitter/detector pairs, in various configurations.
2. Disabling the Perimeter Security System. In Phase 2, the robot had to navigate
approximately 5 feet down a narrow hallway strewn with obstacles to locate and turn off
a bright incandescent light. Solutions to this problem included the use of tactile sensors
(whiskers), photoresistors, and IR sensors.
Page 12.718.10

3. Opening the Internal Vault. Once the security system of Phase 2 had been disabled, the
robot in Phase 3 had to locate the switch to open the internal vault, which was known to
be located in the coldest part of the room at the end of a 5 foot hallway. To accomplish
this task, students used photoresistors, tactile sensors, an LCD display, LEDs, and
Bluetooth communication.
4. Locating the Hidden Mascot. The fourth robot had to locate the mascot, which was
hidden in a magnetized trunk somewhere in a room measuring approximately 1.5’ by 5’
and avoid selecting the decoy (un-magnetized) trunk. Teams solved this problem using
magnets, a compass, IR sensors, and Bluetooth communication.
In addition to further developing the students’ technical skills through individual robot design,
inter-robot communication, and system integration, one goal of the IDC is for students to
develop project management and communication skills. Thus, a variety of deliverables were
required over the course of the IDC including:
1. Conceptual Design Written Report (Due in week 1). To emphasize the importance of
planning in the design process, each sub-team was required to present a conceptual
design to the instructor before they were allowed to begin actual construction of their
robot. This report included:
a. the problem statement in the students’ own words,
b. a list of objectives and deliverables,
c. a schedule with important milestones and task assignments (Gantt chart), and
d. a discussion of the requirements, constraints, alternatives considered, and
justification for the proposed design.
2. Preliminary Design Oral Presentation (Due in week 2). At the end of the second week,
each sub-team had to present a status report indicating the progress they had made,
challenges they had run in to in their design, and risks to successful completion of the
project. Prototypes could also be demonstrated. In addition to feedback on their technical
progress, students’ oral communication and presentation skills (including Questions and
Answers) and team functioning were assessed.
3. Individual and Team Robot Demonstrations (Due in weeks 3 and 4). The next two
weeks were devoted to refinement of design, construction, and testing of the robots.
4. Final Competition (Due in week 5). At the end of the fifth week, the final competition
between the two laboratory sections was held in public.
5. Final Written Report (Due in week 5). The final technical report was comprehensive,
including the conceptual design and design considerations, the technical details (with
documentation of hardware and software) of the solution implemented by the team, and
an analysis of the successes and failures of the design.
6. Final Oral Presentation (Due in week 5). As a team, the lab section made a final
presentation following the final competition. Students were evaluated primarily on their
skill in handling questions and in working as a team to produce a coherent oral
presentation.
7. Budget and Timeline reports (Due weekly). Each week, every group submitted an
updated budget for their design, as well as a current Gantt chart indicating progress.
Page 12.718.11

4. Assessment
The impact of the “Experiment, Explore, Design” approach to the laboratory experience in the
new Fundamentals course was evaluated both in absolute terms and relative to the traditional
introductory course, Introduction to Electric Circuits. The technique used for evaluation was the
student survey, of which two types were administered: post-laboratory and post-course. Data
from these surveys were also compared to normative data from previous offerings of the
Introduction to Electric Circuits course.
Students (NS06 = 19; NF06 = 39) were surveyed anonymously following each laboratory session
and at the end of the semester. The end-of-semester survey requested student feedback regarding
the extent to which the laboratory experience overall 1) contributed to their understanding of the
course material, 2) increased their interest in the course material, 3) was well-integrated with the
lectures, and 4) enabled them to think critically about course material. Individual end-of-session
surveys queried students as to the degree to which a particular laboratory exercise illustrated 1) a
real-world/practical application of theoretical concepts and 2) the ISIP curricular theme. The
results of these surveys (percentage of respondents who gave each answer) are presented in
Table I. Data for the first four questions were obtained from the end-of-semester survey (N =
41); the data for the fifth and sixth questions represent a weighted average compiled from all
end-of-laboratory session surveys (N = 285).
TABLE I. Assessment of laboratory experience: Percentage of student responses on end-of-semester survey (Q1-4, N = 41) and
end-of-session surveys (Q5-6, weighted average of N = 285).
Question SD D N A SA
Q1: Overall, this laboratory contributed to my knowledge of the subject. 1.8 0.0 9.0 40.3 48.9
Q2: Overall, this laboratory increased my interest in the subject. 4.2 5.4 10.8 21.7 57.9
Q3: The concepts and skills taught in laboratory were well integrated with those taught in class. 7.8 5.4 18.0 41.6 27.2
Q4: This laboratory helped me think critically about course material. 2.4 9.0 16.2 34.9 37.5
Q5: This laboratory exercise illustrated a real-world/practical application of theoretical concepts. 0.3 3.0 9.7 55.6 31.3
Q6: This laboratory exercise was clearly related to the curricular (ISIP) theme. 0.3 0.9 10.8 60.8 27.2
SD = Strongly Disagree, D = Disagree, N = Neither Agree nor Disagree, A = Agree, SA = Strongly Agree
The majority of students felt that the laboratory as a whole contributed to their conceptual
understanding and interest in the course material. In addition, most students also perceived that
the laboratory was well-integrated with the more theoretical view presented in lecture which
enabled them to think more deeply about the topics. Such positive results suggest high student
engagement in the course and significant learning enhancement taking place in the laboratory.
Furthermore, the high percentage of agreement that the course illustrates real-world applications
and is strongly tied to the Integrated Sensing and Information Processing (ISIP) curricular theme
signifies that this laboratory approach provides the desired motivation and thematic basis on
which to build in subsequent courses.
In addition to the student survey data presented above, a second comparative assessment was
conducted to assess the impact of the “Experiment, Explore, Design” approach. For this
evaluation, data collected from students enrolled in the Fundamentals course was compared to
data collected from students who had taken the more traditional Introduction to Electric Circuits
Page 12.718.12

course. As part of standard course assessment activities, the students are asked to rate, on end-of-
semester surveys, the degree to which they felt a course met specific Accreditation Board for
Engineering and Technology (ABET) criteria (listed in Table II). The data collected from
students in three semesters of Electric Circuits (N = 58) was compared to data from two
semesters of the Fundamentals course (N = 48). Because these students differed in several
factors, a regression analysis was conducted. Three factors were included as predictor variables:
course (the factor of interest), instructor, and semester. Student responses on the eleven ABET
criteria were used as dependent variables, using each student’s numerical response to each
question (from “1: Strongly Disagree”, through “5: Strongly Agree”). The regression analysis
examined whether each of the three predictor factors made an independent contribution to the
students’ ABET responses; i.e., whether the Fundamentals course made students more likely to
agree with a given criterion, even while controlling which instructor was teaching the course and
what semester the course was being taught. Because 33 separate statistical tests (3 predictors by
11 criteria) were conducted in this regression, the needed probability value to reach significance
was determined to be 0.05/33 Ã 0.0015.
The more design-focused approach was expected to be a more effective method for both
improving student understanding and motivation and for developing important skills such as
problem solving and teamwork. The regression analysis (see Table II) revealed that the
Fundamentals course was judged significantly better on three of the ABET criteria: “Design and
conduct experiments, and analyze and interpret data”, “Design a system, component, or process
to meet desired needs”, and “Function on a team” (all at a probability level, p, of ø 0.0015).
None of the three factors for any other question met the threshold for significance. This result
indicates that these three ABET criteria can be directly related to the design experience in the
Fundamentals course, while more general criteria (e.g., “Apply knowledge of math, science, and
engineering”) showed no significant difference between courses. Furthermore, the selective
results of the regression analysis eliminate the possibility that Fundamentals students simply
were more generous in their ratings than students in the other courses.
TABLE II. Assessment results for ABET criteria: p-values of regression factors.
ABET Criteria Semester Course Instructor
a) Apply knowledge of math, science, and engineering 0.18 0.01 0.72
b) Design and conduct experiments, and analyze and interpret data 0.12 0.00013 0.58
c) Design a system, component, or process to meet desired needs 0.75 < 1e-6 0.08
d) Function on a team 0.86 0.00015 0.97
e) Identify, formulate, and solve engineering problems 0.81 0.0026 0.78
f) Understand professional and ethical responsibility 0.22 0.47 0.27
g) Communicate persuasively, in writing and orally 0.54 0.04 0.85
h) Understand the impact of engineering solutions in global and societal context 0.10 0.21 0.91
i) Recognize the need for engaging in life-long learning 0.72 0.92 0.75
j) Know and understand contemporary issues 0.76 0.48 0.64
k) Use techniques, skills, and modern engineering tools necessary for
engineering practice 0.0021 0.0053 0.10
Page 12.718.13

5. Conclusions
The laboratory for the new introductory Fundamentals of ECE course has been designed to
provide a link between theory and practical applications and to develop a broad set of skills
through an approach emphasizing experimentation, exploration, and design. The success of this
laboratory is due, in part, to the use of sensors to facilitate the presentation of basic concepts in a
realistic framework. By challenging students to complete guided experiments and solve open-
ended problems, this laboratory serves to both reinforce fundamental concepts and motivate their
study. Based on assessment results from the first two offerings of Fundamentals, there is strong
evidence that the “Experiment, Explore, Design” approach effectively improves student
understanding, motivation, and design skills.
Bibliography
1. L. J. Shuman et al., “The future of engineering education,” in Proc. 32nd Annual Frontiers in Education
Conference, 2002.
2. B. Olds and R. Miller, “The effect of a first-year integrated engineering curriculum on graduation rates and
student satisfaction: A longitudinal study,” J. Engineering Education, pp. 23–36, Jan. 2004.
3. J. H. McLellan et al., “Using multimedia to teach the theory of digital multimedia signals,” IEEE Trans.
Education, pp. 336–341, Aug. 1996.
4. C. C. Munson, “Elements of a new Electrical Engineering curriculum at Illinois: A shift from circuits to signal
processing,” in Proc. 1995 IEEE Symp. Circuits and Systems, vol. 2, 1995, pp. 1–4Sf.
5. B. Masi, “The impact of faculty-mentored versus web-guided engineering design experience on freshman
skills,” in Proc. 2003 Annual Conference of the American Society of Engineering Education, 2003.
Page 12.718.14


![International Journal of Engineering...is investigated by M. Jafari et al. [8] using Lattice Boltzmann method. M.M. Heyhat and F. Kowsary[9] have used a two-component nonhomogeneous](https://static.fdocuments.us/doc/165x107/60d4e4c7901aa418633dedec/international-journal-of-is-investigated-by-m-jafari-et-al-8-using-lattice.jpg)


