
EXPERIENCES AND FIRST RESULTS OF THE OL3 INNER …
10
Transactions, SMiRT-23 Manchester, United Kingdom - August 10-14, 2015 Division VI, Paper ID 100 EXPERIENCES AND FIRST RESULTS OF THE OL3 INNER CONTAINMENT IN-SERVICE INSPECTION SYSTEM Burkhard Wienand 1 1 Civil Engineer Expert, AREVA GmnH, Offenbach, Germany ABSTRACT The prestressed Inner Containment of the OL3 EPR in Olkiluoto, Finland is equipped with an In-service Inspection (ISI) system. The inspection plan comprises the schedule for measurements at specified intervals during the containment operation time as well as criteria for assessment. The measurement results of the Initial Structural Integrity Test (ISIT) are decisive as precondition for the plants commissioning. The present paper describes the instrumentation and the evaluation of the measurement results since the installation of the ISI system. Valuable knowledge has already been gained in the prestressing phase by monitoring the containment deformations during tensioning of the different tendon groups. The comparison to precalculated results is illustrated. Since then, the long term deformation development has been pursued. The evaluation permits first assessments of the containment ageing behaviour. The applied prestressing system and the material parameters are elucidated as main influencing factors of concrete creep and shrinkage. Concerning the ISIT the ISI system requirements are illuminated. Results are indicated and compared to design calculation values. INNER CONTAINMENT STRUCTURE OVERVIEW The OL3 EPR Inner Containment is a prestressed concrete structure with a steel liner at the inner side. The containment has many openings. The 3 most important ones are the Equipment Hatch (EH) the Emergency Airlock (EA) and the Personnel Airlock (PA). The openings mark singular zones of the containment wall requiring special attention in stress and strain control. Concrete Structure The inner diameter of the cylindrical part is 46.8 m, the wall thickness 1.3 m. The dome wall thickness of the dome part is 1.0 m. Both parts are connected by a ring beam. The base slab is linked to the cylindrical part by the gusset area with increases wall thickness. The cylindrical part is equipped with 3 vertical prestressing ribs. Steel Liner The steel liner is 6 mm thick and is braced by meridian and tangential L-stiffeners. It is connected to the concrete by welded studs 8 mm in meridian and tangential distances of 150 mm. The liner is not considered as participating to the structural bearing capacity, but has only air tightness function. It was also used as inner formwork in construction time.
Transcript of EXPERIENCES AND FIRST RESULTS OF THE OL3 INNER …

Transactions, SMiRT-23
Manchester, United Kingdom - August 10-14, 2015
Division VI, Paper ID 100
EXPERIENCES AND FIRST RESULTS OF THE OL3 INNER
CONTAINMENT IN-SERVICE INSPECTION SYSTEM
Burkhard Wienand1
1 Civil Engineer Expert, AREVA GmnH, Offenbach, Germany
ABSTRACT
The prestressed Inner Containment of the OL3 EPR in Olkiluoto, Finland is equipped with an In-service
Inspection (ISI) system. The inspection plan comprises the schedule for measurements at specified
intervals during the containment operation time as well as criteria for assessment. The measurement
results of the Initial Structural Integrity Test (ISIT) are decisive as precondition for the plants
commissioning.
The present paper describes the instrumentation and the evaluation of the measurement results since the
installation of the ISI system. Valuable knowledge has already been gained in the prestressing phase by
monitoring the containment deformations during tensioning of the different tendon groups. The
comparison to precalculated results is illustrated.
Since then, the long term deformation development has been pursued. The evaluation permits first
assessments of the containment ageing behaviour. The applied prestressing system and the material
parameters are elucidated as main influencing factors of concrete creep and shrinkage.
Concerning the ISIT the ISI system requirements are illuminated. Results are indicated and compared to
design calculation values.
INNER CONTAINMENT STRUCTURE OVERVIEW
The OL3 EPR Inner Containment is a prestressed concrete structure with a steel liner at the inner side.
The containment has many openings. The 3 most important ones are the Equipment Hatch (EH) the
Emergency Airlock (EA) and the Personnel Airlock (PA). The openings mark singular zones of the
containment wall requiring special attention in stress and strain control.
Concrete Structure
The inner diameter of the cylindrical part is 46.8 m, the wall thickness 1.3 m. The dome wall thickness of
the dome part is 1.0 m. Both parts are connected by a ring beam. The base slab is linked to the cylindrical
part by the gusset area with increases wall thickness. The cylindrical part is equipped with 3 vertical
prestressing ribs.
Steel Liner
The steel liner is 6 mm thick and is braced by meridian and tangential L-stiffeners. It is connected to the
concrete by welded studs ! 8 mm in meridian and tangential distances of 150 mm. The liner is not
considered as participating to the structural bearing capacity, but has only air tightness function. It was
also used as inner formwork in construction time.
23rd Conference on Structural Mechanics in Reactor Technology
Manchester, United Kingdom - August 10-14, 2015
Division VI
Prestressing System
The containment is prestressed with 3 tendon groups: horizontal, pure vertical and gamma tendons. 119
horizontal tendons are aligned around the whole perimeter of the cylindrical part. 47 pure vertical tendons
are arranged in the cylindrical part. 104 gamma tendons are aligned from the prestressing gallery up to the
ring beam and once over the dome. All tendons are installed inside of tendon ducts which are injected
with grout, except of 4 pure vertical tendons which are injected with wax for measurement purposes. A
more comprehensive description is provided in [1]. The achieved initial average concrete compression
after prestressing is 13.3 MN/m² in horizontal and 9.2 MN/m² in vertical direction of the cylindrical part
and 12.8 MN/m² in the dome part.
ISI System
The ISI system of the OL3 Inner Containment comprises a set of measuring devices which is capable to
reflect containment long term behavior including deformations and variation of material properties. In
addition, containment deviations during short term events like the prestressing phases and pressure tests
can be observed and assessed.
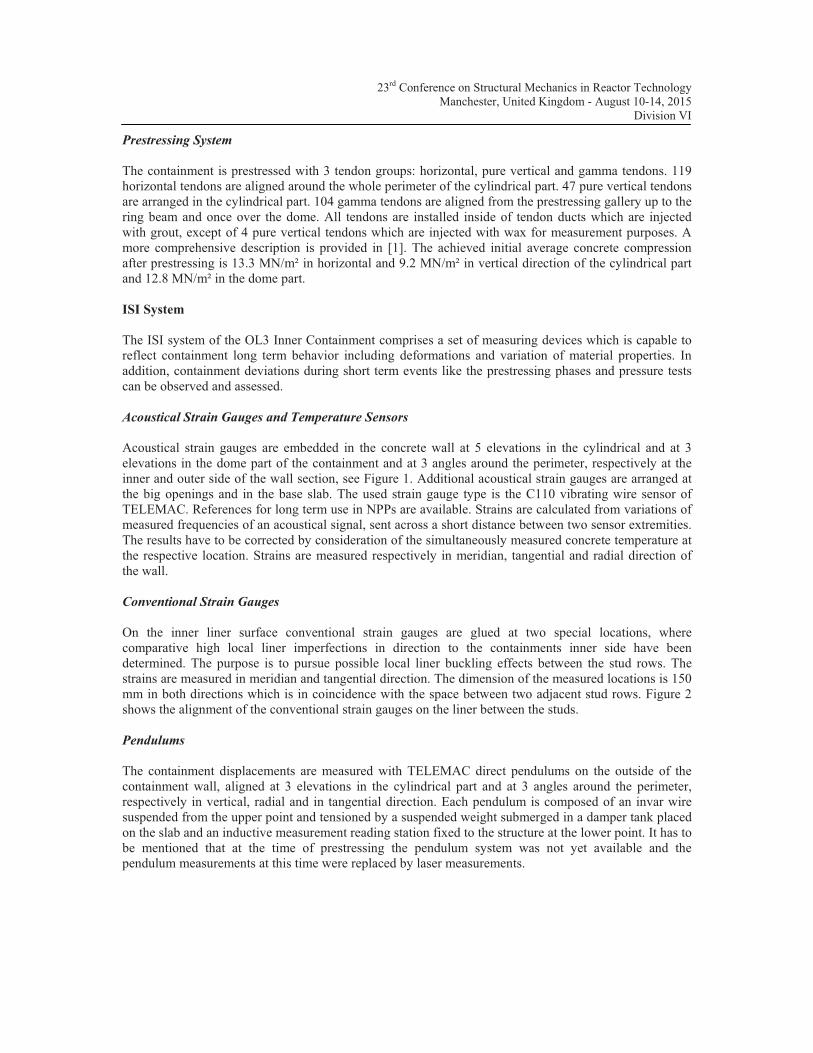
Acoustical Strain Gauges and Temperature Sensors
Acoustical strain gauges are embedded in the concrete wall at 5 elevations in the cylindrical and at 3
elevations in the dome part of the containment and at 3 angles around the perimeter, respectively at the
inner and outer side of the wall section, see Figure 1. Additional acoustical strain gauges are arranged at
the big openings and in the base slab. The used strain gauge type is the C110 vibrating wire sensor of
TELEMAC. References for long term use in NPPs are available. Strains are calculated from variations of
measured frequencies of an acoustical signal, sent across a short distance between two sensor extremities.
The results have to be corrected by consideration of the simultaneously measured concrete temperature at
the respective location. Strains are measured respectively in meridian, tangential and radial direction of
the wall.
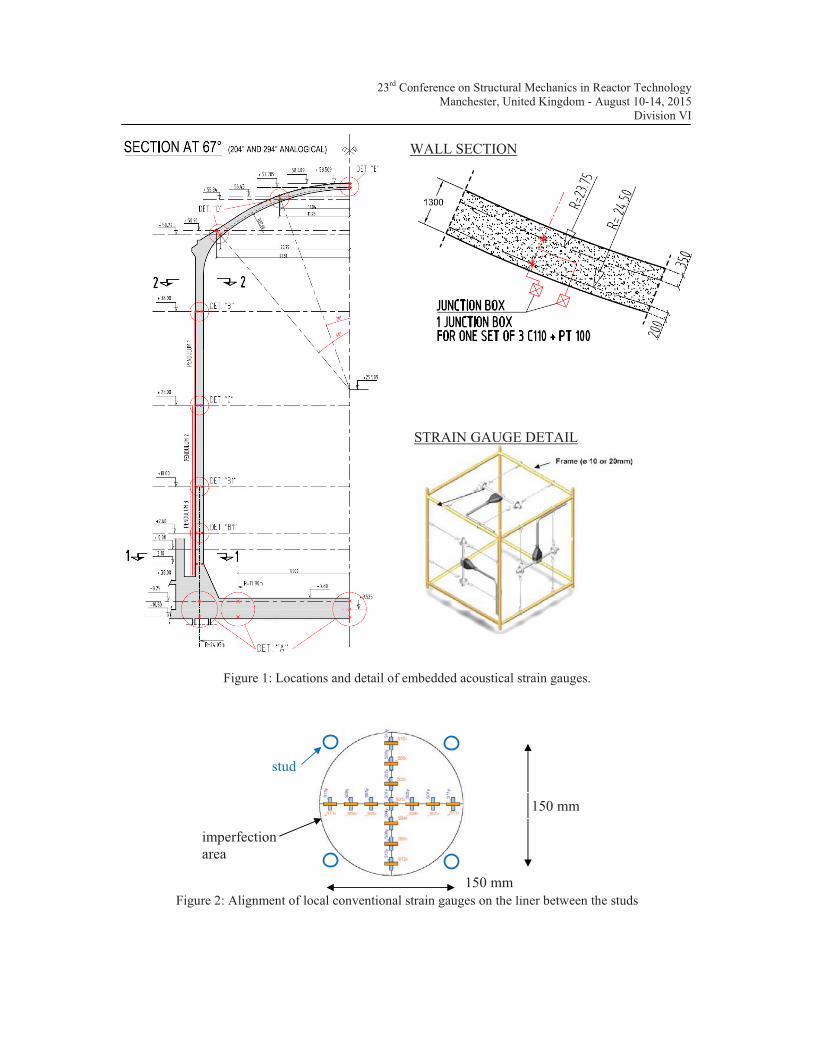
Conventional Strain Gauges
On the inner liner surface conventional strain gauges are glued at two special locations, where
comparative high local liner imperfections in direction to the containments inner side have been
determined. The purpose is to pursue possible local liner buckling effects between the stud rows. The
strains are measured in meridian and tangential direction. The dimension of the measured locations is 150
mm in both directions which is in coincidence with the space between two adjacent stud rows. Figure 2
shows the alignment of the conventional strain gauges on the liner between the studs.
Pendulums
The containment displacements are measured with TELEMAC direct pendulums on the outside of the
containment wall, aligned at 3 elevations in the cylindrical part and at 3 angles around the perimeter,
respectively in vertical, radial and in tangential direction. Each pendulum is composed of an invar wire
suspended from the upper point and tensioned by a suspended weight submerged in a damper tank placed
on the slab and an inductive measurement reading station fixed to the structure at the lower point. It has to
be mentioned that at the time of prestressing the pendulum system was not yet available and the
pendulum measurements at this time were replaced by laser measurements.
23rd Conference on Structural Mechanics in Reactor Technology
Manchester, United Kingdom - August 10-14, 2015
Division VI
Figure 1: Locations and detail of embedded acoustical strain gauges.
Figure 2: Alignment of local conventional strain gauges on the liner between the studs
WALL SECTION
STRAIN GAUGE DETAIL
150 mm
150 mm
stud
imperfection
area
23rd Conference on Structural Mechanics in Reactor Technology
Manchester, United Kingdom - August 10-14, 2015
Division VI
Load Cells
The prestressing forces of 4 vertical tendons are monitored with FREYSSINET CV8 55C15 load cells, so
called dynamometers. They are installed at the upper end of the vertical monitored tendons, placed
between the trumplate and the anchor block and measure the load applied to the anchor at any time.
The temperature inside the wall at the locations of measuring devices is monitored by TELEMAC PT100
temperature probes. The temperature operating range of the sensors is sufficient and references ensure
reliable long term behavior. In addition, the temperature inside as well as of the Inner Containment is also
monitored.
Humidity
The humidity inside and outside of the concrete wall in the cylindrical and dome part of the containment
is measured in order to assess the influence on the concretes creep and shrinkage behavior.
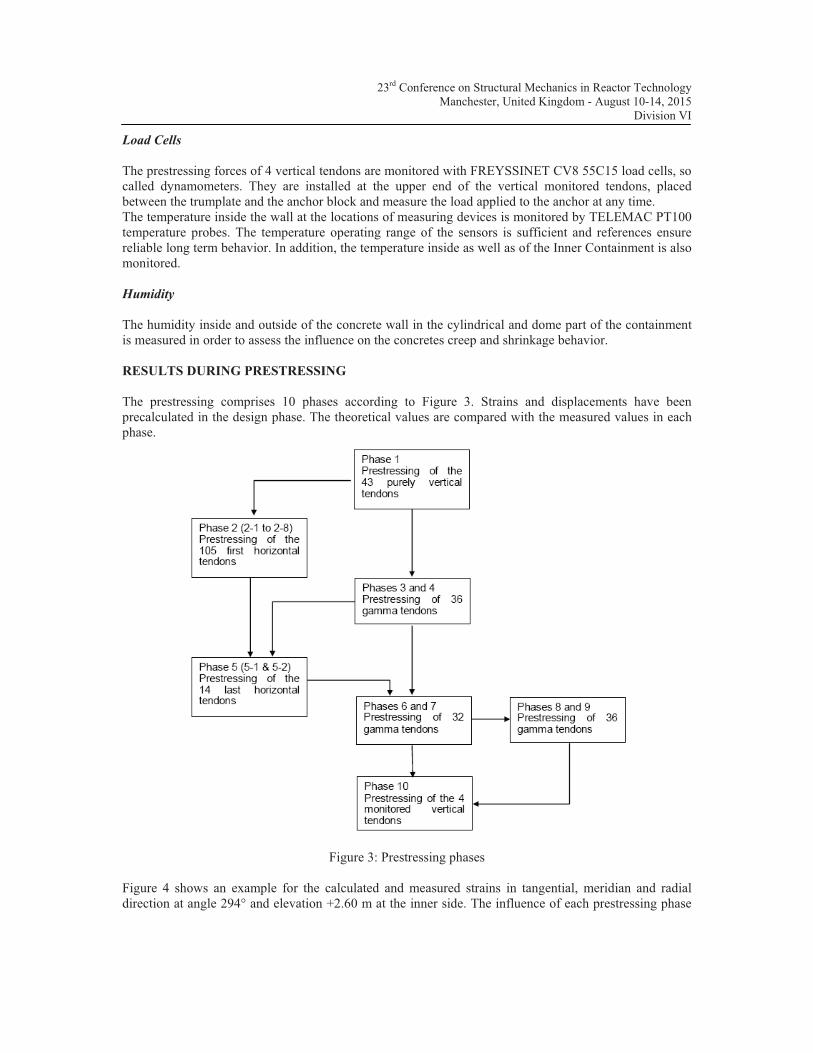
RESULTS DURING PRESTRESSING
The prestressing comprises 10 phases according to Figure 3. Strains and displacements have been
precalculated in the design phase. The theoretical values are compared with the measured values in each
phase.
Figure 3: Prestressing phases
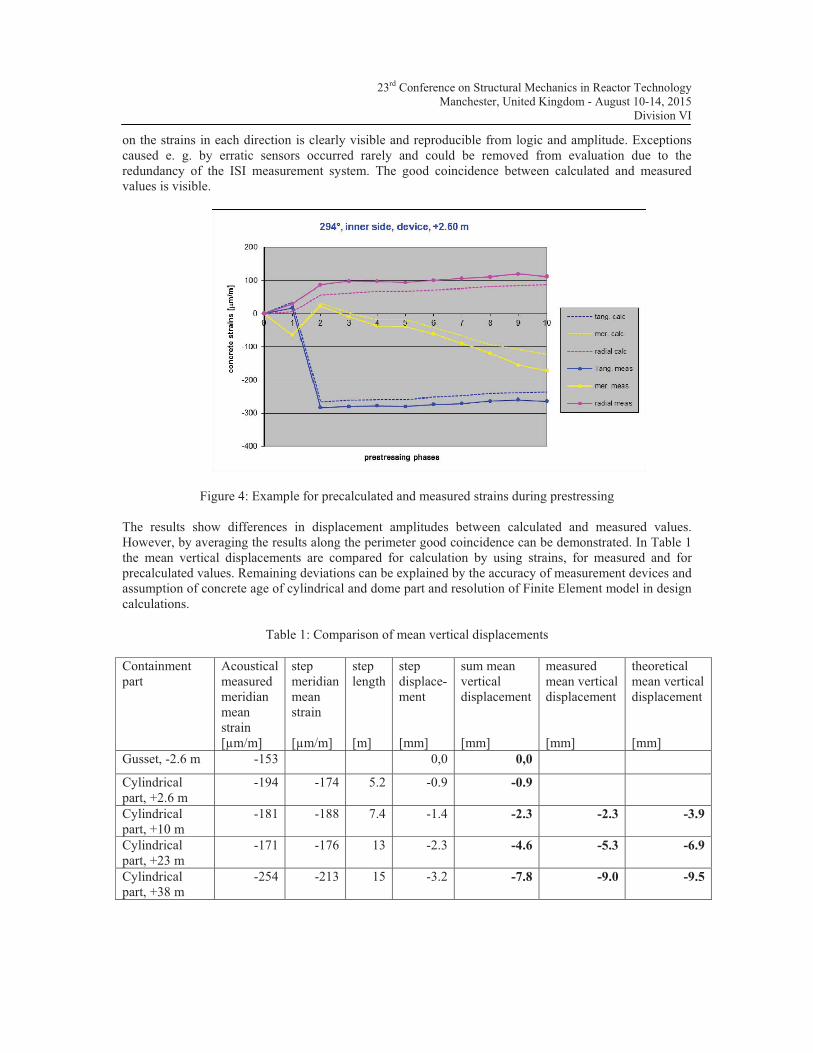
Figure 4 shows an example for the calculated and measured strains in tangential, meridian and radial
direction at angle 294° and elevation +2.60 m at the inner side. The influence of each prestressing phase
23rd Conference on Structural Mechanics in Reactor Technology
Manchester, United Kingdom - August 10-14, 2015
Division VI
on the strains in each direction is clearly visible and reproducible from logic and amplitude. Exceptions
caused e. g. by erratic sensors occurred rarely and could be removed from evaluation due to the
redundancy of the ISI measurement system. The good coincidence between calculated and measured
values is visible.
Figure 4: Example for precalculated and measured strains during prestressing
The results show differences in displacement amplitudes between calculated and measured values.
However, by averaging the results along the perimeter good coincidence can be demonstrated. In Table 1
the mean vertical displacements are compared for calculation by using strains, for measured and for
precalculated values. Remaining deviations can be explained by the accuracy of measurement devices and
assumption of concrete age of cylindrical and dome part and resolution of Finite Element model in design
calculations.
Table 1: Comparison of mean vertical displacements
Containment
part
Acoustical
measured
meridian
mean
strain
[µm/m]
step
meridian
mean
strain
[µm/m]
step
length
[m]
step
displace-
ment
[mm]
sum mean
vertical
displacement
[mm]
measured
mean vertical
displacement
[mm]
theoretical
mean vertical
displacement
[mm]
Gusset, -2.6 m -153 0,0 0,0
Cylindrical
part, +2.6 m
-194 -174 5.2 -0.9 -0.9
Cylindrical
part, +10 m
-181 -188 7.4 -1.4 -2.3 -2.3 -3.9
Cylindrical
part, +23 m
-171 -176 13 -2.3 -4.6 -5.3 -6.9
Cylindrical
part, +38 m
-254 -213 15 -3.2 -7.8 -9.0 -9.5

23rd Conference on Structural Mechanics in Reactor Technology
Manchester, United Kingdom - August 10-14, 2015
Division VI
RESULTS AFTER PRESTRESSING AND BEFORE ISIT
Relating to long term monitoring of the Inner Containment, measurements have been performed in
intervals of several weeks after prestressing. The zero measurement started on 2010-Oct-21. The last
measurement before ISIT was 164 weeks later on 2013-Dec-10. For this time period the most important
ISI measurement results are summarized here.
The measured long term strains are compared with the precalculated values based on the material
properties assumed in the design calculation. The calculation of creep and shrinkage strains is based on
ETC-C 2012 in accordance with EC2.
The calculated creep and shrinkage strains can’t be compared directly to the measured strains, because of
the force balance of the concrete with the steel parts in the wall section and also because of the biaxial
behavior of the wall. The exact procedure for the comparison with measured strains is published in [2].
As result of experiences with different containment structures, about 80-90% of the creep strains will be
realized in the structure.
Under consideration of force balance and biaxial behavior the calculated and measured long term concrete
strains are compared. The curves are illustrated in Figure 5. It has to be mentioned that deviations of
strains starting from the prestressing are compression (negative) strains, caused by concrete creep and
shrinkage as well as prestressing steel relaxation.
Figure 5: Calculated and measured long term strains
The development of vertical tendon forces after prestressing measured by the 4 dynamometers is shown
in Figure 6.

23rd Conference on Structural Mechanics in Reactor Technology
Manchester, United Kingdom - August 10-14, 2015
Division VI
Figure 6: Loss of vertical tendon forces after prestressing
RESULTS DURING ISIT
The pressure development during the Initial Structural Integrity Test (ISIT) inside of the Inner
Containment structure is displayed in Figure 7. The realized pressure development deviated only about
few hours from the here shown planned version. The test started on 2014-Jan-31 with the sub-pressure
test and the subsequent pressurization phase and ended on 2014-Feb-12 after the depressurization phase.
The maximum pressure was 6 bar absolute (5 bar relative). Several pressure plateaus are visible which
have been used for leak tightness tests and measurement campaigns. The increase and decrease velocity
of pressure as well as the alignment of plateaus is determined following ASME, Section III, Division 2.
Figure 7: Pressure development during ISIT
23rd Conference on Structural Mechanics in Reactor Technology
Manchester, United Kingdom - August 10-14, 2015
Division VI
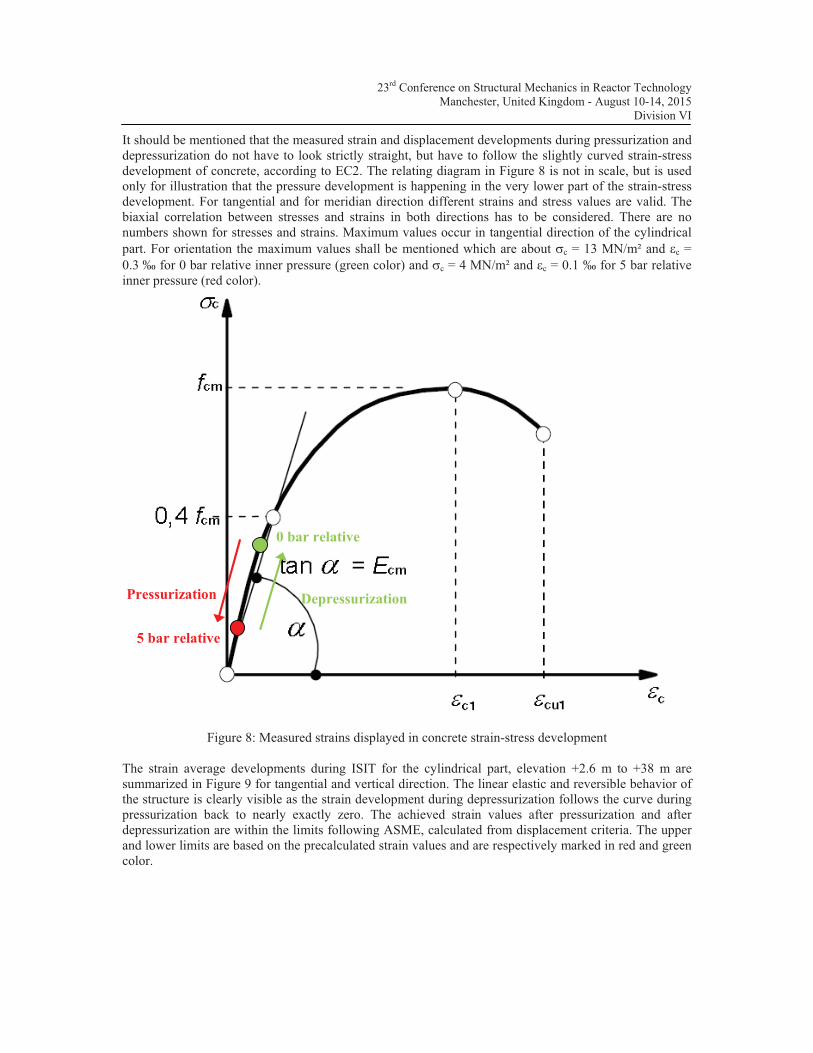
It should be mentioned that the measured strain and displacement developments during pressurization and
depressurization do not have to look strictly straight, but have to follow the slightly curved strain-stress
development of concrete, according to EC2. The relating diagram in Figure 8 is not in scale, but is used
only for illustration that the pressure development is happening in the very lower part of the strain-stress
development. For tangential and for meridian direction different strains and stress values are valid. The
biaxial correlation between stresses and strains in both directions has to be considered. There are no
numbers shown for stresses and strains. Maximum values occur in tangential direction of the cylindrical
part. For orientation the maximum values shall be mentioned which are about "c = 13 MN/m² and #c =
0.3 ‰ for 0 bar relative inner pressure (green color) and "c = 4 MN/m² and #c = 0.1 ‰ for 5 bar relative
inner pressure (red color).
Figure 8: Measured strains displayed in concrete strain-stress development
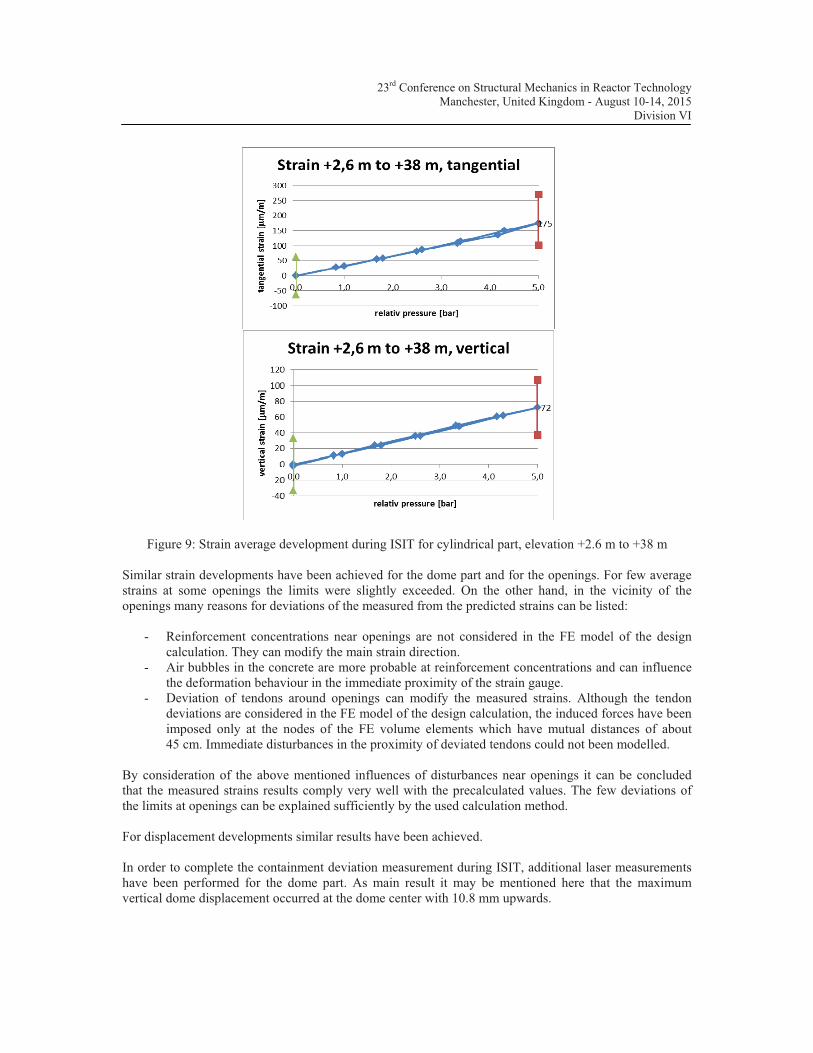
The strain average developments during ISIT for the cylindrical part, elevation +2.6 m to +38 m are
summarized in Figure 9 for tangential and vertical direction. The linear elastic and reversible behavior of
the structure is clearly visible as the strain development during depressurization follows the curve during
pressurization back to nearly exactly zero. The achieved strain values after pressurization and after
depressurization are within the limits following ASME, calculated from displacement criteria. The upper
and lower limits are based on the precalculated strain values and are respectively marked in red and green
color.
Pressurization Depressurization
5 bar relative
0 bar relative
23rd Conference on Structural Mechanics in Reactor Technology
Manchester, United Kingdom - August 10-14, 2015
Division VI
Figure 9: Strain average development during ISIT for cylindrical part, elevation +2.6 m to +38 m
Similar strain developments have been achieved for the dome part and for the openings. For few average
strains at some openings the limits were slightly exceeded. On the other hand, in the vicinity of the
openings many reasons for deviations of the measured from the predicted strains can be listed:
- Reinforcement concentrations near openings are not considered in the FE model of the design
calculation. They can modify the main strain direction.
- Air bubbles in the concrete are more probable at reinforcement concentrations and can influence
the deformation behaviour in the immediate proximity of the strain gauge.
- Deviation of tendons around openings can modify the measured strains. Although the tendon
deviations are considered in the FE model of the design calculation, the induced forces have been
imposed only at the nodes of the FE volume elements which have mutual distances of about
45 cm. Immediate disturbances in the proximity of deviated tendons could not been modelled.
By consideration of the above mentioned influences of disturbances near openings it can be concluded
that the measured strains results comply very well with the precalculated values. The few deviations of
the limits at openings can be explained sufficiently by the used calculation method.
For displacement developments similar results have been achieved.
In order to complete the containment deviation measurement during ISIT, additional laser measurements
have been performed for the dome part. As main result it may be mentioned here that the maximum
vertical dome displacement occurred at the dome center with 10.8 mm upwards.
23rd Conference on Structural Mechanics in Reactor Technology
Manchester, United Kingdom - August 10-14, 2015
Division VI
The temperature deviations inside the containment wall of the cylindrical and the dome part were very
low (in the range of 1 K) during pressurization and depressurization of ISIT. Nevertheless, the
temperature impact has been considered in the evaluations.
The local strain gauges on the liner surface have been measured shortly before and after ISIT.
Measurements during ISIT were not possible due to lack of access. The results after ISIT show nearly
identical values as before ISIT. This confirms the elastically liner behaviour during ISIT.
In completion to these measurements, the outer surface of the Inner Containment wall has been examined
completely from the annulus. Certain locations have been monitored before, during and after ISIT with
conventional strain gauges glued on the concrete surface. Appearing cracks during ISIT have been
marked. Crack widths have been measured at peak pressure and after ISIT.
The observed cracks have been found to be only surface cracks and so not going through the whole wall
thickness. Measured widths of new cracks at peak pressure were low (< 0.1 mm). On most surface areas
not one single crack did occur. Injected cracks originating from construction opened generally only if the
injection was performed after prestressing. In case of injection before prestressing, the compression in the
concrete was obviously high enough to prevent new cracks. The measured time-strain developments on
the concrete surface confirm the elastically behavior of the containment wall, because the strain values
after ISIT go back to the original values before ISIT. As the time-pressure during ISIT is identically
recovered in the time-strain developments of the strain gauges, it can also be deduced that no crack
propagation did happen during ISIT.
CONCLUSION
The monitoring results of the ISI system are evaluated and assessed by comparing to precalculated values.
The results and assessment comprise the prestressing operation, the time between prestressing and ISIT
and the recently finalized ISIT of the containment structure. Deviations are determined and explained
knowing accuracies of measuring devices, alterations in the actual material properties of the containment
wall and inaccuracies in the design calculation model.
The evaluation of the ISI measuring results during ISIT leads to the conclusion that the elastically
behavior as well as the integrity of the Inner Containment wall is ensured. Also the leak tightness of the
liner is maintained. The significance of the ISI system is limited in the assessment of local anomalies of
the prestressed concrete structure.
The measurement data achieved by the ISI system are a valuable basis for the assessment of future
periodic pressure tests and the ageing behavior of the containment structure during lifespan.
REFERENCES
[1] B. Wienand, D. Ostermann and C. Krumb “Impact and Benefit of the Pre-stressing
System on the Inner Containment of the Pressurized Water Reactor (EPRTM
Type)”,
SMiRT-22, San Francisco, California, USA, 2013 August 18-23.
[2] B. Wienand, “Post-Assessment of Pre-stressed Containment Structures by Evaluation of
Monitored Long-Term Deformation Results”, TINCE 2013, Paris, France, 2013 Oct.
28-31.

![Phosphenes and Inner Light Experiences in Medieval Chinese Psychophysical Techniques - An Exploration (Rudolf Pfister) [2012]](https://static.fdocuments.us/doc/165x107/55cf976e550346d033919487/phosphenes-and-inner-light-experiences-in-medieval-chinese-psychophysical-techniques.jpg)