Expedition Field Techniques Camera Trapping
122
Expedition Field Techniques Camera Trapping Geography Outdoors: the centre supporting field research, exploration and outdoor learning
Transcript of Expedition Field Techniques Camera Trapping
Expedition Field Techniques
Camera Trapping
Geography Outdoors:the centre supporting field research,exploration and outdoor learning

The RGS-IBG provides support to those doing fieldwork, exploration and outdoor learning with funding, information, training and advice:
Workshops www.rgs.org/GOseminars
Explore: the expedition and fieldwork planning seminar each November
Workshops during the year focus on specialist subjects, field techniques and field
safety training
Publications www.rgs.org/GOpubs
Handbooks on expedition planning and expedition medicine
Key titles cover many aspects of planning, fund-raising, logistics and research
Expedition reports www.rgs.org/expeditionreports
Online database of over 8500 planned and past expeditions
A unique reference collection of over 4500 reports
World register of field centres www.rgs.org/fieldcentres
Sites for environmental field research around the world
Specialist advice
Remote medicine www.rgs.org/medicalcell
Field mapping www.rgs.org/mapping
Disability projects www.rgs.org/inclusive
Grants www.rgs.org/grants
Geography Outdoors: the centre supporting field research, exploration and outdoor learning Royal Geographical Society with IBG 1 Kensington Gore London SW7 2AR Tel: +44 (0)20 7591 3030 Email: [email protected] Fax: +44 (0)20 7591 3031 Website: www.rgs.org/go
Fieldwork & Expeditions
Geography Outdoors: the centre supporting field research, exploration and outdoor learning
Expedition Field Techniques
CAMERA TRAPPING for Wildlife Conservation by Tim van Berkel Geography Outdoors: the centre supporting field research, exploration and outdoor learning Royal Geographical Society (with IBG) 1 Kensington Gore London SW7 2AR Tel +44 (0)20 7591 3030 Fax +44 (0)20 7591 3031 Email [email protected] Website www.rgs.org/go June 2014
ISBN 0-907649-93-9 Front Cover: line drawing by Tilly Alcayna of a Snow Leopard cub (Panthera uncial) taken from a Fauna & Flora International image

Expedition Field Techniques CAMERA TRAPPING FOR WILDLIFE CONSERVATION
CONTENTS
Section One: Introduction ............................................................................. 1
1.1 Scope and merit of this guide ............................................................ 1 1.2 Advantages ........................................................................................ 2 1.3 Species ............................................................................................... 4 1.4 Habitats .............................................................................................. 4 1.5 Camera trapping on expeditions ........................................................ 5 1.6 Limitations ......................................................................................... 6
Section Two: Equipment ............................................................................... 7
2.1 Selecting a camera model .................................................................. 7 2.1.1 Camera purchase and operating costs ............................................. 9 2.2 Camera types and features ............................................................... 10 2.2.1 Sensor types .................................................................................. 11 2.2.2 Flash ............................................................................................. 12 2.2.3 Trigger speed ................................................................................ 15 2.2.4 Recovery Time ............................................................................. 15 2.2.5 Detection zone .............................................................................. 16 2.2.6 Photo or video? ............................................................................. 17 2.2.7 Timer ............................................................................................ 18 2.2.8 Additional Features ....................................................................... 18 2.2.9 Security ......................................................................................... 19 2.2.10 Comparison websites .................................................................. 19 2.3 Batteries ........................................................................................... 19 2.3.1 Non-rechargeable batteries ........................................................... 20 2.3.2 Rechargeable batteries .................................................................. 21 2.4 Memory cards .................................................................................. 22 2.5 Desiccants ........................................................................................ 23
Section Three: Sampling animal populations using camera traps .......... 24
3.1 Presence/Absence ............................................................................ 25 3.1.1 Survey design for Presence/Absence ............................................ 26 3.2 Species richness ............................................................................... 28

3.2.1 Species Richness Survey design ................................................... 31 3.2.2 Data analysis ................................................................................ 34 3.3 Abundance and density ................................................................... 34 3.3.1 Characteristics of the sample population ...................................... 36 3.3.2 Open or closed population models? ............................................. 39 3.3.3 Survey methods and design .......................................................... 41 3.3.4 Data analysis ................................................................................ 47 3.4 Occupancy ....................................................................................... 48 3.4.1 Occupancy: survey design ............................................................ 49 3.4.2 Data analysis ................................................................................ 52 3.5 Other survey types ........................................................................... 53 3.5.1 Arboreal surveys .......................................................................... 53 3.5.2 Behaviour studies ......................................................................... 53 3.6 Bait and Lures ................................................................................. 54 3.7 Vegetation/habitat recording ........................................................... 57
Section Four: In the field ............................................................................ 59
4.1 Recce and pilot study ...................................................................... 59 4.2 Before leaving base ......................................................................... 60 4.3 Accessing the field site .................................................................... 61 4.4 Placing cameras ............................................................................... 62 4.5 Vegetation clearing ......................................................................... 65 4.6 Testing the camera setup ................................................................. 65 4.7 Final check up ................................................................................. 66 4.8 Additional remarks .......................................................................... 66 4.9 Checking and retrieving cameras .................................................... 67 4.10 Recording data ............................................................................... 69 4.11 Logistics ........................................................................................ 69 4.11.1 Transport and storage ................................................................. 69 4.11.2 Import and export ....................................................................... 70 4.12 Potential problems ......................................................................... 70 4.12.1 Malfunctioning cameras ............................................................. 70 4.12.2 Theft, vandalism and the public ................................................. 71 4.12.3 Wildlife damage ......................................................................... 72
Section Five: Data Management ................................................................ 74
5.1 Create an image management plan .................................................. 74 5.2 Collect images ................................................................................. 74 5.3 Store images .................................................................................... 75 5.4 Process images ................................................................................ 75 5.5 Code images .................................................................................... 76 5.6 Automated image management and data preparation ...................... 77

Section Six: Data analysis ........................................................................... 78
6.3 Population analysis software ........................................................... 79 6.2 Pattern-recognition software ............................................................ 80
Section Seven: Dissemination of results ..................................................... 82
7.1 Technical reports and peer-reviewed articles................................... 82 7.2 Outreach........................................................................................... 83
Section Eight: Glossary of terms ................................................................ 84 Section Nine: References ............................................................................. 87 Section Ten: Appendices ........................................................................... 101
Appendix 1 – Useful resources ............................................................ 101 Appendix 2 – Software applications .................................................... 103 Appendix 3 – Camera Setup Datasheet ............................................... 107 Appendix 4 – Camera Check Datasheet .............................................. 108 Appendix 5 – Camera Retrieval Datasheet .......................................... 109

Acknowledgements
This guide would not have been possible without the confidence and support of Shane Winser, who suggested I should write this guide. My greatest thanks therefore go to Shane. Louisa Richmond-Coggan wrote the section on bait, so many thanks for that. Louisa Richmond-Coggan and Tilly Alcayna gave very useful advice and comments on various drafts. Tilly also provided the front image, of which I envy. I also gleaned some very useful knowledge from members of the Yahoo Camera Trap Group. Thank you all.
About the author
Tim van Berkel, of Dutch origin, is Scientific Director of Frontline Conservation, a charity to conserve rainforests worldwide, and is an Honorary Research Fellow at the University of Exeter. Tim has done camera trapping in Borneo, Peru and Honduras and has conducted ecological fieldwork in Africa, South America and Southeast Asia. His interests include rainforest biodiversity and remote expeditions as well as frogs and lizards and anything natural.
Feedback
These Expedition Field Techniques handbooks are written by experienced field researchers to help others. If you have any recommendations for additions or amendments we would welcome your feedback [email protected].


Camera Trapping 1
Section One INTRODUCTION This field guide aims to provide a condensed review of the existing knowledge of camera trapping. It is not an all-encompassing source of information. Instead, other papers and references are indicated where appropriate for more detailed reading. It has been written with the novice, as well as the more experienced, camera trapper in mind. It aims to give a broad but detailed account of the various aspects relevant to using remote cameras for wildlife studies, either on a short-term expedition, as a survey method for longer-term studies or monitoring programs, or for the interested naturalist who would like to use remote cameras for recreational purposes.
1.1 Scope and merit of this guide Only a few papers provide an overview of the practical aspects of camera trapping, such as camera features, logistical issues, data management, the ‘in the field’ issues that arise when placing and checking cameras. It is mainly through trial and a great deal of error before one learns how various factors influence a survey. This often leads to reduced sampling efficiency and a reduction in the quantity and/or quality of data. Each camera trap survey is unique as each has different study species, habitat, camera type, human activities, objectives, etc. Answers to questions such as “where to place a camera? Which camera type is most suitable for a specific survey? How much time is involved with setting up a camera trap survey?” are difficult to find or are scattered throughout the impressive amount of literature available. Hence the reason for this condensed field guide.
Camera trapping has rapidly become one of the most popular tools for conservationists and wildlife researchers to monitor animal populations. This is due to its simplicity, versatility and applicability in a wide range of environments. The principle behind camera trapping is beautiful in its simplicity: a remotely-triggered camera is set up in an area of interest and when it detects the movement of an animal the camera is triggered and records an image. A number of cameras can be set up to operate in an area of interest and over a certain timeframe, from weeks to months.
Today, remote cameras are used by researches around the world, often surpassing the data-gathering power of traditional survey techniques. This means that wildlife researchers are able to address questions that have previously been too time-consuming or difficult to tackle. The acquired

2 Expedition Field Techniques
images can help researchers make inferences about various aspects of the ecology and behaviour of the species and their results provide important information for governing and regulatory bodies which need to make wildlife conservation and management decisions.
Camera trapping as a survey method however, remains under development. Camera trap studies are particularly suitable for abundance and density studies. Yet they have also been applied in a plethora of studies on aspects of animal behaviour and other ecological issues (see Section 3.5). Due to the large variety in study objectives, target species, environments and resources available to researchers, it is unsurprising that the field and analytical methods employed vary accordingly. Hence the need for this step-by-step field guide to camera trapping.
Building from an introduction to Camera Trapping in Chapter 1, Chapter 2 describes the various camera features and their application and importance for different studies and environments. Chapter 3 provides an overview of the different survey types that can be conducted using camera traps. Survey design and data analysis will be covered offering plenty of references to guide the reader to more detailed literature. Chapter 4 addresses the practical side of the fieldwork itself. This chapter focuses on the process of placing, checking and retrieving cameras and associated data collection. Chapter 5 and 6 cover the return-from-the-field part of the study, describing the ins and outs of data management and analysis of camera trap data. Finally, Chapter 7 focuses on the publication and dissemination of results.
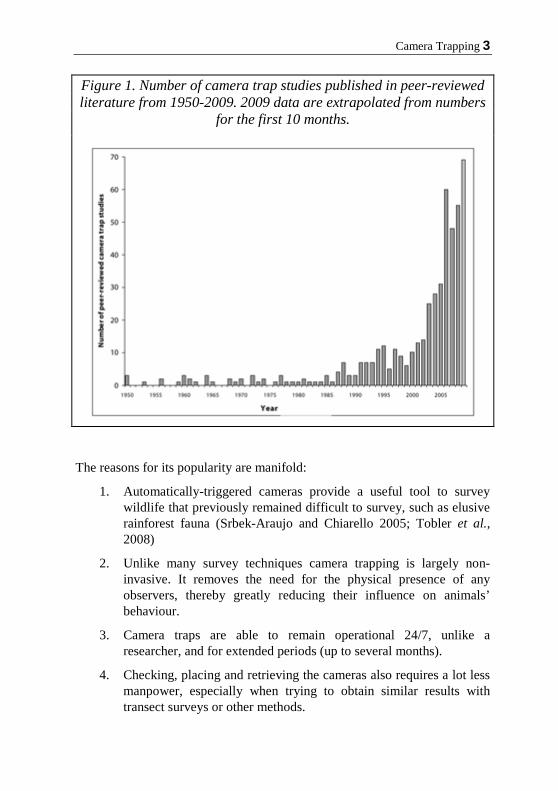
1.2 Advantages The scientific literature reporting camera trap studies is growing exponentially. Where the total camera trapping literature between 1950 and 1997 consisted of about 107 studies (Cutler and Swann, 1999), a comprehensive analysis by Diment (2010) showed that in 2009 782 publications were already published, 479 of which were in peer-reviewed journals (Figure 1.1).
Camera Trapping 3
Figure 1. Number of camera trap studies published in peer-reviewed literature from 1950-2009. 2009 data are extrapolated from numbers
for the first 10 months.
The reasons for its popularity are manifold:
1. Automatically-triggered cameras provide a useful tool to survey wildlife that previously remained difficult to survey, such as elusive rainforest fauna (Srbek-Araujo and Chiarello 2005; Tobler et al., 2008)
2. Unlike many survey techniques camera trapping is largely non-invasive. It removes the need for the physical presence of any observers, thereby greatly reducing their influence on animals’ behaviour.
3. Camera traps are able to remain operational 24/7, unlike a researcher, and for extended periods (up to several months).
4. Checking, placing and retrieving the cameras also requires a lot less manpower, especially when trying to obtain similar results with transect surveys or other methods.
4 Expedition Field Techniques
5. Camera traps make an especially effective tool to survey wide-ranging, elusive or nocturnal species, including carnivores such as the Iberian lynx, leopards, tigers and ocelots (Balme et al., 2009; Burton, 2012). These species are often very difficult to observe using traditional methods that often also require invasive techniques like live-trapping and/or GPS-collaring.
Finally, not only do the camera images provide a permanent record that can be peer-reviewed, they also make for stunning promotional and educational material. The images can be used as a means to attract additional funding and raise awareness of projects and species. Indeed, a picture is worth a thousand words!
1.3 Species Camera trapping surveys have traditionally been employed, and constrained, to survey medium- to large-bodied terrestrial (ground-dwelling) mammals, especially carnivores (Mccallum, 2012). However, with the continual increase in equipment performance, it is now possible to detect and identify smaller species such as terrestrial birds and small rodents. Even cold-blooded species such as reptiles have become the target of camera trap studies (Savidge and Seibert 1988; Guyer et al., 1997; McGrath et al., 2012; Ariefiandy et al., 2013), counterintuitive as this may seem as they are not as readily detected by the camera’s infrared sensors.
Finally, despite the logistical and safety issues associated with camera trap studies in the forest canopy (trapping at height has obvious logistical and safety limitations as trying to place cameras at great height takes time and specialist skills, falling out of trees is not a pleasant experience, and the movement of branches and leaves can cause many false triggers), some studies have been conducted here (Schipper, 2007; Oliveira-Santos et al., 2008; Olson et al., 2012). Section 3.5.1 covers arboreal surveys in more detail.
1.4 Habitats Traditionally, camera traps have been used in forests, but as equipment becomes more reliable, flexible, easy to use and more accessible from a financial perspective (Mccallum, 2012), studies are now being carried out worldwide in some of the most diverse and often challenging environments, including deserts (El Alqamy, 2006; ZSL 2012a), high mountain ranges (Jackson et al., 2006; Choate et al., 2006), rainforests (Kays et al., 2009; Tobler et al., 2008), savannahs (Pettorelli et al., 2010; G. Balme et al., 2010),
Camera Trapping 5
the ice caps (ZSL, 2012b) and even under water (Priede et al., 1994; Pelletier et al., 2012).
Even so, camera trapping surveys are likely to be less efficient in habitats with wide open spaces, such as grasslands, deserts and wetlands, compared to more ‘restricted’ areas such as forests and mountains where animal movement is more limited. Open habitats often lack obvious trails or places animals are likely to visit, making other methods, such as direct observations, sometimes more effective (Silveira et al., 2003). Nevertheless, camera traps remain an effective survey method in a very wide range of habitats and environments.
1.5 Camera trapping on expeditions Camera traps are a great tool on biodiversity expeditions. However, their use can be time consuming and eat into a significant part of the expedition budget. It is therefore important to assess the feasibility of a camera trap survey well in advance of departure, for instance during a recce to the field site. Even though other survey techniques that aim to survey the same wildlife community might not be as effective, they may be carried out at lower cost, leaving significantly more funds available to carry out studies on other species.
A recce provides an excellent opportunity for a pilot study (Section 4.1) during which accessibility, logistics, disturbances, hunting and possibly capture rates can be assessed and equipment and local knowledge of species can be tested. Even though the costs of a recce can be significant, the information obtained often validates the expenditure. Based on this information it is then possible to create an efficient sampling strategy.
Time is often the most restrictive factor for an expedition. When time is short, assessing the achievability of the planned camera trap survey before going to the field gains even more importance. Depending on the objectives, some surveys, such as estimation of density and abundance of wide ranging, elusive or low density species, are simply not achievable in the available time. Trying to assess densities of large carnivores for instance, requires thousands of camera trapping days. Thus, special care needs to be taken not to underestimate the time available to conduct camera trapping surveys. Additionally, equipment failure, adverse weather conditions and other unforeseen problems could further restrict sufficient data collection that is needed to obtain reliable results. An expedition can only last so many weeks and extending the time in the field is a luxury many teams cannot afford.
6 Expedition Field Techniques
A more feasible use of camera traps on expeditions is therefore to focus on projects which provide useful results even after a short survey period. Fundamental conservation information such as species inventories, measuring species richness, behaviour studies or obtaining species activity patterns can be achieved in a short period and provide meaningful data. If the expedition can be repeated in future years or if other studies are likely to continue the research where the expedition left off, the data gathered during the initial expedition could be used to serve as a baseline to be built upon by future studies.
1.6 Limitations While in the long run remote cameras are usually the cheaper option, their initial purchase costs are often high. Today the cost of a single camera ranges from £100 to over £600 for the more specialist models and in general a minimum of 10 cameras are required to conduct most surveys. In addition, each camera needs batteries and memory cards, which both add to the initial as well as the running costs. Remote cameras currently on the market do not tend to exhibit a very long operating life, especially when operating in challenging environments such as the humid tropics or ice cold mountain ranges. They are open to malfunction and may need repairing or even replacement. This can be a serious constraint for many researchers who lack adequate funding to support their work. Equipment malfunctions will need to be incorporated into the project budget.
While cameras can operate independently for a long time, this also means that checks are infrequent. Malfunctioning devices can thus go unnoticed for extended periods of time. There is nothing more frustrating than to find issues on arrival to a site, such as; technical failure, a camera full of rainwater, the tree on which you attached the camera blown over in a storm, the camera having been stolen or damaged by wildlife.
Equipment 7
Section Two EQUIPMENT Trail cameras – the type of camera used by a camera trapper – are obviously the most important pieces of equipment and having the right model for a camera trap survey is half the job done. Brown and Gehrt (2009) identified over 30 manufacturers that designed and sell trail cameras. Since then manufacturers and new models continue to enter the market. The different models vary widely in cost and features, leading to new versions of existing models being developed on an almost yearly basis. Choosing wisely from the vast range of models and being mindful of counterfeit models is critical. This section aims to explain the various camera features and variables that influence the operation of cameras. Camera accessories including batteries, memory cards and desiccants are also discussed.
2.1 Selecting a camera model Traditionally, remote cameras have been designed for (mainly North American) hunters, who are interested in deer and other game that roam their hunting grounds. They often place cameras near feeders and bait stations as this attracts and increases the time an animal remains in front of the camera. Thus, hunters often require different features to wildlife researchers who use cameras to estimate populations. Fortunately, with the increasing popularity of cameras for surveying animal populations a greater number of remote cameras have been specifically developed with wildlife researchers in mind.
When looking to purchase a camera the most important factors to consider are the camera’s functional options and its suitability for a specific survey type and environment. For the novice camera trapper who is inexperienced in the use of remote cameras and the importance of its many features, this may seem a daunting task. Fortunately there are many online discussion forums, internet sites and fellow researchers that are happy to share their opinions, knowledge and expertise (see Appendix 1 for a list of useful resources).
To be able to make a well-informed decision on which camera to use, it is essential to have at least a basic understanding of how remote cameras operate and are influenced by the environment in which they operate. It is therefore important to consider the climatic conditions under which the cameras work as their functioning varies significantly (Table 2.1).
8 Expedition Field Techniques
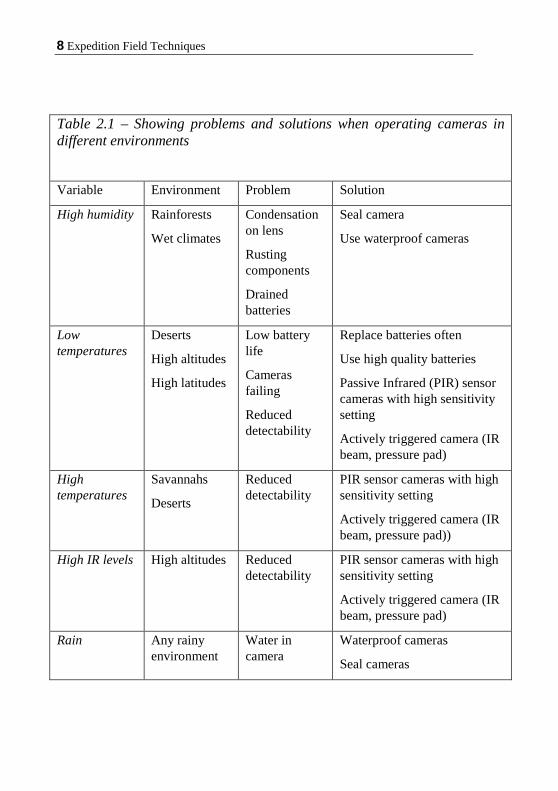
Table 2.1 – Showing problems and solutions when operating cameras in different environments
Variable Environment Problem Solution
High humidity Rainforests
Wet climates
Condensation on lens
Rusting components
Drained batteries
Seal camera
Use waterproof cameras
Low temperatures
Deserts
High altitudes
High latitudes
Low battery life
Cameras failing
Reduced detectability
Replace batteries often
Use high quality batteries
Passive Infrared (PIR) sensor cameras with high sensitivity setting
Actively triggered camera (IR beam, pressure pad)
High temperatures
Savannahs
Deserts
Reduced detectability
PIR sensor cameras with high sensitivity setting
Actively triggered camera (IR beam, pressure pad))
High IR levels High altitudes Reduced detectability
PIR sensor cameras with high sensitivity setting
Actively triggered camera (IR beam, pressure pad)
Rain Any rainy environment
Water in camera
Waterproof cameras
Seal cameras
Equipment 9
The decision to buy a set of cameras is often heavily influenced by their purchase costs. As research budgets are usually tight, camera purchase is often a compromise between camera quality and the number of cameras needed. Even so, trail cameras are becoming more affordable and important aspects such as trigger speed, battery life and image quality continue to improve.
A word of caution is needed however. With a fixed budget the choice may appear to be between buying many cheaper, lower quality cameras or fewer cameras of higher quality. Cheaper cameras tend to exhibit slower trigger speed, reduced sensitivity, lower image quality and higher failure rates. These variables have a negative impact on the detection probability, detection rate and quality of the data. This may lead to having to increase survey effort in order to obtain the same amount of data, which might end up costing more than if fewer, higher-end cameras had been purchased.
2.1.1 Camera purchase and operating costs The increasing number of camera manufacturers and people using cameras has led to a significant drop in camera prices. Low end cameras are now available from £60, although these are not recommended as the components are often of low quality and they will not withstand harsh conditions. Mid-range cameras can be bought for around £120 and have been used widely and successfully in a large number of camera trap studies and environments. When lacking the budget for the high-spec cameras, funding is generally better spent on the employment of a research assistant in combination with mid-range cameras and additional survey methods. High-spec cameras range over £600 and are superior in trigger speed, image quality and battery life but even these tend to have rather high failure rates (Kays et al., 2009).
Alongside the initial purchasing costs, it is equally important to take into account the operating costs. Variables such as battery use, camera replacement due to failure, the frequency with which cameras need to be checked in the field, their average operating life and other running costs will add costs to the project budget that might have been overlooked in the beginning.
These days many research institutions and universities use or have camera traps available. Therefore it is worthwhile asking around and checking if cameras can be borrowed or hired instead.
10 Expedition Field Techniques
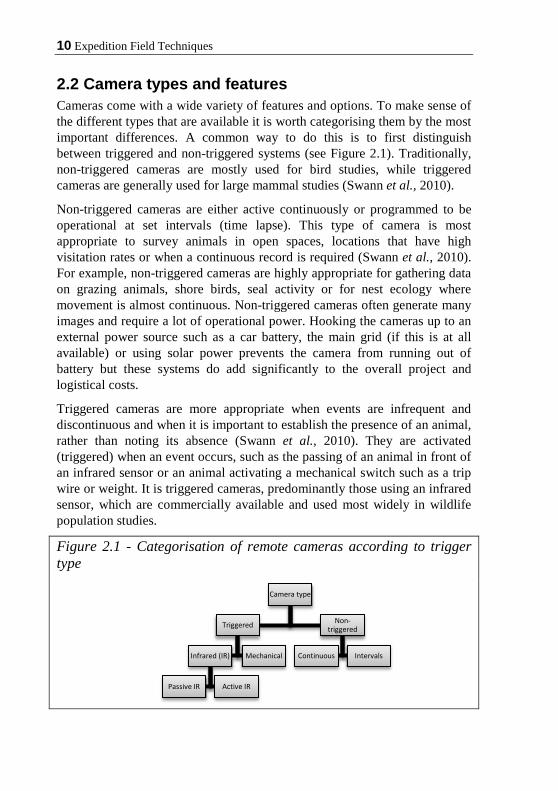
2.2 Camera types and features Cameras come with a wide variety of features and options. To make sense of the different types that are available it is worth categorising them by the most important differences. A common way to do this is to first distinguish between triggered and non-triggered systems (see Figure 2.1). Traditionally, non-triggered cameras are mostly used for bird studies, while triggered cameras are generally used for large mammal studies (Swann et al., 2010).
Non-triggered cameras are either active continuously or programmed to be operational at set intervals (time lapse). This type of camera is most appropriate to survey animals in open spaces, locations that have high visitation rates or when a continuous record is required (Swann et al., 2010). For example, non-triggered cameras are highly appropriate for gathering data on grazing animals, shore birds, seal activity or for nest ecology where movement is almost continuous. Non-triggered cameras often generate many images and require a lot of operational power. Hooking the cameras up to an external power source such as a car battery, the main grid (if this is at all available) or using solar power prevents the camera from running out of battery but these systems do add significantly to the overall project and logistical costs.
Triggered cameras are more appropriate when events are infrequent and discontinuous and when it is important to establish the presence of an animal, rather than noting its absence (Swann et al., 2010). They are activated (triggered) when an event occurs, such as the passing of an animal in front of an infrared sensor or an animal activating a mechanical switch such as a trip wire or weight. It is triggered cameras, predominantly those using an infrared sensor, which are commercially available and used most widely in wildlife population studies.
Figure 2.1 - Categorisation of remote cameras according to trigger type
Camera type
Triggered
Infrared (IR)
Passive IR Active IR
Mechanical
Non-triggered
Continuous Intervals

Equipment 11
2.2.1 Sensor types Passive Infrared Sensors
Virtually all commercially available remote cameras are triggered by a passive infrared sensor (PIR-sensor). This sensor records the background infrared signature of the detection zone. When an animal enters the detection zone it causes a rapid change in the infrared signature because it is either warmer or colder. This change is registered by the sensor which sends a signal to the camera to take the picture. A PIR-sensor is also called a heat-in-motion sensor. Cameras with PIR-sensors have the actual camera and the sensor built into one unit (Figure 2.2 and 2.3), making them more compact and easier to set up than active infrared sensors, that consist of at least two units. PIR-sensors are relatively insensitive to vegetation movement, have a wide detection zone, are cheap and widely available.
A major weakness of PIR sensors is that they remain sensitive to rapid changes in temperature due to movement of sunlight, or are triggered by moving vegetation or precipitation. Such trigger events, when they are not caused by animals, are called false triggers. An additional issue is that small animals might go undetected when passing the camera, due to their small size they might fail to cause enough change in background infrared signature to cause a trigger. However, many cameras now have a sensitivity setting that can reduce or increase the amount of change in background infrared needed to trigger the camera (Box 1).
Active Infrared Sensors
Active infrared sensors (AIR sensors) operate by emitting a single infrared beam from an emitter to a receiver (Figure 2.2). When an animal disrupts the beam, by preventing the beam from reaching the receiver, the camera is triggered and takes a picture. AIR-sensors have a few advantages over PIR-sensors. Firstly, the height of the beam can be adjusted to the target animal. Secondly, because the IR emitter and receiver are separate from the camera, the camera can be placed remotely in a more optimal position for image capture. Thirdly, the detection range (the beam) can be up to 150 feet (50 meter) long (Brown and Gehrt, 2009), which is longer than with PIR-sensors. Lastly, and in contrast to PIR sensors, changes in temperature hardly affect detection but snow, rain and vegetation such as falling leaves interrupting the beam do cause many false triggers (Jackson et al., 2005; Brown and Gehrt, 2009). AIR-sensor equipped cameras are also expensive, not widely available and it takes a long time to line up the different components. They are

12 Expedition Field Techniques
therefore comparatively infrequently used, although they are particularly useful for studying cold-blooded animals whose body surface temperature is similar to their surrounding environment, leading to low detection rates from PIR-sensors.
Figure 2.2 – Typical setup of an Active Infrared camera trap System
2.2.2 Flash A further distinction can be made between cameras that use an incandescent (white or visible) flash and those that use an infrared flash to illuminate a scene when ambient light is low. Flash is not necessarily better than infrared; the suitability of both types varies with survey type and target species. It is important to note that you should not confuse the IR flash with the IR sensor mechanism. Both flash and IR cameras use an IR sensor to detect movement. The specifics, pros and cons of both incandescent flash and IR are discussed below.
2.2.2.1 Incandescent flash To produce an incandescent (visible) flash camera traps generally make use of a single xenon lamp, which produces light resembling that emitted by the sun at noon. The resulting colour images are usually of higher quality than seen in IR cameras, making them very suitable for identification of individual markings. This makes it easier to distinguish different small mammal species as these are difficult to tell apart from grey-scale pictures. For example, certain sympatric species, such as mouse deer (Tragulus spp.) and barking deer (Muntjacus spp.), are difficult to tell apart except for coat pattern or colour.
Equipment 13
Due to the high energy output of the incandescent flash, the camera aperture can be relatively short, producing images that are less blurred than when using the lower intensity IR flash. Why not use a white flash all the time then? There are a few drawbacks to incandescent flash that influence their use.
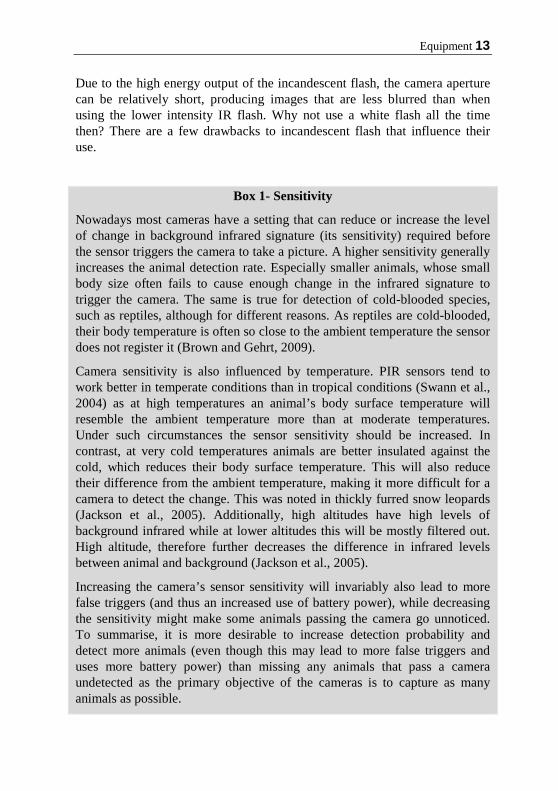
Box 1- Sensitivity
Nowadays most cameras have a setting that can reduce or increase the level of change in background infrared signature (its sensitivity) required before the sensor triggers the camera to take a picture. A higher sensitivity generally increases the animal detection rate. Especially smaller animals, whose small body size often fails to cause enough change in the infrared signature to trigger the camera. The same is true for detection of cold-blooded species, such as reptiles, although for different reasons. As reptiles are cold-blooded, their body temperature is often so close to the ambient temperature the sensor does not register it (Brown and Gehrt, 2009).
Camera sensitivity is also influenced by temperature. PIR sensors tend to work better in temperate conditions than in tropical conditions (Swann et al., 2004) as at high temperatures an animal’s body surface temperature will resemble the ambient temperature more than at moderate temperatures. Under such circumstances the sensor sensitivity should be increased. In contrast, at very cold temperatures animals are better insulated against the cold, which reduces their body surface temperature. This will also reduce their difference from the ambient temperature, making it more difficult for a camera to detect the change. This was noted in thickly furred snow leopards (Jackson et al., 2005). Additionally, high altitudes have high levels of background infrared while at lower altitudes this will be mostly filtered out. High altitude, therefore further decreases the difference in infrared levels between animal and background (Jackson et al., 2005).
Increasing the camera’s sensor sensitivity will invariably also lead to more false triggers (and thus an increased use of battery power), while decreasing the sensitivity might make some animals passing the camera go unnoticed. To summarise, it is more desirable to increase detection probability and detect more animals (even though this may lead to more false triggers and uses more battery power) than missing any animals that pass a camera undetected as the primary objective of the cameras is to capture as many animals as possible.
14 Expedition Field Techniques
Firstly, the xenon lamp uses more energy than an IR flash does and often requires some time to recharge (the recovery time) before it can be operational again. This can vary between near instantaneous and to up to 60 seconds (Brown and Gehrt, 2009), which may be the period that another animal can pass in front of the camera undetected. The higher energy use also drains the batteries quicker than the LED’s in IR cameras. To solve this issue, white LED’s are now being implemented in different camera models. Secondly, white flash generally results in a lower trigger speed (see next section). Thirdly, the flash might spook certain animals and can lead to trap shyness or even trap avoidance (Wegge et al., 2004; Schipper, 2007). This change in natural behaviour is undesirable and can bias results. In contrast, when operating in an area that is inhabited by people, white flash is more likely to alert people to the presence of camera traps, thereby increasing the chances of theft or vandalism, as well as drawing in unwanted attention from certain animals, which can lead to camera damage.
Additionally, colour images of the species are more attractive than black and white ones. This can be a huge asset when an aim is to engage people in the research, for educational purposes, or when attracting attention to obtain funding.
2.2.2.2 Infrared flash Infrared flash is produced by a number of IR LEDs. Instead of colour, cameras that use infrared flash produce grey scale images at night when the flash is turned on. If additional illumination is not required (when there is enough ambient light during the day) colour images will be produced. A huge advantage of infrared light is that it is invisible to most wildlife, which is the main selling point for this type of camera. Even so, in standard IR cameras the LED’s emit a very weak red light that is still visible to some species, especially ground birds it seems (personal observation), but is much less obtrusive than a bright white flash. A recent solution for this issue is the development of the ‘covert’ camera, which renders the glow of the LED’s virtually invisible.
LED’s are generally less powerful than the xenon lamps however, leading to blurry low quality night images especially if the animal is moving fast. The advantage of the use of the IR LED’s is that they can be turned on for longer, allowing night-time videos if the camera is equipped with this function. Additional benefits are extended battery life, faster trigger times and pictures
Equipment 15
that can be taken quickly in succession as there is no need to recharge the flash.
In some situations the flash can be too bright resulting in a picture that looks more like a snow landscape than anything else. This is called a white-out and can occur when there is no room to create enough distance between the camera and the animal. This is a major challenge when surveying small mammals as the camera needs to be close to the animal for identification purposes. To counteract this, simply cover part of the LEDs or visible flash with tape to reduce its strength. Make sure to test the right amount of flash reduction first before deployment.
2.2.3 Trigger speed Trigger speed or trigger time is the time delay between the moment of detection and the moment the picture is taken and is a very important variable to consider. With a fast trigger speed it is more likely that an animal which has been detected by a camera also ends up in the picture. If the trigger speed is too slow, the animal might have crossed the detection zone already before a picture can be taken, resulting in empty pictures, or pictures with only pieces of the animal, like the tail.
Cameras with a slow trigger speed are therefore not suitable for trails as animals generally move quickly along them and are unlikely to remain in front of the camera. Trigger speed is not as important when placed in locations where animals are likely to remain in front of the camera for some time, such as water holes, salt licks and bait/lure stations. Therefore, using cameras with a trigger speed of < 1.0 second is recommended for use on trails.
There is a lot of variation in trigger speeds between camera models. In December 2013 speed ranged from as fast as 0.197 seconds (Reconyx, HC500) to 4.206 seconds (Stealth Cam Rogue IR) and slower (Trailcampro, 2012). Cheaper models generally have a very low trigger speeds while the more expensive ones are notably faster. With advancing technology however, trigger speeds are increasing, even in the cheaper models.
2.2.4 Recovery Time Recovery speed refers to the time between successive triggers, and is mainly dependent on image processing and recharging of the flash, which can take some time. Recovery speed can range from near instantaneous up to 60 seconds. A fast recovery time will provide the best opportunity to record multiple images of the same animal, and gives a higher chance of recording
16 Expedition Field Techniques
multiple animals passing in front of the camera at once. Cameras with wide detection zones, fast trigger speeds and fast recovery times provide the best opportunity to record multiple images of animals moving through the view.
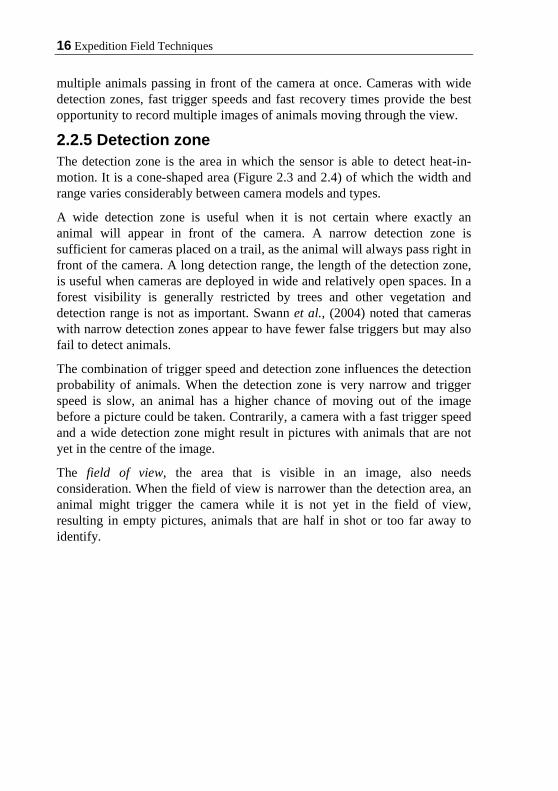
2.2.5 Detection zone The detection zone is the area in which the sensor is able to detect heat-in-motion. It is a cone-shaped area (Figure 2.3 and 2.4) of which the width and range varies considerably between camera models and types.
A wide detection zone is useful when it is not certain where exactly an animal will appear in front of the camera. A narrow detection zone is sufficient for cameras placed on a trail, as the animal will always pass right in front of the camera. A long detection range, the length of the detection zone, is useful when cameras are deployed in wide and relatively open spaces. In a forest visibility is generally restricted by trees and other vegetation and detection range is not as important. Swann et al., (2004) noted that cameras with narrow detection zones appear to have fewer false triggers but may also fail to detect animals.
The combination of trigger speed and detection zone influences the detection probability of animals. When the detection zone is very narrow and trigger speed is slow, an animal has a higher chance of moving out of the image before a picture could be taken. Contrarily, a camera with a fast trigger speed and a wide detection zone might result in pictures with animals that are not yet in the centre of the image.
The field of view, the area that is visible in an image, also needs consideration. When the field of view is narrower than the detection area, an animal might trigger the camera while it is not yet in the field of view, resulting in empty pictures, animals that are half in shot or too far away to identify.

Equipment 17
Figure 2.3 – Example of the shape of a camera’s detection zone (cone shaped solid line) using a PIR sensor, and a narrower field of view (grey dotted line). An animal that is positioned within the cone but outside the field of view at the moment of a picture being taken will not be present on the image.
In most cameras the angle of the sensor is pointed slightly downward. It is therefore best to place them parallel to the ground and at the appropriate height.
Figure 2.4 – The vertical detection zone. This highlights the importance of placing the camera level with the ground. The image also shows that (small) animals that walk close to the camera will be missed by the sensor.
2.2.6 Photo or video? Camera models may have the option to record video as well as still images. The obvious advantage of video is that the recording time is longer (variable
18 Expedition Field Techniques
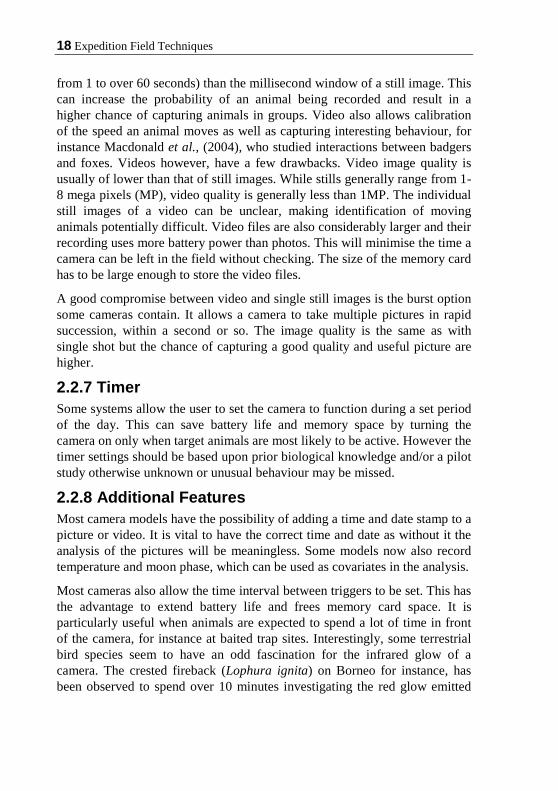
from 1 to over 60 seconds) than the millisecond window of a still image. This can increase the probability of an animal being recorded and result in a higher chance of capturing animals in groups. Video also allows calibration of the speed an animal moves as well as capturing interesting behaviour, for instance Macdonald et al., (2004), who studied interactions between badgers and foxes. Videos however, have a few drawbacks. Video image quality is usually of lower than that of still images. While stills generally range from 1-8 mega pixels (MP), video quality is generally less than 1MP. The individual still images of a video can be unclear, making identification of moving animals potentially difficult. Video files are also considerably larger and their recording uses more battery power than photos. This will minimise the time a camera can be left in the field without checking. The size of the memory card has to be large enough to store the video files.
A good compromise between video and single still images is the burst option some cameras contain. It allows a camera to take multiple pictures in rapid succession, within a second or so. The image quality is the same as with single shot but the chance of capturing a good quality and useful picture are higher.
2.2.7 Timer Some systems allow the user to set the camera to function during a set period of the day. This can save battery life and memory space by turning the camera on only when target animals are most likely to be active. However the timer settings should be based upon prior biological knowledge and/or a pilot study otherwise unknown or unusual behaviour may be missed.
2.2.8 Additional Features Most camera models have the possibility of adding a time and date stamp to a picture or video. It is vital to have the correct time and date as without it the analysis of the pictures will be meaningless. Some models now also record temperature and moon phase, which can be used as covariates in the analysis.
Most cameras also allow the time interval between triggers to be set. This has the advantage to extend battery life and frees memory card space. It is particularly useful when animals are expected to spend a lot of time in front of the camera, for instance at baited trap sites. Interestingly, some terrestrial bird species seem to have an odd fascination for the infrared glow of a camera. The crested fireback (Lophura ignita) on Borneo for instance, has been observed to spend over 10 minutes investigating the red glow emitted

Equipment 19
by the infrared LED’s light and one study reported that ferrets can see IR light (Newbold and King 2009).
When aiming to obtain information on group size this function should be turned off. As the non-trigger interval may only photograph the first animal, missing any following animals.
2.2.9 Security Many cameras have the option to add additional security against damage by wildlife such as bears, tigers, lions or elephants which are species known to destroy cameras. Cable locks, lock boxes and electronic passwords are available accessories that help prevent damage, theft and vandalism.
2.2.10 Comparison websites There are various websites that compare different cameras. These sites can serve as useful guides but it should be remembered that different cameras operate differently under various environmental conditions and climates. As camera tests are often only carried out with one or a few cameras of the same brand and in only one climate, usually under good conditions, the test results may not be representative for your situation. Even so, these tests are often the only available, benchmark on which to base the choice of purchasing a camera. Several such websites are listed in Appendix 1.
2.3 Batteries Pretty much all commercially available camera traps use some type of battery for power. AA batteries are the most commonly used, although there are models that use C or even D cells. Apart from the differences in size, a distinction can be made between non-rechargeable and rechargeable batteries. Each type has its own characteristics that influence the operation of a camera. Remote cameras are first and foremost meant to operate using non-rechargeable batteries, but when conducting camera trapping over longer periods of time, their battery replacement will have a significant impact on your budget as well as the environment.
Which battery type to choose depends on budget, how often/long cameras are intended to be used and of course the availability of the actual batteries. Non-rechargeable batteries are cheaper, but they need frequent replacement, making these the more expensive option, possibly after 3 charge cycles. Disposable/non-rechargeable batteries are the most environmentally unfriendly type and it is therefore advised not to use these unless there is no other option.
20 Expedition Field Techniques
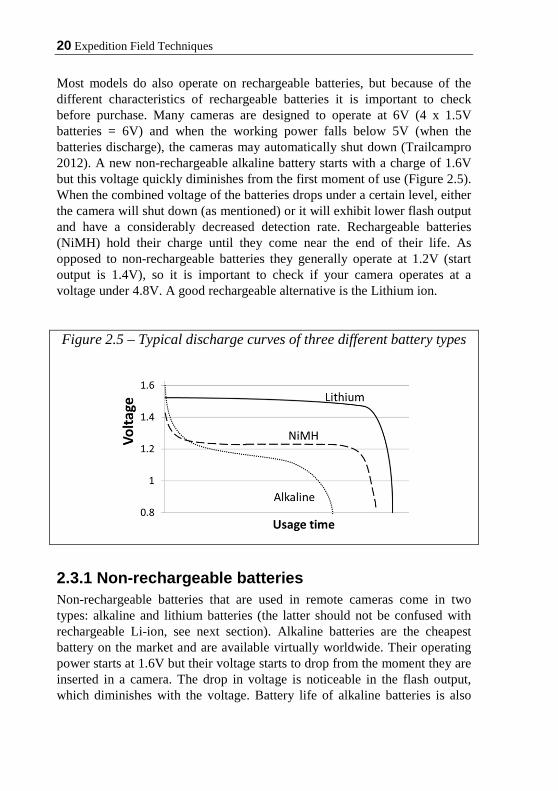
Most models do also operate on rechargeable batteries, but because of the different characteristics of rechargeable batteries it is important to check before purchase. Many cameras are designed to operate at 6V (4 x 1.5V batteries = 6V) and when the working power falls below 5V (when the batteries discharge), the cameras may automatically shut down (Trailcampro 2012). A new non-rechargeable alkaline battery starts with a charge of 1.6V but this voltage quickly diminishes from the first moment of use (Figure 2.5). When the combined voltage of the batteries drops under a certain level, either the camera will shut down (as mentioned) or it will exhibit lower flash output and have a considerably decreased detection rate. Rechargeable batteries (NiMH) hold their charge until they come near the end of their life. As opposed to non-rechargeable batteries they generally operate at 1.2V (start output is 1.4V), so it is important to check if your camera operates at a voltage under 4.8V. A good rechargeable alternative is the Lithium ion.
Figure 2.5 – Typical discharge curves of three different battery types
2.3.1 Non-rechargeable batteries Non-rechargeable batteries that are used in remote cameras come in two types: alkaline and lithium batteries (the latter should not be confused with rechargeable Li-ion, see next section). Alkaline batteries are the cheapest battery on the market and are available virtually worldwide. Their operating power starts at 1.6V but their voltage starts to drop from the moment they are inserted in a camera. The drop in voltage is noticeable in the flash output, which diminishes with the voltage. Battery life of alkaline batteries is also
Equipment 21
negatively affected by cold weather and they can lose up to half their capacity in temperatures below 0°C (Trailcampro 2012).
Lithium batteries hold their charge very well and coupled with an initial 1.8V power output they exhibit the longest battery life of both non-rechargeable and rechargeable batteries. Lithium batteries are more expensive than alkaline batteries but their performance is unrivalled by any other available battery type. When budget allows, and rechargeable batteries are not an option, these are the preferred battery.
Non-rechargeable batteries should be disposed of in an environmentally friendly way. Many developing countries have no specific battery disposal facilities and batteries often end up on a landfill, in rivers or in the environment you are studying. Instead of discarding batteries in places where disposal facilities are lacking it is better to take them back home or give them to someone that can dispose of them properly. Remember to incorporate the fact that (heavy) batteries may need to be taken back home.
2.3.2 Rechargeable batteries There are two options when considering rechargeable batteries; nickel metal hydride (NiMH) and Lithium (Li-ion) batteries.
NiMH NiMH is the most widely used rechargeable battery. Unlike its predecessor, the nickel-cadmium (NiCad) battery, the operating life of NiMH batteries is not affected by repeated charging. To achieve this feat however, the batteries need to be fully discharged and charged (a charging cycle) for 2-3 times before first use. When battery life seems to be reduced after some use, it can be re-extended by carrying out another three charging cycles. Some manufacturers have already put the batteries through this process at the time of purchase. The output of NiMH batteries varies considerably between brands (as with all battery types) and as they will be used for a long time it is worth investing in high-quality batteries. Rechargeable batteries are more difficult to come by in some countries. It is therefore worthwhile to bring a number of spares in case of loss, damage or malfunctioning.
Even when the NiMH batteries are not in use they lose their charge. The comprehensive battery review site batteryuniversity.com mentions that they lose about 20% of their capacity through self-discharge in the first 24h, and 10% per month after that (Battery University, 2013). There should therefore be as little time as possible between charging and using them. When storing NiMH batteries for a prolonged amount of time, it is best to do so at 1/3 of

22 Expedition Field Techniques
their charge. After, they can be stored for up to 15 years at ambient temperatures without being negatively affected (Battery University, 2013).
NiMH batteries are only mildly toxic and are more environmentally friendly than alkaline batteries and when using them no more than once or twice, it could still be more economical to buy these than non-rechargeable batteries as they can be resold after use.
Li-ion Li-ion will very likely be the successor of the NiMH battery. It has been around for a while as the main battery for mobile phones and other handheld electronic devices, but 1.5V AA have only recently been developed.
Li-ion has a higher capacity, no memory effect, is lighter and has a low charge loss. They are also the most environmentally friendly battery around. However, one reported drawback is that these batteries have a tendency to fail after 2-3 years, although NiMH has this tendency as well.
A small number of cameras use D-cell batteries. Rechargeable D-cells are relatively expensive to purchase but a work-around is to buy specially designed (cheap) D-cell sized containers that function as a D-cell adaptor for AA batteries.
Two sites that provide very detailed battery information are http://batteryuniversity.com and www.rechargebatteryguide.com.
2.4 Memory cards Memory cards are used to store the images taken by the cameras. Virtually all cameras use either Standard Digital (SD or SDSC) and/or Secure Digital High Capacity (SDHC) memory cards to store the images. SD cards are capable of storing a maximum of 4 GB while SDHC can store up to 32 GB. However, not all cameras are compatible with SDHC cards so check this with the manufacturer before purchasing a SDHC card. The larger the memory, the less likely it is that its fills up before the camera can be checked again. A camera is more often limited by its battery life than the size of a memory card, although when high quality video is selected, this might not be the case.
Memory cards do have a tendency to fail, resulting in lost images. To reduce this issue, ensure each card is formatted before it is re-used in a camera. Make sure to always have spares with you and test them regularly.
Equipment 23
2.5 Desiccants Cameras operating in humid environments often end up with moisture in the housing, which can result in condensation of the lens or corrosion of the electrical system. To avoid this some sort of desiccant can be placed in the camera. This prevents fogging of the lens, draining of batteries and corrosion of the hardware, and guarantees a longer life time. Silica gel is the most widely used. However, some cameras have little or no space to place any silica so test this before purchase. While standard silica can only be used once and have to be discarded when their storage capacity has been reached, so-called ‘sky’ or rechargeable silica gel can be re-used indefinitely as heating the balls expels the absorbed moisture. Sky silica changes colour when saturated and their current capacity is therefore easy to check. Place the silica in a little breathable pouch in the camera as not to risk losing it when opening the camera. The reusable variety is not always widely available and it is most convenient to buy it beforehand rather than relying on its local availability.

24 Expedition Field Techniques
Section Three SAMPLING ANIMAL POPULATIONS USING CAMERA TRAPS This chapter provides a description of the most common types of survey used to sample animal populations and addresses the complexities associated with them. The descriptions will prove useful when deciding on the feasibility of a camera trap survey and its use for your specific needs. Readers are referred to Sutherland (2006) for a comprehensive review of survey planning: Ecological Census Techniques: A Handbook. www.nhbs.com/Conservation/gratis-books, arguably the most important part, of any research.
A field survey is only useful when it provides the data that can address the objectives set out in advance. Ideally, the objectives are relevant to the conservation of the survey species and habitat. Doing a survey just because it is possible is not always a valid argument as it wastes valuable time, energy and resources.
Species presence/absence surveys generally take the least amount of time to conduct and are simplest to carry out as even a single image is sufficient to prove the presence of a species. Species richness estimation using species richness estimators and accumulation rates are slightly more complicated, as more species need to be recorded and sufficient data needs to be gathered to allow statistical species richness estimation, but yield more meaningful results. Cameras are most often utilised in a capture-recapture framework, where animal population parameters (as well as species richness) can be estimated from detection and non-detection from repeated samples. Camera traps are perfectly suited for this method, as it is easy to define discrete sampling periods (Kéry, 2011). Abundance, density and occupancy, the best population status parameters, can be estimated using variances of capture-recapture data from camera traps. These more complicated survey types generally require a large survey effort to gather enough data to generate robust results.
The survey types below are arranged from straightforward to progressively more complex. Each includes a section explaining why it might be useful to conduct the survey. The next chapter details the methods to conduct the surveys.
Sampling animal populations using camera traps 25
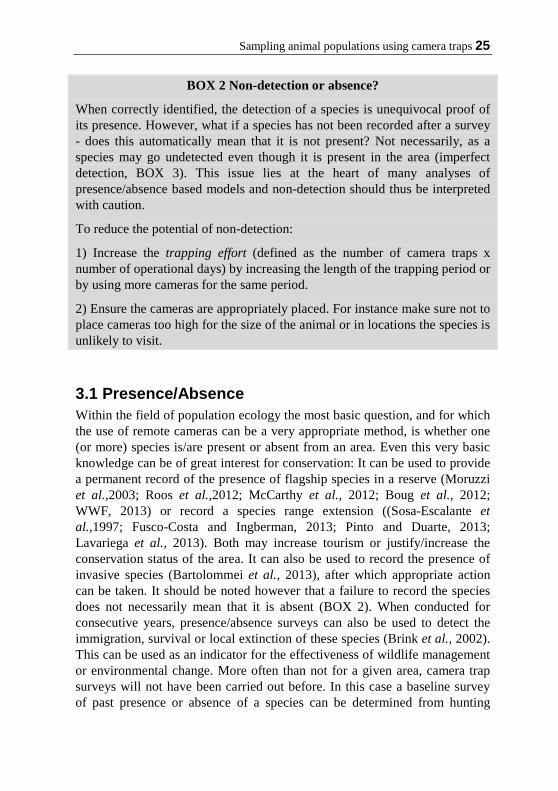
BOX 2 Non-detection or absence?
When correctly identified, the detection of a species is unequivocal proof of its presence. However, what if a species has not been recorded after a survey - does this automatically mean that it is not present? Not necessarily, as a species may go undetected even though it is present in the area (imperfect detection, BOX 3). This issue lies at the heart of many analyses of presence/absence based models and non-detection should thus be interpreted with caution.
To reduce the potential of non-detection:
1) Increase the trapping effort (defined as the number of camera traps x number of operational days) by increasing the length of the trapping period or by using more cameras for the same period.
2) Ensure the cameras are appropriately placed. For instance make sure not to place cameras too high for the size of the animal or in locations the species is unlikely to visit.
3.1 Presence/Absence Within the field of population ecology the most basic question, and for which the use of remote cameras can be a very appropriate method, is whether one (or more) species is/are present or absent from an area. Even this very basic knowledge can be of great interest for conservation: It can be used to provide a permanent record of the presence of flagship species in a reserve (Moruzzi et al.,2003; Roos et al.,2012; McCarthy et al., 2012; Boug et al., 2012; WWF, 2013) or record a species range extension ((Sosa-Escalante et al.,1997; Fusco-Costa and Ingberman, 2013; Pinto and Duarte, 2013; Lavariega et al., 2013). Both may increase tourism or justify/increase the conservation status of the area. It can also be used to record the presence of invasive species (Bartolommei et al., 2013), after which appropriate action can be taken. It should be noted however that a failure to record the species does not necessarily mean that it is absent (BOX 2). When conducted for consecutive years, presence/absence surveys can also be used to detect the immigration, survival or local extinction of these species (Brink et al., 2002). This can be used as an indicator for the effectiveness of wildlife management or environmental change. More often than not for a given area, camera trap surveys will not have been carried out before. In this case a baseline survey of past presence or absence of a species can be determined from hunting
26 Expedition Field Techniques
records, interviews with local people, museum records or reports from other previous research.
Presence/absence data becomes even more valuable when used in combination with environmental variables such as habitat type, anthropological disturbance, fragmentation level or presence of other species. This combined data can be used to create a model of species distribution patterns or resource selection and can be used in addition to data gathered from other survey types such as spoor counts, transects or interviews with local hunters (Wilting et al., 2010; Alonso, 2013).
3.1.1 Survey design for Presence/Absence Camera position Cameras need to be placed in such way that they maximise the detection probability of the species of interest (BOX 3). Cameras should therefore be placed in locations where the species is/are most likely to be encountered and detected (Otis et al., 1978; Williams et al., 2002). Unlike occupancy surveys (Section 3.4), there is no need to fit models to the data and perform complicated statistical analyses that incorporate various assumptions such as camera spacing, detection probabilities, and minimum sample size, cameras can be placed as close together or as far apart as is efficient and effective.
Finding the locations with high detection probability requires certain knowledge of a species’ ecology. Most felines and ungulates prefer to use trails, while species such as terrestrial birds, porcupines and armadillos might actively avoid these; places with high food availability (such as fruiting trees) will undoubtedly be visited frequently (civets, peccaries, chevrotains, agouti feed on fruits). In turn, some animals may avoid hill tops others, such as certain deer species, prefer to stay on the higher and often drier ridges. Salt licks are often visited by herbivores to increase their mineral intake, while carnivores might visit these to look for prey. It is worth taking note of these preferences before the start of the survey.
When trying to detect the presence of more than one species (species inventories), cameras will have to be placed in locations that optimise the detection of all the target species. This will not always be possible as different species will have a preference for different areas or micro-habitats within a survey site (trail/non-trail, open areas/dense thickets, etc.). A compromise will have to be made with cameras being placed across the micro-habitats and only species that have detection probabilities > 0 should be included in the survey (BOX 3).
Sampling animal populations using camera traps 27
Trapping area A study conducted by Tobler et al., (2008) found that the size of the trapping area did not influence the number of species caught on camera. It is logistically most efficient to keep the trapping area as small as possible, as long as the sampling area remains representative for the total habitat. If the field site consists of two different habitat types and the cameras are only operational in one, the results of one cannot be extrapolated to the other.
Trap effort There is no exact way of telling how long to trap for until after the results are collated. For the purpose of establishing the presence of a species a single record is enough, after which the cameras have served their purpose and can be deployed in a different survey. However a critical question is; how long does it take to obtain the first image of a species? There is no definitive answer for this, but generally the rarer the species is (that is, the lower its density), the longer it takes to obtain a record. Some of the most common species can be captured in as little as a few trapping days, while for very rare species (species with low detection probability), such as carnivores, this may take as long as 1,000-6,000 trapping days (Dillon and Kelly 2007; Tobler et al., 2008; Cheyne and Macdonald, 2011). It is often these cryptic carnivores that are the main subject of camera trapping surveys and of most interest to conservation practitioners.
For species inventory surveys there is the additional issue that some species are more readily detected than others. In addition, it is often practically impossible to detect all the occurring species in one survey. Tobler et al., (2008) for instance captured only 86% (24 out of 28) of the large- and medium-bodied mammals known to occur in a rainforest after 2,340 camera trap days and Silveira et al., (2003) recorded 64% (16 out of 28) in 1,035 trap days, of which many species showed up in less than three photos. However, the more common species can still be recorded even within a relatively short survey period of for instance 500 camera trap days (O’Connell Jr et al., 2006; Tobler et al., 2008; Kelly and Holub, 2008). The rarefied species accumulation curve (Section 3.2) gives a good indication of the completeness of a survey.
28 Expedition Field Techniques
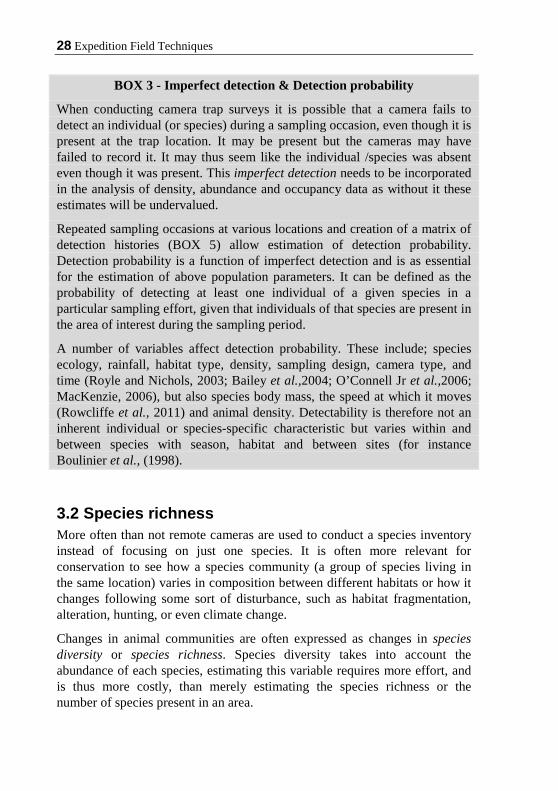
BOX 3 - Imperfect detection & Detection probability
When conducting camera trap surveys it is possible that a camera fails to detect an individual (or species) during a sampling occasion, even though it is present at the trap location. It may be present but the cameras may have failed to record it. It may thus seem like the individual /species was absent even though it was present. This imperfect detection needs to be incorporated in the analysis of density, abundance and occupancy data as without it these estimates will be undervalued.
Repeated sampling occasions at various locations and creation of a matrix of detection histories (BOX 5) allow estimation of detection probability. Detection probability is a function of imperfect detection and is as essential for the estimation of above population parameters. It can be defined as the probability of detecting at least one individual of a given species in a particular sampling effort, given that individuals of that species are present in the area of interest during the sampling period.
A number of variables affect detection probability. These include; species ecology, rainfall, habitat type, density, sampling design, camera type, and time (Royle and Nichols, 2003; Bailey et al.,2004; O’Connell Jr et al.,2006; MacKenzie, 2006), but also species body mass, the speed at which it moves (Rowcliffe et al., 2011) and animal density. Detectability is therefore not an inherent individual or species-specific characteristic but varies within and between species with season, habitat and between sites (for instance Boulinier et al., (1998).
3.2 Species richness More often than not remote cameras are used to conduct a species inventory instead of focusing on just one species. It is often more relevant for conservation to see how a species community (a group of species living in the same location) varies in composition between different habitats or how it changes following some sort of disturbance, such as habitat fragmentation, alteration, hunting, or even climate change.
Changes in animal communities are often expressed as changes in species diversity or species richness. Species diversity takes into account the abundance of each species, estimating this variable requires more effort, and is thus more costly, than merely estimating the species richness or the number of species present in an area.

Sampling animal populations using camera traps 29
Studies that aim to assess species richness can be extremely valuable for conservationists and wildlife managers especially when surveys are carried out over successive years or between sites. By carrying out surveys in different areas (ideally using the same methods) it is possible to compare species richness and possibly identify areas of high conservation value (Jennings et al., 2003). The management of these areas could then be prioritised over other areas which exhibit lower species richness. Surveys over adjacent areas can also give an indication of species turnover rates (β-diversity) which, when added up, can give an indication of the overall diversity (γ-diversity). When the survey is repeated at the same site, changes in species richness can be used as an indication of the effectiveness management applications or the impact human disturbances might have on an area. Species richness is therefore often used as a variable to evaluate the effect of conservation management and different impacts on biodiversity. Its measurement is considered one of the most important variables in wildlife conservation biology (Colwell and Coddington, 1994; Gotelli and Colwell, 2011).
Undetected species Even though species richness is an important variable to measure, it is far from easy to do so accurately. Recording the total species richness (a species census) with the use of remote cameras (or any other survey technique) is generally too costly, time consuming and requires substantial effort. Therefore, in nearly any survey that aims to estimate species richness, one or more species remain undetected. The observed species richness will therefore almost always be lower than the actual species richness.
This negative bias is especially distinct in environments that are very species-rich and that contain a large number of rare species, such as tropical rainforests. The main reason being that rare species, of which there are many in this environment, have lower detection probabilities than common species (BOX 3). Their detection therefore requires a substantially larger effort, which can be achieved by increasing the number of sampling occasions or sampling period. This variation in detection probability is called heterogeneity (BOX 4). Since detection probabilities vary, almost per definition, per species, heterogeneity must be accounted for when conducting species richness surveys. Much work has been carried out to address this issue. As a result various species richness estimators have been and are being developed that incorporate heterogeneity when calculating the actual species richness from a sample. Non-parametric species richness estimators, such as the jack-knife estimator (Burnham and Overton, 1979), account for
30 Expedition Field Techniques
heterogeneity and have been reported to perform well in camera trap studies (Tobler et al., 2008).
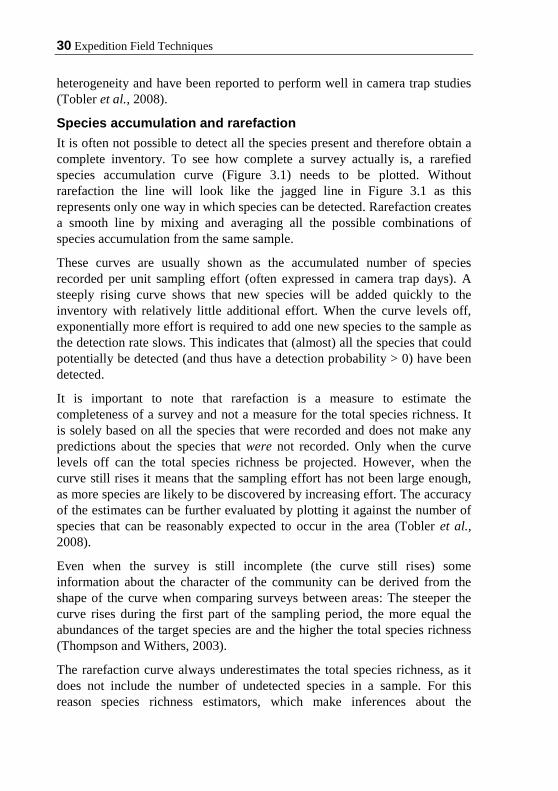
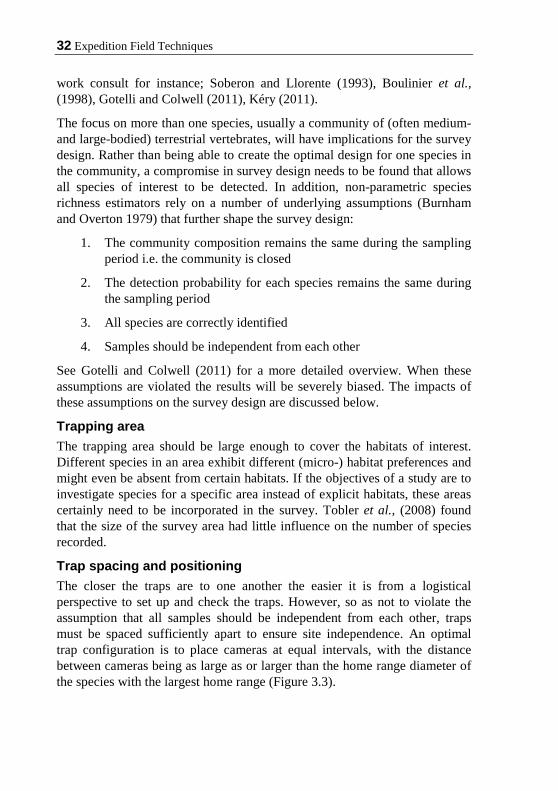
Species accumulation and rarefaction It is often not possible to detect all the species present and therefore obtain a complete inventory. To see how complete a survey actually is, a rarefied species accumulation curve (Figure 3.1) needs to be plotted. Without rarefaction the line will look like the jagged line in Figure 3.1 as this represents only one way in which species can be detected. Rarefaction creates a smooth line by mixing and averaging all the possible combinations of species accumulation from the same sample.
These curves are usually shown as the accumulated number of species recorded per unit sampling effort (often expressed in camera trap days). A steeply rising curve shows that new species will be added quickly to the inventory with relatively little additional effort. When the curve levels off, exponentially more effort is required to add one new species to the sample as the detection rate slows. This indicates that (almost) all the species that could potentially be detected (and thus have a detection probability > 0) have been detected.
It is important to note that rarefaction is a measure to estimate the completeness of a survey and not a measure for the total species richness. It is solely based on all the species that were recorded and does not make any predictions about the species that were not recorded. Only when the curve levels off can the total species richness be projected. However, when the curve still rises it means that the sampling effort has not been large enough, as more species are likely to be discovered by increasing effort. The accuracy of the estimates can be further evaluated by plotting it against the number of species that can be reasonably expected to occur in the area (Tobler et al., 2008).
Even when the survey is still incomplete (the curve still rises) some information about the character of the community can be derived from the shape of the curve when comparing surveys between areas: The steeper the curve rises during the first part of the sampling period, the more equal the abundances of the target species are and the higher the total species richness (Thompson and Withers, 2003).
The rarefaction curve always underestimates the total species richness, as it does not include the number of undetected species in a sample. For this reason species richness estimators, which make inferences about the

Sampling animal populations using camera traps 31
undetected species from the detected species, have been developed. These are discussed in Chapter 6 - Data Analysis.
3.2.1 Species Richness Survey design There are a number of methods to calculate species richness, all of which aim to estimate the proportion of undetected species in a sample. Within camera trap studies, the two most appropriate methods for species richness estimation are (1) the use of non-parametric species richness estimators that are related to capture-recapture models (Colwell and Coddington, 1994; Gotelli and Colwell, 2001) and (2) the community equivalent of the occupancy/capture-recapture approach (Dorazio and Royle 2005). This section briefly describes the survey design considerations for the first method. Survey design and analysis of the second method are described in Section 3.4 as this uses the occupancy approach.
Figure 3.1 – Species accumulation, rarefaction (Species observed) and Jackknife richness estimator curves
A thorough understanding of each method is essential for their application but because a full review is well beyond the scope of this guide, additional literature should be consulted. In addition to the aforementioned bodies of
32 Expedition Field Techniques
work consult for instance; Soberon and Llorente (1993), Boulinier et al., (1998), Gotelli and Colwell (2011), Kéry (2011).
The focus on more than one species, usually a community of (often medium- and large-bodied) terrestrial vertebrates, will have implications for the survey design. Rather than being able to create the optimal design for one species in the community, a compromise in survey design needs to be found that allows all species of interest to be detected. In addition, non-parametric species richness estimators rely on a number of underlying assumptions (Burnham and Overton 1979) that further shape the survey design:
1. The community composition remains the same during the sampling period i.e. the community is closed
2. The detection probability for each species remains the same during the sampling period
3. All species are correctly identified
4. Samples should be independent from each other
See Gotelli and Colwell (2011) for a more detailed overview. When these assumptions are violated the results will be severely biased. The impacts of these assumptions on the survey design are discussed below.
Trapping area The trapping area should be large enough to cover the habitats of interest. Different species in an area exhibit different (micro-) habitat preferences and might even be absent from certain habitats. If the objectives of a study are to investigate species for a specific area instead of explicit habitats, these areas certainly need to be incorporated in the survey. Tobler et al., (2008) found that the size of the survey area had little influence on the number of species recorded.
Trap spacing and positioning The closer the traps are to one another the easier it is from a logistical perspective to set up and check the traps. However, so as not to violate the assumption that all samples should be independent from each other, traps must be spaced sufficiently apart to ensure site independence. An optimal trap configuration is to place cameras at equal intervals, with the distance between cameras being as large as or larger than the home range diameter of the species with the largest home range (Figure 3.3).

Sampling animal populations using camera traps 33
Figure 3.3 – Trap configuration for species richness surveys. Traps are spaced on the intersections of a grid with square grid cells. The length of each cell equals or exceeds the diameter of the species with the largest home range to minimise the chances of an animal being detected at more than one camera, thereby biasing results.
To avoid any bias in the sampled community, cameras should be preferably placed in/at random environments and locations. This means that camera locations should include trails as well as non-trails and incorporate different habitats present in the area (Kays et al., 2009). This is important as species use the environment differently, with some animals avoiding trails, others using trails as much as non-trails, while others actively avoid trails (Srbek-Araujo and Chiarello, 2013).
Trap effort It is commonly known that the species count increases with sampling effort. The more trapping days a camera trap survey counts, the more (especially rare) species are likely to be detected. As common species are more abundant it gives them a higher chance of being recorded early in the survey. Conversely, the rarer a species, the more effort is required to record it. It therefore pays to increase the sampling effort by leaving cameras out for longer period or to use more cameras for the same period. When the focus is on rare species MacKenzie and Royle (2005) suggest conducting fewer surveys at more sampling points, while for common species it is more efficient to sample fewer stations more intensely. As a general rule of thumb, cameras should ideally be operational for one month to obtain a fairly comprehensive list of the species present in the area.
34 Expedition Field Techniques
3.2.2 Data analysis Several species richness estimators have been developed, but they all use the non-observed species in a survey to calculate actual species richness. Some are based on abundance data, while others derive an estimate from presence/absence (incidence) data alone. Even though estimates from species richness estimators give a more accurate estimate for species richness than rarefaction, they still underestimate actual species richness (Gotelli and Colwell, 2011). Tobler et al., (2008) found that the non-parametric jack-knife estimator (Burnham and Overton 1979; Pollock and Otto, 1983), which allows capture heterogeneity (BOX 4), performed best for his camera trap study and the most commonly used estimator for camera trap studies.
Species richness estimation through the above two methods can be done with the assistance of the software program EstimateS (Colwell, 2006).
3.3 Abundance and density Estimating abundance and density, including their relation to habitat type and other variables lies at the heart of population dynamics studies. They are the two most important measures of population status and are used by conservationists to monitor the effectiveness of wildlife management and to assess human impact on animal populations.
Camera trapping has proven to be a very useful tool for estimating abundance and density for medium- to large-bodied terrestrial mammals that are individually recognisable. It may therefore be unsurprising that most camera trap surveys aim to estimate exactly these parameters.
Estimating species abundances is typically used for wildlife populations from which each individual can be distinguished from each other by their unique coat pattern, through the use of mark-recapture models. These patterns do have to be visible and distinguishable on camera trap photos, which preclude species which are so small that individually recognisable markings cannot be identified with enough certainty from this technique.
The majority of camera traps studies have focused on abundance estimation of elusive and wide ranging (tropical) forest felids, with an emphasis on tigers, jaguars and leopards (Karanth 1995; O’Brien et al., 2003; Karanth and Nichols, 1998; Silver, 2004; Wang and Macdonald, 2009). Even so, other species such as small cats (esp. ocelots), puma, maned wolf, Brazilian tapir, coyote and Andean bear have been studied as well (Trolle and Kéry, 2003; Trolle et al., 2007; Larrucea et al., 2007; Kelly et al., 2008). Camera trapping has proven to be the most effective method to survey forest felids as they
Sampling animal populations using camera traps 35
have been difficult to study using traditional methods, due to their elusiveness, low density, wide ranging nature and the specific environment they inhabit.
BOX 4 - Heterogeneity
Consider a population of a species that is made up of individuals of different age and sex. Add to these variables that each animal has a different social status, habitat use and physiology and it becomes clear that every individual is unique in appearance, in the way it behaves and moves through its environment. These variables all contribute to heterogeneity (variation) in detection probability within a species. For instance, a young male badger could have a much larger home range and patrols its territory more often than a female badger which is nursing her new-born cubs. We can safely assume that our young male is more likely to be detected at multiple sites across a larger area. The male badger therefore has a higher detection probability than the female. Heterogeneity is clearly an important variable to incorporate when estimating various population parameters.
The detection probability for a certain individual can also change over time and between seasons (Harestad and Bunnell, 1979). For instance when females start giving birth or when animals go into hibernation, their movements will be greatly reduced thus leading to a reduction in detection probability. It is however very important to know that when estimating abundance and occupancy the detection probabilities are assumed to remain the same during each survey period.
A camera survey in which occupancy, detection probability and density are variables of interest should therefore be conducted within one ‘season’ and explicitly not span any more or results can be severely biased.
Heterogeneity in detection probability also occurs at the community level that is; between species. The main reason for this is because species vary in abundance, but the differences in behaviour, movement, body mass and appearance are also important. Again, it is very important to account for and incorporate heterogeneity when conducting species richness surveys. Heterogeneity can be accounted for and can be calculated using various closed and open population models (Burnham and Overton, 1978) that are incorporated in the analytical software programs PRESENCE, MARK and EstimateS (Chapter 6).
36 Expedition Field Techniques
More recently, methods have also been developed to estimate abundance for species that lack markings or for populations of which only a part of the individuals can be individually identified. Examples are ‘permanent’ markings (such as scars, antler shape, coat colour) or by tagging animals.
Two important limitations of abundance and density studies are the large number of camera traps and thousands of trapping days that are often needed to provide reliable results. These limitations make these surveys less suitable for short expeditions and many student projects. It is thus worth considering whether or not abundance surveys are needed to fulfil your aims or if other, cheaper and more convenient techniques such as occupancy modelling might be equally appropriate.
In the sections below a summary is provided of the various methods used to estimate density and abundance, a section on open and closed populations, and survey designs.
3.3.1 Characteristics of the sample population For analytical purposes the animal population can be divided into three categories. (1) Populations in which each species has an individually identifiable marking, (2) A population which consists of marked and unmarked individuals and (3) A population in which none of the individuals can be identified individually.
For each category different methods have been developed which allows the estimation of density. These are described below:
1. Individually marked species Two methods are widely used to estimate abundance and density using camera traps for individually recognisable species: conventional capture-recapture (CR) techniques and the more recently developed spatially explicit capture-recapture (SECR) models. Through the CR method abundance estimates are calculated. From this and through a separate process, density can be calculated. SECR calculates density directly without the need for this extra step and does not give abundance estimates.
Both capture-recapture methods rely on the principles of repeated sampling and individual identification of animals, which generate individual capture histories from which abundance and density estimates (as well as other model parameters) can be estimated.
One major problem with conventional CR models is that they fail to take into account the spatial relationships between the animal and the cameras. The

Sampling animal populations using camera traps 37
fundamental concern here is that animals which are located closer to camera traps are more likely to be captured than animals which are further away (or whose home range core lies further away) from the traps (Borchers, 2012). This leads to unmodelled heterogeneity in detection probability (BOX 4) and gives rise to skewed estimates (Harmsen et al., 2011). Other sampling variables, such as trap spacing, home range size, and the number of traps per home range also influence detection probability (Borchers and Efford, 2008) and can lead to heterogeneity. This makes comparison of results between CR surveys with different methods problematic. For instance if, all other variables being equal, only one camera is placed in an individual’s home range its detection probability will be lower than if there were two or more cameras to detect it (Efford et al., 2009). Density from CR models can be estimated from the abundance data by calculating the effective trap area, which unfortunately brings with it problems of its own (see Section 3.3).
Spatially explicit capture-recapture models, developed by Efford et al., (2004), use the distribution of home ranges and camera trap locations to estimate density directly instead of the two-step process which is used in CR. SECR accommodates heterogeneity by incorporating individuals’ distribution relative to the cameras. This has the additional advantage that it is neither biased by the ad-hoc and rather arbitrary estimation of density (Borchers and Efford, 2008; Efford et al., 2009), making this a more accurate method to estimate density compared to conventional CR. Movement or removal of cameras, for instance because of camera failure, can be modelled as well (Borchers and Efford, 2008). SECR is a very promising method for estimation of density using camera traps. It is likely to become the preferred method over conventional CR.
An additional concern with regards to CR methods is that densities derived from SECR are generally lower than CR methods (Obbard et al.,2010; Noss et al., 2012; Gerber et al., 2012). As SECR results are supposedly more accurate, this shows that CR is likely to overestimate densities when applying the traditional methods.
It is beyond the scope of this guide to discuss the underlying principles and analysis of either method in sufficient detail, but a good understanding of both methods is essential to develop and carry out a well-designed and robust camera trap study. Various publications are available with in-depth information about the methods. The following works are highly recommended; Otis et al., (1978), Chapter 14-19 of Williams et al., (2002),
38 Expedition Field Techniques
Amstrup (2005), Borchers and Efford (2008), Efford et al., (2009), Borchers (2012).
2. Marked and unmarked individuals in a population In some situations only part of an animal population can be marked (for instance by tagging certain individuals through capture and giving them a unique marking (Mace et al., 1994)). In other situations only a number of individuals in a population have individually identifiable markings (for instance scars, torn ears or other physical unique markings such as tail length or antlers).
Tagging part of a population will not necessarily aid abundance estimates as the number of tagged individuals is not always known. For instance, over time some animals might lose their tags or might die. A method that takes this into account has recently been developed by McClintock et al., (2009), who compared capture rates of marked with unmarked individuals to compute abundance estimates. The method has not (yet) found much resonance within the camera trapping world as many studies rely on individuals that are already identifiable without having to capture them. Only a few camera trap studies have implemented the method to date, for instance surveying white-tailed deer (Weckel et al.,2011). Even so, the methods to analyse these types of data is available in the software program MARK.
3. Unmarked species Royle and Nichols (2003) created a model that allows abundance estimation based on occupancy modelling for species that cannot be identified individually (Occupancy is discussed in Section 3.4). The Royle & Nichols abundance model can be analysed using the software programs PRESENCE and MARK. Rowcliffe et al., (2008; 2011) conceived a different approach; the Random Encounter Model (REM). This method estimates density without the need for individual recognition and is based on contact rates between animals and camera traps. A practical drawback of this method however is that it relies on independent estimates of the speed with which the animals move (day range) and an accurate estimation of average group size, both of which may be difficult to obtain for certain species, or for night time movements. Cameras should be placed randomly, meaning that specific features, such as trails, should be sampled in proportion to their coverage in the landscape (Rowcliffe et al., 2013). This method is useful for more abundant species, but the randomised placement of cameras may lead to detection rates that are too low, making capture-recapture techniques the preferred option (Rowcliffe et al., 2013).
Sampling animal populations using camera traps 39
BOX 5 – Detection history
Detection history is a sequence of 1’s and/or 0’s denoting detection (1) and non-detection (0) of a species (in the occupancy surveys) or an individual (in the case of individually recognisable species: CR or SECR surveys) at a given camera location. A capture history of 10011 for instance, denotes that an individual (or species in the case of occupancy surveys) was detected during sampling occasions 1, 4 and 5, and not detected at occasions 2 and 3. The matrix of capture histories for each camera in the survey is used to make inferences about abundance, density or occupancy estimates.
Species with high detection probabilities will have a higher proportion of 1’s than species with low detection probabilities.
3.3.2 Open or closed population models? Sometimes camera trapping can only be carried out in a single sampling season; a survey period that is short enough to assume that the population does not change during the sampling period. In this case closed population models can be used to estimate abundance and density. More often however, camera trapping occurs over multiple seasons (for instance when camera trapping is carried out repeatedly over subsequent years). Because of this relatively long period it is likely that the population undergoes demographic changes due to births, deaths and migration. Under such circumstances open population models are used to not only model abundance and density, but also provide estimates of population changes over time. Note that both open and closed population models can be incorporated in CR as well as SECR studies (see below).
Closed population models Studies that aim to obtain animal abundances and densities using camera traps typically rely on the principle of closed population models (Otis et al., 1978; White, 1982), through which the size of an animal population can be estimated by using photographic recaptures. A population is considered spatially and temporarily closed if the population does not change during the survey period. This means that it is expected that deaths, births or migration do not occur. In addition to this first point, Otis et al., (1978) describe two other (points 2 and 3) assumptions underlying closed population capture-recapture models that may not be violated:
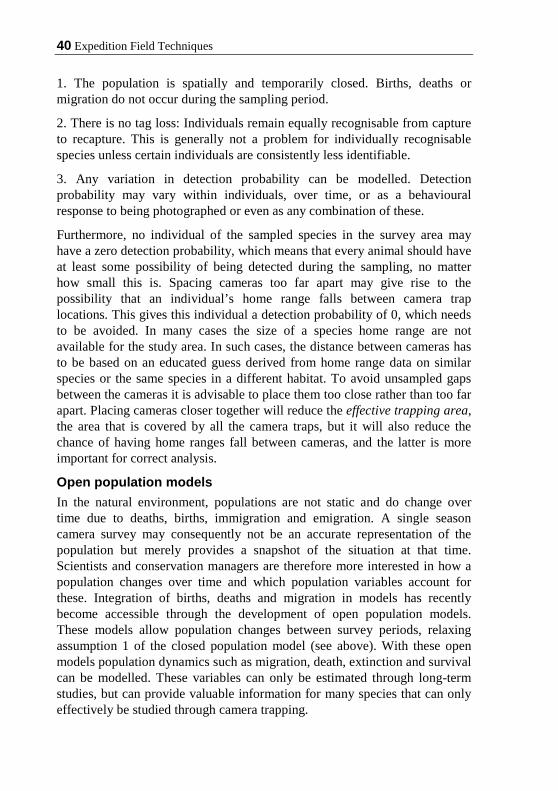
40 Expedition Field Techniques
1. The population is spatially and temporarily closed. Births, deaths or migration do not occur during the sampling period.
2. There is no tag loss: Individuals remain equally recognisable from capture to recapture. This is generally not a problem for individually recognisable species unless certain individuals are consistently less identifiable.
3. Any variation in detection probability can be modelled. Detection probability may vary within individuals, over time, or as a behavioural response to being photographed or even as any combination of these.
Furthermore, no individual of the sampled species in the survey area may have a zero detection probability, which means that every animal should have at least some possibility of being detected during the sampling, no matter how small this is. Spacing cameras too far apart may give rise to the possibility that an individual’s home range falls between camera trap locations. This gives this individual a detection probability of 0, which needs to be avoided. In many cases the size of a species home range are not available for the study area. In such cases, the distance between cameras has to be based on an educated guess derived from home range data on similar species or the same species in a different habitat. To avoid unsampled gaps between the cameras it is advisable to place them too close rather than too far apart. Placing cameras closer together will reduce the effective trapping area, the area that is covered by all the camera traps, but it will also reduce the chance of having home ranges fall between cameras, and the latter is more important for correct analysis.
Open population models In the natural environment, populations are not static and do change over time due to deaths, births, immigration and emigration. A single season camera survey may consequently not be an accurate representation of the population but merely provides a snapshot of the situation at that time. Scientists and conservation managers are therefore more interested in how a population changes over time and which population variables account for these. Integration of births, deaths and migration in models has recently become accessible through the development of open population models. These models allow population changes between survey periods, relaxing assumption 1 of the closed population model (see above). With these open models population dynamics such as migration, death, extinction and survival can be modelled. These variables can only be estimated through long-term studies, but can provide valuable information for many species that can only effectively be studied through camera trapping.

Sampling animal populations using camera traps 41
Open population models are very similar to closed population models in their survey design. However, instead of a single season, multiple seasons are sampled with longer intervals during which the population is open to change. As with closed population modelling, populations are assumed to remain closed within each survey season and period. Open population models and their application are well described for CR methods in; Pollock et al., (1990), Kendall et al., (1995), Williams et al., (2002), Karanth et al., (2006) and Gardner et al., (2010) describes open population models in SECR applications.
3.3.3 Survey methods and design This section focuses on the design of the two most widely used methods, CR and SECR, to estimate abundance and density from individually marked populations. As explained previously, conventional capture-recapture methods have traditionally been used to estimate abundance from which density can be estimated using a two-step ad-hoc approach. Spatially explicit capture-recapture is a more recently adopted approach in which density is directly estimated. Both survey methods differ in their underlying principles, camera setup and analysis.
Conventional Capture-Recapture models When camera trapping, animals are usually not detected very often (their detection probability is low). This is especially true for elusive and/or wide ranging carnivores and other rare species. To obtain sufficient data, it is important to optimise the detection rates as much as possible by placing cameras in locations that are frequently visited by the target species. For instance by choosing a location based on signs of recent animal activity (O’Connell et al., 2010) or those locations that might be regularly visited, such as salt licks, water holes or marking spots. When surveying felids for example, cameras are best placed on trails as cats are known to prefer regular trails to move around. Knowledge of the biology of the species is essential in choosing the optimum locations for the cameras, as different species exhibit different behaviour in the way they move through their habitat.
Trap spacing As mentioned previously, cameras are ideally placed on the intersections of the grid cells of a square grid which is superimposed on the study area (Figure 3.3) as this maximises the study area size. However, Wegge et al., (2004) and Dillon and Kelly (2007) showed that density estimates decreased with increasing trap spacing. The distance between camera trap stations

42 Expedition Field Techniques
should thus be small enough not to result in density estimates that are lower because of the trap spacing. Spacing should also ensure no gaps between cameras exist in which animals can go undetected and have a detection probability of zero. Generally, for smaller species (small cats, civets and small herbivores) distance between cameras may be as little as 500 m, while for larger and wide ranging species (large cats such as tigers, jaguars, leopards and some large herbivores) this can be as much as 1 - 4 km. Contrary to occupancy surveys, it is acceptable and even preferable for individual animals to be photographed at different camera locations as placing more than one camera trap in an individual’s home range increases its detection probability. However, this also causes heterogeneity in detection between individuals and needs to be accounted for by incorporating models that take this into consideration (O’Connell et al., 2010). Heterogeneity can be minimised by placing an equal number of cameras per home range and Dillon and Kelly (2007) recommended placing at least 2 camera traps in each individual’s home range.
Trapping area The size of the trapping area should be sufficiently large to ensure that enough animals are recorded and produce reliable abundance estimates but also to avoid violating the assumption of a geographically closed population (White 1982). To account for this Maffei and Noss (2008) reported the area should be at least four times the size of the smallest known, or estimated, home range of the target species. However, home ranges of the target species may not always be known. Even if they are, home ranges may vary with season, age, sex as well as habitat type and quality. A home range size reported from a different study may therefore not be accurate. Home ranges can be estimated by physically trapping a few animals and using telemetry or GPS collars to calculate the home range size from these sample animals, but this is costly, time consuming, invasive and often impractical. When this method is not available, the next best thing is to survey as large an area as possible. When the minimum size of both trapping area and trap spacing (trap density) are known, the total number of required camera locations can be calculated. If not enough cameras are available to survey the area in one time, the cameras can be rotated among the area (see below).
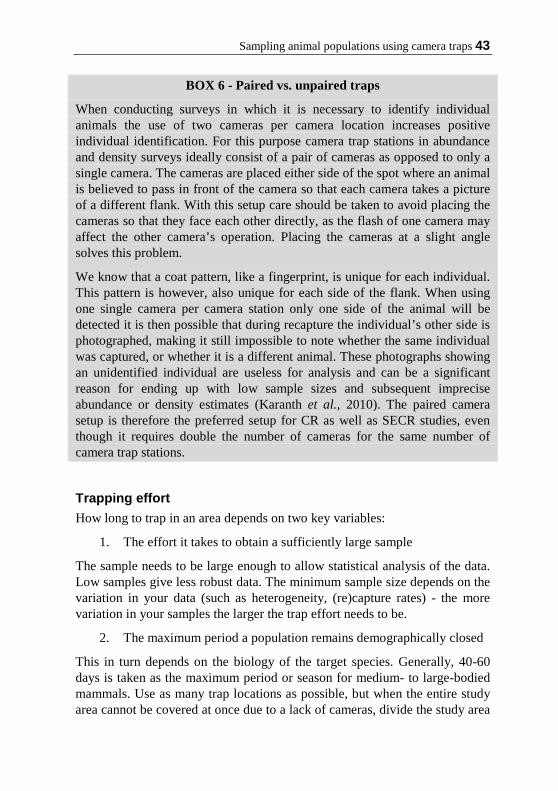
Sampling animal populations using camera traps 43
BOX 6 - Paired vs. unpaired traps
When conducting surveys in which it is necessary to identify individual animals the use of two cameras per camera location increases positive individual identification. For this purpose camera trap stations in abundance and density surveys ideally consist of a pair of cameras as opposed to only a single camera. The cameras are placed either side of the spot where an animal is believed to pass in front of the camera so that each camera takes a picture of a different flank. With this setup care should be taken to avoid placing the cameras so that they face each other directly, as the flash of one camera may affect the other camera’s operation. Placing the cameras at a slight angle solves this problem.
We know that a coat pattern, like a fingerprint, is unique for each individual. This pattern is however, also unique for each side of the flank. When using one single camera per camera station only one side of the animal will be detected it is then possible that during recapture the individual’s other side is photographed, making it still impossible to note whether the same individual was captured, or whether it is a different animal. These photographs showing an unidentified individual are useless for analysis and can be a significant reason for ending up with low sample sizes and subsequent imprecise abundance or density estimates (Karanth et al., 2010). The paired camera setup is therefore the preferred setup for CR as well as SECR studies, even though it requires double the number of cameras for the same number of camera trap stations.
Trapping effort How long to trap in an area depends on two key variables:
1. The effort it takes to obtain a sufficiently large sample
The sample needs to be large enough to allow statistical analysis of the data. Low samples give less robust data. The minimum sample size depends on the variation in your data (such as heterogeneity, (re)capture rates) - the more variation in your samples the larger the trap effort needs to be.
2. The maximum period a population remains demographically closed
This in turn depends on the biology of the target species. Generally, 40-60 days is taken as the maximum period or season for medium- to large-bodied mammals. Use as many trap locations as possible, but when the entire study area cannot be covered at once due to a lack of cameras, divide the study area
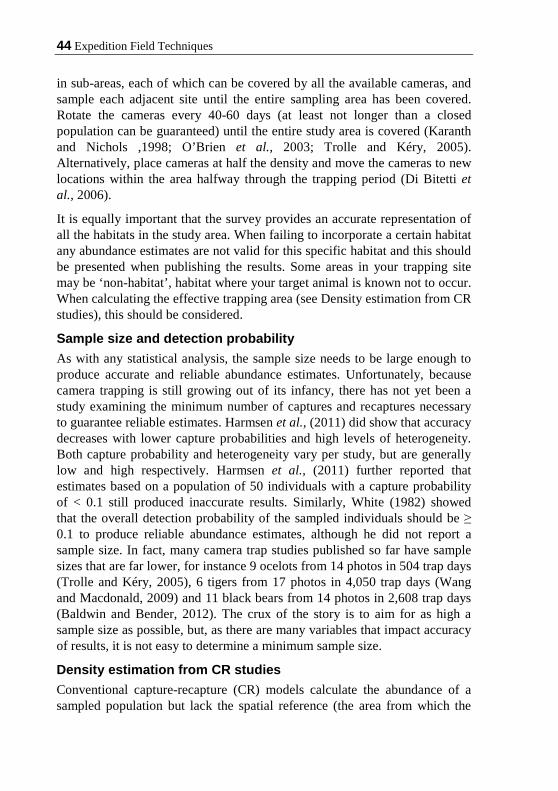
44 Expedition Field Techniques
in sub-areas, each of which can be covered by all the available cameras, and sample each adjacent site until the entire sampling area has been covered. Rotate the cameras every 40-60 days (at least not longer than a closed population can be guaranteed) until the entire study area is covered (Karanth and Nichols ,1998; O’Brien et al., 2003; Trolle and Kéry, 2005). Alternatively, place cameras at half the density and move the cameras to new locations within the area halfway through the trapping period (Di Bitetti et al., 2006).
It is equally important that the survey provides an accurate representation of all the habitats in the study area. When failing to incorporate a certain habitat any abundance estimates are not valid for this specific habitat and this should be presented when publishing the results. Some areas in your trapping site may be ‘non-habitat’, habitat where your target animal is known not to occur. When calculating the effective trapping area (see Density estimation from CR studies), this should be considered.
Sample size and detection probability As with any statistical analysis, the sample size needs to be large enough to produce accurate and reliable abundance estimates. Unfortunately, because camera trapping is still growing out of its infancy, there has not yet been a study examining the minimum number of captures and recaptures necessary to guarantee reliable estimates. Harmsen et al., (2011) did show that accuracy decreases with lower capture probabilities and high levels of heterogeneity. Both capture probability and heterogeneity vary per study, but are generally low and high respectively. Harmsen et al., (2011) further reported that estimates based on a population of 50 individuals with a capture probability of < 0.1 still produced inaccurate results. Similarly, White (1982) showed that the overall detection probability of the sampled individuals should be ≥ 0.1 to produce reliable abundance estimates, although he did not report a sample size. In fact, many camera trap studies published so far have sample sizes that are far lower, for instance 9 ocelots from 14 photos in 504 trap days (Trolle and Kéry, 2005), 6 tigers from 17 photos in 4,050 trap days (Wang and Macdonald, 2009) and 11 black bears from 14 photos in 2,608 trap days (Baldwin and Bender, 2012). The crux of the story is to aim for as high a sample size as possible, but, as there are many variables that impact accuracy of results, it is not easy to determine a minimum sample size.
Density estimation from CR studies Conventional capture-recapture (CR) models calculate the abundance of a sampled population but lack the spatial reference (the area from which the
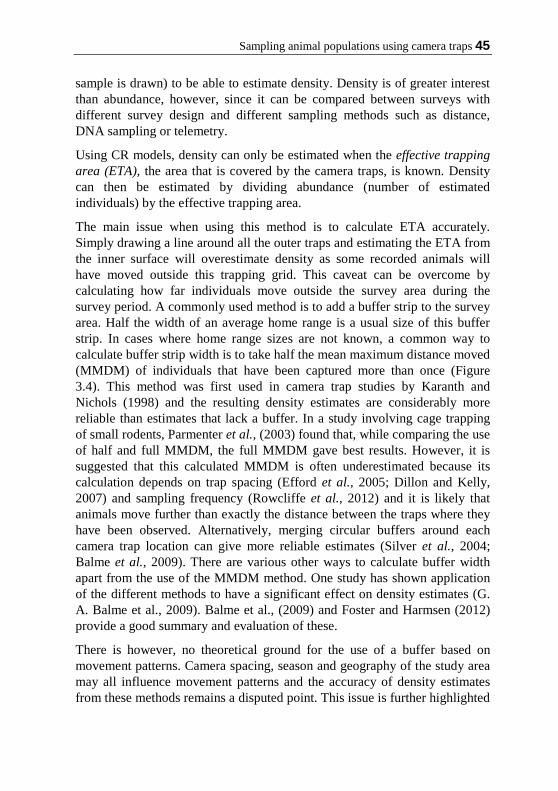
Sampling animal populations using camera traps 45
sample is drawn) to be able to estimate density. Density is of greater interest than abundance, however, since it can be compared between surveys with different survey design and different sampling methods such as distance, DNA sampling or telemetry.
Using CR models, density can only be estimated when the effective trapping area (ETA), the area that is covered by the camera traps, is known. Density can then be estimated by dividing abundance (number of estimated individuals) by the effective trapping area.
The main issue when using this method is to calculate ETA accurately. Simply drawing a line around all the outer traps and estimating the ETA from the inner surface will overestimate density as some recorded animals will have moved outside this trapping grid. This caveat can be overcome by calculating how far individuals move outside the survey area during the survey period. A commonly used method is to add a buffer strip to the survey area. Half the width of an average home range is a usual size of this buffer strip. In cases where home range sizes are not known, a common way to calculate buffer strip width is to take half the mean maximum distance moved (MMDM) of individuals that have been captured more than once (Figure 3.4). This method was first used in camera trap studies by Karanth and Nichols (1998) and the resulting density estimates are considerably more reliable than estimates that lack a buffer. In a study involving cage trapping of small rodents, Parmenter et al., (2003) found that, while comparing the use of half and full MMDM, the full MMDM gave best results. However, it is suggested that this calculated MMDM is often underestimated because its calculation depends on trap spacing (Efford et al., 2005; Dillon and Kelly, 2007) and sampling frequency (Rowcliffe et al., 2012) and it is likely that animals move further than exactly the distance between the traps where they have been observed. Alternatively, merging circular buffers around each camera trap location can give more reliable estimates (Silver et al., 2004; Balme et al., 2009). There are various other ways to calculate buffer width apart from the use of the MMDM method. One study has shown application of the different methods to have a significant effect on density estimates (G. A. Balme et al., 2009). Balme et al., (2009) and Foster and Harmsen (2012) provide a good summary and evaluation of these.
There is however, no theoretical ground for the use of a buffer based on movement patterns. Camera spacing, season and geography of the study area may all influence movement patterns and the accuracy of density estimates from these methods remains a disputed point. This issue is further highlighted
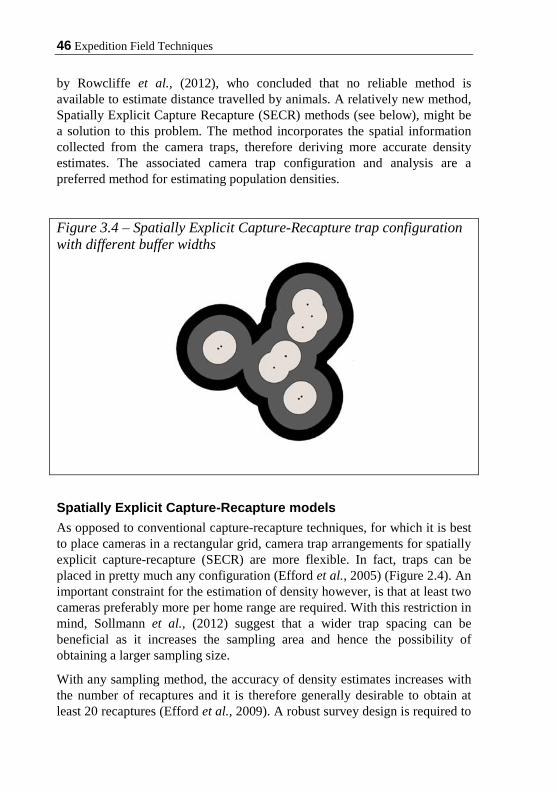
46 Expedition Field Techniques
by Rowcliffe et al., (2012), who concluded that no reliable method is available to estimate distance travelled by animals. A relatively new method, Spatially Explicit Capture Recapture (SECR) methods (see below), might be a solution to this problem. The method incorporates the spatial information collected from the camera traps, therefore deriving more accurate density estimates. The associated camera trap configuration and analysis are a preferred method for estimating population densities.
Figure 3.4 – Spatially Explicit Capture-Recapture trap configuration with different buffer widths
Spatially Explicit Capture-Recapture models As opposed to conventional capture-recapture techniques, for which it is best to place cameras in a rectangular grid, camera trap arrangements for spatially explicit capture-recapture (SECR) are more flexible. In fact, traps can be placed in pretty much any configuration (Efford et al., 2005) (Figure 2.4). An important constraint for the estimation of density however, is that at least two cameras preferably more per home range are required. With this restriction in mind, Sollmann et al., (2012) suggest that a wider trap spacing can be beneficial as it increases the sampling area and hence the possibility of obtaining a larger sampling size.
With any sampling method, the accuracy of density estimates increases with the number of recaptures and it is therefore generally desirable to obtain at least 20 recaptures (Efford et al., 2009). A robust survey design is required to
Sampling animal populations using camera traps 47
obtain reliable density estimates. However, the SECR method has only recently been developed and variables such as minimum sampling effort, camera density, minimum sample size, sampling area shape and capture probability have not yet been investigated (Foster and Harmsen, 2012). Even so, some studies provide certain guidelines, although even these are disputed. Noss et al., (2012) for example, recommends that the camera grid (area bounded by the outer camera traps) should be at least several times larger than the average home range size of the study species, while Sollmann et al., (2012) notes that area size has little influence on density estimates. Sollmann et al., (2012) did however note that their results might have been influenced by the shape of the study area, which was a narrow rectangle rather than of circular shape and suggest that this might have had an impact on estimates. So far, no studies have examined the shape of the study area on the accuracy of density estimates. However, a smaller sampling area generally results in the capture of too few animals to estimate density and other parameters.
The study by Noss et al., (2012) also found that density could not be estimated when too few individual were photographed (4-6 individuals or less), when individuals were captured and recaptured too few times (9-20 times or less), and when they were photographed at only one location. This has significant implications when surveys are used to estimate densities for wide-ranging species as well as species with small ranges in the same survey at the same time. The spacing of cameras needs to be tight enough to incorporate more than one camera in the small home ranges but the study area needs to be large enough to encompass several home ranges of also the wide-ranging species (Noss et al.,2012).
3.3.4 Data analysis Data analysis for abundance and density estimates starts with reliable identification of the individuals. Individual recognition from photos can be done by hand, but software programs such as ExtractCompare and WildID which have been specifically developed to perform automated pattern-recognition from photos. These programs can facilitate increased accuracy and thereby speed up the identification process. Yu et al., (2013) are also developing techniques in this area and should be considered.
Software programs have also been developed to assist estimation of abundance and density data. The program MARK (White and Burnham, 1999) is the standard tool to analyse data from marked individuals using conventional capture-recapture methods. Spatially-explicit capture-recapture data can be analysed in three ways. Either using the program WinBUGS
48 Expedition Field Techniques
(Gilks et al., 1994) or SPACECAP (Gopalaswamy et al., 2012) with Bayesian methods or the program DENSITY (Efford et al., 2004) with maximum likelihood methods. See Chapter 6 for more details.
3.4 Occupancy Even though assessment of density and abundance lies at the heart of population monitoring and conservation management, it is often impossible to individually mark and/or identify animals. This, plus the fact that density estimation is often relatively expensive, has led to a search for alternatives to address these shortfalls.
One such alternative has been developed by the United States Geological Survey (USGS) Amphibian Research and Monitoring Group. Researchers from this organisation first suggested that calculating the proportion of an area occupied by a species could provide a practical alternative to density as an indication of population status for populations or species that cannot be identified through individual markings (MacKenzie, 2006). From this observation the theory of occupancy was conceived. Instead of focusing on individual animals, occupancy models aim to calculate the proportion of an area that is occupied by a population (Occupancy can also be defined as the probability that a site is occupied by a species) by using repeated detection/non-detection data that are very similar as those used in CR and SECR surveys (MacKenzie et al., 2002; MacKenzie, 2006).
Estimating occupancy is not only used as a population parameter for species without markings, but also when it is impractical, too costly or simply not necessary to obtain density estimates. For example, for species living at low densities it generally requires less effort and is cheaper to collect the species presence/absence data that are needed for occupancy estimates than it is to gather the data necessary for density estimates from capture-recapture studies.
Occupancy estimates for a species are derived from the combined repeated sampling occasions (camera trap days in our situation) at various sample locations (camera trap locations). From each camera location in a survey a detection history for the species (BOX 5) is obtained, similar to those using CR and SECR methods (See Section 3.3). We are only interested whether a species is detected (1) or not (0) during a sample occasion, not how often. For a more detailed description and occupancy tutorial exercises the excellent resources created by Terri Donovan and James Hines are strongly recommended and are freely available at:

Sampling animal populations using camera traps 49
http://www.uvm.edu/rsenr/vtcfwru/spreadsheets/?Page=occupancy/occupancy.htm (Donovan and Hines, 2007). It should be noted here that at least 10-15 cameras need to be operational at any one time in order to conduct a good occupancy survey. This drawback might not make it feasible for low-budget expeditions. A species occupancy estimate and its detection probability are the two variables of interest when conducting occupancy surveys. Both variables are very much influenced by variables such as habitat type, human disturbance, prey abundance or distance from a road. For instance, the site occupancy of a pangolin will likely be lower in an area where it is hunted than in an undisturbed forest, and because it might change its behaviour to avoid being captured, this might negatively influence the chances of detection
These variables are examples of site-specific covariates. Their values will not vary within a camera trap location and within a survey season. These differ from survey-specific variables which include local environmental conditions (i.e. cloud cover or temperature). Which can vary from day to day and can influence detection probability (some animals might seek shelter when it rains for instance). It is important to account for these variables as they will bias results if not incorporated in the analysis.
So far, very few camera trapping surveys have been published to estimate occupancy (MacKenzie et al., 2005; Thorn et al., 2009), although this number is growing. A widely agreed upon, and followed, survey protocol has therefore not yet been formulated in camera trapping circles. This means that the following section on survey design should be used as a guide only, and new literature should be consulted to monitor any updates in general and species-specific survey recommendations.
3.4.1 Occupancy: survey design Since the principles behind occupancy models are similar to those of capture-recapture models to estimate abundance and density, the survey design is similar. The basis of the survey design is given by MacKenzie (2006), who identified four important assumptions that, to avoid bias, must not be violated:
1. Occupancy state of a site remains the same over the survey season A site (or camera trap location) is either occupied or unoccupied during the sampling period (or survey season), not both. As a result, the sampling period may not be too long, as the occupancy state is more likely to change over a longer period because births, deaths, immigration or emigration may influence occupancy. That is within a season the system is demographically

50 Expedition Field Techniques
closed. However, the occupancy state may vary between seasons, for instance due to habitat alteration, hunting pressure or seasonality. The time frame for which it can be assumed that a site remains demographically closed is species- and site-specific. Some basic knowledge of the biology of a species is therefore necessary to determine the length of a season.
However, in some occasions this assumption can be violated. Especially for species with large home ranges that are not completely covered by the sampling area. In such cases the species can potentially be temporarily absent or present from the site, Occupancy should then be interpreted as the use of the site by the species. Detection probability should subsequently be interpreted as the probability the species is present at the time of survey and detected at occupied or used sites (MacKenzie and Royle, 2005).
2. The probability of occupancy and detection are constant across sites or can be modelled using covariates
This means that for each camera trap location at a site, the occupancy and detection probabilities are the same or can be taken into account by modelling these. The probabilities can, for instance, vary due to habitat differences between camera trap locations and the use of different camera types (site-specific covariates) or temperature and rain (survey-specific covariates).
3. All individuals are correctly identified to belong to the correct species Hopefully this is obvious. If you mistake two species, for instance a palm civet for a banded civet, your estimates will be biased.
4. Detection of species and detection histories at each location are independent
The detection of a species at one site cannot influence its detection at another site. This means that if an individual is recorded at one camera location it may not have the chance to be recorded at a different location as well. As with assumption 1, home range size, and thus the spacing of camera stations, varies with species and habitat. A basic understanding of the biology of the target species is necessary. Note that with CR and SECR surveys, it is actually desirable for a species to be detected at more than one trap location.
Camera location When conducting occupancy surveys which focus on a single species, the cameras should be positioned in such a way as to optimise the detection probability of the target species. When conducting occupancy for multiple species, this approach is less suitable because the locations most frequented
Sampling animal populations using camera traps 51
by different species will vary and optimising capture probability for one or a few species will bias results of the others. A random approach must therefore be used, even though this may reduce overall detection probabilities.
Trap spacing Cameras should ideally be placed in a regular square grid (Figure 3.3), with one camera per station and more or less equal distances between cameras (Rovero et al., 2010). To avoid violating assumption 4 however, traps must be spaced sufficiently wide to ensure site independence. This implies that the distance between camera locations should be larger than the diameter of the species’ home range, but not so large that a species home range falls completely between camera locations. Different species therefore require different trap spacing. Unfortunately, in most cases these are not known and estimates will have to be based on existing literature and data that is available for similar species. A very general rule of thumb is to use; a 0.5-1 km spacing for high density species such as most terrestrial birds, sengi and smaller deer species; a 1-4 km for species such as cats, large deer species, tapir, bears, wild boar, hyenas and civets. Note that home ranges vary according to many variables and the above figures could be useful in the very early stages of planning a study, for instance when looking at its viability.
Trapping effort Occupancy surveys cannot be carried out with too few cameras. In fact, the minimum number of cameras operational at any one time should not be less than 10-15. Ideally the number of cameras is enough to survey the entire study area at once, but this is often impossible due to the large area size or funding restrictions to buy enough cameras. If not enough cameras are available to survey the entire study area at once, it can be divided into sub-areas (survey sites) that can be covered entirely by the available cameras. These survey sites are then surveyed for the same period length in succession, moving from one to the next adjacent site until the entire study area is covered.
Detection probability remains a dominant factor to consider in relation to trapping effort. Generally, the lower the detection probability, the longer it takes to obtain enough data, and thus a larger trapping effort is needed. This can be achieved either by sampling for a longer period or at more locations. Rovero et al., (2010) derived from simulation analysis that the accuracy of results increases more by using more camera stations than by increasing the number of survey days at a location. However, MacKenzie and Royle (2005) suggest that when surveying rare species it is more efficient to survey more
52 Expedition Field Techniques
sampling units less intensively, while for common species fewer sampling units should be surveyed more intensively.
MacKenzie and Royle (2005) further recommend that, when detection probability is high (> 0.5 per survey), sampling locations should be surveyed for a minimum of three occasions. This implies that for species with a low detection probability the number of occasions will be higher. This is generally not much of an issue for camera trap studies, as survey periods generally last for at least several weeks, and sampling locations (usually camera trap days) are resampled many times. It does become an issue however when detection probability is very low, and when camera trap days are grouped to create longer sampling occasions (see below).
Target species of camera trap surveys often have low detection probabilities, and this can be a recurring issue in occupancy surveys. Rovero et al., (2010) for instance suggests that occupancy models generally do not produce accurate results for species that show up in less than 10 - 20 % of all camera traps and have capture probabilities of < 0.1. One solution is to somehow increase capture probability. This is possible by grouping sampling occasions or by using longer sampling occasions. Linkie et al., (2007) used a sampling occasion of 2 weeks instead of the customary day (24h) when estimating occupancy for sun bears.
In any case, the population should remain closed during a survey season. For relatively long-lived species, such as most medium- to large-bodied terrestrial mammals, a maximum closure of about 40-60 days should be kept as a conservative estimate. Even so, Rovero et al., (2010) suggests two to three months is a safe assumption. For smaller-bodied species (including terrestrial birds) the closure period is generally reduced to a maximum of about 30 days. If it is necessary to increase trap effort, the camera array should be moved from the current site to an adjacent site and the 30 day sampling period should be repeated.
3.4.2 Data analysis As with density and abundance surveys, the most convenient and easiest way to analyse occupancy data is using either the software program PRESENCE (MacKenzie et al., 2002) or MARK (White, 2009), in which PRESENCE is incorporated. Please see Chapter 6 for more details.
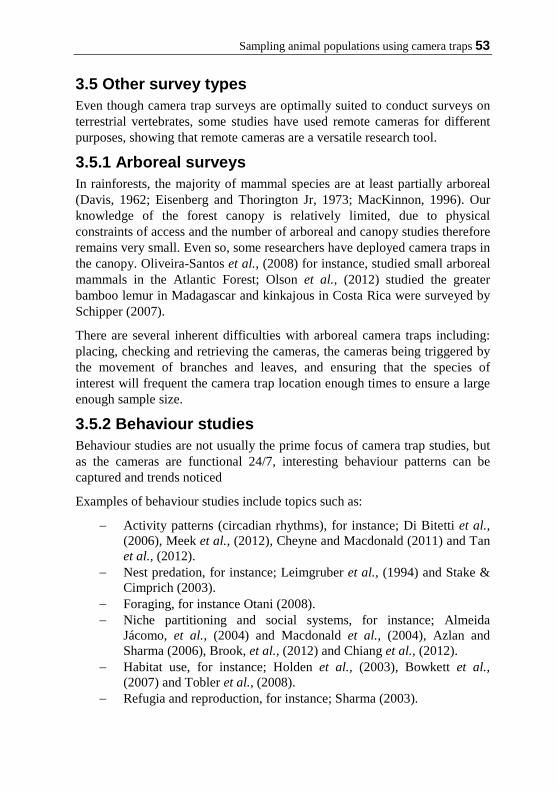
Sampling animal populations using camera traps 53
3.5 Other survey types Even though camera trap surveys are optimally suited to conduct surveys on terrestrial vertebrates, some studies have used remote cameras for different purposes, showing that remote cameras are a versatile research tool.
3.5.1 Arboreal surveys In rainforests, the majority of mammal species are at least partially arboreal (Davis, 1962; Eisenberg and Thorington Jr, 1973; MacKinnon, 1996). Our knowledge of the forest canopy is relatively limited, due to physical constraints of access and the number of arboreal and canopy studies therefore remains very small. Even so, some researchers have deployed camera traps in the canopy. Oliveira-Santos et al., (2008) for instance, studied small arboreal mammals in the Atlantic Forest; Olson et al., (2012) studied the greater bamboo lemur in Madagascar and kinkajous in Costa Rica were surveyed by Schipper (2007).
There are several inherent difficulties with arboreal camera traps including: placing, checking and retrieving the cameras, the cameras being triggered by the movement of branches and leaves, and ensuring that the species of interest will frequent the camera trap location enough times to ensure a large enough sample size.
3.5.2 Behaviour studies Behaviour studies are not usually the prime focus of camera trap studies, but as the cameras are functional 24/7, interesting behaviour patterns can be captured and trends noticed
Examples of behaviour studies include topics such as:
− Activity patterns (circadian rhythms), for instance; Di Bitetti et al., (2006), Meek et al., (2012), Cheyne and Macdonald (2011) and Tan et al., (2012).
− Nest predation, for instance; Leimgruber et al., (1994) and Stake & Cimprich (2003).
− Foraging, for instance Otani (2008). − Niche partitioning and social systems, for instance; Almeida
Jácomo, et al., (2004) and Macdonald et al., (2004), Azlan and Sharma (2006), Brook, et al., (2012) and Chiang et al., (2012).
− Habitat use, for instance; Holden et al., (2003), Bowkett et al., (2007) and Tobler et al., (2008).
− Refugia and reproduction, for instance; Sharma (2003).

54 Expedition Field Techniques
− Environmental impacts, for instance; Griffiths and van Schaik (1993), Burton et al., (2012), Carter et al., (2012), Gerber et al., (2012) and Gubbi et al., (2012).
− Postural behaviour, for instance; Dalloz et al., (2012). − Wildlife-human conflicts, for instance; Kukielka et al., (2013) and
Athreya et al., (2013). − Use of (micro-) habitat, for instance; Blake et al., (2013) and Srbek-
Araujo and Chiarello (2013). When conducting behavioural studies it is worth using cameras with infrared illumination as this will have less effect on animal behaviour. Additionally, infrared allows videos to be recorded at night and videos have the advantage of capturing and recording the activities of animals for the duration they are in front of the camera. Some camera models record videos that also record sound. Certain behavioural studies are well served by the use of video (with audio recording possibilities) over still images as a video permits a more nuanced record and insight into certain behaviours (Macdonald et al., 2004; Somaweera and Shine 2012). The technical pros and cons of videos are discussed in Section 2.2.6.
3.6 Bait and Lures By Louisa Richmond-Coggan
As well as problems associated with different equipment influencing remote camera studies, the question of whether to use lures or not is of particular importance in designing such studies. The advantage of using baits and lures to increase detection rates is widely documented (Kucera and Barrett 1993; Rice et al.,1995; Moruzzi et al., 2002), as they reduce survey effort and improve accuracy of density estimates (Long et al., 2007). A range of commercial lures and baits have been used in carnivore camera trapping. For example, a mixture of fat and animal meal was used by Hegglin et al., (2004) to establish a method of vaccinating foxes against rabies. Skunk oil and bobcat urine meal was used by Long et al., (2003) to determine the efficacy of photographic scent stations to detect mountain lions. However the influences of the baits and lures need to be taken into consideration when designing the project as they will introduce biases. In fact, the majority of published camera trapping studies did not incorporate the use of baits specifically to avoid introducing further complications and biases (Srbek-Araujo and Chiarello 2005; Tobler et al., 2008; Pettorelli et al., 2010).
Sampling animal populations using camera traps 55
Nevertheless, baits can help to keep the animal in front of the camera for a longer period of time (Yasuda, 2004), which helps to improve identification of individual’s markings. Studies that do not use baits require much longer survey periods which increase project costs. For example, Pettorelli et al., (2010) used 430 non-baited stations over 11,355 camera trap nights to measure carnivore diversity and distribution in Tanzania. This resulted in a capture success of 23 out of the 35 known carnivore species. Tobler et al., (2008) also carried an unbaited camera trapping project over two years totalling 3,780 trap nights concluding that the study needed a substantial survey effort to register certain species. In some cases several species were only found in one photograph taken over 4,815 camera days (Tobler et al., 2008).
One possible problem with using bait is that if the bait is edible, then the bait is likely to be taken by the first few animals that encounter it, thereby reducing the possible detection of the target species during future trap nights. In some instances this effect may be controlled by the scent being left in the soil or on a tree where it was originally located. Therefore, even after the main bait has gone other animals will still come to investigate the camera site (Mortelliti and Boitani, 2008). To reduce the impact of bait removal on detection probabilities, regular rebaiting should be employed. Consequently there is a trade-off between replenishing the bait and the length of time which is required to gather data from non-baited surveys in terms of logistics and project length.
Another consideration when designing camera trap studies is the target animal’s behaviour. Copeland and Director (1993) assessed wolverine (Gulo gulo) abundance using road-killed deer and fish lure as a bait, but the bait instead lead to the capture of two non-target species rather than the wolverine. When conducting a multiple species study, caution is needed as bait preference will vary between species, making relative comparisons of density problematic (Yasuda, 2004). Therefore tailoring the bait and lure to the specific species is key. This can be taken one step further; using bait could increase the potential biases of capturing different parts of a population i.e. male, female, which are variably drawn to different baits (Koerth and Kroll, 2000; Long et al.,2003). Discovering which bait is effective can be difficult if little is known about the target species. This leads to a key decision in the project design; whether to use artificial baits such as cat nip or natural bait such as game meat. This comes down to cost, availability and the target species of the survey. As was highlighted by Kapfer et al.,'s (2011) study, Barred owls (Strix varia) which mainly feed on carrion only came to
56 Expedition Field Techniques
camera stations that were baited with carcasses of road-killed mammals rather than tainted chicken or no bait at all, which were unsuccessful at capturing a single image (Kapfer et al., 2011). In this case the preference was natural bait. Therefore pilot studies investigating bait preferences are needed as part of design phase of a camera trapping study if the project intends to use bait.
In some circumstances pilot studies have been carried out to pre-test baits and lures on captive animals from which the information can be transferred to a field situation (Long et al., 2003; Thorn et al., 2009). Both Long et al., (2003) and Thorn et al., (2009) used a pre-tested scent lure at camera trap stations to estimate wild population densities. The results were mixed with Long et al., (2003) capturing zero images of mountain lions (Puma concolor) but many non-target species. The study by Thorn et al., (2009) found that for captive carnivores, fish, offal, fermented eggs and blood were effective lures. The main problem with testing lures on captive animals for use in the field is that captive animals are likely to suffer from sensory deprivation unlike free roaming individuals therefore they may not be similarly interested in the same scent (Long et al., 2003). However, in the case of Thorn et al.,'s (2009) camera trapping study the use of the pre-tested fish lure in the field produced a doubling in brown hyaena (Parahyaena brunnea) detection. Seasonal variation in the availability of natural food resources may also influence the results; in leaner times animals are more likely to seek out alternative food sources, possibly travelling further than normal, which in turn will influence the relative abundance index (Koerth and Kroll, 2000; Yasuda, 2004). As a result studies must either account for the bias or survey across several seasons to be able to model for these differences (Hegglin et al., 2004).
Other considerations are the cost of the baits which needs to be built into the budget by working out how much is needed over the course of the survey period plus a bit extra for safety. Essential information to know is whether the bait is freely available in the country you are operating in or whether it will have to be brought in with you at the start of the project. This could cause extra logistical difficulties as the bait will have to be imported in, which may need permits. It is important to check with the correct authorities well in advance of your start date. If the bait runs out half way through your project than this will cause problems with your analysis as the data will have been collected under different experimental conditions and therefore cannot be compared. Some areas do not allow the use of certain baits and so it is important to check with the landowner, local community or local authorities for each study area.
Sampling animal populations using camera traps 57
Weather patterns must also be noted as they will have an influence on the bait, dispersion and/or concentration of the smell. Some studies stated that after heavy rain baits must be refreshed even if it is outside of the normal bait rotation (Thorn et al., 2009). However the sun also has a drying affect that can lead to the lure evaporating or the drying out of meat products. This means that the smell is not as strong compared to other times during your survey. Different baits will degrade at different rates which mean that once the bait has been decided upon it should be used throughout the survey to maintain consistency in the data collection. Using bait can cause further logistical difficulties for the project as the bait may need to be stored in certain conditions leading to extra equipment being required. The bait also has to be carried around the survey area to re-bait the camera stations. If the project involves volunteers or research assistants they should be trained in bait storage and placement so every camera station is baited in exactly the same way and then noted on the data entry sheet. If the target species has not been surveyed using bait before, or different types of baits are trialled, detailed notes on bait duration and removal should be collected and written up in publications for the benefit of future projects.
The use of baits should be considered carefully during the planning stage of any remote camera trap study. Where there are time constraints or species detection is likely to be low then baits may help improve capture rates and in turn lower project duration and costs. It is critical to understand the influence that the bait will have on the target species. Studies which have used captive animals to test the efficacy of baits have limited applicability in the wild. It is therefore recommended that any bait or lure choices should be piloted within the survey area to ensure that the addition of the bait is not having a negative influence on the capture rate or survey duration.
3.7 Vegetation/habitat recording Habitat is a very important additional variable to record when conducting camera surveys. In many cases it is of interest how different vegetation types or disturbances, such as logging or hunting, impact on a species’ ecology or population and this can only be done by recording actual differences in (micro-) habitat or human disturbances.
In many cases the sampling area is not homogenous but consists of patches of different vegetation types. Since each species has its own habitat preferences and requirements, the habitat needs to be classified for each camera location and subsequently be incorporated in the model as a site-specific covariate.

58 Expedition Field Techniques
There are several ways to record vegetation and habitat, the most suitable method depends on the aim of the survey and tools at hand. Vegetation can be sampled by collecting data on vegetation structure such as; tree height or density; vegetation composition. This can be done by surveying plots around each trap location or by using remote sensing data. Sometimes vegetation maps might already be available.
It is important to note that it is only possible to make inferences about the vegetation types that are actually covered by the cameras. A lack of data from these vegetation types/habitats means that they should be excluded from the analysis.
In the field 59
Section Four IN THE FIELD Placing, setting and retrieving your cameras in an optimal way is as important as developing a proper survey design. It is not simply a matter of finding a good looking location, placing a camera, turning it on and returning in 4 weeks’ time to see what images have been recorded. A number of actions need to be carried out to ensure the cameras are working and are set up as effectively as possible.
Below is a step-by-step guide to the actions that need to be performed. This includes aspects to be aware of when placing and setting, checking and retrieving a camera. The steps are more or less in successive order, although some can be interchanged. They are:
1. Pilot study 2. Before leaving base 3. Accessing the field site 4. Placing cameras 5. Clearing vegetation 6. Testing the camera setup 7. Final check
4.1 Recce and pilot study In the early stages of the research it is advisable to familiarise oneself with the habitat location. This is ideally done during a recce visit to the site and followed by a pilot study. To understand the area better obtain information about vegetation, climate and topography (rivers, roads, altitudes) of the area. The latter is particularly important because some of the physical features might hamper access to certain locations. The use of commercial maps, Google Earth or other GIS applications can greatly enhance knowledge of the study area and assist in choosing suitable camera locations and sites to place the cameras. With the use of GIS a rectangular grid can be laid over the study area, from which the approximate camera locations can be picked. These points can then be entered into a handheld GPS device which should be taken when placing the cameras.
Before beginning the actual survey, it is a very good idea to conduct some form of pilot study at the study site. This allows several important factors to be tested, including camera performance, optimal camera settings and

60 Expedition Field Techniques
positioning, and the effort needed to set-up and check the cameras. A recce also allows to you determine if there are any logistics-related issues.
Equally important, it can provide an estimate of the detection rates of the target species, which indicates how large the survey effort needs to be to obtain robust results. These preliminary detection probabilities can then be entered into the software program GENPRES (Hines, 2008) which simulate presence/absence data and with which the total required survey effort can be calculated.
When camera trapping is part of an expedition, pilot studies are often a luxury that cannot be afforded. To get at least some idea of how multiple variables impact the survey it might be worth checking out if any other camera trap surveys have been carried out in the vicinity of your site. Alternatively, running a fake camera set up in the back garden allows the equipment to be tested prior to departure and for the researcher to become familiar with the cameras themselves.
4.2 Before leaving base There are various pieces of equipment that you need and may want to take when setting up and checking the cameras. A list is provided below, although not all items listed are equally essential, and you may wish to add others. Before leaving it is wise to ensure that all the cameras are in working order. Set the time, date and any additional settings and make sure the batteries are fully charged and placed correctly. Check whether the memory cards are empty, in their slots and not locked.
Label all the cameras with an individual code (e.g. 01, 02, 03, …) on the outside and inside so they can be related to a location. Do the same with the memory cards so it is known which memory card was fitted in which camera. One option is to label the cards with the same code as the cameras they are fitted in so that if they get mixed up they can still be categorised.
Equipment list • Camera traps* – as many as you intend to set that day/session.
Possibly add a spare. • Camera trap manual* • Compass* – To help position cameras away from direct sunlight • Data entry sheets* • Batteries* –Take a few spares just in case and spare ones for your
GPS device.

In the field 61
• GPS device* – To find your way to the initial camera location and mark the actual position.
• Memory cards* – Take a few spares just in case • Memory card readers – such as digital camera, tablet or laptop • Notebook* (waterproof?) • Pencil/waterproof pen* • Whiteboard (small) & whiteboard markers* – for the setup shot • Bait and/or lure if required • Battery (voltage) meter – to test how much life a battery still has left
when checking the cameras • Camera (handheld) – log site locations, bait removal, test memory
cards and camera position • Desiccant – silica gel or similar • First Aid Kit • Gloves – to prevent scent transference • Head torch • Locks and safety boxes – theft/damage • Machete – if you need to create access routes. Can help cut
vegetation in front of camera • Map of area with camera locations • Protocol checklists – Includes Setup, Check and retrieval protocols
* Deemed essential NB: Additional equipment such as screwdrivers, straps and spanners, nuts and bolts might be needed to attach cameras, depending on the environment and method to secure the cameras
4.3 Accessing the field site Some field sites are easily accessible, making the placing of cameras a day or half a day’s work. In other cases, particularly in dense forests or environments with a lot of understory growth, it might not be as straightforward. Some remote sites may lack roads or trails without which it is impossible to reach the camera trap locations. In these cases a trail may need to be cut to create access. Cutting such trails does however alter the habitat and potentially certain species’ behaviour; some may start using the trails while others may actively avoid them. Additionally, trails might provide hunters with access to previously unreachable areas. Before going out the most efficient route should be discussed with local guides or field assistants, who often have a superior knowledge of the terrain.
When cutting a trail make sure to cut as little vegetation as possible by creating a trail that is as small as possible. Trail cutting is laborious and it
62 Expedition Field Techniques
may take up to a few days of preparation time to create a workable trail system that allows easy checking of cameras. For time efficiency, when a trail has needed to be cut, it might be best to bring and activate the cameras the same day rather than returning to the site at a later date. However, letting the trail ‘settle’ for a 2-3 day period and discarding the data recorded during this period will avoid potential bias. Therefore, after cutting trails it is advisable to begin actual data collection after a resettlement period to allow the wildlife to return and/or get used to the disturbance (Dillon and Kelly 2007; Maffei et al., 2004).
No matter how the field site will be accessed, care should be taken to create as minimal disturbance as possible.
4.4 Placing cameras Choosing a location Once the general location of interest is reached using GPS, a more suitable and specific place needs to be found for the camera positioning. When using a regular rectangular grid to place cameras it is acceptable to place a camera up to 100 m away from the initial GPS point when cameras are spaced ≥ 1 km. An accepted protocol for the maximum distance from the GPS fix does not exist yet, but this guide suggests not moving the camera more than 10 % the distance from this fix.
The cameras then need to be positioned in order to optimise the detection probability of the target species. For surveys that focus on a single species this is fairly straightforward as knowledge about the species’ biology will help clarify its preferred habitat use. When carrying out species richness surveys however, choosing camera locations becomes more complicated. These surveys need to take into account that some species might favour/avoid trails, high ground, muddy areas, steep slopes or ridge lines. Placing the cameras completely at random is a good idea, but there is a good chance of failing to cover certain microhabitats so these may need to be included.
Finding a suitable camera location can be a challenging situation, especially in forests where there seem to be endless possibilities to place a camera. A good knowledge of the biology of the target species is very important as this provides the first guidance for finding a suitable location. Signs of recent animal activity, such as trails, foot prints, latrines or rub marks are also good indicators of the use of that location by certain species. In addition, local people, especially hunters, may have an intricate understanding of the study
In the field 63
area. Their knowledge about species habits, movement patterns and activity signs is often unsurpassed and their advice can be invaluable.
When a good location is found its exact position should be recorded with a GPS device. In forests it may also be helpful to mark the tree the camera is attached to with clearly visible (red or pink are good colours) marking tape. GPS fixes are not always accurate and especially in rainforests they may be off by more than 10 meters, and you may even consider marking the path to the camera.
Camera positioning and attachment After the coordinates are recorded, the camera can be placed. Most often trees, or in their absence posts, can be used as an alternative convenient option for an attachment. Make sure the tree, post or camera itself does not move in the wind or have a high chance of falling over. As not only might a fall damage the camera but a moving camera will trigger due to the movement.
The height at which to place a camera is an important consideration. The optimal height depends on the size of the target species and the camera model because the detection zone and camera field-of-view varies between models in their direction, height and width. It is best to place the cameras in such a way that an animal’s flank faces the lens as this body part generally constitutes the largest surface. This position maximises the potential of the camera being triggered and makes it easier to identify (individuals of) a certain species, as well as other characteristics such as sex or pregnancy. As a rule of thumb, Swann et al., (2004) suggest placing cameras with PIR sensors at < 2x the shoulder height for animals < 1m tall and at shoulder height for animals > 1m tall (Figure 4.1). For terrestrial bird species a sensor height of 10-20 cm might be appropriate (Thornton et al., 2012).
Smaller species tend to be overlooked when the camera is placed higher, while the larger species will still be detected (Ancrenaz et al., 2012). When conducting surveys on multiple species it is therefore recommended to place the camera rather too low than too high (Meek et al., 2012; Kelly 2008).

64 Expedition Field Techniques
Figure 4.1a - 1x flank height for large animals
Figure 4.1b - < 2x flank height for small animals
Angle and distance to animal The best way to place a camera is to position it perpendicular (90°) to a trail or an animal’s travel direction to obtain a good quality picture of the flank. However, because of the delay between detection of animal movement and the actual picture being taken (trigger speed), it may be better to position the camera at an angle (around 60°) that allows the animal to remain in the camera field of focus for longer. A pilot study can assist greatly in finding the optimal camera position.
The optimal distance between camera and animal is also influenced by the trigger speed, as well as detection zone, flash strength, motion sensor sensitivity, target range, and the size of the target species. For instance, because of the cone shape of the cameras’ detection zone the effective
In the field 65
detection zone, the area in which an animal is detected, becomes smaller with reduced camera distance to the trail (Figure 4.1). A moving animal will thus remain in the detection zone for relatively short period, increasing the chance of blank shots. A fast trigger speed and/or wide detection zone increase the chance of capturing moving animals even at close range. Cameras with a slow trigger speed and narrow detection zone should thus be placed at a greater distance from the location where animals are most likely to be recorded. However, a balance needs to be found between distance between camera and animal and the ability to identify the species.
Rovero et al., (2010) noted that cameras with fast trigger speed (0.5 seconds or less) are ideally set at about 2 m distance from the trail when the goal is to detect a wide range of species, while cameras with slower trigger speeds need to be placed as far as 5-10 m from the trail. Ancrenaz et al., (2012) generally recommend placing cameras with a slow trigger speed at about 3 m from a trail, while cameras with a faster trigger speed can be placed at a distance of about 2 m. This advice should serve as a general guideline, as camera models vary considerably and thus need to be assessed individually. Kays and Slauson (2008) relate the optimal distance to the size of the species. They suggest for mid-sized animals to use a distance of 2-5 m, nearer for smaller species or for those surveys where more detail (such as for individual identification) is needed.
4.5 Vegetation clearing After the camera is optimally positioned it might be necessary to remove any vegetation between where an animal might appear and the camera. Vegetation can be a major obstruction as it can block the view of an animal or cause false triggers through movement caused by wind. Try to make sure that the environment is altered as little as possible if you do need to remove vegetation.
Clearing vegetation is preferably done by pulling grasses, and tree saplings in their entirety, out by hand. When vegetation is cut it can produce a lingering smell that may deter or attract certain species. Also make sure to remove any branches in the background that can move in the wind.
4.6 Testing the camera setup When a camera is set-up it needs to be tested to ensure that it is in the correct position to detect and record the target species. Most cameras have a test mode to check the camera’s performance. Select this mode and do a walk-test: i.e. walk in front of the camera at the location, mimicking the target
66 Expedition Field Techniques
species (for instance on hands and feet). When the camera is in test mode and when movement is detected an indicator light will turn on. Adjust the camera position as necessary.
It is also worth taking a test shot to see whether the camera is lined up correctly and to make some final adjustments. The image can be viewed with an image viewer that is built in some camera models or, when absent, a compatible compact camera can be used in which the memory card can be loaded. If either is unavailable, a laptop or tablet can be used instead.
4.7 Final check up Once the appropriate set-up has been decided the camera settings should be double checked. Make sure date, time, video, trigger delay, etc. are correctly set, that the camera contains an empty memory card and that the batteries are full and placed correctly. Furthermore, ensure that the desiccant (that prevents moisture building up in the camera) does not interfere with the operating mechanism and that it does not obstruct closure of the lid. Make sure the seal is free of dirt so that the camera closes properly and is waterproof. Last of all: do not forget to turn the camera to the ON-position.
As Fegraus et al., (2011) points out, it is worth taking a setup shot when placing the camera. Use a whiteboard or large piece of paper to write down the start date and time, location ID, camera trap ID and the person setting up the camera. In case the images get moved around or settings are accidentally entered wrongly this allows recalibration and a mechanism to check if the field personnel configured the settings correctly.
4.8 Additional remarks When placing a camera the amount of scent that is left behind should be minimised. Animals have a very sensitive sense of smell and may have learned to avoid the scent of humans. For instance, the level of human activity, scent and presence of equipment could deter an individual from approaching a camera station (Dixon et al., 2009). For example, Hegglin et al., (2004) identified that the presence of camera traps at a bait station reduced the rate of bait removal by foxes compared to stations without cameras.
Try to avoid walking on trails or touching or trampling vegetation as much as possible, and ensure food is not packed in the same bag as the cameras. Smell lingers, leading to increased or reduced visitation rates which can bias results.

In the field 67
Try to avoid pointing cameras facing directly into the sun. The glare and heat may cause false triggers, influence the quality of the image, and may cause a camera to overheat and malfunction. In the northern hemisphere this means placing cameras facing north (from NE to N to NW), while in the southern hemisphere the opposite is true (SE, S, SW). Direct sunlight will also influence the operation of the cameras. Placing them towards sunset and sunrise might also cause false triggers. Either place them in a sheltered location or turn the camera so that the sun doesn’t reach it.
A further consideration is the terrain. It is not advisable to place a camera facing downhill (Figure 4.2) as the sensor will pick up movement from vegetation further away, catch more sunlight and cover a smaller area right in front of the camera. If a downhill positioning is unavoidable, try to make sure the camera is parallel with the sloping ground, so that the terrain appears horizontal. This increases the effective detection area and thus the detection probability.
Figure 4.2 – Placing a camera on a slope. If placed like the image on the left, many animals will be missed and there will be a lot of movement in the background, causing false triggers. The image on the right displays a more effective way of placing a camera on a slope.
4.9 Checking and retrieving cameras Cameras need to be checked regularly, either to change batteries, to change the memory card (or download pictures) or to ensure the cameras are present and working properly. Precisely how often the cameras need to be checked is dependent on the local environmental conditions, camera model, battery type and capture rate. When starting the survey there is no way of telling how

68 Expedition Field Techniques
these variables influence the frequency with which the cameras need to be checked. Technological advances such as increased battery life and memory card capacity mean some cameras can be operational in the field for several months without needing to be checked.
A first check should ideally be no later than five days after the cameras have been set up. The second check can then be performed about 2-3 weeks after the first and from this the frequency of further checks can be determined.
When checking the cameras enough replacement batteries should be taken to refill all the cameras that are to be checked for the day as some batteries might be empty while others might still be full enough to last until the next check.
It is important to note that some cameras reset time/date and other settings when batteries are removed and sometimes even when they are turned off. Therefore take extra care to check the new date/time and other settings after replacing the batteries. Memory cards can be swapped for new empty ones or the images can be downloaded to a device (such as a tablet or laptop) in the field after which the card can be erased and replaced in the camera. This avoids potential confusion when the same card remains in the same camera. This also allows a direct view of the images from which camera function can be checked. Any issues with the camera setup can thus be fixed instantly. For example, the camera sensitivity might have been set too high, a moving leaf or branch could have caused constant triggering, or the camera might have moved or malfunctioned since setup. Malfunctioning devices are a common occurrence; it is therefore very useful to carry one or two spare memory cards and cameras with you.
Do not underestimate how long it will take to get to and check the cameras so make sure to incorporate this time into your schedule. In difficult-to-access environments it may take several days to check an array of about 20 cameras, especially if they are spaced as far as 1km apart and the only way of reaching the site is by foot.
Record the time and date when changing/resetting a memory card, downloading the pictures, and also when replacing a camera/memory card. Appendix 4 is an example of a datasheet with variables that need to be recorded when checking each camera.
When retrieving the cameras it is advisable to take a final picture with the date, time, person retrieving and camera location ID on it, through use of a
In the field 69
whiteboard for instance. This will allow retrieval of the most important data in case the images get mixed up in the data management process.
4.10 Recording data During the placement, checking and retrieving the cameras, a number of variables, which are essential for various analyses, need to be recorded. These include geographical coordinates, time and date of setup, camera ID and vegetation type. Recording these variables is most effectively done using a standardised datasheet. An example datasheet with the essential variables to record when setting a camera can be found in Appendix 3.
Most camera trapping surveys are designed to obtain a better understanding of the target species and its relation to the environment. For this purpose, environmental variables need to be recorded for each camera trap event (temperature, time of day, humidity, moon phase, etc.) and camera location (habitat, distance to road, distance to river, hunting intensity, etc.). This information can later be linked to the camera trap data, enabling inferences about how these influence animal behaviour, abundance, occupancy or species richness.
4.11 Logistics Due to the sensitive nature of the cameras, it is worth considering any logistical issues that might arise. Key points to consider are; transport overseas, importing expensive equipment, storage and special permits (specific to individual countries).
4.11.1 Transport and storage A remote camera, just like any other camera, is a fragile and costly piece of equipment. Storage containers can be used to make sure that the cameras arrive undamaged at the study location. Most cameras do have a fairly robust housing that protects them through rough journeys, but they are far from indestructible. A sturdy plastic box, preferably waterproof and filled with biodegradable filling material, is a suitable mode of transportation. Old newspapers (which also take up moisture from the air) are a cheap biodegradable filling material. As a minimum, the lens, sensors and flash should be protected from scratches by being wrapped with a piece of cloth, tape or similar. Desiccants, such as silica gel, are additional items to be placed in the cameras during transport, storage and operation to prevent corrosion.

70 Expedition Field Techniques
Batteries are best removed from the camera when they are not in use as they will run down and can corrode and damage the camera, even when not in operation. As with cameras, batteries should be stored in a dry and safe environment and the ends should not touch each other. When travelling by plane, ensure that batteries are allowed on the plane. Some operators might see a large number as a security hazard and refuse to carry them.
4.11.2 Import and export When transporting cameras to a different country, customs may require a declaration of the equipment (including batteries), which can result in major import taxes. Freight is often inspected and the chances of having to pay import tax on the goods you ship by freight are high, as are the taxes themselves.
Furthermore, it can be more hassle than it is worth to collect your equipment from customs. It is therefore most cost-effective to carry the cameras in your (team’s) personal luggage when travelling (wrap them in clothing to prevent damage if a box is impractical). If shipping is the only option, many countries allow equipment that is used for scientific purposes to be exempt from taxes. A letter from a local research counterpart is usually required to be eligible for exemption. The procedures vary by country and for some you may also need to pay export tax for your goods.
Inquiring well in advance about import and export procedures and arranging the necessary permits and exemptions can save a lot of money, frustration and time.
4.12 Potential problems Remote cameras have a rather short longevity which should be taken into account when designing the survey. The cause for a camera’s malfunction can be manifold, but it is not always obvious to establish the origin. The environment might have an influence, but theft, vandalism and damage by wildlife or transport do occur. Manufacturing faults can happen as well.
For these reasons cameras will stop functioning at one point. Therefore a proportion of cameras should be kept as spares just in case this happens. Failure to plan for potential problems might cause gaps in the survey data, potentially biasing results.
4.12.1 Malfunctioning cameras There are many causes for camera malfunctioning. Some are environment dependent, while others occur regardless. Examples include a failing trigger

In the field 71
system, faulty time and date stamps, draining batteries and faulty PIR sensors.
Probably the most common issue in wet or humid environments is fogging up of the camera lens, resulting in images of poor quality. For example, Kays et al., (2009) reported that only 30% of all their cameras in the field never failed for the duration of one year. Forty percent of the failures were due to a fogged up lens, while humidity affecting the electronic circuits in the camera was found to be the second most important cause. They further found that detection distance was shortened during the rainy season, which they attributed to moisture on the sensor, in the air between sensor and target animal and on the animal itself (Kays et al., 2009). All these factors reduce the difference in background IR signature and that of the animal, thereby reducing its detection probability (Kays et al., 2009). To prevent moisture build up in the camera, it should first be ensured that the casing is completely waterproof. On most cameras, a rubber sealing ring is present on the edge of the camera lid. The ring should remain free from dirt and other foreign bodies as this can obstruct proper closure and let water in. As an extra prevention measure the ring can be greased with non-setting silicon grease. Desiccants such as rechargeable silica gel are commonly used to prevent moisture from building up as well.
In hot and arid climates overheating is a major issue. A camera that is placed in direct sunlight might see temperatures rise above the operating capacity of the batteries or internal electronics, causing it to shut down. A simple but effective measure is to place a protective hood above the camera providing shade.
Manufacturing faults and transportation are two more general sources of camera failure. Manufacturing faults occur rather frequently and transportation could damage internal components. It is therefore wise to test the cameras after purchasing (or transportation) to prevent placing a defective camera. Most cameras come with a warranty period, and because many manufacturers acknowledge that they are prone to construction faults, obtaining a replacement item is often possible.
4.12.2 Theft, vandalism and the public Theft, and vandalism to a lesser extent, can be serious problems in certain areas, and cameras have been reported stolen, moved or even damaged by people. There are a few ways of minimising these risks.
72 Expedition Field Techniques
When working in areas inhabited by people (such as small communities) it is worthwhile informing them about the survey beforehand. This way they feel included in the project and will develop a more positive attitude, hopefully leaving the cameras in place. On some occasions it might not be at all possible to reach the entire community. A solution that has proven to be successful for various field studies is to leave laminated notes, in the local language, on the main access routes into the study area as well as on/near the cameras, describing the fact that a wildlife monitoring survey is in progress. Do include contact details and the relevant institution so that people can get in touch with any questions or observations. This method also makes for a cost-effective outreach and education opportunity.
Even so, there is always a risk of theft when using expensive technology. One way to prevent thieves from an easy catch is to attach the camera securely using locks and chains. Many cameras have the option to fit metal security boxes which can accommodate locks and chains thereby rendering a quick grab more difficult. Even so, thieves are inventive and even a £30 steel cable is not 100% theft proof.
If theft or vandalism is a very serious risk it might be worth reducing the cameras’ visibility, for instance by camouflaging with bark and twigs and the like. An example of a more sophisticated camouflaging method imitating bark is described in http://www.easy3dcamo.com/downloads/Easy3D.pdf. Infrared over visible flash (or even IR covert cameras) cameras further reduces the chances of detection.
4.12.3 Wildlife damage People are not the only animals that are intrigued by cameras traps. Elephants, bears, rhinos, lions and tigers are all known to damage cameras (Karanth and Nichols, 1998; Azlan and Sharma, 2006; Jordan et al., 2011). They can be attracted by the camera because of the flash or its smell or just the look of it. Highly inquisitive animals such as vervet monkeys and baboons also have a tendency to play and even remove cameras from their tree. Wearing gloves when placing the camera and minimising scent on the device and surrounding area will help prevent the likelihood of wildlife damaging the cameras, as might the use of IR instead of visible flash and using camouflage. The metal security boxes described above will also reduce damage by wildlife.
A more unlikely candidate for damage, although regularly reported, is infestation by termites, ants and other insects. Termites especially are capable

In the field 73
of eating through cables and plastic and are known to build nests in cameras. To prevent invertebrate damage first ensure cameras are properly sealed and do not have any soft, chewable, parts (such as plug covers) which might be bitten through and can provide access to the inside of the camera. A band of sticky tape attached to the tree trunk below and above the camera can help prevent this issue.
74 Expedition Field Techniques
Section Five DATA MANAGEMENT Often hundreds or even thousands of images are collected from camera trapping surveys. Storing, managing and analysing such a large amount of data requires careful planning. Data management needs to be done methodically, as it is easy to lose, delete or mix up images, datasheets, memory cards and even cameras. In this section the most important aspects to consider in the data management and analysis process are described. Data management has so far received relatively little attention in the camera trapping world and as such there is no standardised way of managing camera trap data. In general, these are the necessary steps to follow:
1. Create an image management plan 2. Collect images 3. Store images 4. Process images 5. Code images 6. Automated management and data preparation
5.1 Create an image management plan Before you go into the field to collect data, an appropriate image management system must be created. To build an effective system, you must devise an appropriate folder hierarchy to store images, decide upon an image coding structure, and find (or create) and familiarise yourself with an image management and analysis software package. Doing this before the fieldwork starts avoids confusing at a later stage and is altogether more efficient.
5.2 Collect images Each time a camera is checked the images should be collected from the memory card and, if the memory card is filling up, it should be formatted to allow sufficient space to accommodate new images. The easiest and most efficient way to transfer the data from the memory card is to carry a laptop, tablet or other storage device in the field to which the images can be temporarily stored before being copied to a permanent database. The memory card can then be erased and placed back in the camera. Alternatively, the memory cards can be replaced by new empty cards.
Data management 75
5.3 Store images When storing images it is paramount to retain the link with their respective survey area, camera location and survey period. If any of these variables are unknown the images will be useless. There is no prescribed protocol on the best way to store images and the preferred way will vary with survey objectives. Here it is assumed that the use of digital images is the norm as virtually all remote cameras available are digital, and that these images will eventually be stored and analysed on a computer.
After the images have been collected the first step is to organise and store them according to a logical hierarchy. A common folder hierarchy is as follows: Survey area > Survey period > Site location > Camera location. An additional layer can be created to also sort by species.
It is highly recommended to make a backup, possibly even more than one, of the raw data once these are stored in a convenient folder structure. After the images are processed and the analysis process has started, the images should be backed up separately and continuously as well.
5.4 Process images After the images are stored in their appropriate folders the species (or other events) in each image needs to be recorded. When first going through the images it is recommended not to delete any seemingly useless images just yet, even when there is no animal in the picture; i.e. when the image is blank/empty or there are people in it. By keeping the empty images it is possible to find out if the camera sensor has been set too sensitive (many false triggers and thus many empty pictures) or not sensitive enough (very few false triggers and thus few empty pictures). Also, you can see if the trigger speed is too slow or too fast. An indication of slow trigger speed is many pictures only showing tails. Depending on the research objectives it can be useful to also note the number of species in each image or image sequence. Pictures taken during the setup, checks and retrieval can be deleted although it is advised to keep at least one setup and one retrieval shot to be absolutely certain of start and end dates.
When tagging photos Fegraus et al., (2011) suggest using one of the following tags to enable further analysis:
• Start: The image indicating the start times of the camera trap period for that camera
• End: The image indicating the end times of the camera trap period for that camera
76 Expedition Field Techniques
• Blank: images without animals • Unidentifiable: images with an animal but that which are not 100%
possible to identify • Animals: images with animals of known taxonomy
There is a variety of free software available that allows quick viewing, tagging and editing of images, see Chapter 6 for a list.
5.5 Code images On return from the field images should be stored directly on the main computer and it is wise to re-label them to avoid overwriting of images with the same generic name. Images on the memory cards will have uninspiring and confusing names such as PICT001 or CDY001, and these will be duplicated across memory cards. Images should ideally be labeled individually so that they are easily identifiable. Include for instance Survey ID, Trap site ID, Camera trap location ID, and possibly also date, time and species in the new image name so that each image is unique.
For example: CT-S1-La2-20121118-0943-Sus_barbatus CT = Code for the survey type S1 = Code for the trap site (if there is more than one site) La2 = Code for the camera location. Here transect a, camera 2 20121118-0943 = Date and Time. This image was taken November 18th, at 09:43 am Sus_barbatus = the species name. To shorten the image name use abbreviations (e.g. Sbarb) Doing this manually for hundreds of images is time intensive. Fortunately there are various software programs available to automate and speed up this process. Harris et al., (2010), for instance, published a detailed example data management system using open-source software.
For a quick overview of the data, and as an extra backup, the metadata (the Exif data, which is embedded in the image itself) such as time, date, temperature, moon phase and tags of each image can be stored in an excel datasheet. This can be done automatically using a variety of freely available software (see Chapter 6).
Data management 77
5.6 Automated image management and data preparation Preparing the data for analysis can be a very long-winded process due to having to manually enter data for hundreds, often thousands of images. Fortunately there are a number of freely available software programs that can help speed up this task significantly (see Chapter 6).
One of the most useful data entry, storage and preparation tools available to camera trappers is the software program Camera Base, which has been and is being developed by Mathias Tobler. This is a freely available, open source program that is built in Microsoft Access. After importing the images from the original folder hierarchy created as per Section 5.3, the software enables the user to automate and considerably speed up the subsequent steps. Images can be viewed and tagged with the species, number of individuals and sex (if known). The program automatically extracts the essential Exif data from the photo (i.e. the date and time) and assigns the image to the correct camera station depending on the folder it was originally located in. Camera Base has the option to add new species, and even allows comparison of opposing cameras from the same station. After images have been imported and tagged, the data can be exported for population or species richness analysis into MARK, PRESENCE and EstimateS. It also contains a number of queries and analysis options itself (such as activity pattern analysis), making this tool extremely versatile and efficient.
78 Expedition Field Techniques
Section Six DATA ANALYSIS Studies using camera traps that aim to estimate species richness, density from marked individuals or site occupancy from unmarked individuals generally rely on the principle of capture-recapture, derived from detection/encounter histories.
The accurate analysis of imagery relies first and foremost on the quality of the data. Reliable identification of individual animals is therefore a must. When an animal cannot be identified to species level from an image with 100% certainty, this image should not be included in the analysis. If it is not possible to differentiate between two or more similar species, as is the case with mouse deer (Tragulus spp.) in Borneo, these should be identified to genus level only and population estimates will reflect those for both species together.
Furthermore, it is important to make a distinction between the number of images taken and the number of independent events. We need to make sure that repeated captures of an animal that are in fact part of the same event are not taken to be two or more different capture events. This can happen when an animal lingers in front of the camera, thereby causing multiple pictures to be taken. If the camera is set to take multiple pictures when it is triggered this also constitutes only a single event.
O’Brien et al., (2003) defined an independent capture event as (1) consecutive images of different individuals of the same or different species, (2) consecutive images of individuals of the same species taken more than 30 minutes apart, (3) nonconsecutive images of individuals of the same species. Assumption 2 is rather arbitrary. The 0.5 hour time interval is an estimate, and some researchers reported 40 or even 60 minutes as the minimum time limit to consider an event independent. This depends on the species and their behaviour and where the camera is placed. If it is near a den, nest site or baited, this time interval should be increased.
Analysing this large amount of data involves statistical calculations which, with computers and some clever software packages, can even be done by non-statisticians. Even so, a basic understanding of the methods used in this software is a must, as White (2004) aptly paraphrases. Below are the standard software packages that are used for analysis of various data types.

Data analysis 79
6.3 Population analysis software CAPTURE – Marked individuals (CR) CAPTURE computes tests to select a model from 11 possible models, and then the population estimate for capture-recapture data on closed populations. The models computed with CAPTURE can now be done with Program MARK and CAPTURE is actually distributed as part of MARK.
MARK – Marked individuals (CR) The standard software package for the analysis of marked individuals from conventional capture-recapture (for open and closed populations) studies is fittingly named MARK (White, 2009). It was developed by Gary White from the Colorado State University and is freely available at
http://warnercnr.colostate.edu/~gwhite/mark/mark.htm.
Extensive support material is available. MARK also includes options to analyse occupancy data. The program CAPTURE is also incorporated in this program.
SPACECAP – Marked individuals (SECR using Bayesian methods) SPACECAP (Gopalaswamy et al., 2012) has been developed very recently. It is a user-friendly software package for estimating animal densities using closed model capture-recapture sampling based on photographic captures using Bayesian spatially-explicit capture-recapture models. This approach offers advantages such as: substantially dealing with the problems posed by individual heterogeneity in capture probabilities in conventional capture-recapture analyses (See Box 4 and Section 3.3). It also offers non-asymptotic inferences which are more appropriate for small samples of capture data typical of photo-capture studies
http://cran.r-project.org/web/packages/SPACECAP/.
WinBUGS – Marked individuals (SECR using Bayesian methods) WinBUGS (Gilks et al., 1994) is used to analyse spatially explicit capture-recapture data from marked individuals. The program cannot be called user-friendly as models have to be specified by the users themselves, and for this a proper understanding of WinBUGS coding is essential. The software can be downloaded from
http://www.mrc-bsu.cam.ac.uk/bugs/winbugs/contents.shtml. Detailed information is available at http://www.lce.esalq.usp.br/arquivos/aulas/2010/LCE5813/Introduction%20to%20WinBUGS%20for%20Ecologists.pdf.
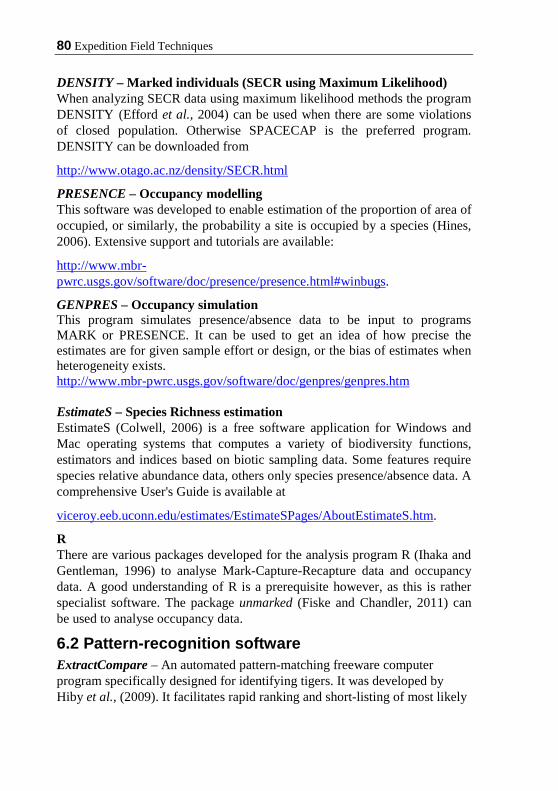
80 Expedition Field Techniques
DENSITY – Marked individuals (SECR using Maximum Likelihood) When analyzing SECR data using maximum likelihood methods the program DENSITY (Efford et al., 2004) can be used when there are some violations of closed population. Otherwise SPACECAP is the preferred program. DENSITY can be downloaded from
http://www.otago.ac.nz/density/SECR.html
PRESENCE – Occupancy modelling This software was developed to enable estimation of the proportion of area of occupied, or similarly, the probability a site is occupied by a species (Hines, 2006). Extensive support and tutorials are available:
http://www.mbr-pwrc.usgs.gov/software/doc/presence/presence.html#winbugs.
GENPRES – Occupancy simulation This program simulates presence/absence data to be input to programs MARK or PRESENCE. It can be used to get an idea of how precise the estimates are for given sample effort or design, or the bias of estimates when heterogeneity exists. http://www.mbr-pwrc.usgs.gov/software/doc/genpres/genpres.htm EstimateS – Species Richness estimation EstimateS (Colwell, 2006) is a free software application for Windows and Mac operating systems that computes a variety of biodiversity functions, estimators and indices based on biotic sampling data. Some features require species relative abundance data, others only species presence/absence data. A comprehensive User's Guide is available at
viceroy.eeb.uconn.edu/estimates/EstimateSPages/AboutEstimateS.htm.
R There are various packages developed for the analysis program R (Ihaka and Gentleman, 1996) to analyse Mark-Capture-Recapture data and occupancy data. A good understanding of R is a prerequisite however, as this is rather specialist software. The package unmarked (Fiske and Chandler, 2011) can be used to analyse occupancy data.
6.2 Pattern-recognition software ExtractCompare – An automated pattern-matching freeware computer program specifically designed for identifying tigers. It was developed by Hiby et al., (2009). It facilitates rapid ranking and short-listing of most likely

Data analysis 81
matches from a database of tiger photos. http://www.conservationresearch.co.uk/tigers/tigers1.htmhttp://www.conservationresearch.co.uk/tigers/tigers1.htm
WildID – Wild-ID (Bolger et al., 2012) is a multi-platform application for pattern extraction and matching for use in photographic mark-recapture studies. This piece of software greatly speeds up identification of individuals from their coat pattern. Even so, it seems good practice to also consider manual comparison, as it has been reported (although when identifying a toad) that the method may not always be accurate (Caorsi et al., 2012).
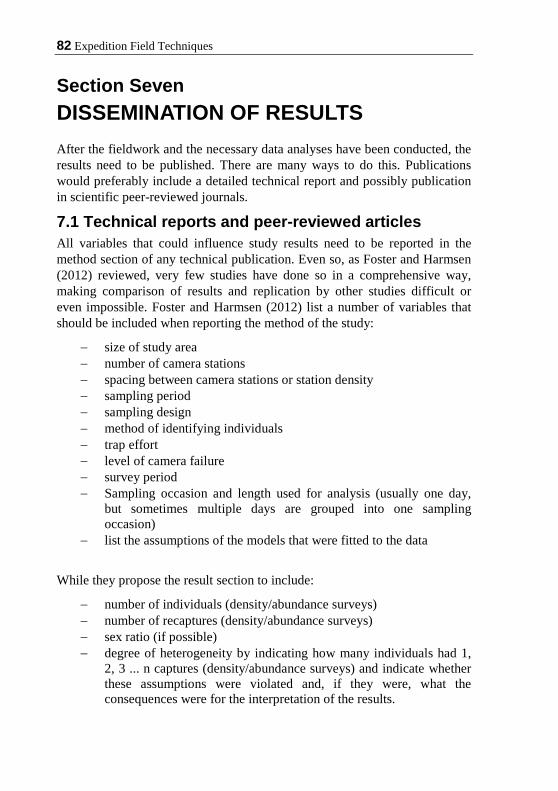
82 Expedition Field Techniques
Section Seven DISSEMINATION OF RESULTS After the fieldwork and the necessary data analyses have been conducted, the results need to be published. There are many ways to do this. Publications would preferably include a detailed technical report and possibly publication in scientific peer-reviewed journals.
7.1 Technical reports and peer-reviewed articles All variables that could influence study results need to be reported in the method section of any technical publication. Even so, as Foster and Harmsen (2012) reviewed, very few studies have done so in a comprehensive way, making comparison of results and replication by other studies difficult or even impossible. Foster and Harmsen (2012) list a number of variables that should be included when reporting the method of the study:
− size of study area − number of camera stations − spacing between camera stations or station density − sampling period − sampling design − method of identifying individuals − trap effort − level of camera failure − survey period − Sampling occasion and length used for analysis (usually one day,
but sometimes multiple days are grouped into one sampling occasion)
− list the assumptions of the models that were fitted to the data
While they propose the result section to include:
− number of individuals (density/abundance surveys) − number of recaptures (density/abundance surveys) − sex ratio (if possible) − degree of heterogeneity by indicating how many individuals had 1,
2, 3 ... n captures (density/abundance surveys) and indicate whether these assumptions were violated and, if they were, what the consequences were for the interpretation of the results.
Dissemination of results/reporting 83
To be most useful, each study should adequately present the following details, as observed by Kays and Slauson (2008):
− survey design; − survey duration; − types of remote cameras used; − camera station locations (i.e., global positioning systems (GPS)
coordinates and written descriptions); − dates of survey for each remote camera; − programmed time delay and activation time; − species detection results; − number of lost survey days for each remote camera due to
equipment malfunction.
7.2 Outreach Camera trap images make for great outreach and promotional material and often capture the attention of popular media, which would be a fantastic opportunity to make your work known to a wider audience and help the conservation issue you are addressing. Think of using available social media outlets such as Twitter, Facebook and LinkedIn as well as your local and regional newspapers and news channels, schools, personal network. Also consider national media sources which can bring your cause to the attention of a wider public and create the awareness that is needed to increase the impact of conservation. Who knows, it might just attract the funding needed to continue or expand your research!
You could also engage with the local community by showing them your results and in turn discuss the wider conservation issues. This can be done for instance through a one day workshop or event where the community is invited to participate. People could be very interested and may never have seen some of the species, even though they share the same environment. Above all, they will appreciate the effort to include them, as this is often neglected. Local people may have limited knowledge about the conservation status, threats or ecology of some elusive species and in turn are keen to learn more about them. Consequently, this may help instil a heightened respect and more positive attitude towards the wildlife in the area.
84 Expedition Field Techniques
Section Eight GLOSSARY OF TERMS Abundance The number of individuals/species at a
location at any one time
Camera array The total number of cameras active per survey at any one site or trapping area.
Camera location The location of a camera station Camera station All the cameras at a camera location Capture history see Detection history Closed population A population in which the composition
remains the same during the study period: there are no births or deaths, and immigration or emigration does not occur.
Covariate (site-specific) In occupancy a site-specific covariate is a characteristic which is specific for a camera trap location and that does not change during the sampling season.
Covariate (survey-specific) In occupancy a survey-specific covariate is a characteristic which may vary per camera trap day and location within a season. Examples include rain, temperature,
Density The number of individuals of a species per unit area at any one time
Detectability See Detection probability Detection The detection or ‘capture’ of an animal on
a camera trap
Detection history A sequence of 1’s and/or 0’s denoting detection (1) and non-detection (0) for a species or individual at a given camera location
Detection probability The probability of detecting at least one individual of a given species in a particular sampling effort, given that individuals of that species are present in the area of interest during the sampling period
Detection range The maximum distance a camera is able
Glossary of terms 85
to detect a moving animal Detection rate The number of detections per unit time.
Usually this is expressed as detections/1000 camera trap days
Detection zone The area in front of the camera in which an animal is detected by the camera. This area can be different from the camera’s field of view
Effective trapping area The area that is covered by all the camera traps in a study. This area is usually larger than the area that is enclosed within the outer camera traps as the home range of some individuals may fall outside this area.
False trigger A capture event that is not caused by an animal passing in front of the camera. Instead, such triggers can occur due to precipitation, sun flecks or moving vegetation
Field of view The area that is visible on an image Heterogeneity Variation of detectability within or
between species
Mean Maximum Distance Moved (MMDM)
The mean of the maximum distance between two trap locations of animals that are recorded at more than one location
Open population A population whose demographics (births, deaths, migration) can change between survey seasons
Sampling occasion Also sampling event. This is usually taken as a 24-h day during which animals are recorded.
Sampling period The time (number of days) over which a camera trapping site is sampled. The detection probability and occupancy or abundance of species is assumed not to vary within a sampling period
Sampling season A time period during which the population does not change, that is, during which the population remains closed. In addition, detection probability and occupancy or abundance of species is

86 Expedition Field Techniques
assumed not to vary within a sampling season. A sampling season can be made up of multiple sampling periods.
Species diversity As species richness, but also takes into account the abundance of each species
Species richness The actual number of different species present in a given area
Survey duration The total number of days it takes to complete the survey over multiple sampling periods or seasons.
Trap day A 24h period during which a camera is operating. The total number of camera trap days is calculated by the number of cameras x average number of days each was active.
Trap event An independent incident during which an animal is captured on camera. This event can constitute of multiple detections
Trapping area The area where the survey is to take place Trapping effort The total trap effort of a study, expressed
in number of camera trapping days
Trapping site A subset of the trapping area. If the trapping area cannot entirely be covered by the available cameras, it can be divided in a number of trapping sites through which the camera array can be rotated to cover the entire site.
Trigger speed The delay between the moment a camera detects movement and the moment it records the image.
References 87
Section Nine REFERENCES Almeida Jácomo, A. T., Silveira, L., & Diniz-Filho, J. A. F. (2004) Niche
separation between the maned wolf (Chrysocyon brachyurus), the crab-eating fox (Dusicyon thous) and the hoary fox (Dusicyon vetulus) in central Brazil. Journal of Zoology, 262(1): 99-106.
Alonso, A. (2013) Distribution of a community of mammals in relation to roads and other human disturbances in Gabon (central Africa). In New Frontiers in Tropical Biology: The Next 50 Years (A Joint Meeting of ATBC and OTS).
Amstrup, S. C. (2005) Handbook of capture-recapture analysis. Princeton University Press.
Ancrenaz, M. Hearn A.J. Ross, J. Sollmann, R. and Wilting, A. (2012) Handbook for wildlife monitoring using camera-traps.
Ariefiandy, A., Purwandana, D., Seno, A., Ciofi, C., & Jessop, T. S. (2013) Can camera traps monitor komodo dragons a large ectothermic predator?. PloS one, 8(3): e58800.
Athreya, V., Odden, M., Linnell, J. D., Krishnaswamy, J., & Karanth, U. (2013) Big cats in our backyards: persistence of large carnivores in a human dominated landscape in India. PloS one, 8(3): e57872.
Azlan, J. M., & Sharma, D. S. (2006) The diversity and activity patterns of wild felids in a secondary forest in Peninsular Malaysia. Oryx, 40(01): 36-41.
Bailey, L. L., Simons, T. R., & Pollock, K. H. (2004) Estimating site occupancy and species detection probability parameters for terrestrial salamanders. Ecological Applications, 14(3): 692-702.
Baldwin, R. A., & Bender, L. C. (2012) Estimating population size and density of a low-density population of black bears in Rocky Mountain National Park, Colorado. European Journal of Wildlife Research, 58(3): 557-566.
Balme, G. A., Hunter, L. T., & Slotow, R. (2009) Evaluating methods for counting cryptic carnivores. The Journal of wildlife management, 73(3): 433-441.
Balme, G. A., Slotow, R., & Hunter, L. T. B. (2010) Edge effects and the impact of non-protected areas in carnivore conservation: leopards in the Phinda–Mkhuze Complex, South Africa. Animal Conservation, 13(3): 315-323.
Bartolommei, P., Bonesi, L., Guj, I., Monaco, A., & Mortelliti, A. (2013) First report on the distribution of the American mink Neovison vison
88 Expedition Field Techniques
(Mammalia: Mustelidae) in central Italy. Italian Journal of Zoology, 80(3): 455-461.
Battery University,. (2013) Battery University. http://batteryuniversity.com/. Di Bitetti, M. S., Paviolo, A., & De Angelo, C. (2006) Density, habitat use
and activity patterns of ocelots (Leopardus pardalis) in the Atlantic Forest of Misiones, Argentina. Journal of Zoology, 270(1): 153-163.
Blake, J. G., Mosquera, D., & Salvador, J. (2013) Use of mineral licks by mammals and birds in hunted and non-hunted areas of Yasuní National Park, Ecuador. Animal Conservation, 16(4): 430-437.
Bolger, D. T., Morrison, T. A., Vance, B., Lee, D., & Farid, H. (2012) A computer assisted system for photographic mark–recapture analysis. Methods in Ecology and Evolution, 3(5): 813-822.
Borchers, D. (2012) A non-technical overview of spatially explicit capture–recapture models. Journal of Ornithology, 152(2): 435-444.
Borchers, D. L., & Efford, M. G. (2008) Spatially explicit maximum likelihood methods for capture–recapture studies. Biometrics, 64(2): 377-385.
Boug, A., Islam, M. Z. U., Shehry, A. A., & Wronski, T. (2012) Camera trapping confirms the persistence of Arabian Gazelles, Gazella arabica, in the Asir Mountains, Saudi Arabia: (Mammalia: Bovidae). Zoology in the Middle East, 57(1): 3-10.
Boulinier, T., Nichols, J. D., Sauer, J. R., Hines, J. E., & Pollock, K. H. (1998) Estimating species richness: the importance of heterogeneity in species detectability. Ecology, 79(3): 1018-1028.
Bowkett, A. E., Rovero, F., & Marshall, A. R. (2008) The use of camera trap data to model habitat use by antelope species in the Udzungwa Mountain forests, Tanzania. African Journal of Ecology, 46(4): 479-487.
Brink, H., Topp-Jorgensen, J. E., Marshall, A. R., & Fanning, E. (2002) First record in 68 years of Lowe’s servaline genet. Oryx, 36: 323–327.
Brook, L. A., Johnson, C. N., & Ritchie, E. G. (2012) Effects of predator control on behaviour of an apex predator and indirect consequences for mesopredator suppression. Journal of applied ecology, 49(6): 1278-1286.
Brown, J., & Gehrt, S. D. (2009) The basics of using remote cameras to monitor wildlife. Ohio State University Extension Agriculture and Natural Resources Fact Sheet W-21-09. Ohio Sate University, Columbus, OH.
Burnham, K. P., & Overton, W. S. (1978) Estimation of the size of a closed population when capture probabilities vary among animals. Biometrika, 65(3): 625-633.
Burnham, K. P., & Overton, W. S. (1979) Robust estimation of population size when capture probabilities vary among animals. Ecology, 60(5): 927-936.
References 89
Burton, A. C. (2012) Critical evaluation of a long-term, locally-based wildlife monitoring program in West Africa. Biodiversity and Conservation, 21(12): 3079-3094.
Burton, A. C., Sam, M. K., Balangtaa, C., & Brashares, J. S. (2012) Hierarchical multi-species modeling of carnivore responses to hunting, habitat and prey in a West African protected area. PloS one, 7(5): e38007.
Caorsi, V. Z., Santos, R. R., & Grant, T. (2012) Clip or Snap? An Evaluation of Toe-Clipping and Photo-Identification Methods for Identifying Individual Southern Red-Bellied Toads, Melanophryniscus cambaraensis. South American Journal of Herpetology, 7(2): 79-84.
Carter, N. H., Shrestha, B. K., Karki, J. B., Pradhan, N. M. B., & Liu, J. (2012) Coexistence between wildlife and humans at fine spatial scales. Proceedings of the National Academy of Sciences, 109(38): 15360-15365.
Cheyne, S. M., & Macdonald, D. W. (2011) Wild felid diversity and activity patterns in Sabangau peat-swamp forest, Indonesian Borneo. Oryx, 45(01): 119-124.
Chiang, P. J., Pei, K. J. C., Vaughan, M. R., & Li, C. F. (2012) Niche relationships of carnivores in a subtropical primary forest in southern Taiwan. Zoological Studies, 51(4): 500-511.
Choate, D. M., Wolfe, M. L., & Stoner, D. C. (2006) Evaluation of cougar population estimators in Utah. Wildlife Society Bulletin, 34(3): 782-799.
Colwell, R. K. (2006) EstimateS: Statistical estimation of species richness and shared species from samples. Version 8.
Colwell, R. K., & Coddington, J. A. (1994) Estimating terrestrial biodiversity through extrapolation. Philosophical Transactions of the Royal Society of London. Series B: Biological Sciences, 345(1311): 101-118.
Copeland, J., & Director, J. M. C. (1993) Assessment of Snow-tracking and Remote Camera Systems to Document Presence of Wolverines at Carrion Bait Stations. Idaho Department of Fish and Game.
Cutler, T. L., & Swann, D. E. (1999) Using remote photography in wildlife ecology: a review. Wildlife Society Bulletin, 571-581.
Dalloz, M. F., Loretto, D., Papi, B., Cobra, P., & Vieira, M. V. (2012) Positional behaviour and tail use by the bare-tailed woolly opossum Caluromys philander (Didelphimorphia, Didelphidae). Mammalian Biology-Zeitschrift für Säugetierkunde, 77(5): 307-313.
Dillon, A., & Kelly, M. J. (2007) Ocelot Leopardus pardalis in Belize: the impact of trap spacing and distance moved on density estimates. Oryx, 41(04): 469-477.
Diment, A. (2010) Monitoring the Ecological Impact of Invasive Predator Control. University of Sydney. PhD Thesis. Chapter 4
Dixon, V., Glover, H. K., Winnell, J., Treloar, S. M., Whisson, D. A., & Weston, M. A. (2009) Evaluation of three remote camera systems for
90 Expedition Field Techniques
detecting mammals and birds. Ecological management & restoration, 10(2): 156-158.
Donovan, T. M., and Hines, J. (2007) Exercises in occupancy modeling and estimation. http://www.uvm.edu/rsenr/vtcfwru/spreadsheets/occupancy/occupancy.htm
Dorazio, R. M., & Royle, J. A. (2005) Estimating size and composition of biological communities by modeling the occurrence of species. Journal of the American Statistical Association, 100(470): 389-398.
Efford, M. G., Borchers, D. L., & Byrom, A. E. (2009) Density estimation by spatially explicit capture–recapture: likelihood-based methods. In Modeling demographic processes in marked populations (pp. 255-269). Springer US.
Efford, M. G., Warburton, B., Coleman, M. C., & Barker, R. J. (2005) A field test of two methods for density estimation. Wildlife Society Bulletin, 33(2): 731-738.
Efford, M. G., Dawson, D. K., & Robbins, C. S. (2004) DENSITY: software for analysing capture-recapture data from passive detector arrays. Animal Biodiversity and Conservation, 27(1): 217-228.
Eisenberg, J. F., and Thorington Jr, R. W. (1973) A preliminary analysis of a neotropical mammal fauna. Biotropica, 5: 150–161.
El Alqamy, H. (2006) Mammals of Dubai Desert Conservation Reserve: Initial Assessment and Baseline Data. using camera traps.
Fegraus, E. H., Lin, K., Ahumada, J. A., Baru, C., Chandra, S., & Youn, C. (2011) Data acquisition and management software for camera trap data: A case study from the TEAM Network. Ecological Informatics, 6(6): 345-353.
Fiske, I., & Chandler, R. (2011) unmarked: An R package for fitting hierarchical models of wildlife occurrence and abundance. Journal of Statistical Software, 43(10): 1-23.
Foster, R. J., & Harmsen, B. J. (2012) A critique of density estimation from camera trap data. The Journal of Wildlife Management, 76(2): 224-236.
Fusco-Costa, R., & Ingberman, B. (2013) Records of the bush dog Speothos venaticus in a continuous remnant of coastal Atlantic Forest in southern Brazil. Oryx, 47(01): 105-108.
Gardner, B., Reppucci, J., Lucherini, M., & Royle, J. A. (2010) Spatially explicit inference for open populations: estimating demographic parameters from camera-trap studies. Ecology, 91(11): 3376-3383.
Gerber, B. D., Karpanty, S. M., & Kelly, M. J. (2012) Evaluating the potential biases in carnivore capture–recapture studies associated with the use of lure and varying density estimation techniques using photographic-sampling data of the Malagasy civet. Population ecology, 54(1): 43-54.
References 91
Gerber, B. D., Karpanty, S. M., & Randrianantenaina, J. (2012) The impact of forest logging and fragmentation on carnivore species composition, density and occupancy in Madagascar's rainforests. Oryx, 46(03): 414-422.
Gilks, W. R., Thomas, A., & Spiegelhalter, D. J. (1994) A language and program for complex Bayesian modelling. The Statistician, 169-177.
Gopalaswamy, A. M., Royle, J. A., Hines, J. E., Singh, P., Jathanna, D., Kumar, N., & Karanth, K. U. (2012) Program SPACECAP: software for estimating animal density using spatially explicit capture–recapture models. Methods in Ecology and Evolution, 3(6): 1067-1072.
Gotelli, N. J., & Colwell, R. K. (2001) Quantifying biodiversity: procedures and pitfalls in the measurement and comparison of species richness. Ecology letters, 4(4): 379-391.
Gotelli, N. J., & Colwell, R. K. (2011) Estimating species richness. Biological diversity: frontiers in measurement and assessment, 39-54.
Griffiths, M., & van Schaik, C. P. (1993) The impact of human traffic on the abundance and activity periods of Sumatran rain forest wildlife. Conservation Biology, 7(3): 623-626.
Gubbi, S., Poornesha, H. C., & Madhusudan, M. D. (2012) Impact of vehicular traffic on the use of highway edges by large mammals in a South Indian wildlife reserve. Current Science, 102(7): 1047-1051.
Guyer, C., Meadows, C. T., Towmsend, S. C., and Wilson, L. G. (1997) A camera device for recording vertebrate activity. Herpetological Review, 28(3): 138–140.
Harestad, A. S., & Bunnell, F. L. (1979) Home range and body weight—a reevaluation. Ecology, 60(2): 389-402.
Harmsen, B. J., Foster, R. J., & Doncaster, C. P. (2011) Heterogeneous capture rates in low density populations and consequences for capture-recapture analysis of camera-trap data. Population ecology, 53(1): 253-259.
Harris, G., Thompson, R., Childs, J. L., & Sanderson, J. G. (2010) Automatic storage and analysis of camera trap data. Bulletin of the Ecological Society of America, 91(3): 352-360.
Hegglin, D., Bontadina, F., Gloor, S., Romer, J., MüLLER, U., Breitenmoser, U., & Deplazes, P. (2004) Baiting red foxes in an urban area: a camera trap study. Journal of Wildlife Management, 68(4): 1010-1017.
Hiby, L., Lovell, P., Patil, N., Kumar, N. S., Gopalaswamy, A. M., & Karanth, K. U. (2009) A tiger cannot change its stripes: using a three-dimensional model to match images of living tigers and tiger skins. Biology Letters, 5(3): 383-386.
Hines, J. E. (2008) GENPRES - Software to generate patch occupancy data and analyze using programs MARK or PRESENCE.
92 Expedition Field Techniques
Hines, J. E. (2006) PRESENCE2-Software to estimate patch occupancy and related parameters. US Geological Survey, Patuxent Wildlife Research Center, Maryland. Available from http://www. mbr-pwrc. usgs. gov/software/bin/setup\_presence. exe (accessed December 2007).
Holden, J., Yanuar, A., & Martyr, D. J. (2003) The Asian tapir in Kerinci Seblat National Park, Sumatra: evidence collected through photo-trapping. Oryx, 37(01): 34-40.
Ihaka, R., & Gentleman, R. (1996) R: a language for data analysis and graphics. Journal of computational and graphical statistics, 5(3): 299-314.
Jackson, R. M., Roe, L. D., Wangchuk, R., and Hunter, D. O. (2005) Surveying snow leopard populations with emphasis on camera trapping: a handbook. Sonoma, California, The Snow Leopard Conservancy.
Jackson, R. M., Roe, J. D., Wangchuk, R., & Hunter, D. O. (2006) Estimating Snow Leopard Population Abundance Using Photography and Capture-Recapture Techniques. Wildlife Society Bulletin, 34(3): 772-781.
Nussbaum, R., Judd, N., Evans, T., Iacobelli, T., Jarvie, J., Lindhe, A., Synnott, T., Vallejos, C., Yaroshenko, A., & Chunquan, Z. (2003) The high conservation value forest toolkit. Oxford: Proforest.
Jordan, M. J., Barrett, R. H., & Purcell, K. L. (2011) Camera trapping estimates of density and survival of fishers Martes pennanti. Wildlife Biology, 17(3): 266-276.
Kapfer, J. M., Gammon, D. E., & Groves, J. D. (2011) Carrion-feeding by Barred Owls (Strix varia). The Wilson Journal of Ornithology, 123(3): 646-649.
Karanth, K. U. (1995) Estimating tiger Panthera tigris populations from camera-trap data using capture—recapture models. Biological conservation, 71(3): 333–338.
Karanth, K. U., and Nichols, J .D. (1998) Estimation of tiger densities in India using photographic captures and recaptures. Ecology, 79(8): 2852–2862.
Karanth, K. U., Nichols, J. D. & Kumar, N. S.. 2010. Estimating tiger abundance from camera trap data: field surveys and analytical issues. Camera Traps in Animal Ecology: Methods and Analyses: 97.
Karanth, K. U., Nichols, J. D., Kumar, N. S., & Hines, J. E. (2006) Assessing tiger population dynamics using photographic capture-recapture sampling. Ecology, 87(11): 2925-2937.
Kays, R. W., Kranstauber, B., Jansen, P., Carbone, C., Rowcliffe, M., Fountain, T., and Tilak, S. (2009) Camera traps as sensor networks for monitoring animal communities. Local Computer Networks, 2009. LCN 2009. IEEE 34th Conference: 811–818.
References 93
Kays, R. W., and K. M. Slauson, K. M. (2008) Remote cameras. In: Long, R. A., MacKay, P., Ray, J., & Zielinski, W. (Eds.). (2008). Noninvasive survey methods for carnivores. Island Press pp.110-140.
Kelly, M. J., and Holub, E. L. (2008) Camera trapping of carnivores: trap success among camera types and across species, and habitat selection by species, on Salt Pond Mountain, Giles County, Virginia. Northeastern Naturalist, 15(2): 249–262.
Kelly, M. J., Noss, A. J., Di Bitetti, M. S., Maffei, L., Arispe, R. L., Paviolo, A., De Angelo, C. D., & Di Blanco, Y. E. (2008) Estimating puma densities from camera trapping across three study sites: Bolivia, Argentina, and Belize. Journal of Mammalogy, 89(2): 408-418.
Kelly, M. J. (2008 Design, evaluate, refine: camera trap studies for elusive species. Animal Conservation, 11(3): 182–184.
Kendall, W. L., Pollock, K. H., & Brownie, C. (1995) A likelihood-based approach to capture-recapture estimation of demographic parameters under the robust design. Biometrics, 51(1): 293-308.
Kéry, M. (2011) Species richness and community dynamics: A conceptual framework. In: O'Connell, A. F., Nichols, J. D., & Karanth, K. U. (2011) Camera traps in animal ecology. Tokyo: Springer pp.207-232.
Koerth, B. H., & Kroll, J. C. (2000) Bait type and timing for deer counts using cameras triggered by infrared monitors. Wildlife Society Bulletin, 630-635.
Kucera, T. E., & Barrett, R. H. (1993) In my experience: the Trailmaster® camera system for detecting wildlife. Wildlife Society Bulletin, 505-508.
Kukielka, E., Barasona, J. A., Cowie, C. E., Drewe, J. A., Gortazar, C., Cotarelo, I., & Vicente, J. (2013) Spatial and temporal interactions between livestock and wildlife in South Central Spain assessed by camera traps. Preventive veterinary medicine, 112(3): 213-221.
Larrucea, E. S., Brussard, P. F., Jaeger, M. M., & Barrett, R. H. (2007) Cameras, coyotes, and the assumption of equal detectability. The Journal of wildlife management, 71(5): 1682-1689.
Lavariega, M. C., Briones-Salas, M., & Rodríguez, C. (2013) Registro de tapir centroamericano (Tapirus bairdii) con cámaras-trampa en la sierra Madre de Oaxaca, México. Revista Mexicana de Biodiversidad, 84(3): 1007-1011.
Leimgruber, P., McShea, W. J., & Rappole, J. H. (1994) Predation on artificial nests in large forest blocks. The Journal of wildlife management, 254-260.
Linkie, M., Dinata, Y., Nugroho, A., & Haidir, I. A. (2007) Estimating occupancy of a data deficient mammalian species living in tropical rainforests: sun bears in the Kerinci Seblat region, Sumatra. Biological Conservation, 137(1): 20-27.
94 Expedition Field Techniques
Long, E. S., Fecske, D. M., Sweitzer, R. A., Jenks, J. A., Pierce, B. M., & Bleich, V. C. (2003) Efficacy of photographic scent stations to detect mountain lions. Western North American Naturalist, 63(4): 529-532.
Long, R. A., Donovan, T. M., Mackay, P., Zielinski, W. J., & Buzas, J. S. (2007) Comparing scat detection dogs, cameras, and hair snares for surveying carnivores. The Journal of Wildlife Management, 71(6): 2018-2025.
Macdonald, D. W., Buesching, C. D., Stopka, P., Henderson, J., Ellwood, S. A., & Baker, S. E. (2004) Encounters between two sympatric carnivores: red foxes (Vulpes vulpes) and European badgers (Meles meles). Journal of Zoology, 263(4): 385-392.
Mace, R. D., Minta, S. C., Manley, T. L., & Aune, K. E. (1994) Estimating grizzly bear population size using camera sightings. Wildlife Society Bulletin, 74-83.
MacKenzie, D. I. (Ed.). (2006) Occupancy estimation and modeling: inferring patterns and dynamics of species occurrence. Academic Press.
MacKenzie, D. I., Nichols, J. D., Lachman, G. B., Droege, S., Andrew Royle, J., & Langtimm, C. A. (2002) Estimating site occupancy rates when detection probabilities are less than one. Ecology, 83(8): 2248-2255.
MacKenzie, D. I., Nichols, J. D., Sutton, N., Kawanishi, K., & Bailey, L. L. (2005) Improving inferences in population studies of rare species that are detected imperfectly. Ecology, 86(5): 1101-1113.
MacKenzie, D. I., and Royle, J. A. (2005) Designing occupancy studies: general advice and allocating survey effort. Journal of Applied Ecology, 42(6): 1105–1114.
MacKinnon, K. (1996) The ecology of Kalimantan. Vol. 3. Oxford University Press.
Maffei, L., Cuéllar, E., & Noss, A. (2004) One thousand jaguars (Panthera onca) in Bolivia's Chaco? Camera trapping in the Kaa-Iya National Park. Journal of Zoology, 262(3): 295-304.
Maffei, L., and Noss, A. J. (2008) How small is too small? Camera trap survey areas and density estimates for ocelots in the Bolivian Chaco. Biotropica, 40: 71–75.
Marcus Rowcliffe, J., Carbone, C., Kays, R., Kranstauber, B., & Jansen, P. A. (2012) Bias in estimating animal travel distance: the effect of sampling frequency. Methods in Ecology and Evolution, 3(4): 653-662.
McCallum, J. (2013) Changing use of camera traps in mammalian field research: habitats, taxa and study types. Mammal Review, 43(3): 196-206.
McCarthy, J. L., Fuller, T. K., McCarthy, K. P., Wibisono, H. T., & Livolsi, M. C. (2012) Using camera trap photos and direct sightings to identify possible refugia for the Vulnerable Sumatran striped rabbit Nesolagus netscheri. Oryx, 46(03): 438-441.
References 95
McClintock, B. T., White, G. C., Antolin, M. F., & Tripp, D. W. (2009) Estimating abundance using mark–resight when sampling is with replacement or the number of marked individuals is unknown. Biometrics, 65(1): 237-246.
McGrath, T., Hunter, D., Osborne, W., & Sarre, S. D. (2012) A Trial Use of Camera Traps Detects the Highly Cryptic and Endangered Grassland Earless Dragon Tympanocryptis pinguicolla (Reptilia: Agamidae) on the Monaro Tablelands of New South Wales, Australia. Herpetological Review, 43(2): 249.
Meek, P., Ballard, G., and Fleming, P. (2012) An introduction to camera trapping for wildlife surveys in Australia. Vertebrate Pest Unit, NSW Department of Primary Industries
Meek, P. D., Zewe, F., & Falzon, G. (2012) Temporal activity patterns of the swamp rat (Rattus lutreolus) and other rodents in north-eastern New South Wales, Australia. Australian Mammalogy, 34(2): 223-233.
Mortelliti, A., & Boitani, L. (2008) Evaluation of scent-station surveys to monitor the distribution of three European carnivore species (Martes foina, Meles meles, Vulpes vulpes) in a fragmented landscape. Mammalian Biology-Zeitschrift für Säugetierkunde, 73(4): 287-292.
Moruzzi, T. L., Fuller, T. K., DeGraaf, R. M., Brooks, R. T., & Wenjun, L. (2002) Assessing remotely triggered cameras for surveying carnivore distribution. Wildlife Society Bulletin, 30(2): 380-386.
Moruzzi, T. L., Royar, K. J., Grove, C., Brooks, R. T., Bernier, C., Thompson, F. L., DeGraaf, R. M., & Fuller, T. K. (2003) Assessing an American marten, Martes americana, reintroduction in Vermont. The Canadian Field-Naturalist, 117(2): 190-195.
Newbold, H. G., & King, C. M. (2009) Can a predator see 'invisible' light? Infrared vision in ferrets (Mustelo furo). Wildlife research, 36(4): 309-318.
Noss, A. J., Gardner, B., Maffei, L., Cuéllar, E., Montaño, R., Romero-Muñoz, A., Sollman, R., & O'Connell, A. F. (2012) Comparison of density estimation methods for mammal populations with camera traps in the Kaa-Iya del Gran Chaco landscape. Animal Conservation, 15(5): 527-535.
O'Brien, T. G., Kinnaird, M. F., & Wibisono, H. T. (2003) Crouching tigers, hidden prey: Sumatran tiger and prey populations in a tropical forest landscape. Animal Conservation, 6(2): 131-139.
O’Connell, A. F., Nichols, J . D., and U. K. Karanth, U. K. (2010) Camera traps in animal ecology: Methods and analyses. Springer Verlag.
O'Connell Jr, A. F., Talancy, N. W., Bailey, L. L., Sauer, J. R., Cook, R., & Gilbert, A. T. (2006) Estimating site occupancy and detection probability

96 Expedition Field Techniques
parameters for meso-and large mammals in a coastal ecosystem. Journal of Wildlife Management, 70(6): 1625-1633.
Obbard, M. E., Howe, E. J., and Kyle, C. J. (2010) Empirical comparison of density estimators for large carnivores. Journal of Applied Ecology, 47(1): 76–84.
Oliveira-Santos, L. G. R., Tortato, M. A., & Graipel, M. E. (2008) SHORT COMMUNICATION Activity pattern of Atlantic Forest small arboreal mammals as revealed by camera traps. Journal of Tropical Ecology, 24: 563-567.
Olson, E. R., Marsh, R. A., Bovard, B. N., Randrianarimanana, H. L., Ravaloharimanitra, M., Ratsimbazafy, J. H., & King, T. (2012) Arboreal camera trapping for the Critically Endangered greater bamboo lemur Prolemur simus. Oryx, 46(04): 593-597.
Otani, T. (2008) Measuring fig foraging frequency of the Yakushima macaque by using automatic cameras. Ecological Research, 16(1): 49–54.
Otis, D. L., Bumham, K. P., White, G. C., and Anderson, D. R. (1978) Statistical inference from capture data on closed animal populations. Wildlife monographs, 62: 3–135.
Parmenter, R. R., Yates, T. L., Anderson, D. R., Burnham, K. P., Dunnum, J. L., Franklin, A. B., Lubow, B. C., Miller, M., Olson, G. S., Parmenter, C. A., Pollard, J., Rexstad, E., Shenk, T. M., Stanley, T. R.., & White, G. C. (2003) Small-mammal density estimation: a field comparison of grid-based vs. web-based density estimators. Ecological monographs, 73(1): 1-26.
Pelletier, D., Leleu, K., Mallet, D., Mou-Tham, G., Hervé, G., Boureau, M., & Guilpart, N. (2012) Remote high-definition rotating video enables fast spatial survey of marine underwater macrofauna and habitats. PloS one, 7(2): e30536.
Pettorelli, N., Lobora, A. L., Msuha, M. J., Foley, C., & Durant, S. M. (2010) Carnivore biodiversity in Tanzania: revealing the distribution patterns of secretive mammals using camera traps. Animal Conservation, 13(2): 131-139.
Pinto, L. C., & Duarte, M. M. (2013) Occurrence (New record) of maned wolf Chrysocyon brachyurus (Illiger, 1815)(Carnivorae, Canidae) in Southern Brazil. Ciência Florestal (01039954), 23(1).
Pollock, K. H., Nichols, J. D., Brownie, C., and Hines, J. E. (1990) Statistical inference for capture-recapture experiments. Wildlife monographs, 3–97.
Pollock, K. H., and Otto, M. C. (1983) Robust estimation of population size in closed animal populations from capture-recapture experiments. Biometrics, 1035–1049.
Priede, I. G., Bagley, P. M., Smith, A., Creasey, S., & Merrett, N. R. (1994) Scavenging deep demersal fishes of the Porcupine Seabight, North-east

References 97
Atlantic: observations by baited camera, trap and trawl. Journal of the Marine Biological Association of the United Kingdom, 74(03): 481-498.
Rice, C. G., Kucera, T. E., & Barrett, R. H. (1995) Trailmaster® camera system. Wildlife Society Bulletin, 110-113.
Roos, A. L., de Souza, E. A., de Campos, C. B., de Paula, R. C., & Morato, R. G. (2012) Primeiro registro documentado do Jacu-estalo Neomorphus geoffroyi Temminck, 1820 para o bioma Caatinga. Revista Brasileira de Ornitologia, 20(1): 81-85.
Rovero, F., M Tobler, and J. Sanderson. 2010. Camera Trapping for inventorying terrestrial vertebrates. In Manual on Field Recording Techniques and Protocols for All Taxa Biodiversity Inventories. ed: Eymann, J. and Degreef, J. and Häuser, C. and Monje, J.C. and Samyn, Y. and VandenSpiegel, D.
Rowcliffe, J. M., Kays, R., Carbone, C., & Jansen, P. A. (2013) Clarifying assumptions behind the estimation of animal density from camera trap rates. The Journal of Wildlife Management, 77(5): 876-876.
Rowcliffe, J. M., Field, J., Turvey, S. T., & Carbone, C. (2008) Estimating animal density using camera traps without the need for individual recognition. Journal of Applied Ecology, 45(4): 1228-1236.
Marcus Rowcliffe, J., Carbone, C., Jansen, P. A., Kays, R., & Kranstauber, B. (2011) Quantifying the sensitivity of camera traps: an adapted distance sampling approach. Methods in Ecology and Evolution, 2(5): 464-476.
Royle, J. A., and Nichols, J. D. (2003) Estimating abundance from repeated presence-absence data or point counts. Ecology, 84(3): 777–790.
Savidge, Julie A, and Seibert, T. F. (1988) An infrared trigger and camera to identify predators at artifical nests. Journal of Wildlife Management, 52(2): 291–294.
Schipper, J. (2007) Camera-trap avoidance by Kinkajous Potos flavus: rethinking the ‘non invasive’ paradigm. Small Carnivore Conservation, 36: 38–41.
Sharma, D. S. K. (2003) Camera trapping the Indochinese tiger, Panthera tigris corbetti, in a secondary forest in Peninsular Malaysia. The raffles bulletin of Zoology, 51(2): 421–427.
Silveira, L., Jacomo, A. T., & Diniz-Filho, J. A. F. (2003) Camera trap, line transect census and track surveys: a comparative evaluation. Biological Conservation, 114(3): 351-355.
Silver, S. (20040 Assessing jaguar abundance using remotely triggered cameras. Wildlife Conservation Society, New York.
Silver, S. C., Ostro, L. E., Marsh, L. K., Maffei, L., Noss, A. J., Kelly, M. J., Wallace, R. B., Gomez, H., & Ayala, G. (2004) The use of camera traps for estimating jaguar Panthera onca abundance and density using capture/recapture analysis. Oryx, 38(02): 148-154.
98 Expedition Field Techniques
Soberon, J., and Llorente, J., (1993) The use of species richness accumulation functions for the prediction of species richness. Conservation Biology, 7: 480–488.
Sollmann, R., Gardner, B., & Belant, J. L. (2012) How does spatial study design influence density estimates from spatial capture-recapture models?. PloS one, 7(4): e34575.
Somaweera, R., and Shine, R. (2012) Australian Freshwater Crocodiles (Crocodylus johnstoni) Transport Their Hatchlings to the Water. Journal of Herpetology, 46(3): 407–411.
Sosa-Escalante, J., Hernández, S., Segovia, A., & Sanchez-Cordero, V. (1997) First record of the coyote, Canis latrans (Carnivora: Canidae), in the Yucatan Peninsula, Mexico. The Southwestern Naturalist, 494-495.
Srbek-Araujo, A. C., and Chiarello, A. G., (2005) Is camera-trapping an efficient method for surveying mammals in Neotropical forests? A case study in south-eastern Brazil. Journal of Tropical Ecology, 21(1): 121–125.
Srbek-Araujo, A. C., & Chiarello, A. G. (2013) Influence of camera-trap sampling design on mammal species capture rates and community structures in southeastern Brazil. Biota Neotropica, 13(2): 51-62.
Stake, M. M., and Cimprich, D. A (2003) Using video to monitor predation at black-capped vireo nests. The Condor, 105(2): 348–357.
Sutherland, W. J. (2006) Ecological census techniques: a handbook. Cambridge University Press.
Swann, D. E., Hass, C. C., Dalton, D. C., & Wolf, S. A. (2004) Infrared-triggered cameras for detecting wildlife: an evaluation and review. Wildlife Society Bulletin, 32(2): 357-365.
Swann, D. E., Kawanishi, K., and J. Palmer, J. (2010) Evaluating Types and Features of Camera Traps in Ecological Studies: A Guide for Researchers. Camera Traps in Animal Ecology: Methods and Analyses, 27-43
Tan, C. L., Yang, Y., & Niu, K. (2013) Into the night: camera traps reveal nocturnal activity in a presumptive diurnal primate, Rhinopithecus brelichi. Primates, 54(1): 1-6.
Thompson, G. G., and Withers, P. C. (2003) Effect of species richness and relative abundance on the shape of the species accumulation curve. Austral Ecology, 28(4): 355–360.
Thorn, M., Scott, D. M., Green, M., Bateman, P. W., & Cameron, E. Z. (2009) Estimating brown hyaena occupancy using baited camera traps. South African Journal of Wildlife Research, 39(1): 1-10.
Thornton, D. H., Branch, L. C., and Sunquist, M. E. (2012) Response of large galliforms and tinamous (Cracidae, Phasianidae, Tinamidae) to habitat loss and fragmentation in northern Guatemala. Oryx, 46(04): 567–576.

References 99
Tobler, M. W., Carrillo-Percastegui, S. E., Leite Pitman, R., Mares, R., & Powell, G. (2008) An evaluation of camera traps for inventorying large-and medium-sized terrestrial rainforest mammals. Animal Conservation, 11(3): 169-178.
Trailcampro. (2012) www.trailcampro.com. http://www.trailcampro.com/rechargeablebatteriesforgamecameras.aspx.
Trolle, M., and Kéry, M. (2003) Estimation of ocelot density in the Pantanal using capture-recapture analysis of camera-trapping data. Journal of mammalogy, 84(2): 607–614.
Trolle, M. and Kéry, M. (2005) Camera-trap study of ocelot and other secretive mammals in the northern Pantanal. Mammalia, 69(3-4): 409–416.
Trolle, M., Noss, A. J., Cordeiro, J. L. P., & Oliveira, L. F. B. (2008) Brazilian Tapir Density in the Pantanal: A Comparison of Systematic Camera Trapping and Line Transect Surveys. Biotropica, 40(2): 211-217.
Trolle, M., Noss, A. J., Lima, E. S., and Dalponte, J. C. (2007) Camera-trap studies of maned wolf density in the Cerrado and the Pantanal of Brazil. Vertebrate Conservation and Biodiversity, 371–378.
Wang, S. W., and Macdonald, D. W. (2009) The use of camera traps for estimating tiger and leopard populations in the high altitude mountains of Bhutan. Biological Conservation, 142(3): 606–613.
Weckel, M., Rockwell, R. F., and Secret, F. (2011) A modification of Jacobson et al.,’s (1997) individual branch-antlered male method for censusing white-tailed deer. Wildlife Society Bulletin, 35(4): 445–451.
Wegge, P., Pokheral, C. P., and Jnawali, S. R. (2004) Effects of trapping effort and trap shyness on estimates of tiger abundance from camera trap studies. Animal Conservation, 7(3): 251–256.
White, G. (2004) Analysis of Marked Animal Encounter Data. http://warnercnr.colostate.edu/~gwhite/fw663/MarkText.html#Story.
White, G. C. (1982) Capture-recapture and removal methods for sampling closed populations. Los Alamos National Laboratory.
White, G.C. (2009) Mark and Recapture Parameter Estimation. http://warnercnr.colostate.edu/~gwhite/mark/mark.htm.
White, G. C., and Burnham, K. P. (1999) Program MARK: survival estimation from populations of marked animals. Bird study, 46(S1): S120–S139.
Williams, B. K., Nichols, J. D., & Conroy, M. J. (2002) Analysis and management of animal populations: modeling, estimation, and decision making. Academic Press.
Wilting, A., Cord, A., Hearn, A. J., Hesse, D., Mohamed, A., Traeholdt, C., Cheyne, S. M., Sunarto, S., Jayasilan, M-A., Ross, J., Shapiro, A. C., Sebastian, A., Breitenmoser, C., Sanderson, J., Duckworth, J. W., &

100 Expedition Field Techniques
Hofer, H. (2010) Modelling the species distribution of flat-headed cats (Prionailurus planiceps), an endangered South-East Asian small felid. PloS one, 5(3): e9612.
WWF. (2013) Rediscovery of Saola: Asian Unicorn Sighted in Vietnam after 15 years. http://worldwildlife.org/press-releases/rediscovery-of-saola-asian-unicorn-sighted-in-vietnam-after-15-years?utm_source=twitter.com&utm_medium=media&utm_campaign=wwf-marketing&utm_content=wwfnews-20131112.
Yasuda, M. (2004) Monitoring diversity and abundance of mammals with camera traps: a case study on Mount Tsukuba, central Japan. Mammal study, 29(1): 37–46.
Yu, X., Wang, J., Kays, R., Jansen, P. A., Wang, T., & Huang, T. (2013) Automated identification of animal species in camera trap images. EURASIP Journal on Image and Video Processing, 2013(1): 1-10.
ZSL. (2012a) Camera Trap Success - Cheetahs. http://www.zsl.org/conservation/about-conservation/discoveries/camera-trap-success-cheetahs,1665,AR.html.
ZSL. (2012b) Keeping track of penguins. http://www.zsl.org/conservation/regions/antarctica/monitoringpenguins,1770,AR.html.
Appendices 101
Section Ten APPENDICES
Appendix 1 – useful resources This field guide has been compiled from existing literature, discussions with experts and personal knowledge. A plethora of very useful material is available and this section aims to provide a selection of useful additional sources. Online camera trap community The Camera trapping Information Exchange group is a very active online discussion group in which any camera trap topic can be discussed. The group consists of long-standing experts and novice camera trappers. The group can be joined online: https://www.facebook.com/groups/383092015080952/
Remote camera tests and reviews Several websites post results of camera tests and camera reviews these include: • www.wildlifemonitoring.com.au/compare • www.trailcampro.com • www.chasingame.com
Other camera trap handbooks There are several other excellent camera trapping handbooks/manuals/guides available. A selection:
Ancrenaz, M., Hearn, A.J., Ross, J., Sollmann, R. and Wilting, A., (2012) - Handbook for wildlife monitoring using camera-traps. BBEC ll Secretariat. Kota Kinabalu, Sabah, Malaysia.
Brown, J. & Gehrt, S.D. (2009) - The basics of using remote cameras to monitor wildlife. The Ohio State University.
Cutler, T.L. & Swann, D.E. (1999) - Using remote photography in wildlife ecology: a review. Wildlife Society Bulletin, 571—581.
102 Expedition Field Techniques
Fegraus, E.H., Lin, K. and Ahumada, J., Baru, C., Chandra, S. and Youn, C. (2011) - Data acquisition and management software for camera trap data: A case study from the TEAM Network. Ecological Informatics. 6(6): 345-353.
Foster, R.J. & Harmsen, B.J. 2012 - A critique of density estimation from camera-trap data. The Journal of Wildlife Management 76(2): 224-236.
Kays, R.W. & Slauson, K.M. 2008 - Remote cameras. In: Noninvasive survey methods for carnivores (Long, R.A., MacKay, P., Zielinski, W.J., and Ray, J.C.). Island Press, Washington, DC.
Kelly, M.J. (2008) - Design, evaluate, refine: camera trap studies for elusive species. Animal Conservation 11(3): 182-184
Meek, P., Ballard, G. and Fleming, P. (2012) - An introduction to camera trapping for wildlife surveys in Australia. PestSmart toolkit publication. Invasive Animals Cooperative Research Centre, Canberra, Australia.
Mohamad, S.W. & Darmaraj M.R. (2009) A general guide to camera-trapping large mammals in tropical rainforests, with particular reference to tigers. WWF.
O'Connell, A.F., Nichols, J.D. and Karanth, U.K. (2010) - Camera traps in animal ecology: Methods and analyses. Springer Verlag.
Rovero, F., Tobler, M. and Sanderson, J. 2010 - Camera Trapping for inventorying terrestrial vertebrates. In Manual on Field Recording Techniques and Protocols for All Taxa Biodiversity Inventories, Chapter 6. ABC Taxa
Silver, S. (2004) - Assessing jaguar abundance using remotely triggered cameras. Wildlife Conservation Society, New York.
TEAM Network - Terrestrial Vertebrate (Camera Trapping) Monitoring Protocol.
Tobler, M.W., Carrillo-Percastegui, S.E., Leite Pitman, R., Mares, R. and Powell, G. (2008) - An evaluation of camera traps for inventorying large-and medium-sized terrestrial rainforest mammals. Animal Conservation 11(3): 169-178.
Appendices 103
Appendix 2 – Software applications Storing, sorting and coding of images can be extremely time-consuming, especially when done manually. Luckily there are a number of software programs available that speed up the task.
Image management software Spreadsheet applications Spreadsheet applications such as Microsoft Excel are easy to use but, as data entry has to be done manually, require a lot of time entering data.
However, when there are a lot of photos to analyse this system is not recommended.
Self-made customisable Microsoft Access Databases Using Microsoft Access is the most suitable way of creating your own customised management dataset. However, it requires time and a good understanding of Microsoft Access to create such a database and to learning how to extract EXIF data into the database takes specialist knowledge.
Only if you have very specific requirements for your survey, or if you have too much time on your hands, would I create my own database. Better alternatives are available.
Camera Base Developed by Mathias Tobler, San Diego Zoo Institute for Conservation Research. Camera Base is a tool that helps biologists manage the complete data from multiple camera trap surveys and provides tools for different types of data analysis including capture-recapture, occupancy, activity patterns and diversity. It is based on Microsoft Access and automatically extracts EXIF data. It prepares the data for analysis in PRESENCE, MARK, DENSITY, EstimateS and CAPTURE. It has numerous tools such as a map to view spatial distribution of cameras, activity patterns, and can perform queries such as photo reports, number of photos for each species, information summaries for each survey and many more. An additional bonus is that multiple surveys can be entered in the database.
This is by far the most complete and convenient camera trap software available. http://www.atrium-biodiversity.org/tools/camerabase/
104 Expedition Field Techniques
PestSmart Remote Camera Trapping Database Developed by the Invasive Animals CRC. This camera trapping database is designed to store camera trap site data directly related to the camera trapping data sheet. The database is not an image storage and analysis program but provides a basic foundation for recording and storing site data. Based on Microsoft Access. http://www.feral.org.au/pestsmart/monitoring/
Small Wild Cat Conservation Software Program Developed by Jim Sanderson. A DOS operating program that manages, codes stores and analyses camera trap images. http://www.smallcats.org/CTA-executables.html
Timelapse Image Analyser Prof. Saul Greenberg, University of Calgary (Computer Science). The tool automatically goes through all images and extracts information such as dates and times; it categorizes unusual images including dark (night time) and corrupted ones; it displays a series of 'codes' specific to the biologist's project, where the biologist can fill in codes by typing, selecting from menus or (for counting) simply by clicking on objects in the image. http://grouplab.cpsc.ucalgary.ca/cookbook/index.php/Demos/TimelapseCoder WWF-Malaysia Camera-Trap Database: Developed by Shariff Mohamad, WWF-Malaysia. A very useful and easy to manipulate database. It includes automatic extraction of EXIF data. Microsoft Access database. http://myrimba.org/2012/01/05/toolbox_update_5/
Image storing, coding, manipulation and data extraction software Here is a list of freely available software that can help you organize the many image or video files you will collect. Tools include extraction of date and time as well as other EXIF data, batch renaming files, as well as organizing them. Note that I have not had the chance to check all the options below as some have been collated and recommended by other camera trappers.
Directory List & Print - A software tool for Windows and enables listing and printing the content of any directory in a simplest way. By copying to the clipboard the lists can be exported into other programs or opened directly in Word and Excel. The Free Version (Freeware) has all the basic features included http://www.infonautics.ch/directorylistprint/
Appendices 105
Bulk Rename Utility – Allows bulk renaming of photos. Can incorporate EXIF data www.bulkrenameutility.co.uk/
ExifPro - An image browser application that can help you display, describe, tag, and manipulate your collection of photographs www.exifpro.com
ExifToolGUI - tool for viewing/editing metadata inside image files. This program is particularly useful to change the metadata in your camera if this has been set to a wrong time/date. You need to install Exiftool first. (http://www.sno.phy.queensu.ca/~phil/exiftool/) u88.n24.queensu.ca/exiftool/forum/index.php/topic,2750.0.html
GeoSetter - a freeware tool for Windows (XP or higher) for showing and changing geo data and other metadata (IPTC/XMP/EXIF) of image files (e.g. images taken by digital cameras). In fact, this tool uses ExifTool to extract EXIF data. http://www.geosetter.de/en/
ReNamer – A file renaming tool, which offers all the standard renaming procedures, including prefixes, suffixes, replacements, case changes, as well as removing contents of brackets, adding number sequences, changing file extensions, etc. Supports EXIF meta tagging www.den4b.com/?x=downloads&product=renamer,
Auto Photo Organiser - Auto Photo Organizer organizes digital photos automatically. The software could create year, month, and day folders by date picture taken and then copy or move photos to corresponding folder automatically. download.cnet.com/Auto-Photo-Organizer/3000-2193_4-75059233.html
PhotoSpread - Developed through a collaboration between the Stanford Computer Science Department and the Biological Sciences Department. PhotoSpread enables users to view and rapidly assign metadata to large numbers of photographs. www.stanford.edu/~eabelson/photospread.htm
Free photo editing software Photos from camera traps are sometimes too dark, too bright, or simply not optimally processed. There are a number of free software programs available that allow editing images at wish. There really is no need to pay for expensive software such as Adobe Lightroom or Photoshop. These applications are just about as good.
RawTherapee - Does just about everything Adobe Camera Raw or Lightroom can do. rawtherapee.com/blog/rawtherapee-4.0.9-released

106 Expedition Field Techniques
Photoscape - This application will do just about everything a person needs in the way of changing brightness, contrast, colour balance, size, cropping and adding a frame as the cherry on the cake. There are clone- and spot-removal tools, as well as red-eye correction. www.photoscape.org

App
endi
x 3
– C
amer
a Se
tup
Dat
ashe
et
Site
po
int
ID
Cam
era
no.
Cam
era
type
IR
/IN
SD c
ard
no.
Latitude
Longitude
GPS
ID
Se
tup
date
(dd/
mm
/yy)
Setu
p tim
e
(hh:
mm
)
Res
earc
her
nam
e Te
rrain
(s
lope
,
hill,
pl
atea
u,
valle
y)
Elev
atio
n D
istu
rban
ce
type
N
OTE
S

App
endi
x 4
– C
amer
a C
heck
Dat
ashe
et
Cam
era
poin
t ID
C
heck
dat
e
(dd/
mm
/yy)
Che
ck
time
(hh:
mm
)
Num
ber
of
imag
es
Res
earc
her
nam
e C
amer
a st
ill a
ctiv
e
Y/N
Cam
era
dam
aged
Y/N
Rea
son
if no
t ac
tive
Bat
tery
ch
ange
d
Y/N
SD c
ard
chan
ged
Y/N
New
SD
ca
rd
num
ber
Old
SD
ca
rd
num
ber

App
endi
x 5
– C
amer
a R
etrie
val D
atas
heet
Cam
era
poin
t ID
Cam
era
num
ber
Pick
up d
ate
(dd/
mm
/yy)
Pick
up
time
(hh:
mm
)
Res
earc
her
nam
e C
amer
a st
ill a
ctiv
e
Y/N
Cam
era
dam
aged
Y/N
Rea
son
if no
t ac
tive
NO
TES


Geography Outdoors:
the centre supporting field research,
exploration and outdoor learning
Royal Geographical Society (with IBG)
1 Kensington Gore London SW7 2AR
+44 (0)20 7591 3030
+44 (0)20 7591 3031
www.rgs.org/go
T
F
E
W