Expecting the Unexpected: Oil in 2012 – A Year of Tail Risks
30
Expecting the Unexpected: Oil in 2012 – A Year of Tail Risks Commodities Research and Strategy Edward L. Morse +1 (212) 723-3871 [email protected] See Appendix A-1 for Analyst Certification, Important Disclosures and non-US research analyst disclosures Citi Investment Research & Analysis is a division of Citigroup Global Markets Inc. (the "Firm"), which does and seeks to do business with companies covered in its research reports. As a result, investors should be aware that the Firm may have a conflict of interest that could affect the objectivity of this report. Investors should consider this report as only a single factor in making their investment decision. Published: 22 February 2012
Transcript of Expecting the Unexpected: Oil in 2012 – A Year of Tail Risks
Expecting the Unexpected: Oil in 2012 – A Year of Tail Risks
Commodities Research and Strategy
Edward L. Morse+1 (212) 723-3871
See Appendix A-1 for Analyst Certification, Important Disclosures and non-US research analyst disclosuresCiti Investment Research & Analysis is a division of Citigroup Global Markets Inc. (the "Firm"), which does and seeks to do business with companies covered in its research reports. As a result, investors should be aware that the Firm may have a conflict of interest that could affect the objectivity of this report. Investors should consider this report as only a single factor in making their investment decision.Published: 22 February 2012

2
Oil in 2012: binary tail risks skewed to the upside
2012 Brent range-bound $100-120, averaging $110
1H’12 downside price pressures: slower global growth, Eurozone systemic problems, China slowdown
2H’12 upside pressures from stimulus packages worldwide, cautious optimism on risk assets
Oil demand growth: +0.8-m b/d in 2012, +1-m b/d in 2013, based on Citi estimates of global GDP growth: 3.0% in 2012 and 3.6% in 2013
Bearish supply scenarios: Libyan return, higher Iraqi flows, Saudi replacements for sanctioned Iranian crude – but Saudi Arabia is targeting $100 price
And supply risks abound…– Escalation of violence in Iraq, with the potential of
civil war, and tensions between Israel and Iran top the list, but an EU embargo on Iranian oil, sanctions on Syria, succession and the possibility of strife in Saudi Arabia, elections in Venezuela and Angola and ongoing violence in Sudan, Nigeria and Yemen are on the list but do not complete it.
Brent range-bound between $100-$120/bbl in 2012, but tail risks could cause spikes/dips; potential supply risks abound, but $120+ could be pain point for global economy, with energy spend % of GDP at highs
0%
1%
2%
3%
4%
5%
6%
7%
8%
9%
10%
'67 '71 '75 '79 '83 '87 '91 '95 '99 '03 '07 '11e '15e '19e
Ener
gy a
s %
of G
DP
0
20
40
60
80
100
120
Bren
t Oil (
US$/b
bl)
Oil Gas Coal Nuclear Hydro Brent Oil (real): RHS
Supply growth and limited
competition for energy
Competition for energy between
non-OECD/OECD
Prices above 7% of GDP have been
disruptive to growth
Current Oil Prices Are Already In The Danger
Zone for the Global Economy
Energy expenditure as % of GDP nearing danger zone
Sources: Bloomberg, Citi Investment Research and Analysis
0
20
40
60
80
100
120
140
160
Jan-08
Apr-08
Jul-08
Oct-08
Jan-09
Apr-09
Jul-09
Oct-09
Jan-10
Apr-10
Jul-10
Oct-10
Jan-11
Apr-11
Jul-11 Oct-11
Jan-12
Apr-12
Jul-12
Prior 1Y Range Prior YTD Range Closing price Prior 1Y Avg
2008 2009 2010 2011$/bbl
Brent prices range-bound in 2012

3
OPEC may have some work to do in 2012, but risks to supply loom large
Only 2.5-m b/d of spare capacity in the world, all in Saudi Arabia, and really only 1.8-m b/d effective– And the IEA SPR can only release stocks at ~500-k
b/d, not officially claimed 4.5-m b/d, due to infrastructure constraints
With no supply disruptions, OPEC spare capacity should rise, but risks abound– Iraq, Israel/Iran and sanctions, Syria, Saudi Arabia
strife, Venezuela/Angola elections, Sudan, Nigeria, Yemen… and more
Base case constructive for oil prices– Bull case (25% probability): oil price spiking and
hurting global economy, could even be above $175 Brent, but not for long
– Bear case: Euro disintegration (Citi economists see 5% probability) or China hard landing. Brent below $100, dips even under $90
…and the world is operating with lean cushions of inventory or spare production capacity
500
1000
1500
2000
2500
3000
3500
4000
4500
2000 2001 2002 2003 2004 2005 2006 2007 2008 2009 2010 2011
$20
$40
$60
$80
$100
$120
$140
$160OPEC Spare Capacity (k b/d) Brent ($/bbl) (rhs)
Source: Bloomberg, OPEC, Citi Investment Research and Analysis
OPEC spare capacity and Brent price

4
Base case scenario for 2012
Source: Citi Investment Research and Analysis estimates
Base Case Supply-Demand Balance
13.05.2113.0100.0105.0100.0100.095.094.893.889.7102.293.579.4WTI ($/bbl)
10.0-1.3120.0110.0115.0110.0110.0105.0111.4109.7113.3117.4105.080.3Brent ($/bbl)
Crude Oil Prices
0.20.0-0.90.10.60.3-0.9-1.3-0.8-0.7-0.6-0.8Stock Change
1.21.891.590.390.890.389.890.488.589.788.587.588.587.4Total Supply
0.30.636.836.436.436.336.236.935.836.335.935.235.834.8Total OPEC
0.10.46.46.26.36.36.26.25.96.05.95.85.85.3Other
0.20.330.430.230.130.030.030.729.930.330.029.430.029.5Crude
OPEC
0.91.154.853.954.354.053.653.552.753.452.652.352.752.6Total Non-OPEC
0.30.24.44.24.34.24.24.14.04.14.04.03.83.9Other
0.70.950.349.750.149.849.449.448.849.348.648.348.948.7Crude
Non-OPEC
Supply
1.00.891.390.391.790.189.190.189.491.089.388.289.188.3Total Demand
1.11.145.844.745.344.944.843.943.644.143.743.642.842.1Non-OECD Demand
-0.1-0.345.545.546.445.344.446.245.846.945.644.646.346.2OECD Demand
Demand
13v1212v1120132012Q4 2012
Q3 2012
Q2 2012
Q1 2012
2011Q4 2011
Q3 2011
Q2 2011
Q1 2011
2010m b/d

5
Product prices are above 2008 highs in non-US dollar terms…
German Diesel Prices in Euros Average UK Diesel Prices in £ India (Delhi) Diesel Price in INR
350
400
450
500
550
600
650
700
750
800
850
2006 2007 2008 2009 2010 2011
3.0
3.5
4.0
4.5
5.0
5.5
2006 2007 2008 2009 2010 2011
25
27
29
31
33
35
37
39
41
43
2006 2007 2008 2009 2010 2011
Source: Citi Investment Research and Analysis Source: Citi Investment Research and Analysis Source: Citi Investment Research and Analysis
Beijing 93 Ron Gasoline in CNY S Korea Gasoline Prices in Won Philippines Gasoline Price in PHP
4
5
5
6
6
7
7
8
8
9
2006 2007 2008 2009 2010 2011
1200
1300
1400
1500
1600
1700
1800
1900
2000
2100
2006 2007 2008 2009 2010 2011
25
30
35
40
45
50
55
60
2006 2007 2008 2009 2010
Source: Citi Investment Research and Analysis Source: Citi Investment Research and Analysis Source: Citi Investment Research and Analysis
Retail fuel and distillate prices are at or close to the highs of 2008 in non-US dollar terms, including Europe, and compounded by removal of subsidies in some cases in emerging markets

6
…and gasoline prices could be higher than ever this summer
Recent closures on East Coast– ConocoPhillips’ Trainer (185-k b/d) and Sunoco’s Marcus
Hook (178-k b/d) ; Sunoco Philadelphia (335-k b/d) is set to shut July 1 if not sold
– These are simple refineries that take light, sweet crudes from relatively expensive West Africa and North Sea;
Combined with Petroplus and other refinery closures in Europe, and Caribbean and Latin America refinery closures and outages, Atlantic Basin product markets have tightened significantly, particularly impacting the US East Coast
Summer gasoline could see retail prices over $4/gal as driving season comes around and these refinery closures bite– Summer specification gasoline is harder to make and
greater imports pull is expected from Latin America
Although US Gulf Coast and US midcontinent refinery capacity could supply the East Coast’s gasoline needs, transport is again a constraint– Colonial pipeline (Gulf Coast to East Coast) near capacity– US Midwest refining capacity could supply western PA,
upstate NY, but pipeline capacity constraints there too– A Jones Act waiver would be needed to ship products
from US Gulf Coast to the East Coast
Atlantic Basin refinery capacity has fallen by over 1.1-m b/d since end-2011, which is set to cause a gasoline shortage on the US East Coast this summer
Sources: IIR, FGE, CIRA
442
172At risk: Petroplus Coryton
Dec 2011105Lyondell Berre L’Etang
106At risk: Petroplus Ingolstadt
Jan 2011154Petroplus Petit Couronne
Jan 2011110Petroplus Antwerp
Europe
698
July 1 if not sold335Sunoco Philadelphia
Jan 201173Petroplus Cressier
Dec 2011178Sunoco Marcus Hook, PA
Nov 2011185ConocoPhillips Trainer, PA
US East Coast
DateCapacityRefinery
Selected major refinery capacity facing maintenance or closure(k b/d)
7
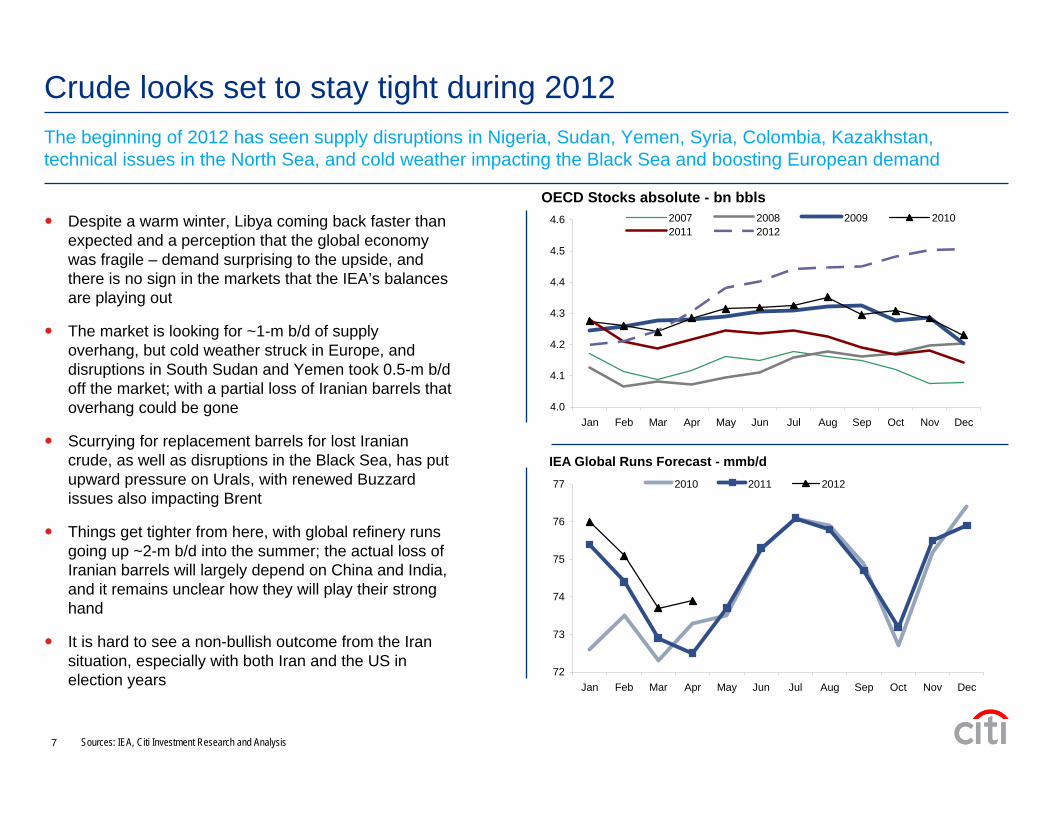
Crude looks set to stay tight during 2012The beginning of 2012 has seen supply disruptions in Nigeria, Sudan, Yemen, Syria, Colombia, Kazakhstan, technical issues in the North Sea, and cold weather impacting the Black Sea and boosting European demand
Despite a warm winter, Libya coming back faster than expected and a perception that the global economy was fragile – demand surprising to the upside, and there is no sign in the markets that the IEA’s balances are playing out
The market is looking for ~1-m b/d of supply overhang, but cold weather struck in Europe, and disruptions in South Sudan and Yemen took 0.5-m b/d off the market; with a partial loss of Iranian barrels that overhang could be gone
Scurrying for replacement barrels for lost Iranian crude, as well as disruptions in the Black Sea, has put upward pressure on Urals, with renewed Buzzard issues also impacting Brent
Things get tighter from here, with global refinery runs going up ~2-m b/d into the summer; the actual loss of Iranian barrels will largely depend on China and India, and it remains unclear how they will play their strong hand
It is hard to see a non-bullish outcome from the Iran situation, especially with both Iran and the US in election years
OECD Stocks absolute - bn bbls
4.0
4.1
4.2
4.3
4.4
4.5
4.6
Jan Feb Mar Apr May Jun Jul Aug Sep Oct Nov Dec
2007 2008 2009 20102011 2012
IEA Global Runs Forecast - mmb/d
72
73
74
75
76
77
Jan Feb Mar Apr May Jun Jul Aug Sep Oct Nov Dec
2010 2011 2012
Sources: IEA, Citi Investment Research and Analysis

8
0
0.2
0.4
0.6
0.8
1
1.2
1.4
1.6
1.8
Asia-Pacific Europe Africa and others
m b/d
2,000
4,000
6,000
8,000
10,000
12,000
Jan-09
Apr-09
Jul-09
Oct-09
Jan-10
Apr-10
Jul-10
Oct-10
Jan-11
Apr-11
Jul-11
Oct-11
000s b/d
-30%
-20%
-10%
0%
10%
20%
30%
40%
50%
Y-o-Y Change
Production Net Exports Jan '09 TargetsViable Capacity Production Growth (rhs) Export Growth (rhs)
8
Potential impact of the Iranian situation
EU embargo to be phased in by July 1, affecting 400-600-k b/d; Iran has countered with threat to cut preemptively, starting with the UK and France; scurried buying pushing up Urals, Dubai
US financial sanctions, discussion on targeting 18% of Iranian revenues (either through volumes or discounts)– Japan and South Korea (~500-k b/d combined)
should begin reducing imports in 1H’12– India (~500-k b/d) discussing buying some Iranian
volumes using rupees and other means to bypass Bank Markazi
– China (~550-k b/d) has reduced Iranian purchases -to win discounts but also as Xi Jinping visits the US; but Unipec may have an “agreement in principle” to renew term contracts
– Problems buying insurance has discouraged the chartering of tankers to transport Iranian crude
Where could replacement supplies come from?– Saudi Arabia at ~10-m b/d, spare capacity only 1.8-m
b/d (in 3 wks), further 700-k b/d could take six months– IEA SPR claims 4.5-m b/d but more like 500-k b/d– Iraqi de-bottlenecking of export facilities
Iran’s domestic politics and economy are facing severe pressures in the run-up to elections
Iran’s nuclear ambitions have led to US/EU efforts to impose stricter sanctions, while end-2011 saw Israeli military posturing, the storming of the UK Embassy, two explosions at military sites, attempted assassination of the Saudi Ambassador to the US…
Source: IEA, CIRA
Breakdown of exports from Iran by destination region
Saudi spare capacity dwindling
Source: JODI, Citi Investment Research and Analysis estimates

99
No other asset class responds so well and so protectively in times of heightened tail risks—including agriculture, gold and crude oil…– Weather and catastrophes: hurricanes, floods, refinery fires, tanker spills, outages, terrorism– Unpredictable geopolitical strife within OPEC—or even an SPR release—can lead to measurable changes in supply to market that can
have bullish or bearish implications
The WTI forward curve before and after Hurricane Katrina is an example when both prompt and deferred prices jumped >10% almost overnight with a sharp parallel move in the entire structure
Brent curve at the start of Libya’s civil war on February 15 last year showed nearby 1-2 month prices at +$0.90/bbl and in contango one year out; NATO involvement by March 31 showed a 1-2 month differential at -$2/bbl and the entire curve shifted into steep backwardation
Source: Bloomberg
WTI forward curve response to Hurricane Katrina Brent forward curve response to Libyan civil war
Source: Bloomberg
Tail risk events make commodities attractive investmentsPotential for tail risk events make commodities attractive investments…and makes oil a poor choice for a short (as current call skews point to on recent geopolitical tension in Iran)…

1010
Since early 2010, call option open interest for Dec-12 delivery with a strike price of $100/bbl to $140/bbl had risen substantially at the expense of in-the-money calls, and these are skewed heavily to upside risk
Big jump upward during the Arab Spring in early 2011 as traders appeared to be preparing for a positive price breakout and upside on the tail as opposed to negative price movement
August/September positioning in options market had seen fading of OI in the $100-180/bbl range compared to 1H’11 and July in part due to retrenchment of world GDP growth estimates that left market players wondering about the commodity bull-cycle—especially for oil—into 2012 without significant policy action in US and Europe
But the volatility smile as of September still remained skewed toward a higher likelihood of a breakout above the range than below the range, from the belief that OPEC would defend the floor, which itself is rising due to higher breakeven budgets in the wake of the MENA Spring
Today’s ‘bullish’ outlook on oil options is largely driven by geopolitical risk as well—this time with Iran. However, investors should note that purchases of call options also entail risk of loss of premium in the event of oil price decline.
Source: Bloomberg, Citi Investment Research and Analysis
Preference for sharp upside price break from Feb-July ‘11 WTI Dec 12 options volatility smile and open interest
0%
5%
10%
15%
20%
25%
30%
35%
0-60 61-80 81-100 101-120 121-140 141-160 161-180 181+0
10
20
30
40
50
60Open Interest (lhs)Avg Implied Vol (rhs)
Source: Bloomberg, Citi Investment Research and Analysis
-20.0%
-10.0%
0.0%
10.0%
20.0%
30.0%
40.0%
50.0%
0-80 81-100 101-120 121-140 141-160 161-180 181-
Change in OI% from2/15/11 to 7/29/11
% of total OI
strike price
Investor sentiment turning bullishBullish investor sentiment increased after Libyan supply disruption, although had faded afterwards in 3Q’11 on weaker global economic growth outlook…

1111
Oil prices have been bolstered by the ratcheting up of tensions with Iran, and open interest in deep out-of-the-money calls ($140 to $180/bbl) for June 2012 has surged as the market prices in the potential for more surprises to come, but Brent structure has also responded in impressive fashion
Source: Bloomberg, Citi Investment Research and AnalysisSource: Bloomberg, Citi Investment Research and Analysis
Brent Dec 12 Call Option Open Interest
5%
15%
25%
35%
45%
0-80 81-100 101-120 121-140 141-160 161-180 181-
9/30/201110/31/201111/30/20111/18/2012
% of total OI
strike price
WTI June 12 Call Option Open Interest
0%
10%
20%
30%
40%
0-80 81-100 101-120 121-140 141-160 161-180 181-
9/30/201110/31/201111/29/20111/26/2012
% of total OI
strike price
Geopolitical turmoil adding risk premiumGeopolitical turmoil in the Middle East has more recently added a ‘risk premium’ to the more liquid June (m) and December (z) crude oil call option contracts…

1212
Source: Bloomberg, BP Statistical Review, Citi Investment Research and Analysis
Iraqi oil production since 1973
0
500
1000
1500
2000
2500
3000
3500
4000
1973 1976 1979 1982 1985 1988 1991 1994 1997 2000 2003 2006 2009
kb/d Iraq Oil Production ('000 b/d)
Iran-Iraq War Post-1990 Gulf WarEmbargo
2003 Iraqi Freedom and breakdow n of UN oil-for-food program
Source: Jerusalem Post
Iraqi production had thought to be reaching 3-m b/d by end-2011, but has stalled out at 2.8-m b/d to 2.9-m b/d, due to constraints from export infrastructure to bring expanded production to market
Political crisis is deepening, with Iraqi politicians openly discussing the probability of civil war or breakup– Former Vice President fled the country– Sectarian violence is flaring up, with bomb attacks
Stabilizing force not apparent, with the US leaving Iraq not exactly on its own terms
Could the first wave of divestment be starting?– Statoil looks to exit the giant 1.8-m b/d West Qurna-2 field development
Iraqi oil fields
Bullish risks #1: Instability in Iraq

1313
Iranian naval exercises in the Strait, US sanctions and an EU embargo, the attacks on the UK embassy, and two explosions at military sites recently put at risk the 17-m b/d of oil flows through the Strait of Hormuz
If the US and Israel use military force, what are the potential oil consequences?– Could gasoline imports to Iran be impeded?– Would damage be done to Iran’s 4 export terminals,
especially the huge Kharg Island, to deprive Iran of exports?
– How vulnerable is Iran’s shipping fleet (the largest in OPEC)?
Iranian counter attack strategy– Could Iran effectively block the 17-m b/d Strait of
Hormuz, through which 90% of Persian Gulf Exports flow?
– Could Iran effectively cut off Iraqi oil exports?
Bab el-Mandab Bosporus
Malacca
Suez
Strait of Hormuz
02468
1012141618
m b/d
Source: EIA
Strait of Hormuz is a key chokepoint
Source: EIA
Bullish risks #2: Iran
Nuclear ambitions, the Strait of Hormuz, and potential targeting of Iraqi exports

1414
Possible Strategies1. Mining the Strait of Hormuz2. Missile Attacks on tankers in the Persian Gulf
Is this plausible?1. Mining the Strait of Hormuz has been tried before
The issue is less the danger than the resistance of double-hulled tankersIran mined the Gulf during the Iran-Iraq war and the open question is whether there are “new” Chinese mines that are any stronger than those in 1980-1988
2. Missile batteries could likely be neutralized within days if the US used overwhelming force
An Iranian counter attack would likely lead to a very short-lived price spike
Bullish risks #2a: Iran and closing of the Strait of Hormuz

1515
Iran currently produces about 3.6-m b/d, exports about 2.3- to 2.6-m b/d, and imports about 90.5-k b/d of gasoline (in 2009, from 108.1-k b/d in 2008)– Much talk has focused on Iran’s potential use of its “oil weapon,” reducing output significantly to raise prices and “punish”
various partiesUnlikely because:
Saudi Arabia alone could just about cover Iranian productionUS, IEA could release strategic stocks (1.5 billion barrels), a credible instrument, since stock release after hurricanes in 2005
Iran reluctant to risk earning nothing from oil exports and is more likely to use its influence to cut off Iraq exports from Basra (1.3 to 1.6-m b/d)– This potential risk is credible since Iran could plausibly deny it – Such a cut-off would tighten markets, raise prices and raise Iran’s income– While Saudi Arabia and others might react by raising output, they would likely do so to offset and take advantage of already
much higher prices, which would be further bolstered by speculators
Bullish risks #2b: Iran could respond by hitting Iraqi oil production

1616
Saudi spare capacity dwindling Impact of attacks on Abqaiq and Ras Tanura
Saudi total claimed capacity is 12.5-m b/d, with market believing commercial capacity of 11.8-m b/d
Production of ~10-m b/d leaves < 1.8-m b/d viable spare capacity
Markets seem less concerned by Saudi instability than by potential terrorist/other attacks
Saudis claim (1) an attack at Abqaiq is unlikely and (2) facilities could be rebuilt quickly. – But what if there is an attack and facilities cannot be rebuilt quickly?
This is one of the most credible longer-term risks in the oil market– Saudi Arabia could replace Iranian exports; but it could not replace itself– This sort of attack would test the ability of IEA countries to actually logistically release stocks– Doubts on IEA’s ability to physically release enough oil to replace 5 to 7-m b/d of Saudi oil
Saudis claim to have redundancy and replacement equipment stored nearby
No successful sustained attack yet, but 2004 attack in Yanbu followed by 2006 attack on 7-m b/d processing in Abqaiq
2,000
4,000
6,000
8,000
10,000
12,000
Jan-09
Apr-09
Jul-09
Oct-09
Jan-10
Apr-10
Jul-10
Oct-10
Jan-11
Apr-11
Jul-11
Oct-11
000s b/d
-30%
-20%
-10%
0%
10%
20%
30%
40%
50%
Y-o-Y
Change
Production Net Exports Jan '09 TargetsViable Capacity Production Growth (rhs) Export Growth (rhs)
Source: JODI, Citi Investment Research and Analysis estimates
Bullish risks #3: Saudi disruption

1717
Venezuela output declining…– IEA estimates sustainable crude production capacity
for Venezuela at 2.57-m b/d for 2012, increasing to 2.89 in 2014 and staying roughly flat onwards, with growth of only 140-k b/d between 2010 and 2016
– By comparison, IEA estimates that Libya – still working to resume pre-conflict production – will have increased its sustainable crude production capacity by 170-k b/d between 2010-2016
Iran output decline at around 100 to 300-330-k b/d per year– Output declining in southern fields– Lack of foreign investment due to international
sanctions for new field development, and enhanced oil recovery of existing fields
– IEA estimates Iran’s sustainable crude production capacity could fall by over 800-k b/d between 2010-2016
2,200
2,300
2,400
2,500
2,600
2,700
2,800
2,900
3,000
3,100
2005 2006 2007 2008 2009 2010 2011
k b/d
3,200
3,300
3,400
3,500
3,600
3,700
3,800
3,900
4,000
4,100
2005 2006 2007 2008 2009 2010 2011
k b/d
Venezuelan crude production
Source: EIG, Citi Investment Research and Analysis
Iranian crude production
Source: EIG, Citi Investment Research and Analysis
Bullish risks #4: Collapsing OPEC output
18
50
250
450
650
850
1,050
1,250
1,450
Jan-09 May-09 Sep-09 Jan-10 May-10 Sep-10 Jan-11 May-11 Sep-11 Jan-12 May-12 Sep-12
18
859095
100105110115120125130
Jan-11 Feb-11 Mar-11 Apr-11 May-11 Jun-11 Jul-11 Aug-11 Sep-11 Oct-11 Nov-11
$/bbl
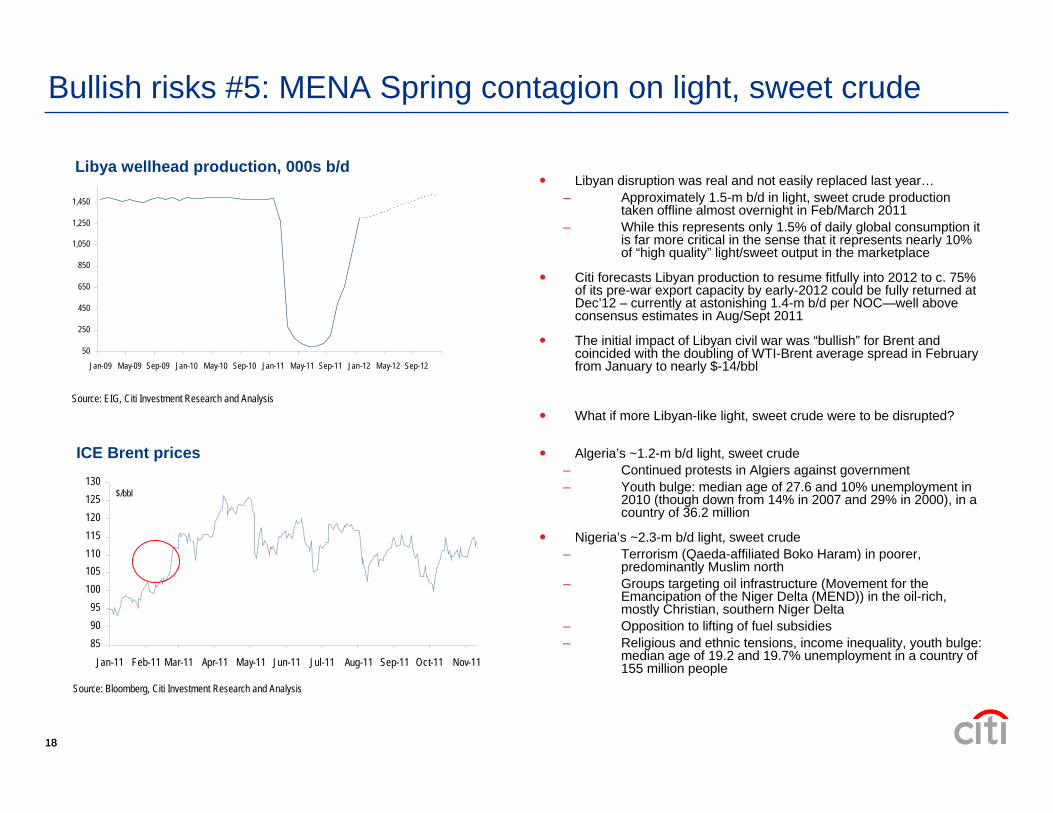
Libyan disruption was real and not easily replaced last year…– Approximately 1.5-m b/d in light, sweet crude production
taken offline almost overnight in Feb/March 2011– While this represents only 1.5% of daily global consumption it
is far more critical in the sense that it represents nearly 10% of “high quality” light/sweet output in the marketplace
Citi forecasts Libyan production to resume fitfully into 2012 to c. 75% of its pre-war export capacity by early-2012 could be fully returned at Dec’12 – currently at astonishing 1.4-m b/d per NOC—well above consensus estimates in Aug/Sept 2011
The initial impact of Libyan civil war was “bullish” for Brent and coincided with the doubling of WTI-Brent average spread in February from January to nearly $-14/bbl
What if more Libyan-like light, sweet crude were to be disrupted?
Algeria’s ~1.2-m b/d light, sweet crude– Continued protests in Algiers against government – Youth bulge: median age of 27.6 and 10% unemployment in
2010 (though down from 14% in 2007 and 29% in 2000), in a country of 36.2 million
Nigeria’s ~2.3-m b/d light, sweet crude– Terrorism (Qaeda-affiliated Boko Haram) in poorer,
predominantly Muslim north– Groups targeting oil infrastructure (Movement for the
Emancipation of the Niger Delta (MEND)) in the oil-rich, mostly Christian, southern Niger Delta
– Opposition to lifting of fuel subsidies– Religious and ethnic tensions, income inequality, youth bulge:
median age of 19.2 and 19.7% unemployment in a country of 155 million people
Source: EIG, Citi Investment Research and Analysis
Libya wellhead production, 000s b/d
Source: Bloomberg, Citi Investment Research and Analysis
ICE Brent prices
Bullish risks #5: MENA Spring contagion on light, sweet crude

1919
Increased social spending to stave off restless public, increasing oil producers’ minimum targeted oil prices required to balance budgets, pressuring all MENA producers to be price hawks
However, Saudi Arabia is able to sustain lower crude prices due to low debt and significant cash balances and crude inventories
As part of these social programs, subsidies for petroleum products further drive rampant domestic product demand growth in the region, including direct burning of crude oil for power generation during the summer
Domestic oil consumption necessarily diminishes the surplus crude available for export
0100200300400500
600700800900
1000
Jan-04
Jul-04
Jan-05
Jul-05
Jan-06
Jul-06
Jan-07
Jul-07
Jan-08
Jul-08
Jan-09
Jul-09
Jan-10
Jul-10
Jan-11
Jul-11
000s
b/d
5%
10%
15%
20%
25%
30%
35%
40%
Direct Burn Direct Burn, % of Demand (rhs)
Saudi direct burn of crude
Source: JODI, Citi Investment Research and Analysis estimates
0
1,000
2,000
3,000
4,000
5,000
6,000
7,000
8,000
9,000
10,000
2000 2001 2002 2003 2004 2005 2006 2007 2008 2009 2010 20110%
5%
10%
15%
20%
25%
30%
35%
40%
Crude production (lhs) Oil demand, % of production (rhs)
k b/d
Source: JODI, Citi Investment Research and Analysis estimates
Saudi domestic crude demand as % of production
Bullish risks #6: Long-term consequences of the MENA Spring

2020
Citi forecasts Libyan production to resume fitfully into 2012 toabout 75% of its pre-war export capacity by early-2012 or ~1-m b/d in 1Q’12; could be fully returned at Dec’12 – currently could be as high as 1.4-m b/d per NOC– But the final leg on the journey to full production could be
more challenging
But observers have a wide range of estimates; this could happen even sooner than expected—or later…
Transitional National Council (TNC) should honor all existing contracts, and have been open to discussions with governments that had lent less enthusiastic support earlier in the conflict
IOCs have been eager to re-enter, with Eni and Total at the forefront; the TNC needs oil revenues
The oil sector may be delinked from wider political problems
War-damage was relatively light compared to Iraq after second Gulf War
But… oil export terminal damage, looting of facilities, clogged wells from months of neglect, clearing of mines around certain fields needed
Political tensions within the victorious rebel leadership could resurface
Source: EIG, Citi Investment Research and Analysis
Libya wellhead production, 000s b/d
50
250
450
650
850
1,050
1,250
1,450
Jan-09 May-09 Sep-09 Jan-10 May-10 Sep-10 Jan-11 May-11 Sep-11 Jan-12 May-12 Sep-12
Bearish risks #1: Libyan oil revival
2121
Source: Bloomberg, BP Statistical Review, Citi Investment Research and Analysis
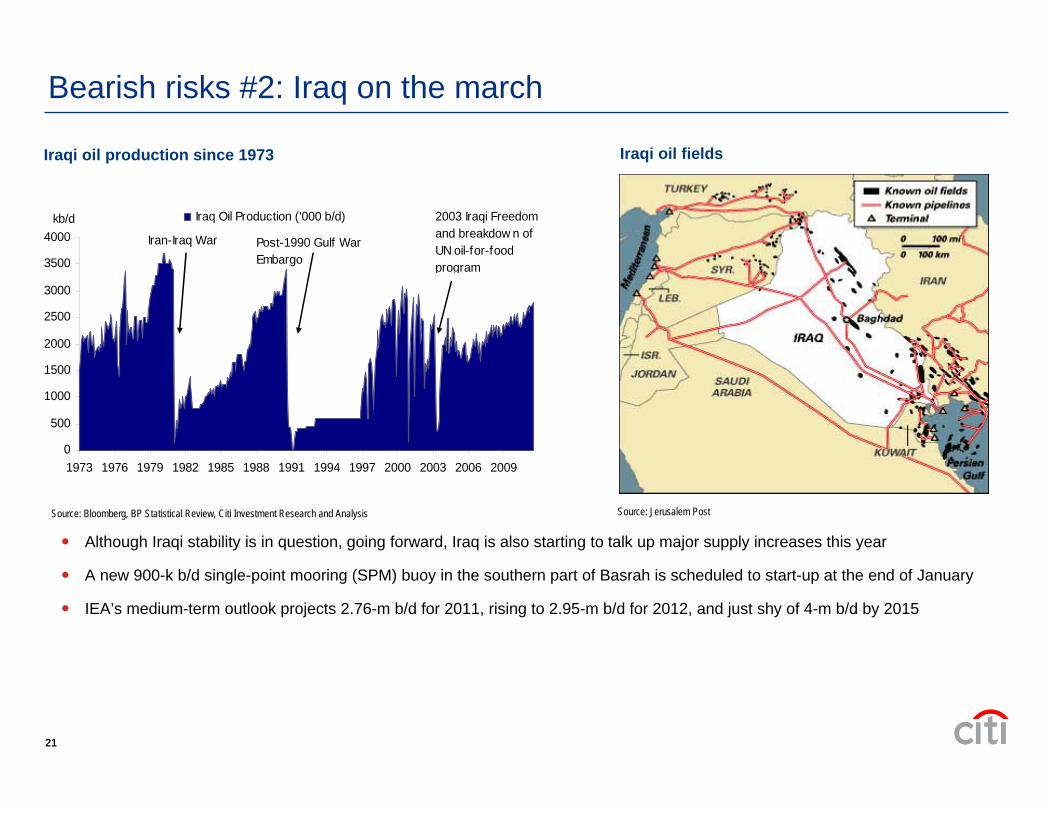
Iraqi oil production since 1973
0
500
1000
1500
2000
2500
3000
3500
4000
1973 1976 1979 1982 1985 1988 1991 1994 1997 2000 2003 2006 2009
kb/d Iraq Oil Production ('000 b/d)
Iran-Iraq War Post-1990 Gulf WarEmbargo
2003 Iraqi Freedom and breakdow n of UN oil-for-food program
Source: Jerusalem Post
Although Iraqi stability is in question, going forward, Iraq is also starting to talk up major supply increases this year
A new 900-k b/d single-point mooring (SPM) buoy in the southern part of Basrah is scheduled to start-up at the end of January
IEA’s medium-term outlook projects 2.76-m b/d for 2011, rising to 2.95-m b/d for 2012, and just shy of 4-m b/d by 2015
Iraqi oil fields
Bearish risks #2: Iraq on the march

2222
If demand falls…
Global economic weakness spreads on financial contagion and drop in inter-regional trade
– Uncertain outlook crimp lending, investment appetiteand consumer confidence
– Lower global goods demand leads to lower trade
Further financial contagion freezes lending and damages sentiment
– Euro zone sovereign debt crisis weighs on bank balance sheet, thereby restricting lending
– Debt problems and austerity further limit government support when private sector and consumers hesitate and look to retrench
Slower regional growth affects other economies– Consumption falling in major economies reduces
demand for exports from developing countries– Stimulus measures in developing countries may run
counter to the need to dampen inflation, especially when monetary stimuli are again deployed to help growth
Global energy demand falls as global economic growth spirals downward
– Sustained weakness in traditional major economies even slows down growth in developing countries, reducing physical demand for oil
…and supply rises
Saudi production stays high causing further over-supply
Strategic reasons:– Higher production pushing down oil prices, thereby
punishing Iran for as long as Iran remains as in OPEC’s presidency
– Disciplining other OPEC members to stay in line after very divergent stances after the OPEC meeting early in the year
Economic reasons:– As a member of G20, low prices from high
production could serve as the third leg of the global economic stimulus stool, when fiscal stimuli are limited by political gridlock or debt issues, and monetary stimuli at already low rates are increasingly less effective
Lower prices
Bearish risks #3: Double-dip, Saudi overproduction

2323
Trade-offs in taming rising inflation – Similar factors driving prosperity and inflation, so taming inflation
would involve further slowdown in economic growth– Previous growth models assuming unlimited supply of
resources, limiting price gains– Constraints in materials and food supplies amid strong demand
growth accelerating price rise– Higher primary goods prices possibly lifting costs faster than
what downstream sectors can pass on to consumers, or inflation becoming more severe
– Wage inflation comes from increased opportunities and increased appreciation of workers rights
Property bubble– Rising amounts of non-performing loans as a result of
policy directive to boost economy through bank lending and generally lax lending standards
– Local governments raising more debt to finance construction projects either for “show” or to boost local economy as signs of achievements
– Corruption-driven lending
Social discontent – Rising economic disparities due to severely uneven
growth and income distributions– Weak checks-and-balances of governments breeding
excessive use of power and corruption
Environmental degradation– Worsening air and water pollution feeding further social
discontent– Health degradation limiting productivity – Environmental degradation, particularly water, limiting
further growth
The drag from weak global growth– Shift from export-led growth to internal consumption driven
growth possibly too gradual amid deteriorating conditions in traditional foreign markets and lower expected growth in the future
– Rising wages eroding competitiveness in the global labour arbitrage, squeezing export-focused enterprises with lower revenue and higher costs
Intrinsics Extrinsics
Bearish risks #4: Chinese economic shock scenario

24 24
Flat to lower demand amidst rising supply from domestic and friendly sources to displace imports with…
– Slow economic growth, efficiency measures, and fleet turnover to keep demand flat to lower
…Rising domestic production– Bakken production gaining on successes with horizontal
drilling and hydraulic fracturing– Deep water Gulf of Mexico growing on improvements in
drilling technology and discoveries of major reserves, despite the Macondo oil spill
…Increasing Canadian imports– Imports from strong ally and neighbor reducing
dependence on other sources– Republicans looking to push a decision on XL in 60 days
as opposed to 2013 in the Senate
…Biofuel mandates still in place– Use of ethanol continues to displace gasoline
US liquids import requirements could fall to 6.15-m b/d by 2022, of which 3.5-m b/d would be from Canada
– US total liquids production for 2010 at 7.5-m b/d, potentially increasing 3.5-m b/d to 11-m b/d in 2022
– US consumption in 2010 was around 19.15-m b/d, potentially decreasing to 17.15-m b/d in 2022
Source: State of North Dakota, EIA, Citi Investment Research and Analysis
Western Canada Oil Supply
-
5001,000
1,5002,000
2,500
3,0003,500
4,000
2005 2006 2007 2008 2009 2010 2011E 2012E 2013E 2014E 2015E
000s
b/d
Total Supply Light Heavy
Source: CAPP, Citi Investment Research and Analysis
0
100
200
300
400
500
600
1981
1984
1987
1990
1993
1996
1999
2002
2005
2008
2011
North Dakota Montana
k b/d
North Dakota production reportedly at 540-k b/d in January 2012
Bearish risks #5: Accelerated US energy independence

2525
North American crude and NGLs could nearly double from 14-m b/d in 2010 to 25-m b/d in 2020-22
The obstacles are mainly political, rather than geological or technological:– Environmental factors, particularly in the US– Revenue sharing and the rights of competing groups,
particularly first nation issues in Canada– Constitutional, particularly in Mexico
Developing a natural gas surplus faces fewer obstacles, certainly in the US and Canada, but include:– Politics of resource nationalism in the US– Canadian politics impeding adequate export pipeline
development– Mexico: restrictions on import of foreign capital, human
resources, technology– In all cases, North American natural gas could support
globally competitive energy intensive industries, with energy input costs amongst the lowest worldwide
Source: EIA (updated May 9, 2011)
Abundant shale plays, accessed by hydraulic fracturing and horizontal drilling technology, are the key driver behind North America becoming the
globe’s “energy island” by 2020
Bearish risks #5: North America, the new Middle East?North America is poised to be a growing hydrocarbon net exporting center, with the lowest cost natural gas feedstock in the world, propelling exports of energy-intensive goods from petrochemicals to steel

26
Appendix A-1
Analyst Certification The research analyst(s) primarily responsible for the preparation and content of this research report are named in bold text in the author block at the front of the product except for those sections where an analyst's name appears in bold alongside content which is attributable to that analyst. Each of these analyst(s) certify, with respect to the section(s) of the report for which they are responsible, that the views expressed therein accurately reflect their personal views about each issuer and security referenced and were prepared in an independent manner, including with respect to Citigroup Global Markets Inc and its affiliates. No part of the research analyst's compensation was, is, or will be, directly or indirectly, related to the specific recommendation(s) or view(s) expressed by that research analyst in this report. IMPORTANT DISCLOSURES Analysts' compensation is determined based upon activities and services intended to benefit the investor clients of Citigroup Global Markets Inc. and its affiliates ("the Firm"). Like all Firm employees, analysts receive compensation that is impacted by overall firm profitability which includes investment banking revenues. For important disclosures (including copies of historical disclosures) regarding the companies that are the subject of this Citi Investment Research & Analysis product ("the Product"), please contact Citi Investment Research & Analysis, 388 Greenwich Street, 28th Floor, New York, NY, 10013, Attention: Legal/Compliance [E6WYB6412478]. In addition, the same important disclosures, with the exception of the Valuation and Risk assessments and historical disclosures, are contained on the Firm's disclosure website at https://www.citivelocity.com/cvr/eppublic/citi_research_disclosures. Valuation and Risk assessments can be found in the text of the most recent research note/report regarding the subject company. Historical disclosures (for up to the past three years) will be provided upon request. NON-US RESEARCH ANALYST DISCLOSURES Non-US research analysts who have prepared this report (i.e., all research analysts listed below other than those identified as employed by Citigroup Global Markets Inc.) are not registered/qualified as research analysts with FINRA. Such research analysts may not be associated persons of the member organization and therefore may not be subject to the NYSE Rule 472 and NASD Rule 2711 restrictions on communications with a subject company, public appearances and trading securities held by a research analyst account. The legal entities employing the authors of this report are listed below: Citigroup Global Markets Inc Edward L Morse OTHER DISCLOSURES For securities recommended in the Product in which the Firm is not a market maker, the Firm is a liquidity provider in the issuers' financial instruments and may act as principal in connection with such transactions. The Firm is a regular issuer of traded financial instruments linked to securities that may have been recommended in the Product. The Firm regularly trades in the securities of the issuer(s) discussed in the Product. The Firm may engage in securities transactions in a manner inconsistent with the Product and, with respect to securities covered by the Product, will buy or sell from customers on a principal basis. Securities recommended, offered, or sold by the Firm: (i) are not insured by the Federal Deposit Insurance Corporation; (ii) are not deposits or other obligations of any insured depository institution (including Citibank); and (iii) are subject to investment risks, including the possible loss of the principal amount invested. Although information has been obtained from and is based upon sources that the Firm believes to be reliable, we do not guarantee its accuracy and it may be incomplete and condensed. Note, however, that the Firm has taken all reasonable steps to determine the accuracy and completeness of the disclosures made in the Important Disclosures section of the Product. The Firm's research department has received assistance from the subject company(ies) referred to in this Product including, but not limited to, discussions with management of the subject company(ies). Firm policy prohibits research analysts from sending draft research to subject companies. However, it should be presumed that the author of the Product has had discussions with the subject company to ensure factual accuracy prior to publication. All opinions, projections and estimates constitute the judgment of the author as of the date of the Product and these, plus any other information contained in the Product, are subject to change without notice. Prices and availability of financial instruments also are subject to change without notice. Notwithstanding other departments within the Firm advising the companies discussed in this Product, information obtained in such role is not used in the preparation of the Product. Although Citi Investment Research & Analysis (CIRA) does not set a predetermined frequency for publication, if the Product is a fundamental research report, it is the intention of CIRA to provide research coverage of the/those issuer(s) mentioned therein, including in response to news affecting this issuer, subject to applicable quiet periods and capacity constraints. The Product is for informational purposes only and is not intended as an offer or solicitation for the purchase or sale of a security. Any decision to purchase securities mentioned in the Product must take into account existing public information on such security or any registered prospectus.

27
Investing in non-U.S. securities, including ADRs, may entail certain risks. The securities of non-U.S. issuers may not be registered with, nor be subject to the reporting requirements of the U.S. Securities and Exchange Commission. There may be limited information available on foreign securities. Foreign companies are generally not subject to uniform audit and reporting standards, practices and requirements comparable to those in the U.S. Securities of some foreign companies may be less liquid and their prices more volatile than securities of comparable U.S. companies. In addition, exchange rate movements may have an adverse effect on the value of an investment in a foreign stock and its corresponding dividend payment for U.S. investors. Net dividends to ADR investors are estimated, using withholding tax rates conventions, deemed accurate, but investors are urged to consult their tax advisor for exact dividend computations. Investors who have received the Product from the Firm may be prohibited in certain states or other jurisdictions from purchasing securities mentioned in the Product from the Firm. Please ask your Financial Consultant for additional details. Citigroup Global Markets Inc. takes responsibility for the Product in the United States. Any orders by US investors resulting from the information contained in the Product may be placed only through Citigroup Global Markets Inc. Important Disclosures for Morgan Stanley Smith Barney LLC Customers: Morgan Stanley & Co. LLC (Morgan Stanley) research reports may be available about the companies that are the subject of this Citi Investment Research & Analysis (CIRA) research report. Ask your Financial Advisor or use smithbarney.com to view any available Morgan Stanley research reports in addition to CIRA research reports. Important disclosure regarding the relationship between the companies that are the subject of this CIRA research report and Morgan Stanley Smith Barney LLC and its affiliates are available at the Morgan Stanley Smith Barney disclosure website at www.morganstanleysmithbarney.com/researchdisclosures. For Morgan Stanley and Citigroup Global Markets, Inc. specific disclosures, you may refer to www.morganstanley.com/researchdisclosures and https://www.citivelocity.com/cvr/eppublic/citi_research_disclosures. This CIRA research report has been reviewed and approved on behalf of Morgan Stanley Smith Barney LLC. This review and approval was conducted by the same person who reviewed this research report on behalf of CIRA. This could create a conflict of interest. The Citigroup legal entity that takes responsibility for the production of the Product is the legal entity which the first named author is employed by. The Product is made available in Australia through Citigroup Global Markets Australia Pty Ltd. (ABN 64 003 114 832 and AFSL No. 240992), participant of the ASX Group and regulated by the Australian Securities & Investments Commission. Citigroup Centre, 2 Park Street, Sydney, NSW 2000. The Product is made available in Australia to Private Banking wholesale clients through Citigroup Pty Limited (ABN 88 004 325 080 and AFSL 238098). Citigroup Pty Limited provides all financial product advice to Australian Private Banking wholesale clients through bankers and relationship managers. If there is any doubt about the suitability of investments held in Citigroup Private Bank accounts, investors should contact the Citigroup Private Bank in Australia. Citigroup companies may compensate affiliates and their representatives for providing products and services to clients. The Product is made available in Brazil by Citigroup Global Markets Brasil - CCTVM SA, which is regulated by CVM - Comissão de Valores Mobiliários, BACEN - Brazilian Central Bank, APIMEC - Associação dos Analistas e Profissionais de Investimento do Mercado de Capitais and ANBID - Associação Nacional dos Bancos de Investimento. Av. Paulista, 1111 - 11º andar - CEP. 01311920 - São Paulo - SP. If the Product is being made available in certain provinces of Canada by Citigroup Global Markets (Canada) Inc. ("CGM Canada"), CGM Canada has approved the Product. Citigroup Place, 123 Front Street West, Suite 1100, Toronto, Ontario M5J 2M3. This product is available in Chile through Banchile Corredores de Bolsa S.A., an indirect subsidiary of Citigroup Inc., which is regulated by the Superintendencia de Valores y Seguros. Agustinas 975, piso 2, Santiago, Chile. The Product is made available in France by Citigroup Global Markets Limited, which is authorised and regulated by Financial Services Authority. 1-5 Rue Paul Cézanne, 8ème, Paris, France. The Product is distributed in Germany by Citigroup Global Markets Deutschland AG ("CGMD"), which is regulated by Bundesanstalt fuer Finanzdienstleistungsaufsicht (BaFin). CGMD, Reuterweg 16, 60323 Frankfurt am Main. Research which relates to "securities" (as defined in the Securities and Futures Ordinance (Cap. 571 of the Laws of Hong Kong)) is issued in Hong Kong by, or on behalf of, Citigroup Global Markets Asia Limited which takes full responsibility for its content. Citigroup Global Markets Asia Ltd. is regulated by Hong Kong Securities and Futures Commission. If the Research is made available through Citibank, N.A., Hong Kong Branch, for its clients in Citi Private Bank, it is made available by Citibank N.A., Citibank Tower, Citibank Plaza, 3 Garden Road, Hong Kong. Citibank N.A. is regulated by the Hong Kong Monetary Authority. Please contact your Private Banker in Citibank N.A., Hong Kong, Branch if you have any queries on or any matters arising from or in connection with this document. The Product is made available in India by Citigroup Global Markets India Private Limited, which is regulated by Securities and Exchange Board of India. Bakhtawar, Nariman Point, Mumbai 400-021. The Product is made available in Indonesia through PT Citigroup Securities Indonesia. 5/F, Citibank Tower, Bapindo Plaza, Jl. Jend. Sudirman Kav. 54-55, Jakarta 12190. Neither this Product nor any copy hereof may be distributed in Indonesia or to any Indonesian citizens wherever they are domiciled or to Indonesian residents except in compliance with applicable capital market laws and regulations. This Product is not an offer of securities in Indonesia. The securities referred to in this Product

28
have not been registered with the Capital Market and Financial Institutions Supervisory Agency (BAPEPAM-LK) pursuant to relevant capital market laws and regulations, and may not be offered or sold within the territory of the Republic of Indonesia or to Indonesian citizens through a public offering or in circumstances which constitute an offer within the meaning of the Indonesian capital market laws and regulations. The Product is made available in Israel through Citibank NA, regulated by the Bank of Israel and the Israeli Securities Authority. Citibank, N.A, Platinum Building, 21 Ha'arba'ah St, Tel Aviv, Israel. The Product is made available in Italy by Citigroup Global Markets Limited, which is authorised and regulated by Financial Services Authority. Via dei Mercanti, 12, Milan, 20121, Italy. The Product is made available in Japan by Citigroup Global Markets Japan Inc. ("CGMJ"), which is regulated by Financial Services Agency, Securities and Exchange Surveillance Commission, Japan Securities Dealers Association, Tokyo Stock Exchange and Osaka Securities Exchange. Shin-Marunouchi Building, 1-5-1 Marunouchi, Chiyoda-ku, Tokyo 100-6520 Japan. If the Product was distributed by SMBC Nikko Securities Inc. it is being so distributed under license. In the event that an error is found in an CGMJ research report, a revised version will be posted on the Firm's Citi Velocity website. If you have questions regarding Citi Velocity, please call (81 3) 6270-3019 for help. The Product is made available in Korea by Citigroup Global Markets Korea Securities Ltd., which is regulated by the Financial Services Commission, the Financial Supervisory Service and the Korea Financial Investment Association (KOFIA). Citibank Building, 39 Da-dong, Jung-gu, Seoul 110-180, Korea. KOFIA makes available registration information of research analysts on its website. Please visit the following website if you wish to find KOFIA registration information on research analysts of Citigroup Global Markets Korea Securities Ltd. http://dis.kofia.or.kr/fs/dis2/fundMgr/DISFundMgrAnalystPop.jsp?companyCd2=A03030&pageDiv=02. The Product is made available in Malaysia by Citigroup Global Markets Malaysia Sdn Bhd (Company No. 460819-D) (“CGMM”) to its clients and CGMM takes responsibility for its contents. CGMM is regulated by the Securities Commission of Malaysia. Please contact CGMM at Level 43 Menara Citibank, 165 Jalan Ampang, 50450 Kuala Lumpur, Malaysia in respect of any matters arising from, or in connection with, the Product. The Product is made available in Mexico by Acciones y Valores Banamex, S.A. De C. V., Casa de Bolsa, Integrante del Grupo Financiero Banamex ("Accival") which is a wholly owned subsidiary of Citigroup Inc. and is regulated by Comision Nacional Bancaria y de Valores. Reforma 398, Col. Juarez, 06600 Mexico, D.F. In New Zealand the Product is made available to ‘wholesale clients’ only as defined by s5C(1) of the Financial Advisers Act 2008 (‘FAA’) through Citigroup Global Markets Australia Pty Ltd (ABN 64 003 114 832 and AFSL No. 240992), an overseas financial adviser as defined by the FAA, participant of the ASX Group and regulated by the Australian Securities & Investments Commission. Citigroup Centre, 2 Park Street, Sydney, NSW 2000. The Product is made available in Pakistan by Citibank N.A. Pakistan branch, which is regulated by the State Bank of Pakistan and Securities Exchange Commission, Pakistan. AWT Plaza, 1.1. Chundrigar Road, P.O. Box 4889, Karachi-74200. The Product is made available in the Philippines through Citicorp Financial Services and Insurance Brokerage Philippines, Inc., which is regulated by the Philippines Securities and Exchange Commission. 20th Floor Citibank Square Bldg. The Product is made available in the Philippines through Citibank NA Philippines branch, Citibank Tower, 8741 Paseo De Roxas, Makati City, Manila. Citibank NA Philippines NA is regulated by The Bangko Sentral ng Pilipinas. The Product is made available in Poland by Dom Maklerski Banku Handlowego SA an indirect subsidiary of Citigroup Inc., which is regulated by Komisja Nadzoru Finansowego. Dom Maklerski Banku Handlowego S.A. ul.Senatorska 16, 00-923 Warszawa. The Product is made available in the Russian Federation through ZAO Citibank, which is licensed to carry out banking activities in the Russian Federation in accordance with the general banking license issued by the Central Bank of the Russian Federation and brokerage activities in accordance with the license issued by the Federal Service for Financial Markets. Neither the Product nor any information contained in the Product shall be considered as advertising the securities mentioned in this report within the territory of the Russian Federation or outside the Russian Federation. The Product does not constitute an appraisal within the meaning of the Federal Law of the Russian Federation of 29 July 1998 No. 135-FZ (as amended) On Appraisal Activities in the Russian Federation. 8-10 Gasheka Street, 125047 Moscow. The Product is made available in Singapore through Citigroup Global Markets Singapore Pte. Ltd. (“CGMSPL”), a capital markets services license holder, andregulated by Monetary Authority of Singapore. Please contact CGMSPL at 1 Temasek Avenue, #39-02 Millenia Tower, Singapore 039192, in respect of any matters arising from, or in connection with, the analysis of this document. This report is intended for recipients who are accredited, expert and institutional investors as defined under the Securities and Futures Act (Cap. 289). The Product is made available by The Citigroup Private Bank in Singapore through Citibank, N.A., Singapore Branch, alicensed bank in Singapore that is regulated by Monetary Authority of Singapore. Please contact your Private Banker in Citibank N.A., Singapore Branch if you have any queries on or any matters arising from or in connection with this document. This report is intended for recipients who are accredited, expert and institutional investors as defined under the Securities and Futures Act (Cap. 289). This report is distributed in Singapore by Citibank Singapore Ltd ("CSL") to selected

29
Citigold/Citigold Private Clients. CSL provides no independent research or analysis of the substance or in preparation of this report. Please contact your Citigold//CitigoldPrivate Client Relationship Manager in CSL if you have any queries on or any matters arising from or in connection with this report. This report is intended for recipients who are accredited investors as defined under the Securities and Futures Act (Cap. 289). Citigroup Global Markets (Pty) Ltd. is incorporated in the Republic of South Africa (company registration number 2000/025866/07) and its registered office is at 145 West Street, Sandton, 2196, Saxonwold. Citigroup Global Markets (Pty) Ltd. is regulated by JSE Securities Exchange South Africa, South African Reserve Bank and the Financial Services Board. The investments and services contained herein are not available to private customers in South Africa. The Product is made available in Spain by Citigroup Global Markets Limited, which is authorised and regulated by Financial Services Authority. 29 Jose Ortega Y Gassef, 4th Floor, Madrid, 28006, Spain. The Product is made available in the Republic of China through Citigroup Global Markets Taiwan Securities Company Ltd. ("CGMTS"), 14 and 15F, No. 1, Songzhi Road, Taipei 110, Taiwan and/or through Citibank Securities (Taiwan) CompanyLimited ("CSTL"), 14 and 15F, No. 1, Songzhi Road, Taipei 110, Taiwan, subject to the respective license scope of each entity and the applicable laws and regulations in the Republic of China. CGMTS and CSTL are both regulated by the Securities and Futures Bureau of the Financial Supervisory Commission of Taiwan, the Republic of China. No portion of the Product may be reproduced or quoted in the Republic of China by the press or any third parties [without the written authorization of CGMTS and CSTL]. If the Product covers securities which are not allowed to be offered or traded in the Republic of China, neither the Product nor any information contained in the Product shall be considered as advertising the securities or making recommendation of the securities in the Republic of China. The Product is for informational purposes only and is not intended as an offer or solicitation for the purchase or sale of a security or financial products. Any decision to purchase securities or financial products mentioned in the Product must take into account existing public information on such security or the financial products or any registered prospectus. The Product is made available in Thailand through Citicorp Securities (Thailand) Ltd., which is regulated by the Securities and Exchange Commission of Thailand. 18/F, 22/F and 29/F, 82 North Sathorn Road, Silom, Bangrak, Bangkok 10500, Thailand. The Product is made available in Turkey through Citibank AS which is regulated by Capital Markets Board. Tekfen Tower, Eski Buyukdere Caddesi # 209 Kat 2B, 23294 Levent, Istanbul, Turkey. In the U.A.E, these materials (the "Materials") are communicated by Citigroup Global Markets Limited, DIFC branch ("CGML"), an entity registered in the Dubai International Financial Center ("DIFC") and licensed and regulated by the Dubai Financial Services Authority ("DFSA") to Professional Clients and Market Counterparties only and should not be relied upon or distributed to Retail Clients. A distribution of the different CIRA ratings distribution, in percentage terms for Investments in each sector covered is made available on request. Financial products and/or services to which the Materials relate will only be made available to Professional Clients and Market Counterparties. The Product is made available in United Kingdom by Citigroup Global Markets Limited, which is authorised and regulated by Financial Services Authority. This material may relate to investments or services of a person outside of the UK or to other matters which are not regulated by the FSA and further details as to where this may be the case are available upon request in respect of this material. Citigroup Centre, Canada Square, Canary Wharf, London, E14 5LB. The Product is made available in United Statesby Citigroup Global Markets Inc, which is a member of FINRA and registered with the US Securities and Exchange Commission. 388 Greenwich Street, New York, NY 10013. Unless specified to the contrary, within EU Member States, the Product is made available by Citigroup Global Markets Limited, which is regulated by Financial Services Authority. Pursuant to Comissão de Valores Mobiliários Rule 483, Citi is required to disclose whether a Citi related company or business has a commercial relationship with the subject company. Considering that Citi operates multiple businesses in more than 100 countries around the world, it is likely that Citi has a commercial relationship with the subject company. Many European regulators require that a firm must establish, implement and make available a policy for managing conflicts of interest arising as a result of publication ordistribution of investment research. The policy applicable to CIRA's Products can be found at https://www.citivelocity.com/cvr/eppublic/citi_research_disclosures. Compensation of equity research analysts is determined by equity research management and Citigroup's senior management and is not linked to specific transactions or recommendations. The Product may have been distributed simultaneously, in multiple formats, to the Firm's worldwide institutional and retail customers. The Product is not to be construed as providing investment services in any jurisdiction where the provision of such services would not be permitted.

30
Subject to the nature and contents of the Product, the investments described therein are subject to fluctuations in price and/or value and investors may get back less than originally invested. Certain high-volatility investments can be subject to sudden and large falls in value that could equal or exceed the amount invested. Certain investments contained in the Product may have tax implications for private customers whereby levels and basis of taxation may be subject to change. If in doubt, investors should seek advice from a tax adviser. The Product does not purport to identify the nature of the specific market or other risks associated with a particular transaction. Advice in the Product is general and should not be construed as personal advice given it has been prepared without taking account of the objectives, financial situation or needs of any particular investor. Accordingly, investors should, before acting on the advice, consider the appropriateness of the advice, having regard to their objectives, financial situation and needs. Prior to acquiring any financial product, it is the client's responsibility to obtain the relevant offer document for the product and consider it before making a decision as to whether to purchase the product. With the exception of our product that is made available only to Qualified Institutional Buyers (QIBs), CIRA concurrently disseminates its research via proprietary and non-proprietary electronic distribution platforms. Periodically, individual CIRA analysts may also opt to circulate research posted on such platforms to one or more clients by email. Such email distribution is discretionary and is done only after theresearch has been disseminated via the aforementioned distribution channels. CIRA simultaneously distributes product that is limited to QIBs only through email distribution. The level and types of services provided by CIRA analysts to clients may vary depending on various factors such as the client’s individual preferences as to the frequency and manner of receiving communications from analysts, the client’s risk profile and investment focus and perspective (e.g. market-wide, sector specific, long term, short-term etc.), the size and scope of the overall client relationship with Citi and legal and regulatory constraints. CIRA product may source data from dataCentral. dataCentral is a CIRA proprietary database, which includes Citi estimates, data from company reports and feeds from Reuters and Datastream. © 2012 Citigroup Global Markets Inc. Citi Investment Research & Analysis is a division of Citigroup Global Markets Inc. Citi and Citi with Arc Design are trademarks and service marks of Citigroup Inc. and its affiliates and are used and registered throughout the world. All rights reserved. Any unauthorized use, duplication, redistribution or disclosure of this report (the “Product”), including, but not limited to, redistribution of the Product by electronic mail, posting of the Product on a website or page, and/or providing to a third party a link to the Product, is prohibited by law and will result in prosecution. The information contained in the Product is intended solely for the recipient and may not be further distributed by the recipient to any third party. Where included in this report, MSCI sourced information is the exclusive property of Morgan Stanley Capital International Inc. (MSCI). Without prior written permission of MSCI, this information and any other MSCI intellectual property may not be reproduced, redisseminated or used to create any financial products, including any indices. This information is provided on an "as is" basis. The user assumes the entire risk of any use made of this information. MSCI, its affiliates and any third party involved in, or related to, computing or compiling the information hereby expressly disclaim all warranties of originality, accuracy, completeness, merchantability or fitness for a particular purpose with respect to any of this information. Without limiting any of the foregoing, in no event shall MSCI, any of its affiliates or any third party involved in, or related to, computing or compiling the information have any liability for any damages of any kind. MSCI, Morgan Stanley Capital International and the MSCI indexes are services marks of MSCI and its affiliates. The Firm accepts no liability whatsoever for the actions of third parties. The Product may provide the addresses of, or contain hyperlinks to, websites. Except to the extent to which the Product refers to website material of the Firm, the Firm has not reviewed the linked site. Equally, except to the extent to which the Product refers to website material of the Firm, the Firm takes no responsibility for, and makes no representations or warranties whatsoever as to, the data and information contained therein. Such address or hyperlink (including addresses or hyperlinks to website material of the Firm) is provided solely for your convenience and information and the content of the linked site does not in anyway form part of this document. Accessing such website or following such link through the Product or the website of the Firm shall be at your own risk and the Firm shall have no liability arising out of, or in connection with, any such referenced website. ADDITIONAL INFORMATION IS AVAILABLE UPON REQUEST