Pay less, consume more? The price elasticity of home care ...

Expect More. Pay Less.Target Corporation Annual Report 2006

Financial Highlights – Continuing Operations
’01 ’02 ’03 ’04 ’05
$33
,021
$37
,410
$42,
025
$46,
839
$52
,620
Total Revenues (millions)
2006 Growth %: 13.1%Five-year CAGR: 12.5%
’01 ’02 ’03 ’04 ’05
$2,
246
$2,
811
$3,
159
$3,
601
$4,3
23
Earnings Before Interest Expense and Income Taxes (EBIT) (millions)
2006 Growth %: 17.3%Five-year CAGR: 17.7%
’01 ’02 ’03 ’04 ’05
$1,1
01 $1,3
76
$1,6
19
$1,8
85 $2,
408
Earnings from Continuing Operations (millions)
2006 Growth %: 15.8%Five-year CAGR: 20.4%
’01 ’02 ’03 ’04 ’05
$1.2
1
$1.5
1
$1.7
6
$2.
07
$2.
71
’06
$59
,490
’06
$5,
069
’06
$2,
787
’06
$3.
21
Diluted EPS
2006 Growth %: 18.5%Five-year CAGR: 21.5%
2006 CapitalExpenditures($3.9 billion)
• New Stores• Remodels & Expansions• Information Technology, Distribution & Other
61%12%
27%
2006 Sales Mix($57.9 billion)
• Consumables & Commodities• Electronics, Entertainment, Sporting Goods & Toys• Apparel & Accessories• Home Furnishings & Décor• Other
23%
19%
4%
32%22%

Expect More. Pay Less. It is the magic combination thatconsistently delights our guests and turns a brief shoppinglist into a full shopping cart. It is the excitement of finding greatquality and design at an incredible price, the surprise inviewing our innovative marketing, and the pleasure of shoppingin a clean, bright store. Above all, it is our brand promise—defining the way we serve our guests.

2
Specifically, during the past year:
• We introduced new merchandise initiatives, such as GOInternational, and transformed existing categories, such asBath and Beauty, to surprise and delight our guests withunexpected quality, freshness and affordability;
• We expanded our selection of food in Target generalmerchandise stores and increased our assortment of ownedbrand items, natural and organic products and meal solutionsthroughout the chain to provide greater convenience;
• We continued to build profitable new stores, constructing113 in 36 states, to create more opportunities for our gueststo enjoy a Target brand shopping experience;
• We continued to invest strategically in technology andinfrastructure, including new distribution facilities, enhancedglobal sourcing capabilities, and our growing overseastechnology and business services operation, to support ourdisciplined pace of growth and increase our productivity;
• We remained focused on leveraging the benefits of our highlyintegrated, multichannel strategy, which combines our retailstores, our online business and our credit card operations, to
give our guests more reasons to shop at Target more oftenand spend more on each visit;
• We continued to embrace a workplace that recognizes andrewards team members for their contributions, and continuedto strengthen our partnerships with our communities andour vendors;
• And, we created substantial value for our shareholders bygenerating earnings per share of $3.21, representing anannual increase of 18.5 percent and perpetuating ourconsistent record of profitable growth.
We are proud of our achievements and pleased with ourperformance in the past year, yet as we look forward to 2007and beyond, we know that our continued success depends onour ability to demand more of ourselves. As a result, we arecommitted to continuous improvement — to being faster andmore reliable, being more innovative and efficient, and being morefocused on consistently delivering a shopping experience thatdelights and surprises our guests. We understand the magnitudeof this challenge and believe that we are well positioned tocontinue fulfilling our promise to our guests, our team, ourcommunities and our shareholders for many years to come.
To Our Shareholders,As it has for more than a decade, “Expect More. Pay Less.”continues to define our promise to Target guests and serve asthe cornerstone of our brand. In 2006, it remained a central tenetof our strategy, underscoring our commitment to offer innovativedesign and everyday essentials at exceptional value, sustainingour advantage in a highly competitive environment, and providingthe compass for our continued profitable growth.

3
Delivering a merchandise assortment that is distinctive,exclusive and unexpected in its design and value is a key focusin our effort to connect with our guests and differentiate Targetfrom our competitors. We continue to introduce unique specialtybrands, expand our premium owned and licensed brands, andoffer a carefully edited assortment of trusted national brands.For example, in 2007 we are launching Proenza Schouler as thenext GO International collection in women’s apparel, and basedon our success with Rafe for Target handbags, we are extendingthis concept to women’s accessories. In both Bath and Beautyand in Toys, we continue to develop and refine our assortmentsof exclusive European brands that were introduced at Target in 2006, and in consumer electronics, we are dramaticallyimproving our presentation and selection of nationally brandedflat-panel televisions.
To ensure that we have the right combination of merchandiseto delight our guests, we balance the excitement of our signaturebrands with the convenience of our everyday essentials. Inparticular, we continue to enhance our offerings of food andbasic household commodities and improve our ease of shoppingfor pharmacy and over-the-counter medications through newstore growth, greatly expanded assortments and innovativeproduct introductions. By strengthening our commitment to ourselection, competitive pricing and in-stock reliability in keyreplenishable categories, we position Target as the preferredshopping destination for all our guests’ needs and wants.
We also aim to capture the essence of our “Expect More.Pay Less.” brand promise in every Target and SuperTarget store,in every Target.com transaction and in every financial servicesrelationship. In our stores, we strive to convey the spirit of ourbrand in each store’s design and aesthetics, in our friendlyservice and fast checkout, and even in the fresh look of ournew shopping cart, which we plan to introduce this year. AtTarget.com, our brand is evident in our site’s ease of navigation,broad range of features and services, and our extensiveselection of quality, affordable merchandise. And, within TargetFinancial Services, we reinforce our brand through theconvenience and rewards provided by our REDcard products,and the element of wonder and surprise infused in our widearray of innovative GiftCards.
In short, by continuing to deliver the right balance of fashionand value and by creating an intuitive shopping environmentthat emphasizes convenience and conveys a sense of fun anddiscovery, we provide our guests with the excitement theyexpect and the Target experience they love.
Because of the continuity of our strategy and consistency ofits execution over time, we remain optimistic about our ability tocontinue to grow profitably, while preserving our brand integrityand maintaining our expected financial returns. Specifically, ourgrowth plans envision adding about 100 net new stores in theUnited States annually for the foreseeable future, potentiallydoubling our current store base over the next 15 years.
To achieve this planned pace of growth and support theunique demands of our branded strategy, we strive to attractand retain a diverse team of highly motivated and talentedindividuals. We believe that creating a desirable and rewardingworkplace reinforces our brand, strengthens our organizationand helps Target sustain its advantage in an extremelycompetitive environment. In addition, we continue to embraceand extend our unbroken decades-long record of communitysupport, including both substantial team member volunteerismand financial contributions. Our involvement, which focuses onprograms that inspire education and learning, build safer andhealthier communities, and increase access to the arts, nowtotals more than $3 million each week.
For more than a decade, we have been guided by our brandpromise to our guests — to “Expect More. Pay Less.”— and this approach has produced outstanding results. Over the past10 years, Target has generated a total annualized return toshareholders of nearly 22 percent, well above the S&P 500 andnearly all of our large retail competitors. We are extremely proudof our performance and believe that it underscores the powerof our strategy and its execution. As we look to the future, weremain confident in our direction and believe that Target is wellpositioned to build on our past success and generate profitablemarket share growth for many years to come.
Sincerely,
Bob Ulrich, Chairman and Chief Executive Officer
Board of Directors ChangeDuring the past year, we welcomed Gregg Steinhafel, President of Target, to our board.

EXPECT MORE. PAY LESS.
BrandingThe Target brand is widely recognized and trusted,underscoring our responsibility to consistently deliverthe outstanding shopping experience our guestsexpect. To preserve our brand’s integrity andfreshness, we are committed to delighting our gueststhrough an integrated and innovative approach tomerchandising, presentation, service, store design,marketing and community involvement.

5
Merchandising and SourcingFor more than a decade, our “Expect More. Pay Less.” brandpromise has been the cornerstone of Target’s guest-focusedculture and strategy. In particular, our merchandise assortmentembodies this brand promise by delighting our guests withunexpected quality, design and value. Through our broadselection of competitively priced consumables and commodities,combined with our offering of unique and affordable home andapparel fashion, Target strives to attract more guests withgreater frequency and to give them added reasons to spendmore on each visit.
Exclusive Designs and Fashion InnovationIn our general merchandise assortment, Target offers newness,excitement and affordability to our guests through innovativedesign partnerships, signature national brands and high-qualityowned brands. During 2006, we introduced a number of newmerchandise initiatives to maintain our freshness and relevanceto our guests:
• We launched GO International, a series of limited-editionapparel collections featuring high-fashion internationaldesigners such as Luella Bartley and Behnaz Sarafpour;
• In Home, we rebalanced and remerchandised our assortment,introduced Target Casual and Contemporary Home, andrelaunched the Waverly brand. We also enhanced our in-storepresentation with endcap displays of larger furniture pieces,introduced Room Essentials and upholstered seating, andexpanded our home furnishings assortment on Target.com;
• We significantly reinvented our Bath and Body assortment.Specifically, we added several brands typically found only inU.S. and European specialty stores, and expanded thepresence of other brands, such as Boots, a line of premium-quality cosmetics and skin care products;
• And, in Electronics, we increased our offerings of LCD andother flat-panel TVs, portable audio electronics and high-quality digital cameras and introduced convenient extended-service plans at an exceptional value. We also supported thelaunch of new video gaming systems through our assortmentof hardware, software and gaming accessories.
Each of these initiatives underscores our promise to our guestsand reinforces Target’s “Expect More. Pay Less.” brand.
Expect More. Pay Less.Our unique approach to superior design and exceptional value,combined with the consistent execution of our strategy, helps uscreate the excitement Target guests expect and the shoppingexperience they love.

6
Expanding Appetite for ConvenienceIn addition to Target’s focus on great quality, exceptional valueand unique products to surprise and delight our guests, Targetis also committed to providing our guests with increasedshopping convenience through our growing selection of food.We continue to expand our food assortment in our generalmerchandise stores as well as add new SuperTarget locations.And, through our frequent introductions of new owned-brandproducts, we continue to increase our food penetration andreinforce our promise of quality, freshness and value. During2006, we introduced a number of new premium-quality itemsfrom Archer Farms, including imported pasta and frozen pizza,frozen entrées, all-natural breads, organic coffee and snacks.We expanded our assortment in Market Pantry, including frozenseafood, cheese, Mexican food, bread, cookies and crackers.We also continued to grow our Choxie line of gourmetchocolate, our differentiated Wine Cube and our Sutton &Dodge restaurant-style, choice Angus beef. In addition, to betterserve our guests, we have developed unique solutions for moreconvenient meal preparation such as Sutton & Dodge heat-in-the-bag roasts, and continued to increase our offering of organicand natural foods.
By increasing our selection of fresh, affordable food and mealsolutions, and remaining focused on delivering a pleasant andconvenient in-store experience, we continue to give our guestsmore reasons to make Target their preferred shopping destination.
Design, Development and SourcingBringing our brand to life for our guests requires a coordinatedeffort throughout the company including marketing, merchandising,product design and development, sourcing and our store teams.To ensure that we stock our shelves with trend-right, high-qualityproducts at competitive prices, we have built a strong internalproduct design, development and sourcing infrastructure withadvanced technical design capabilities and strong manufacturingand supply chain partnerships. We continue to invest in TargetSourcing Services to strengthen our global sourcing resourcesand capacity and maintain our position of trend leadership. Byleveraging these capabilities, we are able to increase our speedto market, assert more control over our brand and consistentlyoffer the design and originality that our guests expect.
Target’s focus on innovation extends beyond the productswe sell. In 2005, we launched ClearRx, a new pharmacy bottledesign. More recently, we introduced a newly designed shoppingbasket, and we are also currently testing a complementary designfor a new shopping cart. Each of these items underscores theimportance of great design to Target’s brand and demonstrateshow we continue to infuse innovation and continuous improve-ment into all aspects of our business.
EXPECT MORE. PAY LESS.
Mom & BabyThrough our Mom and Baby world, we offer a broadrange of merchandise designed to meet the needs of expectant and new mothers—and by offering all ofthese assortments in one convenient location, wecontinue to make the shopping experience even easierand faster for these busy guests.
EXPECT MORE. PAY LESS.
Archer Farms
We continue to delight our guests by expanding ourassortment of owned-brand products. Through thisincreased offering, we are able to deliver the excitement,freshness and premium quality our guests have come to expect from Target — all at prices well belowcomparable nationally branded products.

Reinforcing Our BrandThe Target brand is more than the Bullseye and the color red—it’s a symbol of our longstanding commitment to deliver trendleadership, quality merchandise, great service and compellingvalue to our guests and to give back to the communities weserve. We are dedicated to preserving our brand and the trustwe have earned — and continue to seek new and innovativeopportunities to delight our guests by delivering the unexpected.
Innovative MarketingOur bold advertising and distinctive marketing efforts reinforceour “Expect More. Pay Less.” brand philosophy and strengthenTarget’s iconic image and reputation. We strive to be innovativein our communications, to create excitement and to be fresh,fun and trend right in all we do.
Our weekly circular is the foundation of our differentiatedadvertising strategy, and it communicates our balanced messageof design and value to our guests. Each week, it is distributedto more than 50 million households, driving increased traffic to
“When it comes to givingtime, talent and cash, this stylish retailer hits thebull’s-eye. … In an erawhen corporate giving canbe reduced to an exercisein PR, Target’s devotion to donation stands out.” —Newsweek , Ju ly 10, 2006
EXPECT MORE. PAY LESS.
CommunityAs a good corporate citizen, Target works to strengthenfamilies and communities through significant financialsupport and team member volunteerism. We focusour contributions on programs that inspire educationand learning, improve overall safety and well-being,and increase accessibility to art and design.

8
• For the 2006 Winter Olympics, we worked with Trenitalia,the Italian railroad, to create the Target Express. Red-and-white trains, featuring the Target Bullseye logo, transportedpeople throughout the Alps during the winter games.
• We were part of Rolling Stone magazine’s 1,000th edition,which featured a first-of-its-kind back cover ad using lenticular-graphic technology.
These innovative campaigns help solidify Target’s unique brandand reinforce our strategic focus on balancing great merchandisedesign with outstanding value.
Value in the CardsOur “Expect More. Pay Less.” brand promise extends to TargetFinancial Services, where we focus on delivering financialproducts and services that strengthen guest loyalty, drive salesand generate profitable results. Our strategy is thoughtfullyconceived and executed with the discipline, controls andexpertise of a first-class financial services business, while beingfully integrated into our retail operations.
Our Target Visa Credit Card and the Target Credit Card,collectively referred to as our REDcard products, provide ourcredit-worthy guests compelling reasons to visit our stores moreoften and spend more on each visit. Our rewards programs,such as Target Rewards and Target Pharmacy Rewards, provideopportunities for substantial merchandise savings while also driving redemption transactions that are approximately four times greater than our average transaction amount.
our stores and to our Web site. The expanding influence of the Internet — with more than three-quarters of all Americanshaving access today — is reflected in the growing number ofguest visits to our online circular and our other web-basedresources. This important trend, combined with the decline inhome newspaper deliveries, compels us to look for new andinnovative ways to reach our guests. Our marketing programcontinues to incorporate traditional broadcast and print media,as well as new tactics such as the rollout of our in-store networkcalled Channel Red, the delivery of direct mail catalogs to ourbest guests, and the refinement of our Target Mail program toincrease its productivity.
In 2006, we continued to deliver the style, boldness andinnovation that are inherent elements of our marketing strategy— generating buzz and enhancing our brand positioning. For example:
• We launched a nationwide branding effort with the color redby dominating the advertising in train and subway stationsin strategic markets, by introducing the first interactive boardin New York’s Herald Square subway station, and bypartnering with Saturn to sponsor an all-red Internet-basedscavenger hunt, with the top prize being a new SKY roadsterpainted in exclusive Target Red.
• We introduced our third GO International collection, featuringPaul and Joe designed by Sophie Albou, with a pop-upboutique in Los Angeles that attracted celebrity guests andHollywood-style attention.
EXPECT MORE. PAY LESS.
Financial ServicesOur REDcard products are integral to our core retailbusiness and help to strengthen our guest relationships.By offering this convenient payment alternative inconjunction with programs such as Take Charge ofEducation (TCOE) and Target Rewards, we are buildingstronger guest loyalty and delivering meaningful,incremental value to our guests.

9
EXPECT MORE. PAY LESS.
GO InternationalGO International is Target’s bold new approach to delivering great style—and exceptional value—to our guests. Through a series of limited-timepartnerships with renowned fashion designers,Target is consistently delighting our guests with fun,innovative, trend-right apparel and accessories at surprisingly affordable prices.

10
These rewards, combined with our Take Charge of Educationprogram, also build guest loyalty—driving a significant numberof additional store visits. Our GiftCard program also createsaffinity with our guests. By offering a broad, seasonally freshassortment of distinctive GiftCard designs, we reinforce ourbrand and fuel incremental sales and profits. In 2006, we issuedand redeemed more than $1.5 billion in GiftCards.
Virtual BenefitsTarget.com complements our Target in-store experience anddelivers value to our guests through its services, marketing andmerchandising strategies. Given the increasing importance ofthis channel, we remain focused on developing new onlineopportunities and leveraging the synergies between our storesand Target.com. For example, we continue to test new productideas on Target.com and offer extensions of our in-storeassortments. In addition, through our newest online feature—Find it at a Target store — we are giving our guests greatertransparency into each store’s merchandise ownership andmaking it easier for guests to shop from the convenience oftheir homes. As we grow, we remain dedicated to deliveringonline products and services that work seamlessly with ourin-store offerings and to consistently providing our guests witha Target brand shopping experience through our integrated,multichannel approach.
Commitment to Our BrandA recent independent survey confirmed that the Bullseye isrecognized by 97 percent of Americans, but we are not standingstill. Target remains steadfastly focused on strengthening ourbrand and delivering on our “Expect More. Pay Less.” brandpromise. Through our innovative marketing, our fresh, cleanstores, our great guest service and our differentiated merchandise,we are dedicated to providing design and value for our guestsand delivering a Target brand experience on every visit.
Strategic GrowthGuided by our disciplined and strategic approach to site selectionand property development, Target annually invests billions ofdollars in new stores and store support infrastructure. For manyyears, we have added approximately 8 percent to our annualsquare footage, net of closings and relocations, and at ourcurrent size, this pace of growth translates into approximately100 net new stores per year. During 2006, we opened 72 netnew general merchandise stores and 19 new SuperTargetlocations, bringing the total number of stores at year end to1,488. At our current growth rate, we expect our total U.S. storecount to be about 2000 in 2011, and longer term, we believethe potential for profitable U.S. Target stores may be as manyas 3,000 or more. Given this potential for domestic growth, weare not currently pursuing opportunities for internationalexpansion. We remain focused on executing our U.S. strategyto preserve our brand and our financial performance—and weexpect this new store growth, combined with the contribution
EXPECT MORE. PAY LESS.
ElectronicsWe continue to upgrade our consumer electronicsassortment and presentation to feature our guests’preferred styles and brands. To simplify their purchasedecisions, we have carefully edited our in-store offering,developed clearer, more informative signing, andcreated a more extensive, complementary electronicsoffering at Target.com to ensure the right solutions for all of our guests.

11
from our comparable store sales, to continue generating adouble-digit, top-line increase and profitable market share gainsfor the foreseeable future.
Best for Our GuestsTo deliver on our goal to provide Target guests with an out-standing shopping experience on each visit, we work diligentlyto maintain the physical attributes of our stores and preservethe integrity of our brand through new-store construction andremodels of existing stores. In addition, to keep our stores freshand exciting for our guests over time, we introduce a new storedesign every few years that represents an innovative and moreefficient concept for delivering our “Expect More. Pay Less.”brand promise to our guests. We believe that incorporating greatdesign into our stores — making them inviting, easy-to-shop,clean and bright—is as important in sustaining our competitiveadvantage as maintaining the right balance of differentiationand value in our merchandising.
“The challenge for Targetremains pretty much the sameas it’s been throughout the pastdecade: remain competitive onprice while exceeding consumerexpectations on trend-rightexclusive merchandise offerings.… It’s a time-honored balancingact, one that Target seems tohave mastered.” — DSN Reta i l ing Today , December 11, 2006
EXPECT MORE. PAY LESS.
Guest ExperienceOur commitment to please our guests is at the heart of our strategy and inherent in our brandpromise. Through our innovative merchandising; Fast, Fun and Friendly team; in-stock reliability; anddevotion to clean, inviting, convenient stores, wedemonstrate our commitment to superior guest serviceand strive to deliver a consistently outstandingexperience for Target guests.

12
EXPECT MORE. PAY LESS.
C9 by ChampionTo meet our guests’ increasing demand for high-performance activewear, we have broadened ourassortment in both men’s and women’s apparel. In addition, we remain focused on technicalinnovation, superior quality, fashion and affordabilityas we position Target to be a preferred shoppingdestination for this important merchandise category.

13
Supporting Our GrowthTo support Target’s ongoing store growth, we also continue tomake significant investments in our supply chain and technologyinfrastructure. In 2006, we added three distribution centers toour network, resulting in a total of 29 facilities at year end. In2007, we will further strengthen our distribution network withthe opening of two additional distribution centers.
As Target’s food business continues to grow and evolve, wealso plan to expand our internal food distribution capabilities,in addition to maintaining partnerships with key vendors andwholesalers. Target already distributes virtually all dry groceryproducts through our own distribution network, and in thesummer of 2008, we expect to complete construction of a Target-owned, and third-party operated, perishable-food distributioncenter that will serve Target stores in southeastern states.
Continued investment in technology is one way we achieveboth elements of our “Expect More. Pay Less.” brand promise,delivering greater speed, consistency, in-stock reliability andvalue throughout our company. Among many other benefits,these investments enable us to improve the flow and accuracyof information, reduce expense and leverage the resources ofour global work force—including Target Sourcing Services, ourglobal sourcing organization and Target India, our overseastechnology support and business services operation.
We believe that these investments reinforce our brandstrength and position us for continued growth and profitabilityin the future.
Corporate ResponsibilityTarget has a longstanding tradition of giving back to thecommunities we serve. Since 1946, we have given back 5 percentof our income to support education, the arts and social services.Today, our charitable giving totals more than $3 million eachweek. Nationwide, Target team members volunteer millions ofhours annually to more than 7,000 programs that strengthenfamilies and build healthier communities.
Signature programs include:
• Take Charge of Education, a school fund-raising initiative thathas contributed more than $200 million to more than 108,000schools across the country since its inception in 1997.
• Target Field Trips, which fosters learning beyond the classroomby granting 800 educators $1,000 each to cover costs fora field trip related to their curriculum.
• Ready.Sit.Read!, a national initiative that focuses on readingas a foundation for lifelong learning, and includes book festivals,grants for reading programs, and celebrity authors to helpraise awareness of the importance of early childhood reading.
• Sponsorship of more than 1,500 free days annually at majorcultural institutions across the country, such as the BrooklynMuseum of Art, the California African American Museum and The John F. Kennedy Center for Performing Arts inWashington, D.C.
EXPECT MORE. PAY LESS.
SeasonalMerchandisingWe continue to delight our guests by offering freshideas and innovative merchandise for entertaining anddecorating in celebration of major holidays. Target is alsoa preferred destination for strong seasonal assortmentssuch as Valentine’s Day and back-to-school, giving ourguests great products at compelling values.

14
• Target & Blue and Safe City programs, which reduce crimeand create safer communities by strengthening alliancesbetween Target and local law enforcement agencies.
• Target House, which provides long-term housing for familieswhose children are receiving life-saving treatment at St. JudeChildren’s Research Hospital.
Like our commitment to charitable giving, we have adhered todisciplined ethical and financial standards for decades — toguide our business conduct, drive superior performance, andpreserve and enhance our corporate reputation. As we strivefor continued excellence with our guests, team members,communities and shareholders, we remain dedicated to ourfundamental strategic principles and to being effective stewardsof our corporation’s assets over time.
Target is dedicated to providing an inclusive and respectfulworkplace for our team members and a welcoming shoppingenvironment for our guests. Our ability to attract and retain ahigh-caliber, diverse work force with a rich variety of strengths,perspectives and lifestyles is a key factor in our success withour guests. We believe that creating a workplace in which ourteam members feel valued for their unique contributions andperspectives, have opportunities for career growth, and are
judged objectively and rewarded appropriately for theirperformance is essential to the consistent execution of ourstrategy and continued delivery of profitable growth.
As Target continues to grow, we are dedicated to being arespectful environmental steward in managing both our newconstruction and our ongoing operations. We strive to designstores that integrate into the communities we serve and areconsiderate of local environmental conditions. Where appropriate,we employ resource preservation techniques in our stores anddistribution centers to improve energy efficiency, minimize waste,reduce water consumption and incorporate materials withrecycled or reused content. In addition, we are increasinglyfocused on offering our guests a greater selection of productsthat are organic and natural. In 2006, we earned our certificationas an organic produce retailer in recognition of our dedicationto the quality and freshness of this assortment.
Our dedication to the social, environmental and economicwell-being of the global communities in which we do businessis integral to our strategy, our reputation and our performance.As we continue to strive to deliver superior value for our guests,our team members, our communities and our shareholders, we remain firmly committed to these longstanding practicesand ideals.
EXPECT MORE. PAY LESS.
Great StoresEach aspect of our stores balances our commitmentto the Target brand with our strong financial discipline.From the exterior aesthetics and overall store designto the bright interior lighting, innovative graphics andsigning and spacious aisles, each element supportsour objectives to deliver a superior guest experienceand a superior shareholder return.

15
No. of Retail Sq. Ft.Sales per Capita Group Stores (in thousands)
Over $300Minnesota 66 8,997
$201–$300Arizona 41 5,081California 209 26,391Colorado 36 5,265Florida 102 13,532Illinois 79 10,589Iowa 21 2,855Maryland 31 3,935Nebraska 12 1,581Nevada 15 1,863North Dakota 4 554Virginia 42 5,498Group Total 592 77,144
$151–$200Delaware 2 268Georgia 47 6,222Indiana 32 4,207Kansas 18 2,450Massachusetts 26 3,284Michigan 56 6,466Missouri 31 4,068Montana 7 767New Hampshire 8 1,023New Jersey 36 4,666North Carolina 44 5,716Oregon 18 2,166Texas 130 17,392Utah 11 1,679Washington 32 3,714Wisconsin 32 3,731Group Total 530 67,819
No. of Retail Sq. Ft.Sales per Capita Group Stores (in thousands)
$101–$150Alabama 13 1,919Connecticut 14 1,834Idaho 6 664Louisiana 12 1,726New Mexico 9 1,011New York 55 7,323Ohio 56 6,836Oklahoma 11 1,536Pennsylvania 41 5,220Rhode Island 3 378South Carolina 17 2,097South Dakota 4 417Tennessee 26 3,210Group Total 267 34,171
$0–$100Alaska 0 0Arkansas 6 745Hawaii 0 0Kentucky 12 1,383Maine 4 503Mississippi 4 489Vermont 0 0West Virginia 5 626Wyoming 2 187Group Total 33 3,933
Total 1,488 192,064
YEAR-END STORE COUNT AND SQUARE FOOTAGE BY STATE
Sales per capita is defined as sales by state (based on 52 weeks of sales) divided by state population.
2006 Sales Per Capita
16
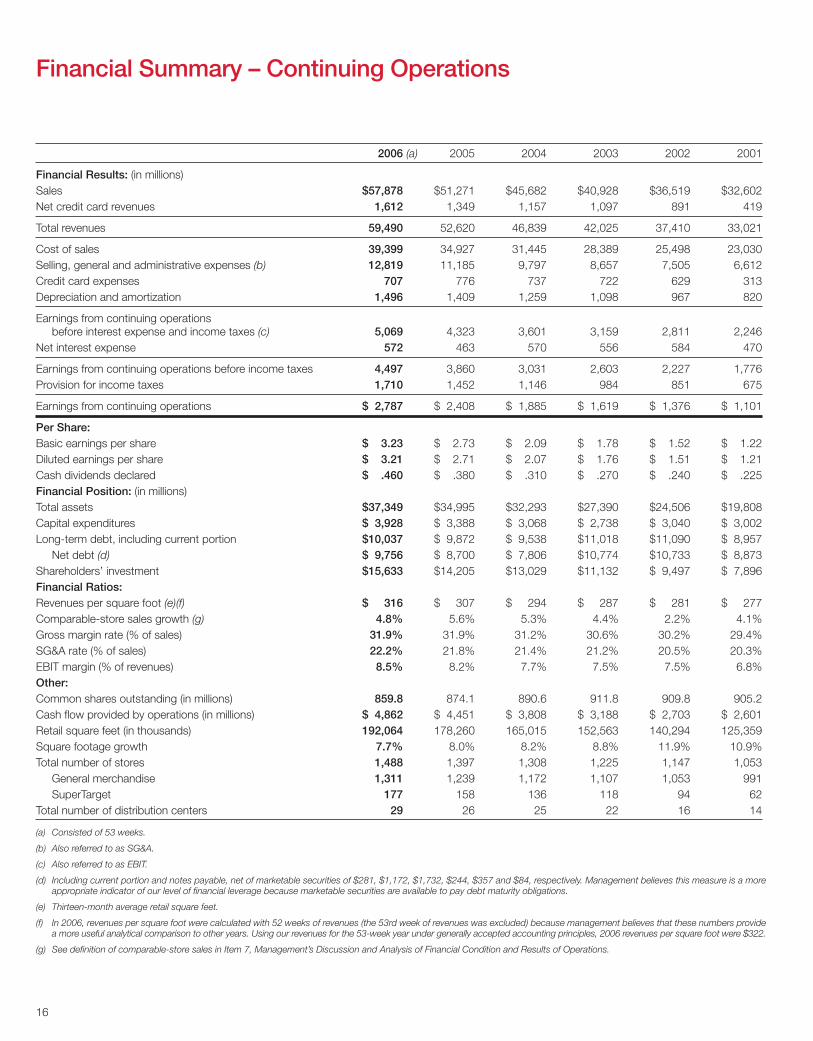
2006 (a) 2005 2004 2003 2002 2001
Financial Results: (in millions)Sales $57,878 $51,271 $45,682 $40,928 $36,519 $32,602Net credit card revenues 1,612 1,349 1,157 1,097 891 419
Total revenues 59,490 52,620 46,839 42,025 37,410 33,021
Cost of sales 39,399 34,927 31,445 28,389 25,498 23,030Selling, general and administrative expenses (b) 12,819 11,185 9,797 8,657 7,505 6,612Credit card expenses 707 776 737 722 629 313Depreciation and amortization 1,496 1,409 1,259 1,098 967 820
Earnings from continuing operations before interest expense and income taxes (c) 5,069 4,323 3,601 3,159 2,811 2,246
Net interest expense 572 463 570 556 584 470
Earnings from continuing operations before income taxes 4,497 3,860 3,031 2,603 2,227 1,776Provision for income taxes 1,710 1,452 1,146 984 851 675
Earnings from continuing operations $ 2,787 $ 2,408 $ 1,885 $ 1,619 $ 1,376 $ 1,101
Per Share:Basic earnings per share $ 3.23 $ 2.73 $ 2.09 $ 1.78 $ 1.52 $ 1.22Diluted earnings per share $ 3.21 $ 2.71 $ 2.07 $ 1.76 $ 1.51 $ 1.21Cash dividends declared $ .460 $ .380 $ .310 $ .270 $ .240 $ .225Financial Position: (in millions)Total assets $37,349 $34,995 $32,293 $27,390 $24,506 $19,808Capital expenditures $ 3,928 $ 3,388 $ 3,068 $ 2,738 $ 3,040 $ 3,002Long-term debt, including current portion $10,037 $ 9,872 $ 9,538 $11,018 $11,090 $ 8,957
Net debt (d) $ 9,756 $ 8,700 $ 7,806 $10,774 $10,733 $ 8,873Shareholders’ investment $15,633 $14,205 $13,029 $11,132 $ 9,497 $ 7,896Financial Ratios:Revenues per square foot (e)(f) $ 316 $ 307 $ 294 $ 287 $ 281 $ 277Comparable-store sales growth (g) 4.8% 5.6% 5.3% 4.4% 2.2% 4.1%Gross margin rate (% of sales) 31.9% 31.9% 31.2% 30.6% 30.2% 29.4%SG&A rate (% of sales) 22.2% 21.8% 21.4% 21.2% 20.5% 20.3%EBIT margin (% of revenues) 8.5% 8.2% 7.7% 7.5% 7.5% 6.8%Other:Common shares outstanding (in millions) 859.8 874.1 890.6 911.8 909.8 905.2Cash flow provided by operations (in millions) $ 4,862 $ 4,451 $ 3,808 $ 3,188 $ 2,703 $ 2,601Retail square feet (in thousands) 192,064 178,260 165,015 152,563 140,294 125,359Square footage growth 7.7% 8.0% 8.2% 8.8% 11.9% 10.9%Total number of stores 1,488 1,397 1,308 1,225 1,147 1,053
General merchandise 1,311 1,239 1,172 1,107 1,053 991SuperTarget 177 158 136 118 94 62
Total number of distribution centers 29 26 25 22 16 14
(a) Consisted of 53 weeks.
(b) Also referred to as SG&A.
(c) Also referred to as EBIT.
(d) Including current portion and notes payable, net of marketable securities of $281, $1,172, $1,732, $244, $357 and $84, respectively. Management believes this measure is a moreappropriate indicator of our level of financial leverage because marketable securities are available to pay debt maturity obligations.
(e) Thirteen-month average retail square feet.
(f) In 2006, revenues per square foot were calculated with 52 weeks of revenues (the 53rd week of revenues was excluded) because management believes that these numbers providea more useful analytical comparison to other years. Using our revenues for the 53-week year under generally accepted accounting principles, 2006 revenues per square foot were $322.
(g) See definition of comparable-store sales in Item 7, Management’s Discussion and Analysis of Financial Condition and Results of Operations.
Financial Summary – Continuing Operations

10MAR200717463587
UNITED STATESSECURITIES AND EXCHANGE COMMISSION
Washington, D.C. 20549
FORM 10-K(Mark One)
� ANNUAL REPORT PURSUANT TO SECTION 13 OR 15(d) OF THE SECURITIES EXCHANGE ACT OF1934
For the fiscal year ended February 3, 2007
OR� TRANSITION REPORT PURSUANT TO SECTION 13 OR 15(d) OF THE SECURITIES EXCHANGE ACT
OF 1934For the transition period from to
Commission file number 1-6049
TARGET CORPORATION(Exact name of registrant as specified in its charter)
Minnesota 41-0215170(State or other jurisdiction of (I.R.S. Employer
incorporation or organization) Identification No.)
1000 Nicollet Mall, Minneapolis, Minnesota 55403(Address of principal executive offices) (Zip Code)
Registrant’s telephone number, including area code: 612/304-6073
Securities registered pursuant to Section 12(b) of the Act:
Title of Each Class Name of Each Exchange on Which Registered
Common Stock, par value $.0833 per share New York Stock ExchangePreferred Share Purchase Rights New York Stock Exchange
Securities registered pursuant to Section 12(g) of the Act: None
Indicate by check mark if the registrant is a well-known seasoned issuer, as defined in Rule 405 of the Securities Act. Yes � No �
Indicate by check mark if the registrant is not required to file reports pursuant to Section 13 or Section 15(d) of the Act. Yes � No �
Note – Checking the box above will not relieve any registrant required to file reports pursuant to Section 13 or 15(d) of the ExchangeAct from their obligations under those Sections.
Indicate by check mark whether the registrant (1) has filed all reports required to be filed by Section 13 or 15(d) of the SecuritiesExchange Act of 1934 during the preceding 12 months (or for such shorter period that the registrant was required to file suchreports), and (2) has been subject to such filing requirements for the past 90 days. Yes � No �
Indicate by check mark if disclosure of delinquent filers pursuant to Item 405 of Regulation S-K (§229.405 of this chapter) is notcontained herein, and will not be contained, to the best of registrant’s knowledge, in definitive proxy or information statementsincorporated by reference in Part III of this Form 10-K or any amendment to this Form 10-K. �
Indicate by check mark whether the registrant is a large accelerated filer, an accelerated filer, or a non-accelerated filer (as definedin Rule 12b-2 of the Act).
Large accelerated filer � Accelerated filer � Non-accelerated filer �
Indicate by check mark whether the registrant is a shell company (as defined in Rule 12b-2 of the Act). Yes � No �
Aggregate market value of the voting stock held by non-affiliates of the registrant on July 29, 2006 was $39,796,702,943.82,based on the closing price of $46.46 per share of Common Stock as reported on the New York Stock Exchange-Composite Index.
Indicate the number of shares outstanding of each of registrant’s classes of Common Stock, as of the latest practicable date. Totalshares of Common Stock, par value $.0833, outstanding at March 14, 2007 were 858,580,232.
DOCUMENTS INCORPORATED BY REFERENCE1. Portions of Target’s Proxy Statement to be filed on or about April 9, 2007 are incorporated into Part III.

(This page has been left blank intentionally.)

TA B L E O F C O N T E N T S
PA R T IItem 1. Business. 4Item 1A. Risk Factors. 6Item 1B. Unresolved Staff Comments. 6Item 2. Properties. 6Item 3. Legal Proceedings. 7Item 4. Submission of Matters to a Vote of Security Holders. 7Item 4A. Executive Officers. 8
PA R T I IItem 5. Market for Registrant’s Common Equity, Related Stockholder Matters and Issuer
Purchases of Equity Securities. 9Item 6. Selected Financial Data. 11Item 7. Management’s Discussion and Analysis of Financial Condition and Results of
Operations. 11Item 7A. Quantitative and Qualitative Disclosures About Market Risk. 21Item 8. Financial Statements and Supplementary Data. 22Item 9. Changes in and Disagreements With Accountants on Accounting and Financial
Disclosure. 48Item 9A. Controls and Procedures. 48Item 9B. Other Information. 48
PA R T I I IItem 10. Directors, Executive Officers and Corporate Governance. 49Item 11. Executive Compensation. 49Item 12. Security Ownership of Certain Beneficial Owners and Management and
Related Stockholder Matters. 49Item 13. Certain Relationships and Related Transactions, and Director Independence. 49Item 14. Principal Accountant Fees and Services. 49
PA R T I VItem 15. Exhibits and Financial Statement Schedules. 50
Signatures 52Schedule II – Valuation and Qualifying Accounts 53Exhibit Index 54Exhibit 12 – Computations of Ratios of Earnings to Fixed Charges for each of the Five Years in thePeriod Ended February 3, 2007 55Shareholder Information 56
3
PA
RT
IP
AR
T II
PA
RT
IIIP
AR
T IV

PA R T I
Item 1. Business.
General
Target Corporation (the Corporation or Target) was incorporated in Minnesota in 1902. We operatelarge-format general merchandise and food discount stores in the United States, which include Target andSuperTarget stores. We offer both everyday essentials and fashionable, differentiated merchandise atexceptional prices. Our ability to deliver a shopping experience that is preferred by our guests is supportedby our strong supply chain and technology network, a devotion to innovation that is ingrained in ourorganization and culture, and our disciplined approach to managing our current business and investing infuture growth. We operate as a single business segment.
Our credit card operations represent an integral component of our core retail business. Through ourbranded proprietary credit card products (REDcard), we strengthen the bond with our guests, driveincremental sales and contribute meaningfully to earnings. We also operate a fully integrated on-linebusiness, Target.com. Although Target.com is small relative to our overall size, its sales are growing at amuch more rapid annual pace than our other sales, and it provides important benefits to our stores andcredit card operations.
We are committed to consistently delighting our guests, providing a workplace that is preferred by ourteam members and investing in the communities where we do business to improve the quality of life. Webelieve that this unwavering focus, combined with disciplined execution of the fundamentals of our strategy,will enable us to continue generating profitable market share growth and delivering superior shareholdervalue for many years to come.
Financial Highlights
Our fiscal year ends on the Saturday nearest January 31. Unless otherwise stated, references to years inthis report relate to fiscal years, rather than to calendar years. Fiscal year 2006 (2006) ended February 3,2007 and consisted of 53 weeks. Fiscal year 2005 (2005) ended January 28, 2006 and fiscal year 2004(2004) ended January 29, 2005, and both consisted of 52 weeks.
For information on key financial highlights for 2006 (along with other years), see the items referencedin Item 6, Selected Financial Data, and Item 7, Management’s Discussion and Analysis of FinancialCondition and Results of Operations, of this Form 10-K.
Seasonality
Due to the seasonal nature of our business, a substantially larger share of total annual revenues andearnings occur in the fourth quarter because it includes the peak sales period from Thanksgiving to the endof December.
Merchandise
We operate Target general merchandise stores with a wide assortment of general merchandise and amore limited assortment of food items, as well as SuperTarget stores with a full line of food and generalmerchandise items. Target.com offers a wide assortment of general merchandise including many itemsfound in our stores and a complementary assortment, such as extended sizes and colors, sold only on-line.A significant portion of our sales is from national brand merchandise. In addition, we sell merchandiseunder private-label brands including, but not limited to, Archer Farms�, Choxie�, Circo�, Embark�,Gilligan & O’Malley�, Kool Toyz�, Market Pantry�, Merona�, ProSpirit�, Room Essentials�, Target LimitedEdition, Trutech� and Xhilaration�. We also sell merchandise through unique programs such as ClearRxSM,Global Bazaar and Go International. In addition, we also sell merchandise under licensed brandsincluding, but not limited to, C9 by Champion, ChefMate, Cherokee, Eddie Bauer, Fieldcrest, Isaac Mizrahifor Target, Kitchen Essentials by Calphalon, Liz Lange for Target, Michael Graves Design, Mossimo, Nickand Nora, Genuine Kids by Osh Kosh, Sean Conway, Smith & Hawken, Simply Shabby Chic, Sonia Kashuk,
4

Thomas O’Brien, Waverly, and Woolrich. We also generate revenue from in-store amenities such as FoodAvenue�, Target ClinicSM, Target PharmacySM, and Target PhotoSM, and from leased or licensed departmentssuch as Optical, Pizza Hut, Portrait Studio and Starbucks.
For 2006 and 2005, percentage of sales by product category were as follows:
Percentage of Sales
Category 2006 2005Consumables and commodities 32% 30%Electronics, entertainment, sporting goods and toys 23 23Apparel and accessories 22 22Home furnishings and decor 19 20Other 4 5Total 100% 100%
Distribution
The vast majority of our merchandise is distributed through a network of 25 regional distributioncenters and four import warehouses. General merchandise is shipped to and from our distribution centersby common carriers. Certain food items are distributed by third parties. Merchandise sold throughTarget.com is either distributed through our own distribution network, through third parties, or shippeddirectly from vendors.
Employees
At February 3, 2007, we employed approximately 352,000 full-time, part-time and seasonalemployees, referred to as ‘‘team members.’’ We consider our team member relations to be good. We offera broad range of company-paid benefits to our team members, including a pension plan, 401(k) plan,medical and dental plans, a retiree medical plan, short-term and long-term disability insurance, paidvacation, tuition reimbursement, various team member assistance programs, life insurance andmerchandise discounts. Eligibility for and the level of these benefits varies depending on team members’full-time or part-time status and/or length of service.
Working Capital
Because of the seasonal nature of our business, our working capital needs are greater in the monthsleading up to our peak sales period from Thanksgiving to the end of December each year. The increase inworking capital during this time is typically financed with cash flow from operations and short-termborrowings. See further description in the Liquidity and Capital Resources section in Item 7, Management’sDiscussion and Analysis of Financial Condition and Results of Operations.
Competition
Our business is conducted under highly-competitive conditions. Our stores compete with national andlocal department, specialty, off-price, discount, supermarket and drug store chains, independent retailstores and Internet businesses that sell similar lines of merchandise. We also compete with other companiesfor new store sites.
We believe the principal methods of competing in this industry include brand recognition, customerservice, store location, differentiated offerings, value, quality, fashion, price, advertising, depth of selectionand credit availability. We believe that we have a competitive advantage with regard to these factors.Additionally, we are a leader in supporting the communities where we do business.
Intellectual Property
Our brand image is a critical element of our business strategy. Our principal trademarks, includingTarget, SuperTarget and our ‘‘bullseye’’ design, have been registered with the U.S. Patent and TrademarkOffice.
5
PA
RT
I

Geographic Information
Substantially all of our revenues are generated in, and long-lived assets are located in, the UnitedStates.
Available Information
Our Annual Report on Form 10-K, quarterly reports on Form 10-Q, current reports on Form 8-K andamendments to those reports filed or furnished pursuant to Section 13(a) or 15(d) of the Exchange Act areavailable free of charge at www.Target.com (click on ‘‘Investors’’ and ‘‘SEC Filings’’) as soon as reasonablypracticable after we file such material with, or furnish it to, the Securities and Exchange Commission (SEC).Our Corporate Governance Guidelines, Business Conduct Guide, Corporate Responsibility Report and theposition descriptions for our Board of Directors and Board committees are also available free of charge inprint upon request or at www.Target.com (click on ‘‘Investors’’ and ‘‘Corporate Governance’’).
Item 1A. Risk Factors.
A description of risk factors and cautionary statements relating to forward-looking information isincluded in Exhibit (99)A to this Form 10-K, which is incorporated herein by reference.
Item 1B. Unresolved Staff Comments.
Not Applicable.
Item 2. Properties.
The following table lists our retail stores as of February 3, 2007:
Retail Sq. Ft. Retail Sq. Ft.State Number of Stores (in thousands) State Number of Stores (in thousands)Alabama 13 1,919 Montana 7 767Alaska — — Nebraska 12 1,581Arizona 41 5,081 Nevada 15 1,863Arkansas 6 745 New Hampshire 8 1,023California 209 26,391 New Jersey 36 4,666Colorado 36 5,265 New Mexico 9 1,011Connecticut 14 1,834 New York 55 7,323Delaware 2 268 North Carolina 44 5,716Florida 102 13,532 North Dakota 4 554Georgia 47 6,222 Ohio 56 6,836Hawaii — — Oklahoma 11 1,536Idaho 6 664 Oregon 18 2,166Illinois 79 10,589 Pennsylvania 41 5,220Indiana 32 4,207 Rhode Island 3 378Iowa 21 2,855 South Carolina 17 2,097Kansas 18 2,450 South Dakota 4 417Kentucky 12 1,383 Tennessee 26 3,210Louisiana 12 1,726 Texas 130 17,392Maine 4 503 Utah 11 1,679Maryland 31 3,935 Vermont — —Massachusetts 26 3,284 Virginia 42 5,498Michigan 56 6,466 Washington 32 3,714Minnesota 66 8,997 West Virginia 5 626Mississippi 4 489 Wisconsin 32 3,731Missouri 31 4,068 Wyoming 2 187
Total 1,488 192,064
6

The following table summarizes the number of owned or leased stores and distribution centers atFebruary 3, 2007:
DistributionStores Centers
Owned 1,260 25Leased 71 1Combined (a) 157 3Total 1,488 29 (b)
(a) Properties within the ‘‘combined’’ category are primarily owned buildings on leased land.(b) The 29 distribution centers have a total of 41,460 thousand square feet.
We own our corporate headquarters buildings located in Minneapolis, Minnesota, and we lease andown additional office space elsewhere in the United States. Our international merchandise sourcingoperations headquartered in New York, New York, have 39 office locations in 27 countries, all of which areleased. We also lease office space in Bangalore, India, where we operate various support functions.
For additional information on our properties see also: Capital Expenditures section in Item 7,Management’s Discussion and Analysis of Financial Condition and Results of Operations; Note 13 andNote 22 of the Notes to Consolidated Financial Statements in Item 8, Financial Statements andSupplementary Data.
Item 3. Legal Proceedings.
SEC Rule S-K Item 103 requires that companies disclose environmental legal proceedings involving agovernmental authority when such proceedings involve potential monetary sanctions of $100,000 or more.We are a party to two administrative actions by governmental authorities involving environmental matters,each of which may involve potential monetary sanctions in excess of $100,000. The allegations, both madeby the California Environmental Protection Agency Air Resources Board, each involve a non-food productwe formerly sold that contained levels of a volatile organic compound in excess of permissible levels. Thefirst allegation was made in March 2006, and we expect the sanctions for this matter will not exceed$200,000. The second allegation was made in April 2006, and we expect the sanctions for this matter willnot exceed $500,000, for which the vendor is indemnifying Target. We previously reported an allegationmade by the United States Environmental Protection Agency in September 2005 that a product we formerlysold contained a prohibited substance. This matter was settled in January 2007 with a payment of$120,000. For description of other legal proceedings see Note 18.
The American Jobs Creation Act of 2004 requires SEC registrants to disclose if they have been requiredto pay certain penalties for failing to disclose to the Internal Revenue Service their participation in listedtransactions. We have not been required to pay any of the penalties set forth in Section 6707A(e)(2) of theInternal Revenue Code.
Item 4. Submission of Matters to a Vote of Security Holders.
Not Applicable.
7
PA
RT
I

Item 4A. Executive Officers.
The executive officers of Target as of March 14, 2007 and their positions and ages, are as follows:
Name Title Age
Timothy R. Baer Executive Vice President, General Counsel and Corporate Secretary 46Michael R. Francis Executive Vice President, Marketing 44John D. Griffith Executive Vice President, Property Development 45Jodeen A. Kozlak Executive Vice President, Human Resources 43Troy H. Risch Executive Vice President, Stores 39Janet M. Schalk Executive Vice President and Chief Information Officer 48Douglas A. Scovanner Executive Vice President and Chief Financial Officer 51Terrence J. Scully President, Target Financial Services 54Gregg W. Steinhafel President and Director 52Robert J. Ulrich Chairman of the Board, Chief Executive Officer, Chairman of the
Executive Committee and Director 63
Each officer is elected by and serves at the pleasure of the Board of Directors. There is neither a familyrelationship between any of the officers named and any other executive officer or member of the Board ofDirectors, nor is there any arrangement or understanding pursuant to which any person was selected as anofficer. The period of service of each officer in the positions listed and other business experience for the pastfive years is listed below.
Timothy R. Baer Executive Vice President, General Counsel and Corporate Secretary sinceMarch 2007. Senior Vice President, General Counsel and Corporate Secretaryfrom June 2004 to March 2007. Senior Vice President from April 2004 toMay 2004. Vice President from February 2002 to March 2004.
Michael R. Francis Executive Vice President, Marketing since February 2003. Senior Vice President,Marketing from January 2001 to February 2003.
John D. Griffith Executive Vice President, Property Development since February 2005. SeniorVice President, Property Development from February 2000 to January 2005.
Jodeen A. Kozlak Executive Vice President, Human Resources since March 2007. Senior VicePresident, Human Resources from February 2006 to March 2007. VicePresident, Human Resources and Employee Relations General Counsel fromNovember 2005 to February 2006. From June 2001 to November 2005Ms. Kozlak held several positions in Employee Relations at Target.
Troy H. Risch Executive Vice President, Stores since September 2006. Group Vice Presidentfrom September 2005 to September 2006. Group Director fromFebruary 2002 to September 2005.
Janet M. Schalk Executive Vice President and Chief Information Officer since March 2007.Senior Vice President and Chief Information Officer from September 2005 toMarch 2007. Vice President, Application Development from November 2004to September 2005. Director, Target Technology Services from July 1997 toNovember 2004.
Douglas A. Scovanner Executive Vice President and Chief Financial Officer since February 2000.
Terrence J. Scully President, Target Financial Services since March 2003. Vice President, TargetFinancial Services, from April 1998 to February 2003.
Gregg W. Steinhafel Director since January 2007. President since August 1999.
Robert J. Ulrich Chairman of the Board, Chief Executive Officer, Chairman of the ExecutiveCommittee and Director of Target since 1994.
8

PA R T I I
Item 5. Market for the Registrant’s Common Equity, Related Stockholder Matters andIssuer Purchases of Equity Securities.
Our common stock is listed on The New York Stock Exchange under the symbol ‘‘TGT.’’ We areauthorized to issue up to 6,000,000,000 shares of common stock, par value $.0833, and up to 5,000,000shares of preferred stock, par value $.01. At March 14, 2007, there were 18,139 shareholders of record.Dividends declared per share and the high and low closing common stock price for each fiscal quarterduring 2006 and 2005 are disclosed in Note 29.
The following table presents information with respect to purchases of Target common stock madeduring the fourteen weeks ended February 3, 2007, by Target or any ‘‘affiliated purchaser’’ of Target, asdefined in Rule 10b-18(a)(3) under the Exchange Act.
ApproximateTotal Number of Dollar Value of
Shares Purchased Shares that MayTotal Number Average as Part of Yet Be Purchased
of Shares Price Paid Publicly Announced Under thePeriod Purchased(b)(c) per Share(b) Program(a)(b)(c) Program(a)October 29, 2006 through November 25,
2006 140,000 $41.75 70,813,275 $1,562,564,371November 26, 2006 through December 30,
2006 — — 70,813,275 1,562,564,371December 31, 2006 through February 3,
2007 231,569 53.02 71,044,844 1,550,285,850Total 371,569 $48.77 71,044,844 $1,550,285,850
(a) In June 2004, our Board of Directors authorized the repurchase of $3 billion of our common stock. In November 2005, our Board increasedthe aggregate authorization by $2 billion, for a total authorization of $5 billion. We expect to continue to execute this share repurchaseprogram primarily in open market transactions, subject to market conditions. We expect to complete the total program by fiscal year-end 2008or sooner. Since the inception of this share repurchase program, we have repurchased a total of 71.0 million shares of our common stock for atotal cash investment of $3,450 million ($48.56 per share).
(b) In addition to shares purchased under our share repurchase program, we acquire shares of common stock held by team members who wish totender owned shares to satisfy the exercise price on stock option exercises or tax withholding on equity awards as part of our long-termincentive plans. From October 29, 2006 through February 3, 2007, 1,683 shares were acquired at an average price of $59.41 pursuant toour long-term incentive plans.
(c) Includes shares reacquired upon settlement of prepaid forward contracts. In 2006, 1.6 million shares were reacquired through these contracts.The details of our long positions in prepaid forward contracts is provided in Note 27.
9
PA
RT
II

10MAR200717430724
Comparision of Cumulative Five Year Total Return
50
100
150 Peer GroupS&P 500 IndexTarget
2002 2003 2004 2005 2006 2007
Do
llars
($)
Fiscal Years Ended
February 2, February 1, January 31, January 29, January 28, February 3,2002 2003 2004 2005 2006 2007
Target $100.00 $65.49 $ 88.76 $119.49 $129.74 $148.22S&P 500 Index $100.00 $77.54 $104.34 $110.84 $122.35 $141.09Peer Group $100.00 $73.98 $ 97.26 $105.61 $108.82 $123.01
The graph above compares the cumulative total shareholder return on our common stock for the lastfive fiscal years with the cumulative total return on the S&P 500 Index and a peer group consisting of thecompanies comprising the S&P 500 Retailing Index and the S&P 500 Food and Staples Retailing Index (PeerGroup) over the same period. The Peer Group index consists of 38 general merchandise, food and drugretailers and is weighted by the market capitalization of each component company. The graph assumes theinvestment of $100 in Target common stock, the S&P 500 Index and the Peer Group on February 2, 2002and reinvestment of all dividends.
10

Item 6. Selected Financial Data.
2006(a) 2005 2004 2003 2002 2001Financial Results: (in millions)Total revenues $59,490 $52,620 $46,839 $42,025 $37,410 $33,021Earnings from continuing operations $ 2,787 $ 2,408 $ 1,885 $ 1,619 $ 1,376 $ 1,101
Per Share:Basic earnings per share $ 3.23 $ 2.73 $ 2.09 $ 1.78 $ 1.52 $ 1.22Diluted earnings per share $ 3.21 $ 2.71 $ 2.07 $ 1.76 $ 1.51 $ 1.21Cash dividends declared $ .460 $ .380 $ .310 $ .270 $ .240 $ .225
Financial Position: (in millions)Total assets $37,349 $34,995 $32,293 $27,390 $24,506 $19,808Long-term debt, including current portion $10,037 $ 9,872 $ 9,538 $11,018 $11,090 $ 8,957
(a) Consisted of 53 weeks.
Item 7. Management’s Discussion and Analysis of Financial Condition and Results ofOperations.
Executive Summary
Fiscal 2006, a 53 week period, was a year of substantial sales and earnings growth for Target.Earnings from continuing operations increased 15.8 percent to $2,787 million, and on this same basis,diluted earnings per share rose 18.5 percent to $3.21. Sales increased 12.9 percent, includingcomparable-store sales (as defined below) growth of 4.8 percent. The combination of strong performancein both our retail and credit card operations produced earnings from continuing operations before interestexpense and income taxes of $5,069 million, an increase of more than 17 percent from 2005.
Net cash provided by operating activities was $4,862 million for 2006. During 2006 we repurchased19.5 million shares of our common stock under our share repurchase program for a total investment of$977 million and paid dividends of $380 million. In addition, we opened 91 net new stores in 2006.
Management’s Discussion and Analysis is based on our Consolidated Financial Statements in Item 8,Financial Statements and Supplementary Data.
Analysis of Continuing Operations
Revenues and Comparable-Store Sales
Sales include merchandise sales, net of expected returns, from our stores and our on-line business, aswell as gift card breakage. Refer to Note 2 for a definition of gift card breakage. Total revenues include salesand net credit card revenues. Total revenues do not include sales tax as we consider ourselves apass-through conduit for collecting and remitting sales taxes. Comparable-store sales are sales fromgeneral merchandise and SuperTarget stores open longer than one year, including:
• sales from stores that have been remodeled or expanded while remaining open• sales from stores that have been relocated to new buildings of the same format within the same trade
area, in which the new store opens at about the same time as the old store closesComparable-store sales do not include:
• sales from our on-line business• sales from general merchandise stores that have been converted, or relocated within the same trade
area, to a SuperTarget store format• sales from stores that were intentionally closed to be remodeled, expanded or reconstructed
11
PA
RT
II

Comparable-store sales increases or decreases are calculated by comparing sales in current year periods tocomparable, prior fiscal-year periods of equivalent length. The method of calculating comparable-storesales varies across the retail industry.
Revenue Growth2006 2005 2004
Comparable-store sales 4.8% 5.6% 5.3%Sales 12.9%(a) 12.2% 11.6%Net credit card revenues 19.5%(a) 16.5% 5.5%Total revenues 13.1%(a) 12.3% 11.5%
(a) Consisted of 53 weeks.
In 2006, total revenues were $59,490 million compared to $52,620 in 2005, an increase of13.1 percent. Total revenue growth was attributable to the opening of new stores, a comparable-store salesincrease of 4.8 percent, the addition of the 53rd week and the 19.5 percent increase in net credit cardrevenues.
Comparable-store sales growth in 2006 and 2005 was attributable to growth in average transactionamount and the number of transactions in comparable stores. In each of the past several years, ourcomparable-store sales growth has experienced a modest negative impact due to the transfer of sales tonew stores. In 2006, there was a deflationary impact of approximately 1 percent on sales growth comparedto essentially no impact of inflation/deflation in 2005 and a deflationary impact of approximately 1 percentin 2004. In 2007, a 52-week year following a 53-week year, we expect to generate a high single-digitpercent increase in revenues, reflecting contribution from new store expansion, continued growth incomparable-store sales due to increases in average transaction amount and the number of transactions incomparable stores and growth in net credit card revenues. We do not expect inflation/deflation to have asignificant effect on sales growth in 2007.
Subsequent to year end, we changed our definition of comparable-store sales to include sales from ouron-line business because we believe this combined measure represents a more useful disclosure in light ofour fully-integrated, multi-channel approach to our business.
Gross Margin Rate
Gross margin rate represents gross margin (sales less cost of sales) as a percentage of sales. SeeNote 3 for a description of expenses included in cost of sales.
In 2006, our consolidated gross margin rate was 31.9 percent compared to 31.9 percent in 2005.Within our gross margin rate for the year, we experienced an increase in markup, which was offset by anincrease in markdowns. Markup is the difference between an item’s cost and its retail price (expressed as apercentage of its retail price). Factors that affect markup include vendor offerings and negotiations, vendorincome, sourcing strategies, market forces like the cost of raw materials and freight, and competitiveinfluences. Markdowns are the reduction in the original or previous price of retail merchandise. Factors thataffect markdowns include inventory management and competitive influences. The definition and method ofcalculating markup, markdowns and gross margin varies across the retail industry.
In 2005, our consolidated gross margin rate was 31.9 percent compared to 31.2 percent in 2004.This change in gross margin rate primarily reflected an improvement in markup, including an increase indirect import penetration, as well as favorable inventory shrink performance.
We expect our consolidated gross margin rate in 2007 to be approximately equal to our 2006 grossmargin rate. The factors affecting our outlook include: our introduction of new merchandising strategies,our growth in direct imports and our ability to leverage our increasing scale, offset by the more rapid pace ofgrowth of lower margin categories like consumables and commodities.
Selling, General and Administrative Expense Rate
Our selling, general and administrative (SG&A) expense rate represents SG&A expenses as apercentage of sales. See Note 3 for a description of expenses included in SG&A expenses. SG&A expenses
12

exclude depreciation and amortization, and SG&A expenses also exclude expenses associated with ourcredit card operations, which are reflected separately in our Consolidated Statements of Operations.
In 2006, our SG&A expense rate was 22.2 percent compared to 21.8 percent in 2005. This increasewas primarily due to higher store payroll costs, the year-over-year impact of reduced transition servicesincome related to our 2004 divestiture of Mervyn’s and the $27 million Visa/MasterCard settlement thatreduced SG&A expense in 2005.
In 2005, our consolidated SG&A expense rate was 21.8 percent compared to 21.4 percent in 2004.The expense rate increase was due to several factors including the year-over-year impact of reducedtransition services income related to our 2004 divestitures of Marshall Field’s and Mervyn’s, higher utilitiesexpense and the effects of stronger year-over-year performance on incentive and share-basedcompensation expense. Some of the expense rate increase was also attributable to growth in marketingexpenses for which the corresponding vendor income is recorded as a reduction of inventory costs becauseit did not meet the criteria required for recording it as an element of SG&A expenses. The combination of allunfavorable expense items more than offset the year-over-year favorability from the $65 million leaseaccounting adjustment during 2004.
In 2007, we expect our SG&A expense rate to be approximately equal to our 2006 rate.
Credit Card Contribution
We offer credit to qualified guests through our REDcard products, the Target Visa and the Target Card.Our credit card program strategically supports our core retail operations and remains an importantcontributor to our overall profitability. Our credit card revenues are comprised of finance charges, late feesand other revenues. In addition, we receive fees from merchants who accept the Target Visa credit card. In2006, our net credit card revenues primarily increased due to an 11.1 percent increase in averagereceivables.
Our credit card operations are allocated a portion of consolidated interest expense based onestimated funding costs for average net accounts receivable and other financial services assets. Ourallocation methodology assumes that 90 percent of the sum of average net receivables and other financialservices assets are debt-financed with a mix of fixed rate and variable rate debt in proportion to the mix offixed and variable rate financial services assets. Beginning in 2005, the majority of our credit card portfoliobegan to earn interest at variable rates; thus, the majority of the interest allocation to the credit card businessin 2006 and 2005 is at rates that are determined based upon our approximate marginal variable rate costof borrowed funds.
Credit card expenses include a bad debt provision, as well as operations and marketing expensessupporting our credit card portfolio. In 2006 versus 2005, our bad debt provision decreased relative to ouraverage receivables balance due to the favorable write-off experience and continued strength of the overallcredit quality of the portfolio. Our 2006 year-end reserve balance as a percentage of average receivablesincreased as we reserved for the expected increase in future write-offs. Our delinquency rates increased inthe last quarter of 2006 as compared to 2005 as we cycled the effects of the October 2005 federalbankruptcy legislation and experience the effects of the mandated increases in minimum payments forcertain guests. Operations and marketing expenses increased primarily due to the growth of the Target Visaportfolio.
In 2005 versus 2004, our bad debt provision grew at a slower pace than our average receivablesbalance due to the aging of the portfolio and the favorable macro-economic credit card environment.However, our total reserve balance as a percentage of average receivables increased in 2005 as wereserved for the expected effects of the mandated increases in minimum payments for certain guests. Ournet write-offs as a percentage of average receivables and our delinquency rates continued to improve,despite a significant increase in bankruptcy filings in advance of the October 2005 effective date of therelated federal bankruptcy legislation. Operations and marketing expenses increased primarily due to thegrowth of the Target Visa portfolio.
In 2006, our credit card operations’ contribution to earnings from continuing operations beforeincome taxes (EBT) was $693 million, a 53.3 percent increase from 2005. The favorability in credit card
13
PA
RT
II

contribution was attributable to strong growth in net interest income and the year-over-year reduction in baddebt expense.
In 2005, our credit card operations’ contribution to EBT was $452 million, a 77.4 percent increasefrom 2004. The favorability in credit card contribution was attributable to strong growth in net interestincome. Average receivables rose 12.5 percent from 2004, which was approximately equal to our salesgrowth.
We expect our 2007 credit card receivables to increase in line with 2007 sales growth, and we expectour overall credit card performance to remain strong. In 2007, our delinquency rate is expected to remainstable in the range of our recent experience, approximately 3.5 percent to 4.0 percent of averagereceivables, and we expect our net write-off experience to be closer to our 2004 and 2005 rates than our2006 rate.
Credit Card Contribution to EBT(millions) 2006 2005 2004RevenuesFinance charges $1,117 $ 915 $ 772Interest expense (286) (193) (230)Net interest income 831 722 542Late fees and other revenues 356 310 287Merchant fees
Intracompany 74 72 65Third-party 139 124 98
Non-interest income 569 506 450ExpensesBad debt 380 466 451Operations and marketing 327 310 286Total expenses 707 776 737Credit card contribution to EBT $ 693 $ 452 $ 255As a percentage of average receivables 11.0% 8.2% 5.2%Net interest margin (a) 13.2% 13.0% 11.0%
(a) Net interest income divided by average accounts receivable.
Receivables(millions) 2006 2005 2004Year-end receivables $6,711 $6,117 $5,456Average receivables $6,161 $5,544 $4,927Accounts with three or more payments past due as a percentage of year-end
receivables 3.5% 2.8% 3.5%
Allowance for Doubtful Accounts(millions) 2006 2005 2004Allowance at beginning of year $ 451 $ 387 $ 352Bad debt provision 380 466 451Net write-offs (314) (402) (416)Allowance at end of year $ 517 $ 451 $ 387As a percentage of year-end receivables 7.7% 7.4% 7.1%Net write-offs as a percentage of average receivables 5.1% 7.2% 8.4%
We offer new account discounts and rewards programs on our REDcard products. These discounts andrewards are redeemable only on purchases made at Target. The discounts associated with our REDcardproducts are included as reductions in sales in our Consolidated Statements of Operations and were$104 million, $97 million and $80 million in 2006, 2005 and 2004, respectively.
14

Depreciation and Amortization
During 2006, we adjusted the period over which we amortize leasehold acquisition costs to match theexpected terms for individual leases, resulting in a cumulative benefit to depreciation and amortizationexpense of approximately $28 million. This change reduced depreciation and amortization expense during2006, when depreciation and amortization expense totaled $1,496 million, compared to $1,409 million in2005, an increase of 6.1 percent. In 2005, depreciation and amortization expense increased 11.9 percent,in line with our sales growth for the year, to $1,409 million. We expect 2007 depreciation and amortizationexpense to be approximately $1.7 billion.
Net Interest Expense
In 2006, net interest expense was $572 million compared to $463 million in 2005, an increase of23.4 percent. This increase related primarily to growth in the cost of funding our credit card operations andwas also unfavorably impacted by the 53rd week in the current fiscal year. The average portfolio interest ratewas 6.2 percent in 2006 and 5.9 percent in 2005.
In 2005, net interest expense was $463 million, compared to $570 million in 2004. This decrease wasprimarily due to a significantly smaller loss on debt repurchase in 2005 (less than $1 million in 2005compared to $89 million in 2004). The decrease in 2005 net interest expense also reflected the benefit oflower average net debt in the first half of the year due to the application of proceeds from the mid-2004Marshall Field’s and Mervyn’s sale transactions. This benefit was partially offset by higher average net debtbalances in the second half of the year and a higher annual average portfolio interest rate. For the full year,the average portfolio interest rate was 5.9 percent in 2005 and 5.5 percent in 2004.
Our 2007 net interest expense is expected to increase due to modestly higher average net debt. Topreserve our net interest margin on our receivables, we intend to maintain a sufficient level of floating-ratedebt to generate parallel changes in net interest expense and finance charge revenue.
Provision for Income Taxes
Our effective income tax rate from continuing operations was 38.0 percent in 2006, 37.6 percent in2005 and 37.8 percent in 2004. Our lower 2005 effective rate was due to the favorable resolution ofvarious tax matters in 2005. We expect our effective income tax rate in 2007 to rise modestly from 2006.
Analysis of Financial Condition
Liquidity and Capital Resources
Our financial condition remains strong. In assessing our financial condition, we consider factors suchas cash flow provided by operations, capital expenditures and debt service obligations. Cash flow providedby operations was $4,862 million in 2006 compared to $4,451 million in 2005, primarily due to higherearnings from continuing operations.
We continue to fund our growth and execute our share repurchase program through a combination ofinternally-generated funds and debt financing.
Our year-end gross receivables were $6,711 million compared to $6,117 million in 2005, anincrease of 9.7 percent. This growth was driven by increased issuance and usage of the Target Visa creditcard by our guests during 2006. Average receivables in 2006 increased 11.1 percent. In 2007 we expectour credit card receivables to grow in line with our 2007 sales.
Year-end inventory levels increased $416 million, or 7.1 percent, reflecting the natural increaserequired to support additional square footage and comparable-store sales growth. This growth was largelyfunded by an increase in accounts payable over the same period.
In June 2004, our Board of Directors authorized the repurchase of $3 billion of our common stock. InNovember 2005, our Board increased the aggregate authorization by $2 billion for a total authorization of$5 billion. In 2006, we repurchased 19.5 million shares of our common stock for a total investment of$977 million ($50.16 per share), primarily through open market transactions. Since the inception of this
15
PA
RT
II

share repurchase program, we have repurchased a total of 71.0 million shares of our common stock for atotal investment of $3,450 million ($48.56 per share). Of the shares reacquired in 2006, a portion wasdelivered upon settlement of prepaid forward contracts. The details of prepaid forward contract settlementsand our long positions in prepaid forward contracts have been provided in Note 25 and Note 27. In 2005we reacquired 23.1 million shares for a total investment of $1,197 million ($51.88 per share). We expect tocontinue to execute our share repurchase program primarily in open market transactions, subject to marketconditions, and to complete the total program by year-end 2008 or sooner.
Our financing strategy is to ensure liquidity and access to capital markets, to manage our net exposureto floating interest rate volatility and to maintain a balanced spectrum of debt maturities. Within theseparameters, we seek to minimize our cost of borrowing.
In 2006 we declared dividends of $.46 per share totaling approximately $396 million, an increase of18.6 percent over 2005. In 2005 we declared dividends of $.38 per share totaling approximately$334 million, an increase of 19.3 percent over 2004. We have paid dividends every quarter since our firstdividend was declared following our 1967 initial public offering, and it is our intent to continue to do so inthe future.
Management believes that cash flows from operations, together with current levels of cash and cashequivalents, proceeds from long-term financing activities and issuance of short-term debt will be sufficient in2007 to fund planned capital expenditures, share repurchases, growth in receivables, maturities oflong-term debt, and other cash requirements, including our seasonal inventory buildup.
Maintaining strong investment-grade debt ratings is a key part of our strategy. Our debt ratings as ofFebruary 3, 2007 were:
Debt RatingsStandard and
Moody’s Poor’s FitchLong-term debt A1 A+ A+Commercial paper P-1 A-1 F1Securitized receivables Aaa AAA n/a
As described in Note 19, during 2006 we issued $750 million of long-term debt and issued$500 million of Variable Funding Certificates backed by credit card receivables through the Target CreditCard Master Trust. As of February 3, 2007, $100 million of the Variable Funding Certificates wereoutstanding. Further liquidity is provided by a committed $1.6 billion unsecured revolving credit facilityobtained through a group of banks in June 2005, which is scheduled to expire in June 2010. No balanceswere outstanding at any time during 2006 or 2005 under this or previously existing revolving credit facilities.Most of our long-term debt obligations contain covenants related to secured debt levels. In addition, ourcredit facility contains a debt leverage covenant. We are, and expect to remain, in compliance with thesecovenants. At February 3, 2007, no notes or debentures contained provisions requiring acceleration ofpayment upon a debt rating downgrade.
Our interest coverage ratio represents the ratio of pre-tax earnings before fixed charges (interestexpense and the interest portion of rent expense) to fixed charges. Our interest coverage ratio calculated asprescribed by Securities and Exchange Commission (SEC) rules was 7.1x, 7.2x, and 5.4x in 2006, 2005and 2004, respectively. The ratio in 2004 was adversely affected by losses from discretionary debtrepurchase transactions and excludes historical income from discontinued operations. Managementbelieves adjustments for these items are necessary to make the coverage ratio a more useful and consistentindicator of creditworthiness.
Capital Expenditures
Capital expenditures were $3,928 million in 2006 compared to $3,388 million in 2005 and$3,068 million in 2004. This increase was primarily attributable to continued new store expansion, anincrease in remodel program expenditures and growth in distribution center capital investment. Netproperty and equipment increased $2,393 in 2006 following an increase of $2,178 million in 2005.
16

Spending for new stores, store expansions and remodels, and information systems hardware andsoftware, distribution capacity and other infrastructure to support store growth as a percentage of totalcapital expenditures are shown below for each of the last three fiscal years.
Capital ExpendituresPercentage of Capital Expenditures
2006 2005 2004New stores 61% 60% 64%Remodels and expansions 12 12 12Information technology, distribution and other 27 28 24Total 100% 100% 100%
In 2007, we expect to invest $4.2 billion to $4.4 billion primarily in new stores, store expansions andremodels, as well as information systems hardware and software, distribution capacity and otherinfrastructure to support our planned growth. Our estimated 2007 store opening program reflects netsquare footage growth of approximately 8 percent, including 115 to 120 new stores partially offset byclosings and relocations. We also expect to remodel approximately 40 to 45 stores, most of which will beexpanded. In addition, we expect to open two distribution centers in 2007.
Number of StoresFebruary 3, January 28,
2007 Opened Closed (a) 2006Target general merchandise stores 1,311 94 22 1,239SuperTarget stores 177 19 — 158Total 1,488 113 22 1,397Retail Square Feet (b)(thousands)Target general merchandise stores 160,806 12,860 2,372 150,318SuperTarget stores 31,258 3,316 — 27,942Total 192,064 16,176 2,372 178,260
(a) Includes 18 store relocations in the same trade area and four stores closed without replacement.(b) Reflects total square feet, less office, distribution center and vacant space.
Commitments and Contingencies
At February 3, 2007, our contractual obligations were as follows:
Contractual ObligationsPayments Due by Period
Less than 1-3 3-5 After 5(millions) Total 1 Year Years Years YearsLong-term debt (a) $ 9,897 $ 1,355 $ 2,268 $ 2,343 $ 3,931Interest payments – long-term debt (b) 4,165 547 899 625 2,094Capital lease obligations 249 15 30 32 172Operating leases (c) 3,325 142 266 235 2,682Deferred compensation 691 46 205 98 342Real estate obligations 1,106 1,106 — — —Purchase obligations 1,613 483 605 290 235Contractual cash obligations $ 21,046 $ 3,694 $ 4,273 $ 3,623 $ 9,456
(a) Required principal payments only. Excludes Statement of Financial Accounting Standards No. 133, ‘‘Accounting for Derivative Instruments andHedging Activities,’’ fair market value adjustments recorded in long-term debt.
(b) Includes payments on $1,750 million of floating rate long-term debt secured by credit card receivables, $750 million of which matures in2007, $900 million of which matures in 2010, and $100 million of which matures in 12 monthly installments beginning in October 2007.These payments are calculated assuming rates of approximately 5.5 percent, based on a spread over presumed LIBOR of 5.35%, for eachyear outstanding. Excludes payments received or made related to interest rate swaps. The fair value of outstanding interest rate swaps hasbeen provided in Note 21.
(c) Total contractual lease payments include $1,631 million related to certain options to extend the lease term that are reasonably assured ofbeing exercised and also includes $188 million of legally binding minimum lease payments for stores opening in 2007 or later. Refer to Note22 for further description of leases.
17
PA
RT
II

Real estate obligations include commitments for the purchase, construction or remodeling of realestate and facilities. Purchase obligations include all legally binding contracts such as firm minimumcommitments for inventory purchases, merchandise royalties, purchases of equipment, marketing-relatedcontracts, software acquisition/license commitments and service contracts.
We issue inventory purchase orders in the normal course of business, which represent authorizations topurchase that are cancelable by their terms. We do not consider purchase orders to be firm inventorycommitments; therefore, they are excluded from the table above. We also issue trade letters of credit in theordinary course of business, which are excluded from this table as these obligations are conditional on thepurchase order not being cancelled. If we choose to cancel a purchase order, we may be obligated toreimburse the vendor for unrecoverable outlays incurred prior to cancellation, under certain circumstances.
We have not included obligations under our pension and postretirement health care benefit plans inthe contractual obligations table above. Our historical practice regarding these plans has been tocontribute amounts necessary to satisfy minimum pension funding requirements plus periodic discretionaryamounts determined to be appropriate. Further information on these plans, including our expectedcontributions for 2007, is included in Note 28.
We have not provided any material financial guarantees as of February 3, 2007. We have not createdand are not party to any off-balance sheet entities for the purpose of raising capital, incurring debt oroperating our business. We do not have any arrangements or relationships with entities that are notconsolidated into the financial statements that are reasonably likely to materially affect our liquidity or theavailability of capital resources.
Analysis of Discontinued Operations
Marshall Field’s and Mervyn’s were divested in 2004; no financial results of discontinued operationsare included for 2006 or 2005. In 2004, revenues and earnings from discontinued operations reflectedonly a partial year of results and excluded the holiday season. For 2004, total revenues included indiscontinued operations were $3,095 million, and earnings from discontinued operations were$75 million, net of taxes of $46 million. In addition, we recorded a gain on the sale of discontinuedoperations of $1,238 million, net of taxes of $761 million, during 2004.
Critical Accounting Estimates
Our analysis of operations and financial condition is based on our consolidated financial statements,prepared in accordance with U.S. generally accepted accounting principles (GAAP). Preparation of theseconsolidated financial statements requires us to make estimates and assumptions affecting the reportedamounts of assets and liabilities at the date of the financial statements, reported amounts of revenues andexpenses during the reporting period and related disclosures of contingent assets and liabilities. In the Notesto Consolidated Financial Statements, we describe our significant accounting policies used in preparing theconsolidated financial statements. Our estimates are evaluated on an ongoing basis and are drawn fromhistorical experience and other assumptions that we believe to be reasonable under the circumstances.Actual results could differ under different assumptions or conditions. Our senior management has discussedthe development and selection of our critical accounting estimates with the Audit Committee of our Board ofDirectors. The following items in our consolidated financial statements require significant estimation orjudgment:
Inventory and cost of sales We use the retail inventory method to account for substantially all of ourinventory and the related cost of sales. Under this method, inventory is stated at cost using the last-in,first-out (LIFO) method as determined by applying a cost-to-retail ratio to each merchandise grouping’sending retail value. Cost includes the purchase price as adjusted for vendor income. Since inventory value isadjusted regularly to reflect market conditions, our inventory methodology reflects the lower of cost ormarket. We reduce inventory for estimated losses related to shrink and markdowns. Our shrink estimate isbased on historical losses verified by ongoing physical inventory counts. Markdowns designated forclearance activity are recorded when the salability of the merchandise has diminished. Inventory is at risk of
18

obsolescence if economic conditions change. Examples of relevant economic conditions include shiftingconsumer demand, changing consumer credit markets or increasing competition. We believe these risks arelargely mitigated because substantially all of our inventory turns in less than six months. Inventory is furtherdescribed in Note 11.
Vendor income receivable Cost of sales and SG&A expenses are partially offset by various forms ofconsideration received from our vendors. This ‘‘vendor income’’ is earned for a variety of vendor-sponsoredprograms, such as volume rebates, markdown allowances, promotions and advertising, as well as for ourcompliance programs. We establish a receivable for the vendor income that is earned but not yet received.Based on provisions of the agreements in place, this receivable is computed by estimating the point at whichwe have completed our performance and the amount earned. We perform detailed analyses to determinethe appropriate level of the receivable in aggregate. The majority of all year-end receivables associated withthese activities are collected within the following fiscal quarter. See further description in Note 4.
Allowance for doubtful accounts When receivables are recorded, we recognize an allowance for doubtfulaccounts in an amount equal to anticipated future write-offs. This allowance includes provisions foruncollectible finance charges and other credit fees. We estimate future write-offs based on delinquencies,risk scores, aging trends, industry risk trends and our historical experience. Substantially all accountscontinue to accrue finance charges until they are written off. Accounts are automatically written off whenthey become 180 days past due. Management believes the allowance for doubtful accounts is adequate tocover anticipated losses in our credit card accounts receivable under current conditions; however,significant deterioration in any of the factors mentioned above or in general economic conditions couldmaterially change these expectations. Accounts receivable is described in Note 10.
Analysis of long-lived and intangible assets for impairment We review assets at the lowest level for whichthere are identifiable cash flows, usually at the store level. The carrying amount of assets is compared to theexpected undiscounted future cash flows to be generated by those assets over their estimated remainingeconomic lives. Impairment testing of intangibles requires a comparison between the carrying value and thefair value. Discounted cash flow models are used in determining fair value for the purposes of the requiredannual impairment analysis. No material impairments were recorded in 2006, 2005 or 2004 as a result ofthe tests performed.
Insurance/self-insurance We retain a substantial portion of the risk related to certain general liability,workers’ compensation, property loss and team member medical and dental claims. Liabilities associatedwith these losses include estimates of both claims filed and losses incurred but not yet reported. We estimateour ultimate cost based on an analysis of historical data and actuarial estimates. General liability andworkers’ compensation liabilities are recorded at our estimate of their net present value; other liabilities arenot discounted. We believe that the amounts accrued are adequate, although actual losses may differ fromthe amounts provided. We maintain stop-loss coverage to limit the exposure related to certain risks.
Income taxes We pay income taxes based on the tax statutes, regulations and case law of the variousjurisdictions in which we operate. Significant judgment is required in determining income tax provisions andin evaluating the ultimate resolution of tax matters in dispute with tax authorities. Historically, ourassessments of the ultimate resolution of tax issues have been materially accurate. The current open taxissues are not dissimilar in size or substance from historical items. Management believes the resolution ofthe foregoing matters will not have a material impact on our consolidated financial statements. Incometaxes are further described in Note 23.
Pension and postretirement health care accounting We fund and maintain a qualified defined benefitpension plan. We also maintain several smaller nonqualified plans and a postretirement health care planfor certain retired team members. The costs for these plans are calculated based on actuarial calculationsusing the assumptions described in the following paragraphs.
19
PA
RT
II
Our expected long-term rate of return on plan assets is determined by the composition of our assetportfolio, our historical long-term investment performance and current market conditions.
The discount rate used to determine benefit obligations is adjusted annually based on the interest ratefor long-term high-quality corporate bonds as of the measurement date (October 31) using yields formaturities that are in line with the duration of our pension liabilities. Historically, this same discount rate hasalso been used to determine pension and postretirement health care expense for the following plan year. Weare currently evaluating whether we will early adopt the measurement date provisions of SFAS No. 158,‘‘Employers’ Accounting for Defined Benefit Pension and Other Postretirement Plans, an amendment ofFASB Statements No. 87, 88, 106, and 132(R)’’ (SFAS 158), as discussed below in the 2006 Adoptionssection. In 2006, we increased our discount rate by 0.05 percentage points from the previous year for thepurpose of calculating the October 31, 2006 benefit obligation.
Based on our experience, we use a graduated compensation growth schedule that assumes highercompensation growth for younger, shorter-service pension-eligible team members than it does for older,longer-service pension-eligible team members. In 2006, we increased the assumed rate of compensationincrease by 0.50 percentage points for the purpose of calculating the October 31, 2006 benefit obligation.In 2005, we made a 0.75 percentage point increase in the assumed compensation rate increase, whichimpacted the net periodic benefit cost for 2006.
Pension and postretirement health care benefits are further described in Note 28.
New Accounting Pronouncements
2006 Adoptions
We adopted the recognition and disclosure provisions of SFAS 158 during 2006. Please refer toNote 28 (Pension and Postretirement Health Care Benefits) for further description of this adoption. We arecurrently evaluating whether we will adopt the SFAS 158 measurement date provisions in 2007 or 2008,including the potential impact on our results of operations and financial position.
In September 2006, the SEC staff published Staff Accounting Bulletin No. 108, ‘‘Considering theEffects of Prior Year Misstatements when Quantifying Misstatements in Current Year Financial Statements’’(SAB 108). SAB 108 addresses quantifying the financial statement effects of misstatements, specifically, howthe effects of prior year uncorrected errors must be considered in quantifying misstatements in the currentyear financial statements. We adopted SAB 108 during the fourth quarter of 2006. The adoption of thisstatement did not have any impact on our consolidated net earnings, cash flows or financial position.
2007 and Future Adoptions
In July 2006, the Financial Accounting Standards Board (FASB) issued FASB Interpretation No. 48,‘‘Accounting for Uncertainty in Income Taxes—an interpretation of FASB Statement No. 109’’ (FIN 48). FIN48 prescribes the financial statement recognition and measurement criteria for tax positions taken in a taxreturn, clarifies when tax benefits should be recorded and how they should be classified in financialstatements, and requires certain disclosures of uncertain tax matters. FIN 48 is effective at the beginning offiscal 2007. We are presently evaluating the impact of the adoption of FIN 48 on our results of operationsand financial position.
In September 2006, the FASB issued Statement of Financial Accounting Standards No. 157, ‘‘FairValue Measurement’’ (SFAS 157). SFAS 157 provides a definition of fair value, provides guidance formeasuring fair value in U.S. GAAP and expands disclosures about fair value measurements. SFAS 157 willbe effective at the beginning of fiscal 2008. We are presently evaluating the impact of the adoption ofSFAS 157 on our results of operations and financial position.
In February 2007, the FASB issued Statement of Financial Accounting Standards No. 159, ‘‘The FairValue Option for Financial Assets and Financial Liabilities’’ (SFAS 159). SFAS 159 permits entities to chooseto measure many financial instruments and certain other items at fair value. SFAS 159 will be effective at thebeginning of fiscal 2008. We are presently evaluating the impact of the adoption of SFAS 159 on our resultsof operations and financial position.
20

Forward-Looking Statements
This report, including the preceding Management’s Discussion and Analysis, contains forward-lookingstatements regarding our performance, financial position, liquidity and adequacy of capital resources.Forward-looking statements are typically accompanied by the words ‘‘expect,’’ ‘‘may,’’ ‘‘could,’’‘‘believe,’’ ‘‘would,’’ ‘‘might,’’ ‘‘anticipates,’’ or words of similar import. The forward-looking statements inthis report include the anticipated impact of new and proposed accounting pronouncements, the expectedoutcome of pending and threatened litigation, our expectations with respect to our share repurchaseprogram and our outlook in fiscal 2007. Forward-looking statements are based on our current assumptionsand expectations and are subject to certain risks and uncertainties that could cause actual results to differmaterially from those projected. We caution that the forward-looking statements are qualified by the risksand challenges posed by increased competition (including the effects of competitor liquidation activities),shifting consumer demand, changing consumer credit markets, changing wages, health care and otherbenefit costs, shifting capital markets and general economic conditions, hiring and retaining effective teammembers, sourcing merchandise from domestic and international vendors, investing in new businessstrategies, the outbreak of war or pandemics and other significant national and international events, andother risks and uncertainties. As a result, although we believe there is a reasonable basis for the forward-looking statements, you should not place undue reliance on those statements. You are encouraged toreview Exhibit (99)A to this Form 10-K, which contains additional important factors that may cause actualresults to differ materially from those predicted in the forward-looking statements.
Item 7A. Quantitative and Qualitative Disclosures About Market Risk.
Our exposure to market risk results primarily from interest rate changes on our debt obligations and onour credit card receivables, the majority of which are now assessed finance charges at a prime-basedfloating rate. To preserve our net interest margin, we intend to maintain sufficient levels of floating-rate debtto generate parallel changes in net interest expense as finance charge revenues fluctuate. At February 3,2007, our level of floating-rate debt obligations exceeded our level of floating-rate credit card assets byapproximately $1 billion. As a result, based on our balance sheet position at February 3, 2007, theannualized effect of a one percentage point increase in floating interest rates on our interest rate swapagreements and other floating rate debt obligations, net of our floating rate credit card assets, would be todecrease earnings from continuing operations before income taxes by approximately $10 million. Seefurther description in Note 21.
We record our general liability and workers’ compensation liabilities at net present value; therefore,these liabilities fluctuate with changes in interest rates. We economically hedge a portion of our exposure tothese interest rate changes by entering into interest rate forward contracts that partially mitigate the effects ofinterest rate changes. As a result, we do not have significant net exposure to interest rate changes for theseliabilities.
In addition, we are exposed to fluctuations of market returns on our qualified defined benefit pensionand nonqualified defined contribution plans. The annualized effect of a one percentage point decrease inthe return on pension plan assets would decrease plan assets by $21 million at February 3, 2007. Theresulting impact on net pension expense would be calculated consistent with the provisions of SFAS No. 87,‘‘Employers’ Accounting for Pensions.’’ See further description in Note 28.
As more fully described in Note 14 and Note 27, we are exposed to market returns on accumulatedteam member balances in our nonqualified, unfunded deferred compensation plans. We control our risk ofoffering the nonqualified plans by making investments in life insurance contracts and prepaid forwardcontracts on our own common stock that offset a substantial portion of our economic exposure to the returnson these plans. The annualized effect of a one percentage point change in market returns on ournonqualified defined contribution plans (inclusive of the effect of the investment vehicles used to manageour economic exposure) would not be significant.
We do not have significant direct exposure to foreign currency rates as all of our stores are located inthe United States and the vast majority of imported merchandise is purchased in U.S. dollars.
Overall, there have been no material changes in our primary risk exposures or management of marketrisks since the prior year.
21
PA
RT
II

1APR2004160647531APR200416063806
Item 8. Financial Statements and Supplementary Data.
Report of Management on the Consolidated Financial StatementsManagement is responsible for the consistency, integrity and presentation of the information in the Annual Report.
The consolidated financial statements and other information presented in this Annual Report have been prepared inaccordance with accounting principles generally accepted in the United States and include necessary judgments andestimates by management.
To fulfill our responsibility, we maintain comprehensive systems of internal control designed to provide reasonableassurance that assets are safeguarded and transactions are executed in accordance with established procedures. Theconcept of reasonable assurance is based upon recognition that the cost of the controls should not exceed the benefitderived. We believe our systems of internal control provide this reasonable assurance.
The Board of Directors exercised its oversight role with respect to the Corporation’s systems of internal controlprimarily through its Audit Committee, which is comprised of four independent directors. The Committee oversees theCorporation’s systems of internal control, accounting practices, financial reporting and audits to assess whether theirquality, integrity and objectivity are sufficient to protect shareholders’ investments.
In addition, our consolidated financial statements have been audited by Ernst & Young LLP, independent registeredpublic accounting firm, whose report also appears on this page.
Robert J. Ulrich Douglas A. ScovannerChairman of the Board and Executive Vice President andChief Executive Officer Chief Financial OfficerMarch 14, 2007
Report of Independent Registered Public Accounting Firm on Consolidated Financial StatementsThe Board of Directors and ShareholdersTarget Corporation
We have audited the accompanying consolidated statements of financial position of Target Corporation andsubsidiaries (the Corporation) as of February 3, 2007 and January 28, 2006, and the related consolidated statements ofoperations, cash flows, and shareholders’ investment for each of the three years in the period ended February 3, 2007.Our audits also included the financial statement schedule listed in Item 15(a). These financial statements and schedule arethe responsibility of the Corporation’s management. Our responsibility is to express an opinion on these financialstatements and schedule based on our audits.
We conducted our audits in accordance with the standards of the Public Company Accounting Oversight Board(United States). Those standards require that we plan and perform the audit to obtain reasonable assurance about whetherthe financial statements are free of material misstatement. An audit includes examining, on a test basis, evidencesupporting the amounts and disclosures in the financial statements. An audit also includes assessing the accountingprinciples used and significant estimates made by management, as well as evaluating the overall financial statementpresentation. We believe that our audits provide a reasonable basis for our opinion.
In our opinion, the financial statements referred to above present fairly, in all material respects, the consolidatedfinancial position of Target Corporation and subsidiaries at February 3, 2007 and January 28, 2006, and theconsolidated results of their operations and their cash flows for each of the three years in the period ended February 3,2007, in conformity with U.S. generally accepted accounting principles. Also, in our opinion, the related financialstatement schedule, when considered in relation to the basic financial statements taken as a whole, presents fairly, in allmaterial respects, the information set forth therein.
As discussed in Note 28, Pension and Postretirement Health Care Benefits, to the consolidated financial statements,effective February 3, 2007, the Corporation adopted the recognition and disclosure provisions of SFAS 158, ‘‘Employers’Accounting for Defined Benefit Pension and Other Postretirement Plans, an amendment of FASB Statements No. 87, 88,106, and 132(R).’’
We also have audited, in accordance with the standards of the Public Company Accounting Oversight Board (UnitedStates), the effectiveness of the Corporation’s internal control over financial reporting as of February 3, 2007, based oncriteria established in Internal Control – Integrated Framework, issued by the Committee of Sponsoring Organizations ofthe Treadway Commission and our report dated March 14, 2007, expressed an unqualified opinion thereon.
Minneapolis, MinnesotaMarch 14, 2007
22

1APR2004160647531APR200416063806
Report of Management on Internal ControlOur management is responsible for establishing and maintaining adequate internal control over financial reporting, as
such term is defined in Exchange Act Rules 13a-15(f). Under the supervision and with the participation of our management,including our chief executive officer and chief financial officer, we assessed the effectiveness of our internal control overfinancial reporting as of February 3, 2007, based on the framework in Internal Control – Integrated Framework, issued by theCommittee of Sponsoring Organizations of the Treadway Commission. Based on our assessment, we conclude that theCorporation’s internal control over financial reporting is effective based on those criteria.
Our management’s assessment of the effectiveness of our internal control over financial reporting as of February 3,2007, has been audited by Ernst & Young LLP, independent registered public accounting firm, whose report also appearson this page.
Robert J. Ulrich Douglas A. ScovannerChairman of the Board and Executive Vice President andChief Executive Officer Chief Financial OfficerMarch 14, 2007
Report of Independent Registered Public Accounting Firm on Internal Control over Financial ReportingThe Board of Directors and ShareholdersTarget Corporation
We have audited management’s assessment, included in the accompanying Report of Management on InternalControl, that Target Corporation and subsidiaries (the Corporation) maintained effective internal control over financialreporting as of February 3, 2007, based on criteria established in Internal Control – Integrated Framework, issued by theCommittee of Sponsoring Organizations of the Treadway Commission (the COSO criteria). The Corporation’s managementis responsible for maintaining effective internal control over financial reporting and for its assessment of the effectiveness ofinternal control over financial reporting. Our responsibility is to express an opinion on management’s assessment and anopinion on the effectiveness of the Corporation’s internal control over financial reporting based on our audit.
We conducted our audit in accordance with the standards of the Public Company Accounting Oversight Board(United States). Those standards require that we plan and perform the audit to obtain reasonable assurance about whethereffective internal control over financial reporting was maintained in all material respects. Our audit included obtaining anunderstanding of internal control over financial reporting, evaluating management’s assessment, testing and evaluatingthe design and operating effectiveness of internal control, and performing such other procedures as we considerednecessary in the circumstances. We believe that our audit provides a reasonable basis for our opinion.
A company’s internal control over financial reporting is a process designed to provide reasonable assuranceregarding the reliability of financial reporting and the preparation of financial statements for external purposes inaccordance with generally accepted accounting principles. A company’s internal control over financial reporting includesthose policies and procedures that (1) pertain to the maintenance of records that, in reasonable detail, accurately andfairly reflect the transactions and dispositions of the assets of the company, (2) provide reasonable assurance thattransactions are recorded as necessary to permit preparation of financial statements in accordance with generallyaccepted accounting principles and that receipts and expenditures of the company are being made only in accordancewith authorizations of management and directors of the company, and (3) provide reasonable assurance regardingprevention or timely detection of unauthorized acquisition, use, or disposition of the company’s assets that could have amaterial effect on the financial statements.
Because of its inherent limitations, internal control over financial reporting may not prevent or detect misstatements.Also, projections of any evaluation of effectiveness to future periods are subject to the risk that controls may becomeinadequate because of changes in conditions or that the degree of compliance with the policies or procedures maydeteriorate.
In our opinion, management’s assessment that Target Corporation and subsidiaries maintained effective internalcontrol over financial reporting as of February 3, 2007, is fairly stated, in all material respects, based on the COSOcriteria. Also, in our opinion, the Corporation maintained, in all material respects, effective internal control over financialreporting as of February 3, 2007, based on the COSO criteria.
We also have audited, in accordance with the standards of the Public Company Accounting Oversight Board (UnitedStates), the consolidated statements of financial position of Target Corporation and subsidiaries as of February 3, 2007and January 28, 2006, and the related consolidated statements of operations, cash flows and shareholders’ investmentfor each of the three years in the period ended February 3, 2007, and our report dated March 14, 2007, expressed anunqualified opinion thereon.
Minneapolis, MinnesotaMarch 14, 2007
23
PA
RT
II

Consolidated Statements of Operations
(millions, except per share data) 2006 2005 2004Sales $57,878 $51,271 $45,682Net credit card revenues 1,612 1,349 1,157Total revenues 59,490 52,620 46,839Cost of sales 39,399 34,927 31,445Selling, general and administrative expenses 12,819 11,185 9,797Credit card expenses 707 776 737Depreciation and amortization 1,496 1,409 1,259Earnings from continuing operations before interest expense and income taxes 5,069 4,323 3,601Net interest expense 572 463 570Earnings from continuing operations before income taxes 4,497 3,860 3,031Provision for income taxes 1,710 1,452 1,146Earnings from continuing operations 2,787 2,408 1,885Earnings from discontinued operations, net of taxes of $46 — — 75Gain on disposal of discontinued operations, net of taxes of $761 — — 1,238Net earnings $ 2,787 $ 2,408 $ 3,198Basic earnings per share
Continuing operations $ 3.23 $ 2.73 $ 2.09Discontinued operations — — .08Gain from discontinued operations — — 1.37
Basic earnings per share $ 3.23 $ 2.73 $ 3.54Diluted earnings per share
Continuing operations $ 3.21 $ 2.71 $ 2.07Discontinued operations — — .08Gain from discontinued operations — — 1.36
Diluted earnings per share $ 3.21 $ 2.71 $ 3.51Weighted average common shares outstanding
Basic 861.9 882.0 903.8Diluted 868.6 889.2 912.1
See accompanying Notes to Consolidated Financial Statements.
24

Consolidated Statements of Financial Position
February 3, January 28,(millions, except footnotes) 2007 2006AssetsCash and cash equivalents $ 813 $ 1,648Accounts receivable, net 6,194 5,666Inventory 6,254 5,838Other current assets 1,445 1,253
Total current assets 14,706 14,405Property and equipment
Land 4,934 4,449Buildings and improvements 16,110 14,174Fixtures and equipment 3,553 3,219Computer hardware and software 2,188 2,214Construction-in-progress 1,596 1,158Accumulated depreciation (6,950) (6,176)Property and equipment, net 21,431 19,038
Other non-current assets 1,212 1,552Total assets $37,349 $34,995Liabilities and shareholders’ investmentAccounts payable $ 6,575 $ 6,268Accrued and other current liabilities 2,758 2,193Income taxes payable 422 374Current portion of long-term debt and notes payable 1,362 753
Total current liabilities 11,117 9,588Long-term debt 8,675 9,119Deferred income taxes 577 851Other non-current liabilities 1,347 1,232Shareholders’ investment
Common stock 72 73Additional paid-in-capital 2,387 2,121Retained earnings 13,417 12,013Accumulated other comprehensive loss (243) (2)Total shareholders’ investment 15,633 14,205
Total liabilities and shareholders’ investment $37,349 $34,995
Common Stock Authorized 6,000,000,000 shares, $.0833 par value; 859,771,157 shares issued and outstanding at February 3, 2007;874,074,850 shares issued and outstanding at January 28, 2006.
Preferred Stock Authorized 5,000,000 shares, $.01 par value; no shares were issued or outstanding at February 3, 2007 or January 28, 2006.
See accompanying Notes to Consolidated Financial Statements.
25
PA
RT
II

Consolidated Statements of Cash Flows
(millions) 2006 2005 2004Operating activitiesNet earnings $ 2,787 $ 2,408 $ 3,198Earnings from and gain on disposal of discontinued operations, net of taxes — — (1,313)Earnings from continuing operations 2,787 2,408 1,885Reconciliation to cash flow
Depreciation and amortization 1,496 1,409 1,259Share-based compensation expense 99 93 60Deferred income taxes (201) (122) 233Bad debt provision 380 466 451Loss on disposal of property and equipment, net 53 70 59Other non-cash items affecting earnings (35) (50) 73Changes in operating accounts providing / (requiring) cash:
Accounts receivable originated at Target (226) (244) (209)Inventory (431) (454) (853)Other current assets (30) (28) (37)Other non-current assets 5 (24) (147)Accounts payable 435 489 823Accrued liabilities 389 351 319Income taxes payable 41 70 (91)Other non-current liabilities 100 2 (16)
Other — 15 (1)Cash flow provided by operations 4,862 4,451 3,808Investing activities
Expenditures for property and equipment (3,928) (3,388) (3,068)Proceeds from disposal of property and equipment 62 58 56Change in accounts receivable originated at third parties (683) (819) (690)Other investments (144) — —Proceeds from sale of discontinued operations — — 4,881
Cash flow (required for) / provided by investing activities (4,693) (4,149) 1,179Financing activities
Additions to long-term debt 1,256 913 10Reductions of long-term debt (1,155) (527) (1,487)Dividends paid (380) (318) (272)Repurchase of stock (901) (1,197) (1,290)Stock option exercises and related tax benefit 181 231 215Other (5) (1) —
Cash flow required for financing activities (1,004) (899) (2,824)Cash flows of discontinued operations
Required for operations — — (549)Required for investing activities — — (44)Required for financing activities — — (33)
Net cash required for discontinued operations — — (626)Net (decrease) / increase in cash and cash equivalents (835) (597) 1,537Cash and cash equivalents at beginning of year 1,648 2,245 708Cash and cash equivalents at end of year $ 813 $ 1,648 $ 2,245
Amounts presented herein are on a cash basis and therefore may differ from those shown in other sections of this Annual Report. Consistent withthe provisions of Statement of Financial Accounting Standards (SFAS) No. 95, ‘‘Statement of Cash Flows,’’ cash flows related to accountsreceivable are classified as either an operating activity or an investing activity, depending on their origin.
Cash paid for income taxes was $1,823, $1,448, and $1,742 during 2006, 2005, and 2004, respectively. Cash paid for interest (net of interestcapitalized) was $584, $468, and $480 during 2006, 2005, and 2004, respectively.
See accompanying Notes to Consolidated Financial Statements.
26

Consolidated Statements of Shareholders’ Investment
AccumulatedCommon Stock Additional Other
Stock Par Paid-in Retained Comprehensive(millions, except footnotes) Shares Value Capital Earnings Income/(Loss) TotalJanuary 31, 2004 911.8 $76 $1,530 $ 9,523 $ 3 $11,132Net earnings — — — 3,198 — 3,198Other comprehensive loss — — — — (6) (6)Total comprehensive income 3,192Dividends declared — — — (280) — (280)Repurchase of stock (28.9) (3) — (1,293) — (1,296)Stock options and awards 7.7 1 280 — — 281
January 29, 2005 890.6 74 1,810 11,148 (3) 13,029Net earnings — — — 2,408 — 2,408Other comprehensive income — — — — 1 1Total comprehensive income 2,409Dividends declared — — — (334) — (334)Repurchase of stock (23.1) (2) — (1,209) — (1,211)Stock options and awards 6.6 1 311 — — 312
January 28, 2006 874.1 73 2,121 12,013 (2) 14,205Net earnings — — — 2,787 — 2,787Other comprehensive income, net of taxes
of $5 — — — — (7) (7)Total comprehensive income 2,780Cumulative effect of adopting SFAS 158,
net of taxes of $152 — — — — (234) (234)Dividends declared — — — (396) — (396)Repurchase of stock (19.5) (2) — (987) — (989)Stock options and awards 5.2 1 266 — — 267
February 3, 2007 859.8 $72 $2,387 $13,417 $(243) $15,633
Dividends declared per share were $.46, $.38, and $.31 in 2006, 2005, and 2004, respectively.
See accompanying Notes to Consolidated Financial Statements.
27
PA
RT
II

Notes to Consolidated Financial Statements
1. Summary of Accounting Policies
Organization Target Corporation (the Corporation or Target) operates large-format general merchandiseand food discount stores in the United States and a fully integrated on-line business, Target.com. Our creditcard operations represent an integral component of our core retail business, strengthening the bond withour guests, driving incremental sales and contributing meaningfully to earnings. We operate as a singlebusiness segment.
Consolidation The consolidated financial statements include the balances of the Corporation and itssubsidiaries after elimination of intercompany balances and transactions. All material subsidiaries arewholly-owned.
Use of estimates The preparation of our consolidated financial statements in conformity with U.S.Generally Accepted Accounting Principles (GAAP) requires management to make estimates andassumptions affecting reported amounts in the consolidated financial statements and accompanying notes.Actual results may differ significantly from those estimates.
Fiscal year Our fiscal year ends on the Saturday nearest January 31. Unless otherwise stated, references toyears in this report relate to fiscal years, rather than to calendar years. Fiscal year 2006 (2006) endedFebruary 3, 2007 and consisted of 53 weeks. Fiscal year 2005 (2005) ended January 28, 2006 and fiscalyear 2004 (2004) ended January 29, 2005, and both consisted of 52 weeks.
Reclassifications Certain prior year amounts have been reclassified to conform to the current yearpresentation.
Share-based compensation We adopted the provisions of SFAS No. 123(R), ‘‘Share-Based Payment,’’ in2004 under the modified retrospective transition method. Therefore, all prior period financial statementshave been restated to recognize compensation cost in the amounts previously reported in the Notes toConsolidated Financial Statements under the provisions of SFAS 123. SFAS 123(R) requires that all share-based compensation be accounted for using a fair-value-based method.
We estimate the fair value of all share-based awards on the date of grant, which we define as the datethe award is approved by our Board of Directors or, for a limited number of awards to team members whoare not executive officers, the date the award is approved by management with appropriate delegatedauthority. The majority of granted awards are nonqualified stock options that vest annually in equal amountsover a four-year period, and all stock options have an exercise price equal to the fair market value of ourcommon stock on the date of grant. Generally, we recognize compensation expense for awards on astraight-line basis over the four-year vesting period. However, in certain circumstances under our share-based compensation plans, we allow for the vesting of team member awards to continue post-employment.Accordingly, for awards granted subsequent to our adoption of SFAS 123(R) and to the extent the teammember meets certain age and service requirements on the date of grant, we accelerate expenserecognition such that the value of the award is fully expensed over the team member’s minimum serviceperiod instead of over the explicit vesting period. Awards granted prior to the adoption of SFAS 123(R)continue to be expensed over the explicit vesting period. Information related to share-based awards isdisclosed in Note 26.
Derivative financial instruments Derivative financial instruments are carried at fair value on the balancesheet. Our derivative instruments are primarily interest rate swaps that hedge the fair value of certain debt byeffectively converting interest from a fixed rate to a floating rate. These instruments qualify for hedgeaccounting, and the associated assets and liabilities are recorded in the Consolidated Statements ofFinancial Position. The changes in market value of an interest rate swap, as well as the offsetting change inmarket value of the hedged debt, are recognized within earnings in the current period. Ineffectiveness would
28

result when changes in the market value of the hedged debt are not completely offset by changes in themarket value of the interest rate swap. There was no ineffectiveness recognized in 2006, 2005, or 2004related to these instruments. Further information related to interest rate swaps is disclosed in Note 21.
During 2006, we entered into an interest rate forward contract in order to offset a portion of ourexposure to our workers’ compensation and general liability obligations, which are recorded on adiscounted basis. This instrument has not been designated as an accounting hedge.
Nearly all of our inventory purchases are in U.S. dollars; therefore, we have immaterial foreigncurrency hedging activities.
Additionally, see the description of our prepaid forward contracts in Note 27.
2. Revenues
Our retail stores record revenue at the point of sale. Sales from our on-line business include shippingrevenue and are recorded upon delivery to the guest. Total revenues do not include sales tax as we considerourselves a pass through conduit for collecting and remitting sales taxes. Generally, guests may returnmerchandise within 90 days of purchase. Revenues are recognized net of expected returns, which weestimate using historical return patterns. Commissions earned on sales generated by leased departmentsare included within sales and were $15 million in 2006, $14 million in 2005 and $14 million in 2004.
Revenue from gift card sales is recognized upon redemption of the gift card. Our gift cards do not haveexpiration dates. Based on historical redemption rates, a small and relatively stable percentage of gift cardswill never be redeemed, referred to as ‘‘breakage.’’ Estimated breakage revenue is recognized over aperiod of time in proportion to actual gift card redemptions and was immaterial in 2006, 2005 and 2004.
Credit card revenues are recognized according to the contractual provisions of each applicable creditcard agreement. When accounts are written-off, uncollected finance charges and late fees are recorded asa reduction of credit card revenues. Target retail store sales charged to our credit cards totaled$3,961 million, $3,655 million and $3,269 million in 2006, 2005, and 2004, respectively. We offer newaccount discounts and rewards programs on our REDcard products. These discounts are redeemable onlyon purchases made at Target. The discounts associated with our REDcard products are included asreductions in sales in our Consolidated Statements of Operations and were $104 million, $97 million and$80 million in 2006, 2005 and 2004, respectively.
3. Cost of Sales and Selling, General and Administrative Expenses
The following illustrates the primary costs classified in each major expense category:
Cost of Sales Selling, General and Administrative Expenses
Total cost of products sold including: Compensation and benefit costs including:• Freight expenses associated with moving • Stores
merchandise from our vendors to our • Headquarters, including buying anddistribution centers and our retail stores, and merchandisingamong our distribution and retail facilities • Distribution operations
• Vendor income that is not reimbursement of Occupancy and operating costs of retail,specific, incremental and identifiable costs distribution and headquarters facilities
Inventory shrink Advertising, offset by vendor income that is aMarkdowns reimbursement of specific, incremental andShipping and handling expenses identifiable costsTerms cash discount Pre-opening costs of stores and other facilities
Other administrative costsThe classification of these expenses varies across the retail industry.
Compensation, benefits and other expenses for buying, merchandising and distribution operationsclassified in selling, general and administrative expenses were approximately $1,274 million,$1,133 million and $980 million for 2006, 2005 and 2004, respectively.
29
PA
RT
II

4. Consideration Received from Vendors
We receive consideration for a variety of vendor-sponsored programs, such as volume rebates,markdown allowances, promotions and advertising and for our compliance programs, referred to as‘‘vendor income.’’ Vendor income reduces either our inventory costs or selling, general and administrativeexpenses based on the provisions of the arrangement. Promotional and advertising allowances are intendedto offset our costs of promoting and selling the vendor’s merchandise in our stores. Under our complianceprograms, vendors are charged for merchandise shipments that do not meet our requirements(‘‘violations’’), such as late or incomplete shipments. These allowances are recorded when violations occur.
We establish a receivable for vendor income that is earned but not yet received. Based on provisions ofthe agreements in place, this receivable is computed by estimating the point at which we have completedour performance and the amount earned. We perform detailed analyses to determine the appropriate levelof the receivable in the aggregate. The majority of year-end receivables associated with these activities arecollected within the following fiscal quarter.
5. Advertising Costs
Advertising costs are expensed at first showing or distribution of the advertisement and were$1,170 million, $1,028 million, and $888 million for 2006, 2005 and 2004, respectively. Advertisingvendor income that offset advertising expenses was approximately $118 million, $110 million, and$72 million for 2006, 2005 and 2004, respectively. Newspaper circulars and media broadcast made upthe majority of our advertising costs in all three years.
6. Discontinued Operations
We completed the sale of our Marshall Field’s and Mervyn’s businesses during 2004, and the financialresults of Marshall Field’s and Mervyn’s are reported as discontinued operations. For 2004, total revenuesincluded in discontinued operations were $3,095 million, and earnings from discontinued operations were$75 million, net of taxes of $46 million. In addition, we recorded a gain on the sale of discontinuedoperations of $1,238 million, net of taxes of $761 million, during 2004. There were no assets or liabilitiesof Marshall Field’s or Mervyn’s included in our Consolidated Statements of Financial Position at February 3,2007 or January 28, 2006.
7. Earnings per Share
Basic earnings per share (EPS) is net earnings divided by the weighted average number of commonshares outstanding during the period. Diluted EPS includes the incremental shares assumed to be issuedupon the exercise of stock options and the incremental shares assumed to be issued under performanceshare and restricted stock unit arrangements.
Basic EPS Diluted EPS
(millions, except per share data) 2006 2005 2004 2006 2005 2004Net earnings $2,787 $2,408 $3,198 $2,787 $2,408 $3,198Basic weighted average common shares
outstanding 861.9 882.0 903.8 861.9 882.0 903.8Incremental stock options, performance
share units and restricted stock units — — — 6.7 7.2 8.3Weighted average common shares
outstanding 861.9 882.0 903.8 868.6 889.2 912.1Earnings per share $ 3.23 $ 2.73 $ 3.54 $ 3.21 $ 2.71 $ 3.51
For the 2006, 2005 and 2004 EPS computations, 1.8 million, 4.4 million and 1.0 million stockoptions, respectively, were excluded from the calculation of weighted average shares for diluted EPSbecause their effects were antidilutive.
30

8. Other Comprehensive Income/(Loss)
Other comprehensive income/(loss) includes revenues, expenses, gains and losses that are excludedfrom net earnings under GAAP and are recorded directly to shareholders’ investment. In 2006, 2005 and2004, other comprehensive income/(loss) included gains and losses on certain hedge transactions and thechange in our minimum pension liability, net of related taxes. These amounts were not material in any yearpresented.
9. Cash Equivalents
Cash equivalents include highly liquid investments with an original maturity of three months or lessfrom the time of purchase. We carry these investments at cost, which approximates market value. Theseinvestments were $281 million and $1,172 million at February 3, 2007 and January 28, 2006,respectively. Also included in cash equivalents are proceeds due from credit and debit card transactions withsettlement terms of less than five days. Credit and debit card receivables included within cash equivalentswere $355 million and $290 million at February 3, 2007 and January 28, 2006, respectively.
10. Accounts Receivable
Accounts receivable are recorded net of an allowance for expected losses. The allowance, recognizedin an amount equal to the anticipated future write-offs, was $517 million at February 3, 2007 and$451 million at January 28, 2006. We estimate future write-offs based on delinquencies, risk scores, agingtrends, industry risk trends and our historical experience. Substantially all accounts continue to accruefinance charges until they are written off. Total accounts receivable past due ninety days or more and stillaccruing finance charges were $236 million at February 3, 2007 and $174 million at January 28, 2006.Accounts are written off when they become 180 days past due.
As a method of providing funding for our accounts receivable, we sell on an ongoing basis all of ourconsumer credit card receivables to Target Receivables Corporation (TRC), a wholly-owned bankruptcyremote subsidiary. TRC then transfers the receivables to the Target Credit Card Master Trust (the Trust), whichfrom time to time will sell debt securities to third parties either directly or through a related trust. These debtsecurities represent undivided interests in the Trust assets. The servicer of the receivables, Target NationalBank, a wholly-owned subsidiary of Target, holds a 2 percent undivided interest in the Trust assets. Inaddition, TRC retains an undivided interest in the Trust assets that is not represented by either the debtsecurities sold to third parties or the 2 percent held by Target National Bank. TRC uses the proceeds from thesale of debt securities and its share of collections on the receivables to pay the purchase price of thereceivables to Target.
The accounting guidance for such transactions, SFAS No. 140, ‘‘Accounting for Transfers and Servicingof Financial Assets and Extinguishments of Liabilities (a replacement of SFAS No. 125),’’ requires theinclusion of the receivables within the Trust and any debt securities issued by the Trust, or a related trust, inour Consolidated Statements of Financial Position. Notwithstanding this accounting treatment, thereceivables transferred to the Trust are not available to general creditors of Target. Upon termination of thesecuritization program and repayment of all debt securities issued from time to time by the Trust, or a relatedtrust, any remaining assets could be distributed to Target in a liquidation of TRC.
11. Inventory
Substantially all of our inventory and the related cost of sales are accounted for under the retailinventory accounting method (RIM) using the last-in, first-out (LIFO) method. Inventory is stated at the lowerof LIFO cost or market. Cost includes purchase price as adjusted for vendor income. Inventory is alsoreduced for estimated losses related to shrink and markdowns. The LIFO provision is calculated based oninventory levels, markup rates and internally measured retail price indices. At February 3, 2007 andJanuary 28, 2006, our inventories valued at LIFO approximate those inventories as if they were valued atFIFO.
31
PA
RT
II

Under RIM, the valuation of inventory at cost and the resulting gross margins are calculated byapplying a cost-to-retail ratio to the retail value inventory. RIM is an averaging method that has been widelyused in the retail industry due to its practicality. The use of RIM will result in inventory being valued at thelower of cost or market since permanent markdowns are currently taken as a reduction of the retail value ofinventory.
We routinely enter into arrangements with certain vendors whereby we do not purchase or pay formerchandise until the merchandise is ultimately sold to a guest. Revenues under this program are includedin sales in the Consolidated Statements of Operations, but the merchandise received under the program isnot included in inventory in our Consolidated Statements of Financial Position because of the virtuallysimultaneous timing of our purchase and sale of this inventory. Sales made under these arrangementstotaled $1,178 million, $872 million and $357 million for 2006, 2005 and 2004, respectively.
12. Other Current Assets
February 3, January 28,(millions) 2007 2006Deferred taxes $ 427 $ 344Vendor income receivable 285 277Other receivables (a) 278 283Other 455 349Total $1,445 $1,253
(a) Other receivables relate primarily to pharmacy receivables and merchandise sourcing services provided to third parties.
13. Property and Equipment
Property and equipment are recorded at cost, less accumulated depreciation. Depreciation iscomputed using the straight-line method over estimated useful lives or lease term if shorter. We amortizeleasehold improvements purchased after the beginning of the initial lease term over the shorter of the assets’useful lives or a term that includes the original lease term plus any renewals that are reasonably assured atthe date the leasehold improvements are purchased. Depreciation expense for 2006, 2005 and 2004 was$1,509 million, $1,384 million and $1,232 million, respectively. For income tax purposes, accelerateddepreciation methods are generally used. Repair and maintenance costs are expensed as incurred and were$532 million, $474 million and $453 million in 2006, 2005 and 2004, respectively. Pre-opening costs ofstores and other facilities, including supplies, payroll and other start-up costs for store and other facilityopenings, are expensed as incurred.
Estimated useful lives by major asset category are:
Asset Life (in years)Buildings and improvements 8-39Fixtures and equipment 3-15Computer hardware and software 4
Long-lived assets are reviewed for impairment annually and also when events or changes incircumstances indicate that the asset’s carrying value may not be recoverable. No material impairmentswere recorded in 2006, 2005 or 2004 as a result of the tests performed.
32

14. Other Non-Current Assets
February 3, January 28,(millions) 2007 2006Cash value of life insurance (a) $ 559 $ 524Prepaid pension expense (b) 325 752Goodwill and intangible assets 212 183Other 116 93Total $1,212 $1,552
(a) Company-owned life insurance policies on approximately 3,000 team members who are designated highly-compensated under the InternalRevenue Code and have given their consent to be insured.
(b) Prepaid pension expense at February 3, 2007 includes the effect of our adoption of SFAS No. 158, ‘‘Employers’ Accounting for DefinedBenefit Pension and Other Postretirement Plans, an amendment of FASB Statements No. 87, 88, 106, and 132(R).’’ Refer to Note 28 for moredetails.
15. Goodwill and Intangible Assets
Goodwill and intangible assets are recorded within other non-current assets at cost less accumulatedamortization. Goodwill and intangible assets by major classes were:
LeaseholdGoodwill Acquisition Costs Other (a) Total
Feb. 3, Jan. 28, Feb. 3, Jan. 28, Feb. 3, Jan. 28, Feb. 3, Jan. 28,(millions) 2007 2006 2007 2006 2007 2006 2007 2006Gross asset $ 80 $ 80 $187 $182 $ 173 $ 205 $ 440 $ 467Accumulated amortization (20) (20) (47) (70) (161) (194) (228) (284)Net goodwill and intangible assets $ 60 $ 60 $140 $112 $ 12 $ 11 $ 212 $ 183
(a) Other intangible assets relate primarily to acquired trade names and customer lists.
Amortization is computed on intangible assets with definite useful lives using the straight-line methodover estimated useful lives that range from three to 39 years. During 2006, we adjusted the period overwhich we amortize leasehold acquisition costs to match the expected terms for individual leases resulting ina cumulative benefit to amortization expense of approximately $28 million. Amortization expense for 2006,2005 and 2004 was $(13) million, $25 million and $27 million, respectively. The estimated aggregateamortization expense of our definite-lived intangible assets for each of the five succeeding fiscal years is:
(millions) 2007 2008 2009 2010 2011Amortization expense $13 $12 $10 $9 $9
Goodwill is not amortized. Instead, it is subject to an annual impairment test. Discounted cash flowmodels are used in determining fair value for the purposes of the required annual impairment analysis. Nomaterial impairments were recorded in 2006, 2005 or 2004 as a result of the tests performed.
16. Accounts Payable
We reclassify book overdrafts to accounts payable at period end. At February 3, 2007 and January 28,2006, $652 million and $645 million of such overdrafts, respectively, were reclassified to accountspayable.
33
PA
RT
II

17. Accrued Liabilities
February 3, January 28,(millions) 2007 2006Wages and benefits $ 674 $ 602Taxes payable (a) 450 366Gift card liability (b) 338 294Workers’ compensation and general liability (c) 154 142Other 1,142 789Total $2,758 $2,193
(a) Taxes payable consist of real estate, team member withholdings and sales tax liabilities.(b) Gift card liability represents the amount of gift cards that have been issued but have not been redeemed, net of estimated breakage.(c) The non-current portion of our liability for workers’ compensation and general liability claims is shown in Note 24.
18. Commitments and Contingencies
At February 3, 2007, our obligations included notes and debentures of $9,897 million (furtherdescribed in Note 19), excluding swap fair market value adjustments. At February 3, 2007, capital leaseobligations were $249 million and total future minimum payments of operating leases were $3,325 million.The amount of future contractual lease payments includes certain options for lease term extension that arereasonably assured of being exercised in the amount of $1,631 million, and $188 million of legally bindingminimum lease payments for stores that will open in 2007 or later (see additional detail in Note 22).Deferred compensation obligations were $691 million at February 3, 2007. In addition, real estateobligations, including commitments for the purchase, construction or remodeling of real estate andfacilities, were approximately $1,106 million at February 3, 2007.
Purchase obligations, which include all legally binding contracts such as firm commitments forinventory purchases, merchandise royalties, purchases of equipment, marketing-related contracts, softwareacquisition/license commitments and service contracts, were approximately $1,613 million at February 3,2007. We issue inventory purchase orders, which represent authorizations to purchase that are cancelableby their terms. We do not consider purchase orders to be firm inventory commitments. We also issue tradeletters of credit in the ordinary course of business, which are not firm commitments as they are conditionalon the purchase order not being cancelled. If we choose to cancel a purchase order, we may be obligated toreimburse the vendor for unrecoverable outlays incurred prior to cancellation under certain circumstances.
Trade letters of credit totaled $1,830 million at February 3, 2007, a portion of which is in accountspayable. Standby letters of credit, relating primarily to retained risk on our insurance claims, totaled$81 million at February 3, 2007.
The terms of a significant portion of the Visa/MasterCard antitrust litigation settlement were finalizedduring the third quarter of 2005. As a result, we recorded a $27 million ($.02 per share) gain in the thirdquarter of 2005 for our share of the proceeds, which we received during the second quarter of 2006. Wealso expect to receive an additional, smaller payment; however, the amount and timing of that payment arenot certain at this time. Accordingly, no additional gain has been recorded as of February 3, 2007.
We are exposed to claims and litigation arising in the ordinary course of business and use variousmethods to resolve these matters in a manner that we believe serves the best interest of our shareholders andother constituents. We believe the recorded reserves in our consolidated financial statements are adequatein light of the probable and estimable liabilities. We do not believe that any of the currently identified claimsor litigation matters will have a material adverse impact on our results of operations, cash flows or financialcondition.
34

19. Notes Payable and Long-Term Debt
We obtain short-term financing throughout the year under our commercial paper program, a form ofnotes payable. Information on this program is as follows:
Commercial Paper(dollars in millions) 2006 2005Maximum outstanding during the year $957 $994Average amount outstanding during the year $273 $ 77Outstanding at year-end $ — $ —Weighted average interest rate 5.3% 4.0%
At February 3, 2007, a committed unsecured credit facility totaling $1.6 billion was in place through agroup of banks at specified rates and is scheduled to expire in June 2010. No balances were outstanding atany time during 2006 or 2005 under this or previously existing revolving credit facilities.
In 2006 we issued $750 million of long-term debt at 5.875 percent maturing in 2016. Concurrent withthe issuance of this debt, we entered into two interest rate swaps, the details of which are disclosed inNote 21. In September 2006, TRC issued $500 million of Variable Funding Certificates (Certificates)backed by credit card receivables through the Target Credit Card Master Trust. At February 3, 2007, theoutstanding amount of the Certificates was $100 million.
In November 2005 TRC issued to the public, through the Target Credit Card Owner Trust 2005-1,$900 million of debt backed by credit card receivables. This issue of receivable-backed securities had anexpected initial maturity of five years and a floating interest rate set at 1-month LIBOR plus 0.06 percent.Refer to Note 10 for further description of our accounts receivable financing program.
The total amount of debt backed by credit card receivables held in the Target Credit Card Master Trustor related trusts was $1,750 million at February 3, 2007 and $1,650 million at January 28, 2006.
In 2004, we called or repurchased $542 million of long-term debt with an average remaining life of24 years and a weighted average interest rate of 7.0 percent, resulting in a pre-tax loss of $89 million(approximately $.06 per share), reflected in net interest expense. We did not repurchase any significantamount of long-term debt during 2006 or 2005.
The carrying value of our debt portfolio, including swap valuation adjustments for our fair valuehedges, was as follows:
Long-Term DebtFebruary 3, 2007 January 28, 2006
(dollars in millions) Rate (a) Balance Rate (a) BalanceNotes and debentures:
Due 2006-2010 6.2% $ 5,824 5.7% $6,480Due 2011-2015 5.6 1,637 5.6 1,636Due 2016-2020 5.8 1,078 6.4 307Due 2021-2025 9.0 120 9.0 119Due 2026-2030 6.7 326 6.7 325Due 2031-2036 6.6 905 6.6 904
Total notes and debentures (b) 6.1% 9,890 5.9% 9,771Capital lease obligations and other 147 101Less: current portion (1,362) (753)Long-term debt $ 8,675 $9,119
(a) Reflects the weighted average stated interest rate as of year-end, including the impact of interest rate swaps.(b) The estimated fair value of total notes and debentures, excluding swap valuation adjustments, using a discounted cash flow analysis based on
our incremental interest rates for similar types of financial instruments, was $10,058 million at February 3, 2007 and $10,229 million atJanuary 28, 2006. See Note 21 for the estimated fair value of our interest rate swaps.
35
PA
RT
II

Required principal payments on notes and debentures over the next five years, excluding capital leaseobligations and fair market value adjustments recorded in long-term debt, are:
(millions) 2007 2008 2009 2010 2011Required principal payments $1,355 $1,517 $751 $2,236 $107
Most of our long-term debt obligations contain covenants related to secured debt levels. In addition,our credit facility contains a debt leverage covenant. We are, and expect to remain, in compliance withthese covenants.
20. Net Interest Expense
(millions) 2006 2005 2004Interest expense on debt $635 $524 $509Interest expense on capital leases 11 8 9Loss on debt repurchase — — 89Capitalized interest (49) (42) (18)Interest income (25) (27) (19)Net interest expense $572 $463 $570
21. Derivative Financial Instruments
At February 3, 2007 and January 28, 2006, interest rate swaps were outstanding in notional amountstotaling $3,725 million and $3,300 million, respectively. The increase in swap exposure was executed tomanage our mix of fixed-rate debt and floating-rate debt.
During 2006, we entered into three interest rate swaps with notional amounts of $225 million,$500 million and $250 million. During 2005, we entered into four interest rate swaps with notionalamounts of $250 million, $350 million, $325 million and $225 million. In 2005 we also terminated aninterest rate swap with a notional amount of $200 million, resulting in a gain of $24 million that will beamortized into net interest expense over the then remaining 13-year life of the hedged debt. In 2006, 2005and 2004, the total net gains amortized into net interest expense for terminated swaps were $9 million,$8 million and $7 million, respectively.
Interest Rate Swaps(dollars in millions)
Notional Amount Outstanding at Pay Floating Rate at (a)
Maturity (b) Feb. 3, 2007 Jan. 28, 2006 Receive Fixed Feb. 3, 2007 Jan. 28, 2006May 2006 $ — $ 550 4.6% —% 4.8%Mar. 2008 250 250 3.9 5.3 4.4Mar. 2008 250 250 3.8 5.3 4.4Oct. 2008 500 500 4.4 5.4 4.8Oct. 2008 250 250 3.8 5.3 4.4Nov. 2008 200 200 3.9 5.3 4.4Jun. 2009 400 400 4.4 5.3 4.8Jun. 2009 350 350 4.2 5.3 4.5Aug. 2010 325 325 4.8 5.3 4.5Aug. 2010 225 225 4.5 5.3 4.5Jan. 2011 225 — 5.5 5.3 —Jul. 2016 500 — 5.7 5.3 —Jul. 2016 250 — 5.7 5.3 —
$3,725 $3,300
(a) Reflects the year end floating interest rate.(b) The weighted average life of the interest rate swaps was approximately 3.7 years at February 3, 2007.
36

The market value of outstanding interest rate swaps and net unamortized gains/(losses) fromterminated interest rate swaps was $(7) million and $(21) million at February 3, 2007 and January 28,2006, respectively. No ineffectiveness was recognized related to these instruments in 2006, 2005 or 2004.
During 2006, we entered into an interest rate forward contract with a $300 million notional amount tooffset a portion of the interest rate exposure on our discounted workers’ compensation and general liabilityobligations. See Note 17 and Note 24 for details of our workers’ compensation and general liabilityaccruals.
22. Leases
We lease certain retail locations, warehouses, distribution centers, office space, equipment and land.Assets held under capital lease are included in property and equipment. Operating lease rentals areexpensed on a straight-line basis over the life of the lease. At the inception of a lease, we determine the leaseterm by assuming the exercise of those renewal options that are reasonably assured because of thesignificant economic penalty that exists for not exercising those options. The exercise of lease renewaloptions is at our sole discretion. The expected lease term is used to determine whether a lease is capital oroperating and is used to calculate straight-line rent expense. Additionally, the useful life of buildings andleasehold improvements are limited by the expected lease term.
Rent expense on buildings, included in selling, general and administrative expenses, includes rentalpayments based on a percentage of retail sales over contractual levels for certain stores. Total rent expensewas $158 million in 2006, $154 million in 2005 and $240 million in 2004, including percentage rentexpense of $5 million in 2006, $5 million in 2005 and $3 million in 2004. We adjusted our method ofaccounting for leases related to a specific category of owned store locations on leased land, resulting in anon-cash adjustment primarily attributable to an increase in the straight-line rent accrual of $65 million($.04 per share) in the fourth quarter of 2004. Certain leases require us to pay real estate taxes, insurance,maintenance and other operating expenses associated with the leased premises. These expenses areclassified in selling, general and administrative expenses consistent with similar costs for owned locations.Most long-term leases include one or more options to renew, with renewal terms that can extend the leaseterm from one to more than 50 years. Certain leases also include options to purchase the leased property.
Future minimum lease payments required under noncancelable lease agreements existing atFebruary 3, 2007 were:
Future Minimum Lease Payments(millions) Operating Leases Capital Leases2007 $ 142 $ 152008 136 152009 130 152010 122 162011 113 16After 2011 2,682 172Total future minimum lease payments $3,325 (a) 249Less: Interest (b) (126)Present value of minimum capital lease payments $ 123 (c)
(a) Total contractual lease payments include $1,631 million related to options to extend lease terms that are reasonably assured of beingexercised and also includes $188 million of legally binding minimum lease payments for stores that will open 2007 or later.
(b) Calculated using the interest rate at inception for each lease.(c) Includes current portion of $3 million.
23. Income Taxes
We account for income taxes under the asset and liability method. We have recognized deferred taxassets and liabilities for the estimated future tax consequences attributable to differences between thefinancial statement carrying amounts of existing assets and liabilities and their respective tax bases. Deferredtax assets and liabilities are measured using enacted income tax rates in effect for the year the temporarydifferences are expected to be recovered or settled. Tax rate changes affecting deferred tax assets and
37
PA
RT
II

liabilities are recognized in income at the enactment date. In the Consolidated Statements of FinancialPosition, the current deferred tax asset balance is the net of all current deferred tax assets and currentdeferred tax liabilities. The non-current deferred tax liability is the net of all non-current deferred tax assetsand non-current deferred tax liabilities.
To determine our quarterly provision for income taxes we use annual effective tax rates based onexpected annual income and statutory tax rates, adjusted for discrete tax events that occur during thequarter.
Reconciliation of tax rates is as follows:
Tax Rate Reconciliation2006 2005 2004
Federal statutory rate 35.0% 35.0% 35.0%State income taxes, net of federal tax benefit 4.0 3.3 3.3Other (1.0) (0.7) (0.5)Effective tax rate 38.0% 37.6% 37.8%
The components of the provision for income taxes were:
Provision for Income Taxes: Expense (Benefit)(millions) 2006 2005 2004Current
Federal $1,627 $1,361 $ 908State/other 284 213 144
1,911 1,574 1,052Deferred
Federal (174) (110) 83State/other (27) (12) 11
(201) (122) 94Total $1,710 $1,452 $1,146
The components of the net deferred tax asset/(liability) were:
Net Deferred Tax Asset/(Liability)February 3, January 28,
(millions) 2007 2006Gross deferred tax assets
Accrued and deferred compensation $ 466 $ 399Self-insured claims 238 217Allowance for doubtful accounts 191 167Inventory 13 1Postretirement health care obligation 39 39Other 179 151
1,126 974Gross deferred tax liabilities
Property and equipment (1,041) (1,080)Pension (100) (287)Deferred credit card income (119) (103)Other (16) (11)
(1,276) (1,481)Total $ (150) $ (507)
The change in the 2006 year end deferred tax balance includes the effect of adopting SFAS No. 158,‘‘Employers’ Accounting for Defined Benefit Pension and Other Postretirement Plans, an amendment ofFASB Statements No. 87, 88, 106, and 132(R),’’ in addition to the annual provision for deferred income taxexpense.
38

During the year ended January 29, 2005, $566 million of the proceeds attributable to the realproperties sold in the Marshall Field’s and Mervyn’s dispositions were used to acquire replacementproperties that are being used in our business. $373 million of the gain related to the sold real propertieswas deferred for income tax purposes as allowed by Section 1031 of the Internal Revenue Code until thereplacement properties are disposed.
In 2006 the Financial Accounting Standards Board (FASB) issued FASB Interpretation No. 48 (FIN 48).FIN 48 prescribes the financial statement recognition and measurement criteria for tax positions taken in atax return, clarifies when tax benefits should be recorded and how they should be classified in financialstatements, and requires certain disclosures of uncertain tax matters. We will adopt the provisions of FIN 48at the beginning of fiscal 2007. We are presently evaluating the impact of the adoption of FIN 48 on ourresults of operations and financial position.
24. Other Non-Current Liabilities
February 3, January 28,(millions) 2007 2006Deferred compensation $ 645 $ 596Workers’ compensation and general liability 418 362Other 284 274Total $1,347 $1,232
We retain a substantial portion of the risk related to certain general liability and workers’ compensationclaims. Liabilities associated with these losses include estimates of both claims filed and losses incurred butnot yet reported. We estimate our ultimate cost based on analysis of historical data and actuarial estimates.General liability and workers’ compensation liabilities are recorded at our estimate of their net presentvalue.
25. Share Repurchase
In June 2004, our Board of Directors authorized the repurchase of $3 billion of our common stock. InNovember 2005, our Board increased the aggregate authorization by $2 billion, for a total authorization of$5 billion. Share repurchases for the last three years, repurchased primarily through open markettransactions, were as follows:
Share RepurchasesTotal Number of Average Price
(millions, except per share data) Shares Purchased Paid per Share Total Investment2004 28.4 $44.77 $1,2762005 23.1 51.88 1,1972006 19.5 50.16 977Total program-to-date 71.0 $48.56 $3,450
Of the shares reacquired in 2006, a portion was delivered upon settlement of prepaid forwardcontracts. The prepaid forward contracts settled in 2006 had a total cash investment of $76 million and anaggregate market value of $88 million at their respective settlement dates. The prepaid forward contractssettled in 2005 had a total cash investment of $65 million and an aggregate market value of $79 million attheir respective settlement dates. The prepaid forward contracts settled in 2004 had a total cash investmentof $17 million and an aggregate market value of $21 million at their respective settlement dates. Thesecontracts are among the investment vehicles used to reduce our economic exposure related to ournonqualified deferred compensation plans. The details of our long positions in prepaid forward contractshave been provided in Note 27.
39
PA
RT
II

26. Share-Based Compensation
We maintain a long-term incentive plan for key team members and non-employee members of ourBoard of Directors. Our long-term incentive plan allows us to grant equity-based compensation awards,including stock options, performance share unit awards, restricted stock unit awards, or a combination ofawards. A majority of granted awards are nonqualified stock options that vest annually in equal amountsover a four-year period and expire no later than 10 years after the grant date. Options granted to thenon-employee members of our Board of Directors become exercisable after one year and have a 10-yearterm. We have issued performance share or performance share unit awards annually since January 2003.These awards represent shares potentially issuable in the future based upon the attainment of performancecriteria including compound annual growth rates in revenue and EPS. In 2006, we issued restricted stockunits with three-year cliff vesting to our executive officers other than our chief executive officer. We alsoissued restricted stock and restricted stock units to our Board of Directors. The number of unissued commonshares reserved for future grants under the share-based compensation plans was 42,974,387 atFebruary 3, 2007 and 47,659,572 at January 28, 2006.
Share-Based Compensation AwardsStock Options
Total Outstanding Currently Exercisable
(number of options and Number Exercise Intrinsic Number Exercise Intrinsic Performance Restrictedshares in thousands) of Options Price (a) Value (b) of Options Price (a) Value (b) Share Units Stock Units
January 31, 2004 36,159 $28.28 $363 23,689 $24.48 $326 1,125 (c) —Granted 4,072 49.12 629 (d) —Canceled/forfeited (513) 35.32 (73) —Exercised (7,727) 20.95 (73) —
January 29, 2005 31,991 $32.59 $540 22,102 $28.79 $458 1,608 —Granted 4,057 53.94 597 (e) —Canceled/forfeited (691) 40.67 (252) —Exercised (6,643) 26.58 — —
January 28, 2006 28,714 $36.82 $505 19,229 $31.64 $438 1,953 —Granted 4,980 56.84 119 (e) 221Canceled/forfeited (607) 48.06 (177) —Exercised (5,177) 27.08 — —
February 3, 2007 27,910 $41.95 $558 17,659 $35.32 $470 1,895 (f) 221
(a) Weighted average.(b) Represents stock price appreciation subsequent to the grant date, in millions.(c) Awards will be earned based on performance during four years ending February 3, 2007 and February 2, 2008.(d) Awards will be earned based on performance during three years ending February 2, 2008.(e) Awards will be earned based on performance during three years ending January 31, 2009.(f) Approximately 32 percent of these performance share units, if and when earned, will be paid in cash or deferred through a credit to the
deferred compensation accounts of the participants in an amount equal to the value of any earned performance shares.
The Black-Scholes valuation model was used to estimate the fair value of the options at grant datebased on the assumptions noted in the following table. Volatility represents an average of market quotes forimplied volatility of 5.5-year options on Target common stock. The expected life is estimated based onanalysis of options already exercised and any foreseeable trends or changes in behavior. The risk-freeinterest rate is an interpolation of the relevant U.S. Treasury security maturities as of each applicable grant
40

date. The assumptions disclosed below represent a weighted average of the assumptions used for all of ourstock option grants throughout the year.
Valuation of Share-Based Compensation2006 2005 2004
Stock option valuation assumptions:Dividend yield 0.8% 0.7% 0.7%Volatility 23% 27% 22%Risk-free interest rate 4.7% 4.4% 3.8%Expected life in years 5.5 5.5 5.5
Grant date weighted average fair value $16.52 $16.85 $13.10Performance share units grant date weighted average fair value $49.98 $53.96 $49.43Restricted stock units grant date weighted average fair value $57.60 — —Compensation expense recognized in Statements of
Operations (millions) $ 99 $ 93 $ 60Related income tax benefit (millions) $ 39 $ 37 $ 23
Compensation realized by team members upon optionexercises (millions) $ 142 $ 180 $ 201Related income tax benefit (millions) $ 56 $ 71 $ 77
As of February 3, 2007, there was $116 million of total unrecognized compensation expense relatedto nonvested stock options. That cost is expected to be recognized over a weighted average period of1.5 years. The weighted average remaining life of currently exercisable options is 4.8 years, while totaloutstanding options have a weighted average remaining life of 6.3 years.
Holders of performance share units will receive shares of our common stock if we meet certain EPS andrevenue growth targets and the holders also satisfy service-based vesting requirements. Compensationexpense associated with outstanding performance share units is recorded over the life of the awards. Theamount of expense recorded each period is dependent upon our estimate of the number of shares that willultimately be issued and, for some awards, the current Target common stock price. Future compensationexpense for currently outstanding awards could range from a credit of $76 million for previously recognizedamounts up to a maximum of approximately $24 million of expense assuming full payout under alloutstanding awards.
Total unrecognized compensation expense related to restricted stock unit awards was $12 million as ofFebruary 3, 2007.
27. Defined Contribution Plans
Team members who meet certain eligibility requirements can participate in a defined contribution401(k) plan by investing up to 80 percent of their compensation, as limited by statute or regulation.Generally, we match 100 percent of each team member’s contribution up to 5 percent of totalcompensation. Our contribution to the plan is initially invested in Target common stock. These amounts arefree to be diversified by the team member immediately.
In addition, we maintain nonqualified, unfunded deferred compensation plans for approximately4,900 current and retired team members whose participation in our 401(k) plan is limited by statute orregulation. These team members choose from a menu of crediting rate alternatives that are the same as theinvestment choices in our 401(k) plan, including Target common stock. Through the end of 2005, wecredited an additional 2 percent per year to the accounts of all active participants, in part to recognize therisks inherent to their participation in a plan of this nature. Effective in 2006, the additional 2 percent peryear was credited only to the accounts of active participants who were not executive officers. We alsomaintain a nonqualified, unfunded deferred compensation plan that was frozen during 1996, covering 15current and 49 retired participants. In this plan deferred compensation earns returns tied to market levels ofinterest rates plus an additional 6 percent return, with a minimum of 12 percent and a maximum of20 percent, as determined by the plan’s terms.
We control some of our risk of offering the nonqualified plans through investing in vehicles, includingprepaid forward contracts in our own common stock, that offset a substantial portion of our economic
41
PA
RT
II

exposure to the returns of these plans. These investment vehicles are general corporate assets and aremarked-to-market with the related gains and losses recognized in the Consolidated Statements ofOperations in the period they occur. The total change in fair value for contracts indexed to our own commonstock recorded in earnings was pre-tax income of $37 million in 2006, $7 million in 2005 and $29 millionin 2004. During 2006, we invested approximately $111 million in such investment instruments, and theseinvestments are included in the Consolidated Statement of Cash Flows within other investing activities. Thecounterparty to these contracts may deliver Target common shares or cash to us at the settlement dates attheir discretion. At times, adjusting our position in these investment vehicles includes repurchasing shares ofTarget common stock, including shares delivered by counterparties when settling the forward contracts. In2006, 2005 and 2004, these repurchases totaled 1.6 million, 1.5 million and 0.5 million shares,respectively, and are included in the total share repurchases disclosed in Note 25.
Prepaid Forward Contracts on Target Common Stock(dollars in millions, except per share data)
Number of Shares Current Fair Value atContract PriceSettlement Date February 3, 2007 January 28, 2006 per Share February 3, 2007 January 28, 2006Nov. 2006 — 140,000 $41.70 $ — $ 7Jan. 2007 — 165,025 54.54 — 9Oct. 2007 257,000 257,000 38.95 16 14Oct. 2007 516,033 516,033 29.07 32 28Oct. 2007 228,276 228,276 43.81 14 12Oct. 2007 189,479 189,479 52.78 12 10Oct. 2007 250,000 250,000 53.41 15 14Oct. 2007 250,000 250,000 53.41 15 14Oct. 2007 1,025,400 — 48.76 64 —
2,716,188 1,995,813 $168 $108
Defined Contribution Plan Expenses(millions) 2006 2005 2004401(k) Defined Contribution Plan401(k) matching contributions $141 $118 $118
Nonqualified Deferred Compensation PlansBenefits expense $ 98 $ 64 $ 63Related investment income (68) (34) (40)Nonqualified plan net expense $ 30 $ 30 $ 23
In 2005 and 2004, certain retired executives accepted our offer to exchange our obligation to themunder certain frozen nonqualified plans for cash or deferrals in our current nonqualified deferredcompensation plan. These exchange transactions resulted in expense of $7 million and $17 million,respectively. We expect lower future expenses as a result of these transactions. There were no such exchangetransactions during 2006.
Expenses for Marshall Field’s and Mervyn’s team members are included in the table above to the extentwe retained the related assets and obligations of their plans subsequent to the 2004 divestiture of thosebusinesses.
28. Pension and Postretirement Health Care Benefits
We have qualified defined benefit pension plans covering all U.S. team members who meet age andservice requirements. We also have unfunded nonqualified pension plans for team members with qualifiedplan compensation restrictions. Benefits are provided based on years of service and team membercompensation. Upon retirement, team members also become eligible for certain health care benefits if theymeet minimum age and service requirements and agree to contribute a portion of the cost.
In 2005, certain nonqualified pension and survivor benefits owed to current officers were exchangedfor cash or deferrals in our current nonqualified deferred compensation plan, which resulted in expense of
42

$11 million. The effect of these exchange transactions is included in the pension tables below. There wereno such exchange transactions during 2006 or 2004.
In September 2006, the FASB issued SFAS No. 158, ‘‘Employers’ Accounting for Defined BenefitPension and Other Postretirement Plans, an amendment of FASB Statements No. 87, 88, 106, and 132(R)’’(SFAS 158). SFAS 158 requires plan sponsors of defined benefit pension and other postretirement benefitplans (collectively postretirement benefit plans) to: recognize the funded status of their postretirement benefitplans in the statement of financial position, measure the fair value of plan assets and benefit obligations asof the date of the fiscal year-end statement of financial position and provide additional disclosures. OnFebruary 3, 2007, we adopted the recognition and disclosure provisions of SFAS 158. The effect ofadopting SFAS 158 on our financial condition at February 3, 2007 has been included in the accompanyingconsolidated financial statements as described below. SFAS 158 did not have an effect on our consolidatedfinancial condition at January 28, 2006 or January 29, 2005. SFAS 158’s provisions regarding the changein the measurement date of postretirement benefit plans will require us to change our measurement datefrom October 31 to our fiscal year end date beginning with fiscal year 2008; however, we are currentlyevaluating whether we will early adopt the measurement date provisions in fiscal 2007.
SFAS 158 required us to recognize the funded status, which is the difference between the fair value ofplan assets and the projected benefit obligations, of our postretirement benefit plans in the February 3,2007 Consolidated Statement of Financial Position, with a corresponding adjustment to accumulated othercomprehensive loss, net of tax. The adjustment to accumulated other comprehensive loss at adoptionrepresents the net unrecognized actuarial losses and unrecognized prior service costs, both of which werepreviously netted against the plans’ funded status in our Consolidated Statements of Financial Positionpursuant to the provisions of SFAS No. 87, ‘‘Employers’ Accounting for Pensions’’ (SFAS 87). Theseamounts will be subsequently recognized as net periodic pension expense pursuant to our historicalaccounting policy for amortizing such amounts. Further, actuarial gains and losses that arise in subsequentperiods and are not recognized as net periodic pension expense in the same periods will be recognized as acomponent of other comprehensive income. Those amounts will be subsequently recognized as acomponent of net periodic pension expense on the same basis as the amounts recognized in accumulatedother comprehensive loss at adoption of SFAS 158.
The effects of adopting the provisions of SFAS 158 on our Consolidated Statement of Financial Positionat February 3, 2007 are presented in the following table. The adoption of SFAS 158 had no effect on ourConsolidated Statement of Operations for the year ended February 3, 2007, or for any prior period. Hadwe not been required to adopt SFAS 158 at February 3, 2007, we would have recognized an additionalminimum liability pursuant to the provisions of SFAS 87. The effect of recognizing the additional minimumliability is included in the table below in the column labeled ‘‘Prior to Adopting SFAS 158.’’
Pension and Postretirement Balances RecordedAt February 3, 2007
Prior to Adopting Effect of Adopting As Reported at(millions) SFAS 158 SFAS 158 February 3, 2007Other non-current assets $1,569 $(357) $1,212
Accrued and other current liabilities $2,742 $ 16 $2,758Deferred income taxes $ 729 $(152) $ 577Other non-current liabilities $1,334 $ 13 $1,347Accumulated other comprehensive loss $ (9) $(234) $ (243)
43
PA
RT
II

Obligations and Funded StatusPension Benefits Postretirement
Qualified Plans Nonqualified Plans Health Care Benefits
(millions) 2006 2005 2006 2005 2006 2005Change in Projected Benefit
ObligationBenefit obligation at beginning of
measurement period (a) $1,626 $1,515 $33 $34 $105 $107Service cost 82 66 1 1 3 2Interest cost 91 85 2 2 6 6Actuarial loss 32 55 5 4 13 3Participant contributions — — — — 9 17Benefits paid (76) (94) (5) (5) (21) (30)Plan amendments 9 (1) — (3) — —Benefit obligation at end of
measurement period $1,764 $1,626 $36 $33 $115 $105
(a) Measurement date is October 31 of each year.
Pension Benefits PostretirementQualified Plans Nonqualified Plans Health Care Benefits
(millions) 2006 2005 2006 2005 2006 2005Change in Plan AssetsFair value of plan assets at beginning
of measurement period $1,845 $1,698 $ — $ — $ — $ —Actual return on plan assets 303 174 — — — —Employer contribution 3 67 5 5 12 13Participant contributions — — — — 9 17Benefits paid (76) (94) (5) (5) (21) (30)Fair value of plan assets at end of
measurement period 2,075 1,845 — — — —Funded status $ 311 $ 219 $(36) $(33) $(115) $(105)
The net overfunded status of the qualified plans of $311 million at February 3, 2007 is recognized inthe accompanying Consolidated Statement of Financial Position as $325 million within other non-currentassets and $14 million within other non-current liabilities. The underfunded amount for the nonqualifiedplans, including the postretirement health care benefits liability, of $151 million at February 3, 2007 isrecognized as $16 million within accrued and other current liabilities and $135 million within othernon-current liabilities.
No plan assets are expected to be returned to us during 2007.Included in accumulated other comprehensive loss at February 3, 2007 are the following amounts that
have not yet been recognized in net periodic pension expense: unrecognized actuarial losses $425 million($259 million net of tax) partially offset by unrecognized prior service costs of $20 million ($12 million net oftax). The actuarial loss included in accumulated other comprehensive loss and expected to be recognized innet periodic pension expense during 2007 is $46 million ($28 million net of tax), which will be offset by priorservice cost of $4 million ($2 million net of tax).
2005 Reconciliation of Prepaid (Accrued) Pension and Benefit Expense to Funded Status
Pension Benefits PostretirementQualified Plans Nonqualified Plans Health Care Benefits
(millions) 2005 2005 2005Funded status $219 $(33) $(105)Unrecognized actuarial loss 561 16 8Unrecognized prior service cost (32) — —Net amount recognized $748 $(17) $ (97)
44

2005 Reconciliation of Amounts Recognized in Consolidated Statement of Financial Position
Pension Benefits PostretirementQualified Plans Nonqualified Plans Health Care Benefits
2005 2005 2005Prepaid pension expense $752 $ — $ —Accrued pension and benefit expense (9) (22) (97)Accumulated other comprehensive income 5 5 —Net amount recognized $748 $(17) $(97)
Net Pension and Postretirement Health Care Benefits Expense
Pension Benefits Postretirement Health Care Benefits
(millions) 2006 2005 2004 2006 2005 2004Service cost benefits earned during
the period $ 83 $ 67 $ 79 $ 3 $ 2 $ 3Interest cost on projected benefit
obligation 93 87 84 6 6 7Expected return on assets (141) (137) (122) — — —Recognized losses 47 43 36 1 1 1Recognized prior service cost (5) (5) (7) — — —Settlement/curtailment charges — — 1 — — (7)Total $ 77 $ 55 $ 71 $10 $ 9 $ 4
The amortization of prior service cost is determined using the straight-line method over the averageremaining service period of team members expected to receive benefits under the plan. As a result offreezing the benefits for Marshall Field’s and Mervyn’s team members at the time of their respectivedispositions and retaining the related assets and obligations of the plans, we were required to recordcurtailment charges in 2004. These charges are included in the gain on disposal of discontinued operationsin the Consolidated Statements of Operations.
Other information related to defined benefit pension plans is as follows:
(millions) 2006 2005Accumulated benefit obligation (ABO) for all plans (a) $1,674 $1,534Projected benefit obligation for pension plans with an ABO in excess of plan assets (b) $ 51 $ 46Total ABO for pension plans with an ABO in excess of plan assets $ 44 $ 41Fair value of plan assets for pension plans with an ABO in excess of plan assets $ 2 $ 3
(a) The present value of benefits earned to date assuming no future salary growth.(b) The present value of benefits earned to date by plan participants, including the effect of assumed future salary increases.
Assumptions
Weighted average assumptions used to determine benefit obligations at October 31:
PostretirementPension Benefits Health Care Benefits
2006 2005 2006 2005Discount rate 5.80% 5.75% 5.80% 5.75%Average assumed rate of compensation increase 4.00% 3.50% n/a n/a
45
PA
RT
II

Weighted average assumptions used to determine net periodic benefit expense for years endedOctober 31:
Pension Benefits Postretirement Health Care Benefits
2006 2005 2004 2006 2005 2004Discount rate 5.75% 5.75% 6.25% 5.75% 5.75% 6.25%Expected long-term rate of return on
plan assets 8.00% 8.00% 8.00% n/a n/a n/aAverage assumed rate of
compensation increase 3.50% 2.75% 3.25% n/a n/a n/a
The discount rate used to measure net periodic benefit expense each year is the rate as of the beginningof the year (i.e., the prior measurement date). With an essentially stable asset allocation over the followingtime periods, our annualized rate of return on qualified plans’ assets has averaged 10.6 percent,10.1 percent and 10.9 percent for the 5-year, 10-year and 15-year periods, respectively, endingOctober 31, 2006.
An increase in the cost of covered health care benefits of 9 percent was assumed for 2006. In 2007,the rate is assumed to be 8 percent for non-Medicare eligible individuals and 9 percent for Medicareeligible individuals. Both rates will be reduced to 5 percent in 2012 and thereafter.
A one percent change in assumed health care cost trend rates would have the following effects:
(millions) 1% Increase 1% DecreaseEffect on total of service and interest cost components of net periodic postretirement
health care benefit expense $ — $—Effect on the health care component of the postretirement benefit obligation $ 9 $(8)
Additional Information
Our pension plan weighted average asset allocations at October 31, 2006 and 2005 by assetcategory were as follows:
Asset Category2006 2005
Domestic equity securities 35% 36%International equity securities 20 20Debt securities 26 26Other 19 18Total 100% 100%
Our asset allocation strategy targets 35 percent in domestic equity securities, 20 percent ininternational equity securities, 25 percent in debt securities and 20 percent in other assets. Equity securitiesinclude our common stock in amounts substantially less than 1 percent of total plan assets at October 31,2006 and 2005. Other assets include private equity, mezzanine and distressed debt, timber-related assetsand less than a 5 percent allocation to real estate. Our expected long-term rate of return assumptions as ofOctober 31, 2006 were 8.5 percent, 8.5 percent, 5 percent and 10 percent for domestic equity securities,international equity securities, debt securities and other assets, respectively.
Contributions
Given the qualified pension plan’s funded position, we are not required to make any contributions in2007, although we may choose to make discretionary contributions of up to $100 million. We expect tomake contributions in the range of $5 million to $15 million to our postretirement health care benefit plan in2007.
46

Estimated Future Benefit Payments
Benefit payments by the plans, which reflect expected future service as appropriate, are expected to bepaid as follows:
PostretirementPension Health Care
(millions) Benefits Benefits2007 $ 83 $122008 94 132009 99 132010 104 142011 110 142012-2016 653 78
29. Quarterly Results (Unaudited)
Due to the seasonal nature of our business, fourth quarter operating results typically represent asubstantially larger share of total year revenues and earnings because they include our peak sales periodfrom Thanksgiving through the end of December. We follow the same accounting policies for preparingquarterly and annual financial data. The table below summarizes quarterly results for 2006 and 2005:
First Quarter Second Quarter Third Quarter Fourth Quarter Total Year(millions, except per sharedata) 2006 2005 2006 2005 2006 2005 2006 2005 2006 2005
Total revenues $12,863 $11,477 $13,347 $11,990 $13,570 $12,206 $19,710 $16,947 $59,490 $52,620Gross margin $ 4,020 $ 3,615 $ 4,273 $ 3,839 $ 4,265 $ 3,829 $ 5,920 $ 5,061 $18,479 $16,344Net earnings $ 554 $ 494 $ 609 $ 540 $ 506 $ 435 $ 1,119 $ 939 $ 2,787 $ 2,408Basic earnings per share (a) $ .64 $ .56 $ .71 $ .61 $ .59 $ .49 $ 1.30 $ 1.07 $ 3.23 $ 2.73Diluted earnings per share (a) $ .63 $ .55 $ .70 $ .61 $ .59 $ .49 $ 1.29 $ 1.06 $ 3.21 $ 2.71Dividends declared per share $ .10 $ .08 $ .12 $ .10 $ .12 $ .10 $ .12 $ .10 $ .46 $ .38Closing common stock price
High $ 55.80 $ 52.50 $ 54.71 $ 59.98 $ 59.72 $ 57.80 $ 62.35 $ 58.85 $ 62.35 $ 59.98Low $ 50.85 $ 46.41 $ 45.53 $ 46.28 $ 45.28 $ 50.84 $ 56.03 $ 52.61 $ 45.28 $ 46.28
(a) Per share amounts are computed independently for each of the quarters presented. The sum of the quarters may not equal the total yearamount due to the impact of changes in average quarterly shares outstanding.
47
PA
RT
II

Item 9. Changes in and Disagreements with Accountants on Accounting and FinancialDisclosure.
Not Applicable.
Item 9A. Controls and Procedures.
As of the end of the period covered by this annual report, we conducted an evaluation, undersupervision and with the participation of management, including the chief executive officer and chieffinancial officer, of the effectiveness of the design and operation of our disclosure controls and procedurespursuant to Rules 13a-15 and 15d-15 of the Securities Exchange Act of 1934, as amended (Exchange Act).Based upon that evaluation, our chief executive officer and chief financial officer concluded that ourdisclosure controls and procedures are effective. Disclosure controls and procedures are defined byRules 13a-15(e) and 15d-15(e) of the Exchange Act as controls and other procedures that are designed toensure that information required to be disclosed by us in reports filed with the SEC under the Exchange Act isrecorded, processed, summarized and reported within the time periods specified in the SEC’s rules andforms. Disclosure controls and procedures include, without limitation, controls and procedures designed toensure that information required to be disclosed by us in reports filed under the Exchange Act isaccumulated and communicated to our management, including our principal executive and principalfinancial officers, or person performing similar functions, as appropriate to allow timely decisions regardingrequired disclosure.
There were no changes in our internal control over financial reporting during the fourth quarter of fiscalyear 2006 that have materially affected, or are reasonably likely to materially affect, our internal controlover financial reporting.
For the Report of Management on Internal Control and the Report of Independent Registered PublicAccounting Firm on Internal Control over Financial Reporting, see Item 8, Financial Statements andSupplementary Data.
Item 9B. Other Information.
Not applicable.
48

PA R T I I I
Certain information required by Part III is incorporated by reference from Target’s definitive ProxyStatement to be filed on or about April 9, 2007. Except for those portions specifically incorporated in thisForm 10-K by reference to Target’s Proxy Statement, no other portions of the Proxy Statement are deemed tobe filed as part of this Form 10-K.
Item 10. Directors, Executive Officers and Corporate Governance.
Election of Directors, Section 16(a) Beneficial Ownership Reporting Compliance, AdditionalInformation – Business Ethics and Conduct and General Information About the Board of Directors – BoardMeetings and Committees, of Target’s Proxy Statement to be filed on or about April 9, 2007, areincorporated herein by reference. See also Item 4A, Executive Officers of Part I hereof.
Item 11. Executive Compensation.
Executive and Director Compensation, of Target’s Proxy Statement to be filed on or about April 9,2007, is incorporated herein by reference.
Item 12. Security Ownership of Certain Beneficial Owners and Management and RelatedStockholder Matters.
Equity Compensation Plan InformationNumber of Securities Number of Securities
to be Issued Upon Weighted Average Remaining Available forExercise of Exercise Price of Future Issuance Under
Outstanding Options, Outstanding Equity Compensation PlansWarrants and Rights Options, Warrants as of February 3, 2007
as of February 3, and Rights as of (Excluding Securities2007 February 3, 2007 Reflected in Column (a))
Plan Category (a) (b) (c)Equity compensation plans approved by
security holders 30,025,530(1) $41.95 42,974,387Equity compensation plans not approved
by security holders — — —Total 30,025,530 $41.95 42,974,387
(1) This amount includes 2,115,595 performance shares and RSU shares potentially issuable under our Long-Term Incentive Plan. According tothe existing plan provisions and compensation deferral elections, approximately 32 percent of these potentially issuable performance shares,if and when earned, will be paid in cash or deferred through a credit to the deferred compensation accounts of the participants in an amountequal to the value of any earned performance shares. The actual number of performance shares to be issued, cash to be paid, or credits to bemade to deferred compensation accounts, if any, depends on our financial performance over a period of time. Performance shares do nothave an exercise price and thus they have been excluded from the weighted average exercise price calculation in column (b).
Beneficial Ownership of Certain Shareholders, of Target’s Proxy Statement to be filed on or aboutApril 9, 2007, is incorporated herein by reference.
Item 13. Certain Relationships and Related Transactions, and Director Independence.
Certain Relationships and General Information About the Board of Directors – Director Independence,of Target’s Proxy Statement to be filed on or about April 9, 2007, are incorporated herein by reference.
Item 14. Principal Accountant Fees and Services.
Audit and Non-audit Fees, of Target’s Proxy Statement to be filed on or about April 9, 2007, isincorporated herein by reference.
49
PA
RT
III

PA R T I V
Item 15. Exhibits and Financial Statement Schedules.
The following information required under this item is filed as part of this report:
a) Financial Statements
Consolidated Statements of Operations for the Years Ended February 3, 2007, January 28, 2006and January 29, 2005
Consolidated Statements of Financial Position at February 3, 2007 and January 28, 2006Consolidated Statements of Cash Flows for the Years Ended February 3, 2007, January 28, 2006
and January 29, 2005Consolidated Statements of Shareholders’ Investment for the Years Ended February 3, 2007,
January 28, 2006 and January 29, 2005Notes to Consolidated Financial StatementsReport of Independent Registered Public Accounting Firm on Consolidated Financial Statements
Target, through its special purpose subsidiary, Target Receivables Corporation (TRC), has entered intoa securitization transaction under which it transfers, on an ongoing basis, substantially all of its credit cardreceivables to a trust. Separate financial information is filed for TRC in its separate Annual Report onForm 10-K.
Financial Statement Schedules
For the Years Ended February 3, 2007, January 28, 2006 and January 29, 2005:
II – Valuation and Qualifying Accounts
Other schedules have not been included either because they are not applicable or because theinformation is included elsewhere in this Report.
b) Exhibits
(3)A. Restated Articles of Incorporation (as amended January 9, 2002) (1)B. By-Laws (as amended through November 11, 1998) (2)
(4)A. Indenture, dated August 4, 2000 between Target Corporation and Bank One Trust Company,N.A. (3)
B. Registrant agrees to furnish to the Commission on request copies of other instruments withrespect to long-term debt.
(10)A. * Executive Short-Term Incentive Plan (4)C. * Amended and Restated Director Stock Option Plan of 1995D. * Supplemental Pension Plan I (5)E. * Amended and Restated Executive Long-Term Incentive Plan of 1981F. * Supplemental Pension Plan II (6)
G. * Supplemental Pension Plan III (7)H. * Amended and Restated Deferred Compensation Plan Senior Management GroupI. * Amended and Restated Deferred Compensation Plan DirectorsJ. * Income Continuance Policy Statement (8)K. * SMG Income Continuance Policy Statement (9)L. * Amended and Restated SMG Executive Deferred Compensation Plan
50

N. * Amended and Restated Director Deferred Compensation PlanO. * Executive Excess Long-Term Disability Plan (10)P. * Amended and Restated Long-Term Incentive PlanR. * Director Retirement Program (11)S. * Deferred Compensation Trust AgreementT. Five-year credit agreement dated as of June 9, 2005 among Target Corporation, Bank of
America, N.A. as Administrative Agent and the Banks listed therein (12)(12) Statements re: Computations of Ratios(21) List of Subsidiaries(23) Consent of Independent Registered Public Accounting Firm(24) Powers of Attorney
(31)A. Certification of the Chief Executive Officer Pursuant to Section 302 of the Sarbanes-Oxley Act of2002
(31)B. Certification of the Chief Financial Officer Pursuant to Section 302 of the Sarbanes-Oxley Act of2002
(32)A. Certification of the Chief Executive Officer Pursuant to Section 18 U.S.C. Section 1350 Pursuantto Section 906 of the Sarbanes-Oxley Act of 2002
(32)B. Certification of the Chief Financial Officer Pursuant to Section 18 U.S.C. Section 1350 Pursuantto Section 906 of the Sarbanes-Oxley Act of 2002
(99)A. Risk Factors and Cautionary Statements Relating to Forward-Looking Information
Copies of exhibits will be furnished upon written request and payment of Registrant’s reasonableexpenses in furnishing the exhibits.
* Management contract or compensation plan or arrangement required to be filed as an exhibit to this Form 10-K.(1) Incorporated by reference to Exhibit (3)A to Target’s Form 10-K Report for the year ended February 2, 2002.(2) Incorporated by reference to Exhibit (3)(ii) to Target’s Form 10-Q Report for the quarter ended October 31, 1998.(3) Incorporated by reference to Exhibit 4.1 to Target’s Form 8-K Report filed August 10, 2000.(4) Incorporated by reference to Exhibit (10)A to Target’s Form 10-K Report for the year ended February 2, 2002.(5) Incorporated by reference to Exhibit 10(E) to Target’s Form 10-K Report for the year ended February 1, 1997, and Amendment thereto,
incorporated by reference to Exhibit (10)G to Target’s Form 10-Q Report for the quarter ended November 2, 2002.(6) Incorporated by reference to Exhibit (10)G to Target’s Form 10-K Report for the year ended February 1, 1997, and Amendment thereto,
incorporated by reference to Exhibit (10)G to Target’s Form 10-Q Report for the quarter ended November 2, 2002.(7) Incorporated by reference to Exhibit (10)H to Target’s Form 10-K Report for the year ended February 1, 1997, and Amendment thereto,
incorporated by reference to Exhibit (10)G to Target’s Form 10-Q Report for the quarter ended November 2, 2002.(8) Incorporated by reference to Exhibit (10)K to Target’s Form 10-K Report for the year ended January 30, 1999.(9) Incorporated by reference to Exhibit (10)L to Target’s Form 10-K Report for the year ended January 30, 1999.
(10) Incorporated by reference to Exhibit (10)O to Target’s Form 10-K Report for the year ended February 3, 2001.(11) Incorporated by reference to Exhibit (10)O to Target’s Form 10-K Report for the year ended January 29, 2005.(12) Incorporated by reference to Exhibit (10) to Target’s Form 10-Q Report for the quarter ended July 29, 2005.
51
PA
RT
IV

1APR200416064753
1APR200416063806
1APR200416064753
1APR200416064753
SIGNATURES
Pursuant to the requirements of Section 13 or 15(d) of the Securities Exchange Act of 1934, Target hasduly caused this report to be signed on its behalf by the undersigned, thereunto duly authorized.
TARGET CORPORATION
By:
Douglas A. ScovannerExecutive Vice President, Chief Financial
Dated: March 15, 2007 Officer and Chief Accounting Officer
Pursuant to the requirements of the Securities Exchange Act of 1934, the report has been signed belowby the following persons on behalf of Target and in the capacities and on the dates indicated.
Robert J. UlrichDated: March 15, 2007 Chairman of the Board and Chief Executive Officer
Douglas A. ScovannerExecutive Vice President, Chief Financial Officer and
Dated: March 15, 2007 Chief Accounting Officer
ROXANNE S. AUSTIN STEPHEN W. SANGERCALVIN DARDEN WARREN R. STALEYJAMES A. JOHNSON GREGG W. STEINHAFELRICHARD M. KOVACEVICH GEORGE W. TAMKEMARY E. MINNICK SOLOMON D. TRUJILLOANNE M. MULCAHY ROBERT J. ULRICH Directors
Douglas A. Scovanner, by signing his name hereto, does hereby sign this document pursuant to powersof attorney duly executed by the Directors named, filed with the Securities and Exchange Commission onbehalf of such Directors, all in the capacities and on the date stated.
By:
Douglas A. ScovannerDated: March 15, 2007 Attorney-in-fact
52
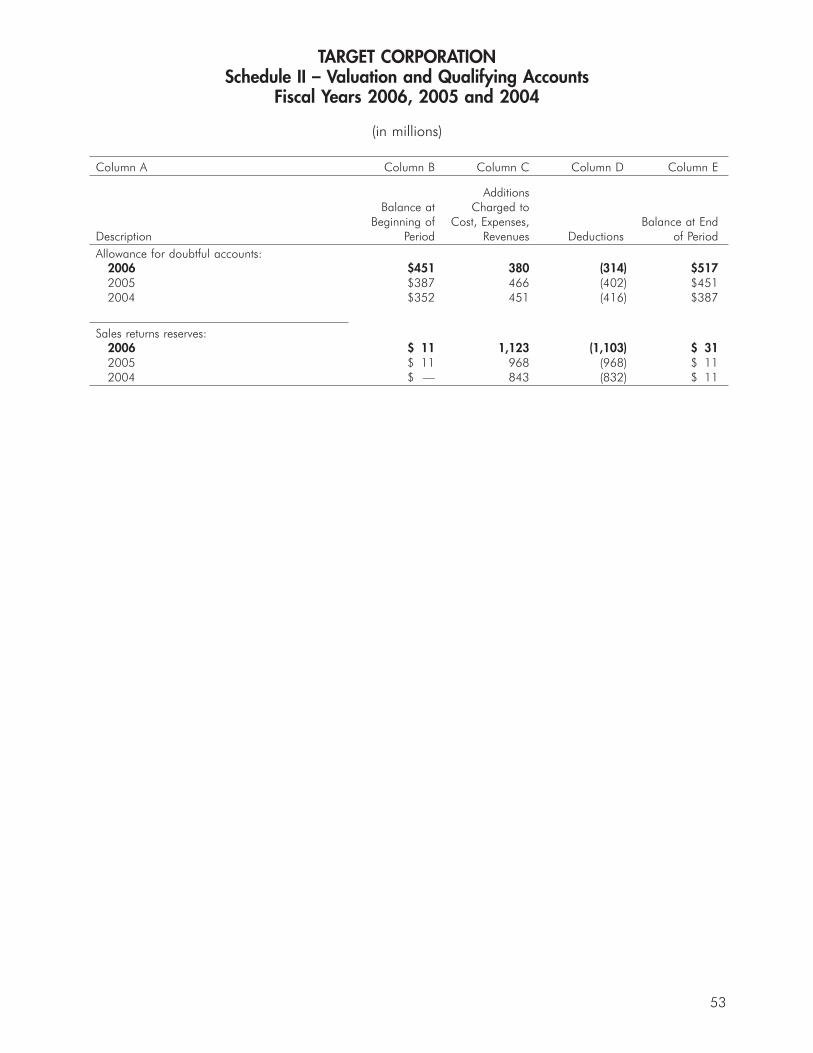
TARGET CORPORATIONSchedule II – Valuation and Qualifying Accounts
Fiscal Years 2006, 2005 and 2004
(in millions)
Column A Column B Column C Column D Column E
AdditionsBalance at Charged to
Beginning of Cost, Expenses, Balance at EndDescription Period Revenues Deductions of PeriodAllowance for doubtful accounts:
2006 $451 380 (314) $5172005 $387 466 (402) $4512004 $352 451 (416) $387
Sales returns reserves:2006 $ 11 1,123 (1,103) $ 312005 $ 11 968 (968) $ 112004 $ — 843 (832) $ 11
53

Exhibit Index
Exhibit Description Manner of Filing
(3)A. Restated Articles of Incorporation (as amended January 9, Incorporated by Reference2002)
(3)B. By-Laws (as amended through November 11, 1998) Incorporated by Reference(4)A. Indenture, dated August 4, 2000 between Target Corporation Incorporated by Reference
and Bank One Trust Company, N.A.(10)A. Executive Short-Term Incentive Plan Incorporated by Reference(10)C. Amended and Restated Director Stock Option Plan of 1995 Filed Electronically(10)D. Supplemental Pension Plan I Incorporated by Reference(10)E. Amended and Restated Executive Long-Term Incentive Plan of Filed Electronically
1981(10)F. Supplemental Pension Plan II Incorporated by Reference(10)G. Supplemental Pension Plan III Incorporated by Reference(10)H. Amended and Restated Deferred Compensation Plan Senior Filed Electronically
Management Group(10)I. Amended and Restated Deferred Compensation Plan Directors Filed Electronically(10)J. Income Continuance Policy Statement Incorporated by Reference(10)K. SMG Income Continuance Policy Statement Incorporated by Reference(10)L. Amended and Restated SMG Executive Deferred Filed Electronically
Compensation Plan(10)N. Amended and Restated Director Deferred Compensation Plan Filed Electronically(10)O. Executive Excess Long-Term Disability Plan Incorporated by Reference(10)P. Amended and Restated Long-Term Incentive Plan Filed Electronically(10)R. Director Retirement Program Incorporated by Reference(10)S. Deferred Compensation Trust Agreement Filed Electronically(10)T. Five-year credit agreement dated as of June 9, 2005 among Incorporated by Reference
Target Corporation, Bank of America, N.A. as AdministrativeAgent and the Banks listed therein
(12) Statements re: Computations of Ratios Filed Electronically(21) List of Subsidiaries Filed Electronically(23) Consent of Independent Registered Public Accounting Firm Filed Electronically(24) Powers of Attorney Filed Electronically(31)A. Certification of the Chief Executive Officer Pursuant to Section Filed Electronically
302 of the Sarbanes-Oxley Act of 2002(31)B. Certification of the Chief Financial Officer Pursuant to Section Filed Electronically
302 of the Sarbanes-Oxley Act of 2002(32)A. Certification of the Chief Executive Officer Pursuant to Section Filed Electronically
18 U.S.C. Section 1350 Pursuant to Section 906 of theSarbanes-Oxley Act of 2002
(32)B. Certification of the Chief Financial Officer Pursuant to Section Filed Electronically18 U.S.C. Section 1350 Pursuant to Section 906 of theSarbanes-Oxley Act of 2002
(99)A. Risk Factors and Cautionary Statements Relating to Forward- Filed ElectronicallyLooking Information
54

Exhibit 12
TARGET CORPORATIONComputations of Ratios of Earnings to Fixed Charges for each of the
Five Years in the Period Ended February 3, 2007
Fiscal Year Ended
Feb. 3, Jan. 28, Jan. 29, Jan. 31, Feb. 1,(millions of dollars) 2007 2006 2005 2004 2003Ratio of Earnings to Fixed Charges:Earnings:
Net earnings $2,787 $2,408 $ 3,198 $1,809 $1,623Earnings from discontinued operations, net of
taxes — — (75) (190) (247)Gain on disposal of discontinued operations, net
of taxes — — (1,238) — —Provision for income taxes 1,710 1,452 1,146 984 851
Earnings from continuing operations beforeincome taxes 4,497 3,860 3,031 2,603 2,227
Fixed charges:Interest expense 646 532 607 569 618Interest portion of rental expense 88 84 85 68 48
Total fixed charges 734 616 692 637 666Plus: Amortization of capitalized interest 2 — — — —Less: Capitalized interest (49) (42) (18) (8) (13)
Fixed charges in earnings 687 574 674 629 653Earnings available for fixed charges $5,184 $4,434 $ 3,705 $3,232 $2,880Ratio of earnings to fixed charges 7.06 7.21 5.35 5.07 4.33
Note: Computation is based on continuing operations.
55

SHAREHOLDER INFORMATION
Annual Meeting Transfer Agent, Registrar and Dividend Disbursing AgentThe Annual Meeting of Shareholders is scheduled for May 24, Mellon Investor Services2007, at 1:00 p.m. EDT at the Target store located at 3100West 117th Street, Cleveland, Ohio 44111.
Shareholder Information Trustee, Employee Savings 401(k) and Pension PlansQuarterly and annual shareholder information, including the State Street Bank and Trust CompanyForm 10-Q and Form 10-K Annual Report, which are filedwith the Securities and Exchange Commission, is available at Stock Exchange Listingsno charge to shareholders. To obtain copies of these Trading symbol: TGTmaterials, you may send an e-mail to New York Stock [email protected], or write to: Vice President,Investor Relations (TPN-1448), Target Corporation, 1000 Shareholder AssistanceNicollet Mall, Minneapolis, Minnesota 55403. These
For assistance regarding individual stock records, lostdocuments as well as other information about Targetcertificates, name or address changes, dividend or taxCorporation, including our Business Conduct Guide,questions, call Mellon Investor Services at 1-800-794-9871,Corporate Governance Profile, Corporate Responsibilityaccess their website at www.melloninvestor.com, or write to:Report and Board of Director Committee PositionMellon Investor Services, P.O. Box 3315, South Hackensack,Descriptions, are also available on the internet atNJ 07606-1915.www.Target.com/investors.
Sales Information Direct Stock Purchase/Dividend Reinvestment PlanComments regarding our sales results are provided Mellon Investor Services administers a direct serviceperiodically throughout the year on a recorded telephone investment plan that allows interested investors to purchasemessage accessible by calling 612-761-6500. Our current Target Corporation stock directly, rather than through asales disclosure practice includes a sales recording on the day broker, and become a registered shareholder of the company.of our monthly sales release and one mid-month sales update. The program offers many features including dividend
reinvestment. For detailed information regarding thisprogram, call Mellon Investor Services toll free atOfficer Certifications1-800-842-7629 or write to: Mellon Investor Services, P.O.In accordance with the rules of the New York Stock ExchangeBox 3338, South Hackensack, NJ 07606-1938.(NYSE), the Chief Executive Officer of Target submitted the
required annual certification to the NYSE regarding theNYSE’s Corporate Governance listing standards on May 25,2006. Target’s Form 10-K for its fiscal year ended February 3,2007, as filed with the U.S. Securities and ExchangeCommission, includes the certifications of Target’s ChiefExecutive Officer and Chief Financial Officer required bySection 302 of the Sarbanes Oxley Act of 2002.
Archer Farms, the Bullseye Design, the Bullseye Dog, Channel Red, Choxie, Circo, ClearRx, Expect More. Pay Less., Embark, Fast, Fun and Friendly,Gilligan & O’Malley, Global Bazaar, Go International, Kool Toyz, Market Pantry, Merona, Perfect Pieces, ProSpirit, Ready. Sit. Read!, REDcard, RoomEssentials, Safe City, SuperTarget, Take Charge of Education, Target & Blue, Target Credit Card, Target House, Target Limited Edition, TargetPharmacy, Target Rewards, Target, Trutech, Wine Cube and Xhilaration are trademarks of Target Brands, Inc.
C9 by Champion is a trademark of HBI Branded Apparel Enterprises, LLC. ChefMate is a registered trademark of Herald Housewares Limited.Cherokee is a registered trademark of Cherokee Inc. DSN Retailing Today is a registered trademark of Lebhar-Friedman, Inc. Eddie Bauer is aregistered trademark of Eddie Bauer, Inc. Fieldcrest is a registered trademark of Official Pillowtex, LLC. Isaac Mizrahi is a trademark of IM ReadyMade LLC. Kitchen Essentials by Calphalon is a registered trademark of Calphalon Corporation. Liz Lange for Target is a registered trademark ofElizabeth Lange, Inc. Michael Graves Design is a trademark of Michael Graves, Architect, P.A. Mossimo is a registered trademark of Mossimo, Inc.Newsweek is a registered trademark of Weekly Publications, Inc. Nick and Nora is a registered trademark of American Genius & Co., Inc. GenuineKids by Osh Kosh is a registered trademark of Oshkosh B’Gosh Inc. Paul & Joe is a registered trademark of Sofrane (France Corp.) Rafe is aregistered trademark of Rafe Totengco. Rolling Stone is a registered trademark of Straight Arrow Publishers Company, L.P. St. Jude Children’sResearch Hospital is a registered trademark of St. Jude Children’s Research Hospital. Smith & Hawken is a registered trademark of Smith &Hawken, Ltd. Simply Shabby Chic is a trademark of Rachel Ashwell Designs, Inc. Sonia Kashuk is a trademark of Sonia Kashuk, Inc. Starbucks is atrademark of Starbucks U.S. Brands, LLC. Sutton & Dodge is a registered trademark of Hormel Foods, LLC. Thomas O’Brien is a registeredtrademark of TOB International Marketing Corp. Visa is a trademark of Visa International Service Association. Waverly is a registered trademark of F.Schumacher & Co. Woolrich is a registered trademark of John Rich & Sons Investment Holding Company. All rights reserved.
Copyright 2007 Target

Roxanne S. AustinFormer Executive Vice President, HughesElectronics Corporation andFormer President and Chief Operating Officer of itssubsidiary, DIRECTV, Inc.(1) (2) (5) (7)
Calvin DardenChairman, Atlanta Beltline Project(1) (3) (4) (6) (7)
James A. JohnsonVice Chairman, Perseus, LLC(1) (3) (4) (7)
Richard M. KovacevichChairman and Chief Executive Officer, Wells Fargo & Company(1) (2) (6) (7)
Mary E. MinnickFormer Executive Vice President, President, Marketing, Strategy & Innovation, The Coca-Cola Company(1) (4) (5) (7)
Continuing Directors Executive OfficersTimothy R. BaerExecutive Vice President, General Counsel andCorporate Secretary
Michael R. FrancisExecutive Vice President,Marketing
John D. GriffithExecutive Vice President,Property Development
Jodeen A. KozlakExecutive Vice President, Human Resources
Troy H. RischExecutive Vice President,Stores
Janet M. SchalkExecutive Vice President,Technology Services and Chief Information Officer
Douglas A. ScovannerExecutive Vice President andChief Financial Officer
Terrence J. ScullyPresident, Target Financial Services
Gregg W. SteinhafelPresident
Robert J. UlrichChairman and Chief Executive Officer
Other OfficersPatricia AdamsSenior Vice President,Merchandising
Stacia J. AndersenPresident, Target Sourcing Services
Carmela BatacchiSenior Vice President,Target Sourcing Services,Regions II and III
Bryan BergSenior Vice President, Region I
Directors & Management
Anne M. MulcahyChairman and Chief Executive Officer, Xerox Corporation(1) (2) (5) (7)
Stephen W. SangerChairman and Chief Executive Officer, General Mills, Inc.(1) (3) (6) (7)
Gregg W. SteinhafelPresident, Target
George W. TamkePartner, Clayton, Dubilier & Rice, Inc.(1) (2) (5) (6) (7)
Solomon D. TrujilloChief Executive Officer, Telstra Corp.(1) (3) (4) (7)
Robert J. UlrichChairman and Chief Executive Officer, Target(1)
(1) Executive Committee(2) Audit Committee(3) Compensation Committee(4) Corporate Responsibility Committee(5) Finance Committee(6) Nominating Committee(7) Corporate Governance Committee
Bob ChangSenior Vice President,Target Sourcing Services,Region I
Gregory J. DupplerSenior Vice President,Merchandising
Nathan K. GarvisVice President, Government Affairs
Corey HaalandVice President and Treasurer
Derek L. JenkinsSenior Vice President, Region IV
Susan D. KahnVice President, Communications
Sid KeswaniSenior Vice President, Region III
Richard N. MaguireSenior Vice President,Merchandise Planning
Annette MillerSenior Vice President,Target Sourcing Services
Dale NitschkePresident, Target.com
Tina M. SchielSenior Vice President, Region II
Gina SprengerSenior Vice President,Merchandising
Mitchell L. StoverSenior Vice President,Distribution
Kathryn A. TesijaSenior Vice President,Merchandising
Laysha WardVice President, Community Relations
Jane P. WindmeierSenior Vice President, Finance
©2007 Target Stores. The Bullseye Design, the Bullseye Dog and Target are trademarks of TargetBrands, Inc. All rights reserved. Printed on paper with 10% post-consumer fiber.8536428

1000 Nicollet Mall Minneapolis, MN 55403 612.304.6073 Target.com