Expansion of summer to spring in the Western Mediterranean
26
Expansion of summer to spring in the Western Mediterranean Agustí Jansà (1), Víctor Homar (1), Romu Romero (1), José A. Guijarro (2), Climent Ramis (1) (1) Departament Física/Universitat de les Illes Balears, Palma (2) Delegació a Illes Balears/Agència Estatal de Meteorologia, Palma [email protected] REUNIÓN PREDIMED 2014A. 5-6 Junio 2014 Sala Seminarios Física. 3r piso Mateu Orfila. UIB.
-
Upload
susanna-rufus -
Category
Documents
-
view
22 -
download
1
description
REUNIÓN PREDIMED 2014A. 5-6 Junio 2014 Sala Seminarios Física. 3r piso Mateu Orfila. UIB. Expansion of summer to spring in the Western Mediterranean. Agustí Jansà (1), Víctor Homar (1), Romu Romero (1), José A. Guijarro (2), Climent Ramis (1) - PowerPoint PPT Presentation
Transcript of Expansion of summer to spring in the Western Mediterranean
Expansion of summer to spring in
the Western Mediterranean
Agustí Jansà (1), Víctor Homar (1), Romu Romero (1), José A. Guijarro (2), Climent Ramis (1)
(1) Departament Física/Universitat de les Illes Balears, Palma
(2) Delegació a Illes Balears/Agència Estatal de Meteorologia, [email protected]
REUNIÓN PREDIMED 2014A. 5-6 Junio 2014Sala Seminarios Física. 3r piso Mateu Orfila. UIB.

Scheme of work:
Climatic mediterraneity: Mediterranean summer vs. subtropical anticylonic domain
Surface temperature trends: May/June maximum
Local correlation between surface temperature and 500 hPa geopotential height: seasonal differences
Regional structure of 500 hPa geopotential height trends: seasonality
Particular study of May/June: detection and evolution of main patterns, contribution of them to surface temperature trend
Discussion: Tropical region, Hadley cells and mediterraneity expansion
Indication of insufficiency of climatic models simulations
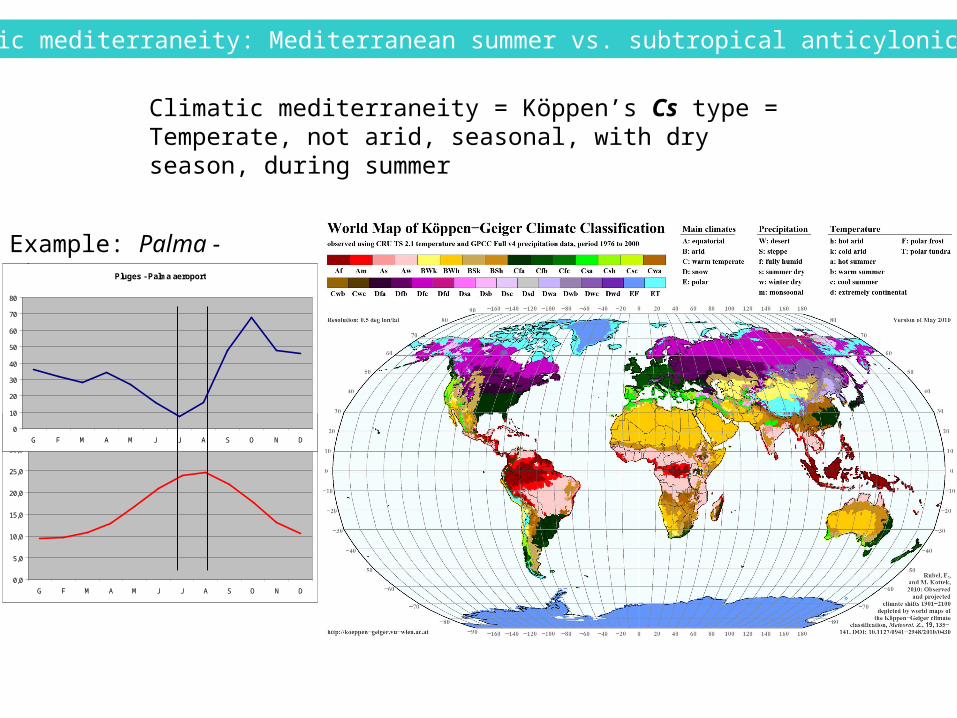
Climatic mediterraneity = Köppen’s Cs type = Temperate, not arid, seasonal, with dry season, during summer
Example: Palma - airport
Temperatures - Palma aeroport
0,0
5,0
10,0
15,0
20,0
25,0
30,0
G F M A M J J A S O N D
Pluges - Palma aeroport
0
10
20
30
40
50
60
70
80
G F M A M J J A S O N D
Climatic mediterraneity: Mediterranean summer vs. subtropical anticylonic domain
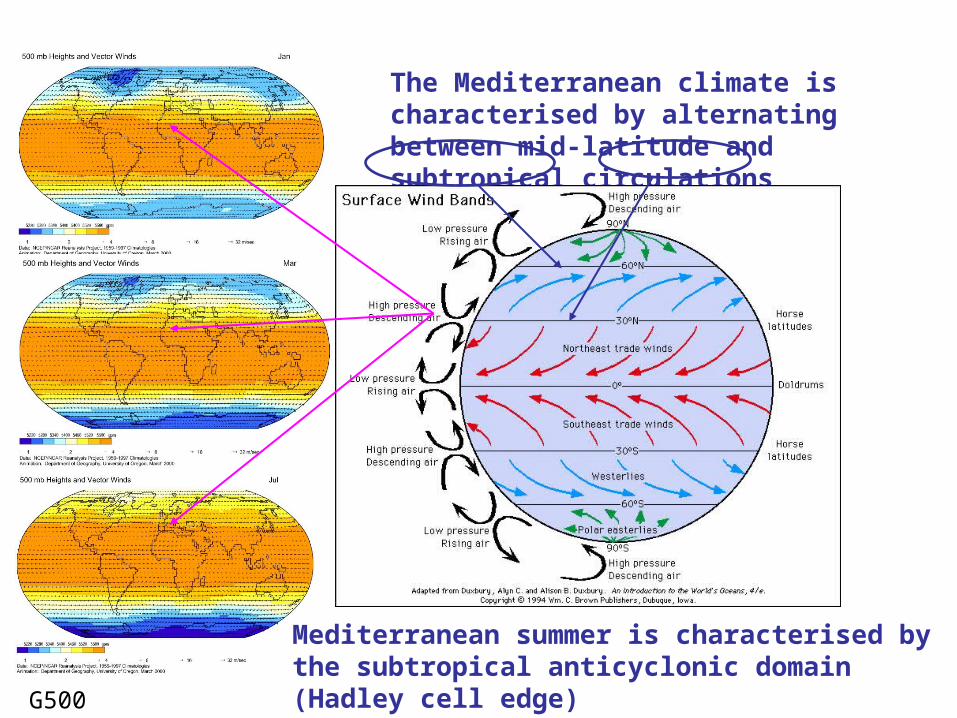
The Mediterranean climate is characterised by alternating between mid-latitude and subtropical circulations
G500
Mediterranean summer is characterised by the subtropical anticyclonic domain (Hadley cell edge)
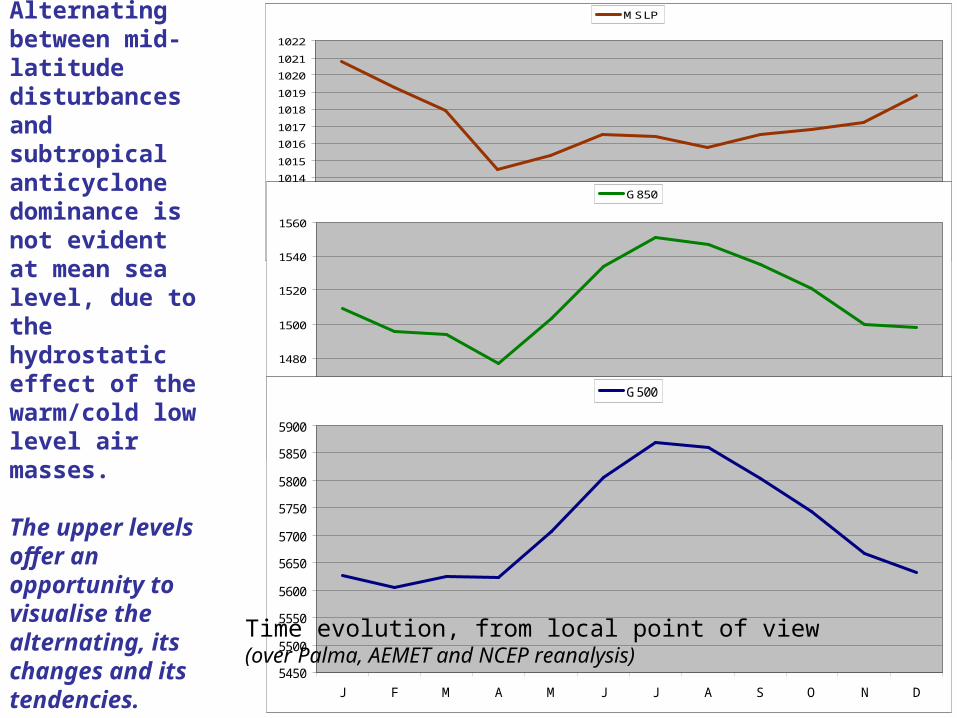
Alternating between mid-latitude disturbances and subtropical anticyclone dominance is not evident at mean sea level, due to the hydrostatic effect of the warm/cold low level air masses.
The upper levels offer an opportunity to visualise the alternating, its changes and its tendencies.
1011
1012
1013
1014
1015
1016
1017
1018
1019
1020
1021
1022
J F M A M J J A S O N D
MSLP
1440
1460
1480
1500
1520
1540
1560
J F M A M J J A S O N D
G850
5450
5500
5550
5600
5650
5700
5750
5800
5850
5900
J F M A M J J A S O N D
G500
Time evolution, from local point of view (over Palma, AEMET and NCEP reanalysis)

The 2D streamfunction could provide a better way to explore the time evolution of the Hadley cell extension and external edge position.
Northern Hadley cell (NHC)
Southern Hadley cell (SHC)
When taking planetary zonal averages, the NHC tends to disappear during the northern hemisphere summer (effect of the monsoon circulation)
Dimas & Wallace, 2003
We want to repeat the right figure, but for a zonal average only referred to Iberian/W-Mediterranean longitudes

Surface temperature trends: May/June maximum
Temperatures mitjanes anuals Aeroport Palma(sèrie original, sense homogeneitzar)
13,5
14
14,5
15
15,5
16
16,5
17
17,5
18
1973
1975
1977
1979
1981
1983
1985
1987
1989
1991
1993
1995
1997
1999
2001
2003
2005
2007
2009
2011
1973-2009 1973-2012 Lineal (1973-2009) Lineal (1973-2012)
Tendències mensuals (ºC/any) Aeroport Palma 1973-2009(sèrie original, sense homogeneitzar)
0
0,01
0,02
0,03
0,04
0,05
0,06
0,07
0,08
0,09
0,1
G F M A M J J A S O N D
Tendències anuals (ºC/dècada):1973-09: 0,541973-12: 0,49
Cu0 = Catalunya (excepte Ebre)Cu4 = GuadianaCu5 = GuadalquivirCu6 = SudCu7 = SeguraCu8 = Xúcar / ValènciaCu9 = EbreCuB = Illes BalearsPalma-Airport Temperature trend
Homogenised series 1973-1012
-0,20
0,00
0,20
0,40
0,60
0,80
1,00
1,20
J F M A M J J A S O N D
Trend TX
Pval TX
Trend TN
Pval TN
Trend TM

Palma-Airport Temp. trend
0,00
0,10
0,20
0,30
0,40
0,50
0,60
0,70
0,80
JF MA MJ JA SO ND
Local correlation between surface temperature and 500 hPa geopotential height: seasonal differences
G500 trend - NCEP - 1973-2012
-0,60
-0,40
-0,20
0,00
0,20
0,40
0,60
0,80
1,00
1,20
1,40
JF MA MJ JA SO ND
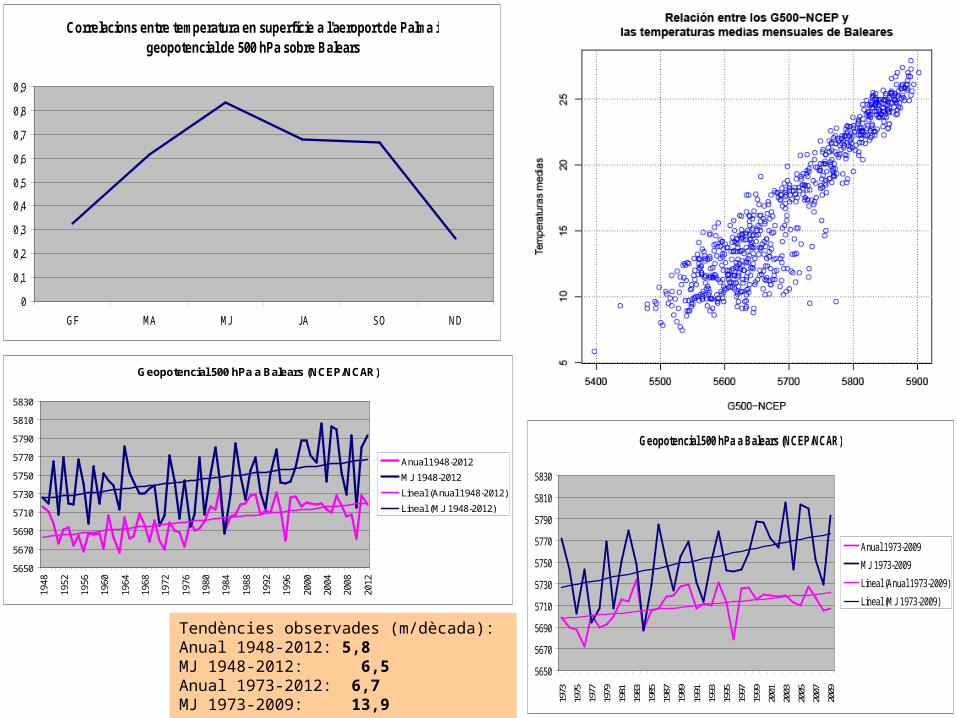
Correlacions entre temperatura en superfície a l'aeroport de Palma i geopotencial de 500 hPa sobre Balears
0
0,1
0,2
0,3
0,4
0,5
0,6
0,7
0,8
0,9
GF MA MJ JA SO ND
Geopotencial 500 hPa a Balears (NCEP/NCAR)
5650
5670
5690
5710
5730
5750
5770
5790
5810
5830
1948
1952
1956
1960
1964
1968
1972
1976
1980
1984
1988
1992
1996
2000
2004
2008
2012
Anual 1948-2012
MJ 1948-2012
Lineal (Anual 1948-2012)
Lineal (MJ 1948-2012)
Geopotencial 500 hPa a Balears (NCEP/NCAR)
5650
5670
5690
5710
5730
5750
5770
5790
5810
5830
1973
1975
1977
1979
1981
1983
1985
1987
1989
1991
1993
1995
1997
1999
2001
2003
2005
2007
2009
Anual 1973-2009
MJ 1973-2009
Lineal (Anual 1973-2009)
Lineal (MJ 1973-2009)
Tendències observades (m/dècada):Anual 1948-2012: 5,8MJ 1948-2012: 6,5Anual 1973-2012: 6,7MJ 1973-2009: 13,9

Maig/juny: temperatura en superfície i geopotencial de 500 hPaSelecció d’anys singulars
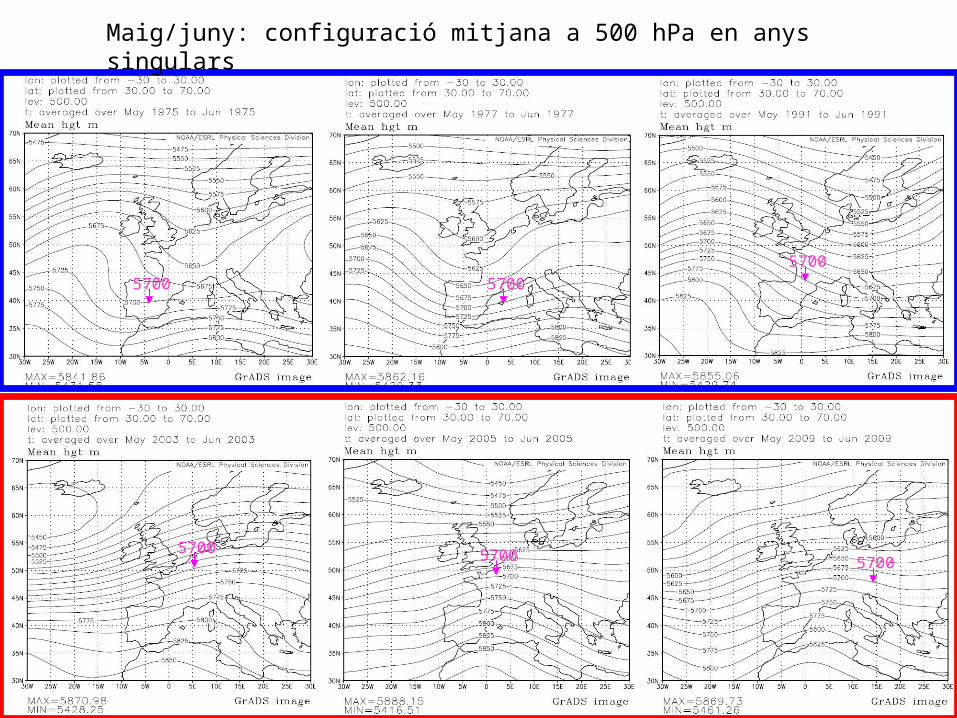
Maig/juny: configuració mitjana a 500 hPa en anys singulars
5700 5700
5700
5700 5700 5700

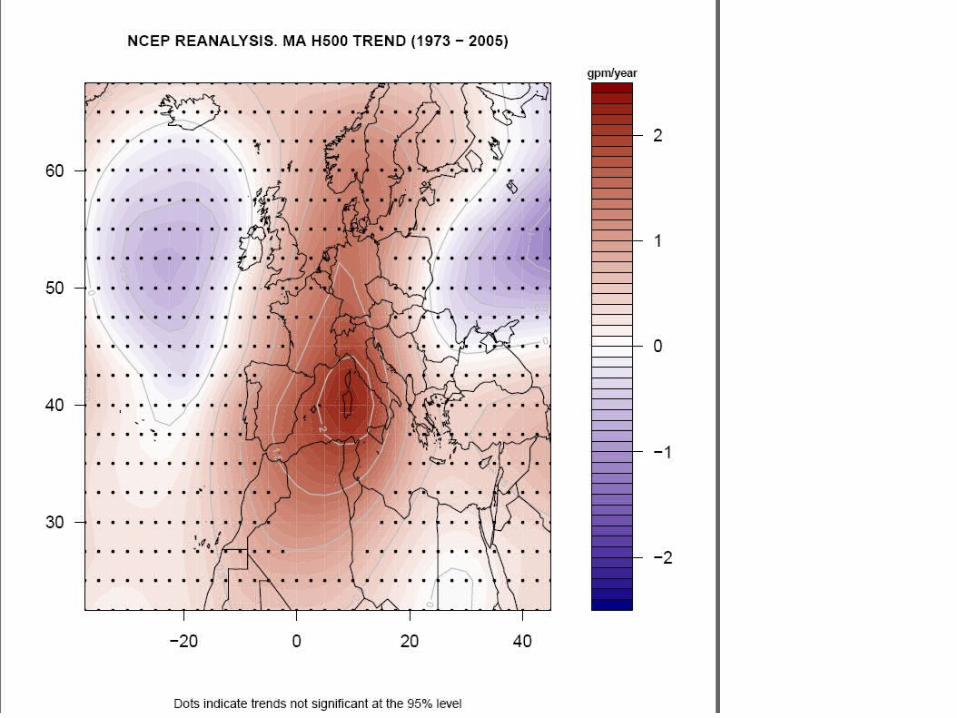
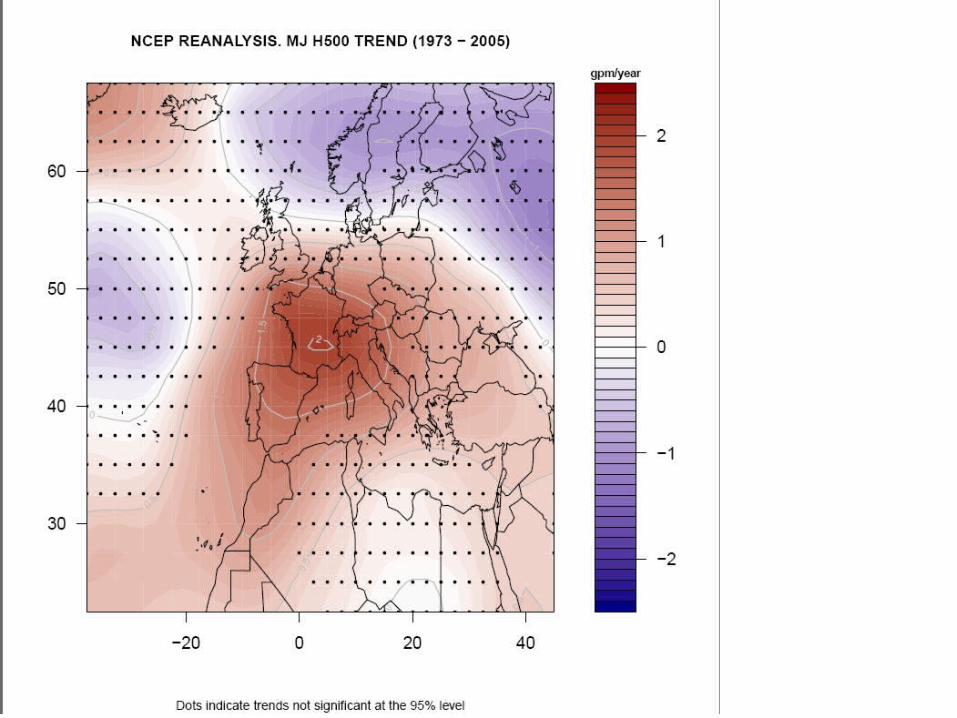
Regional structure of 500 hPa geopotential height trends: seasonality

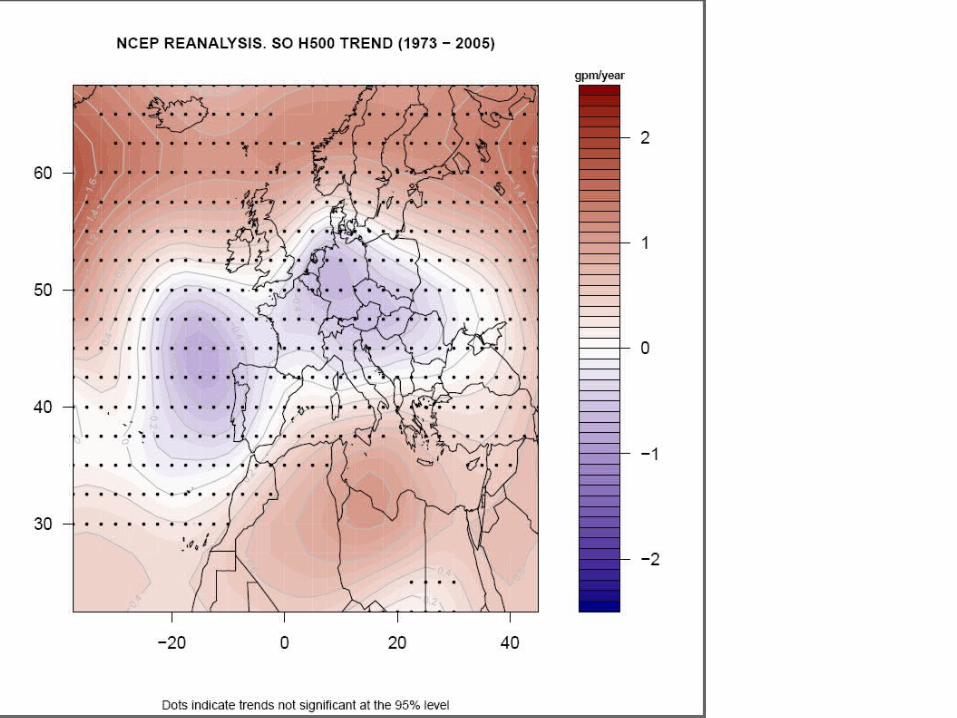
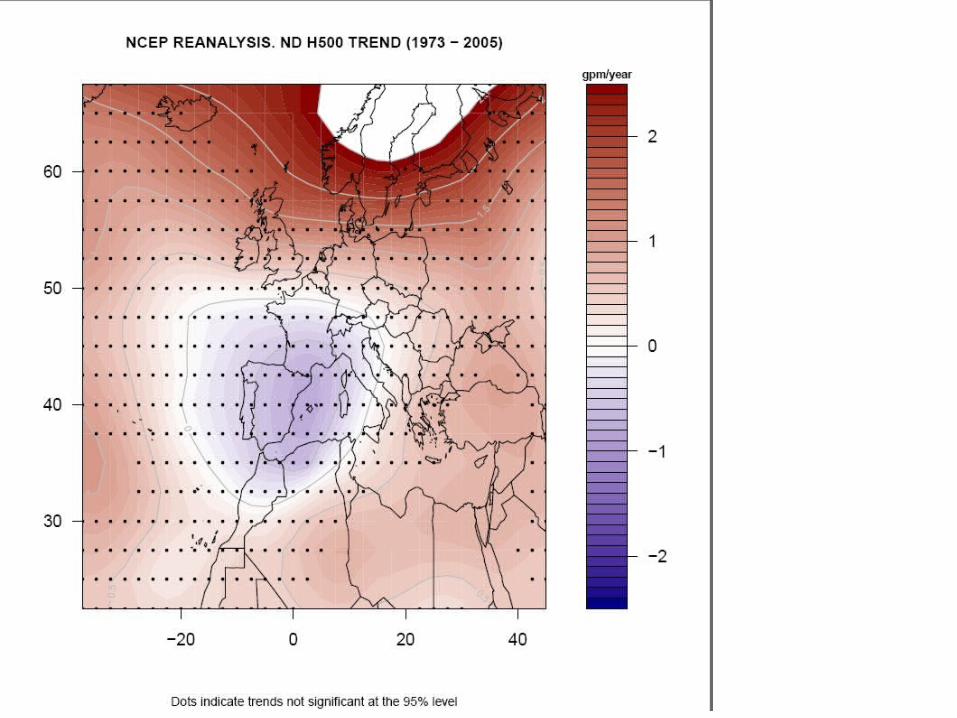
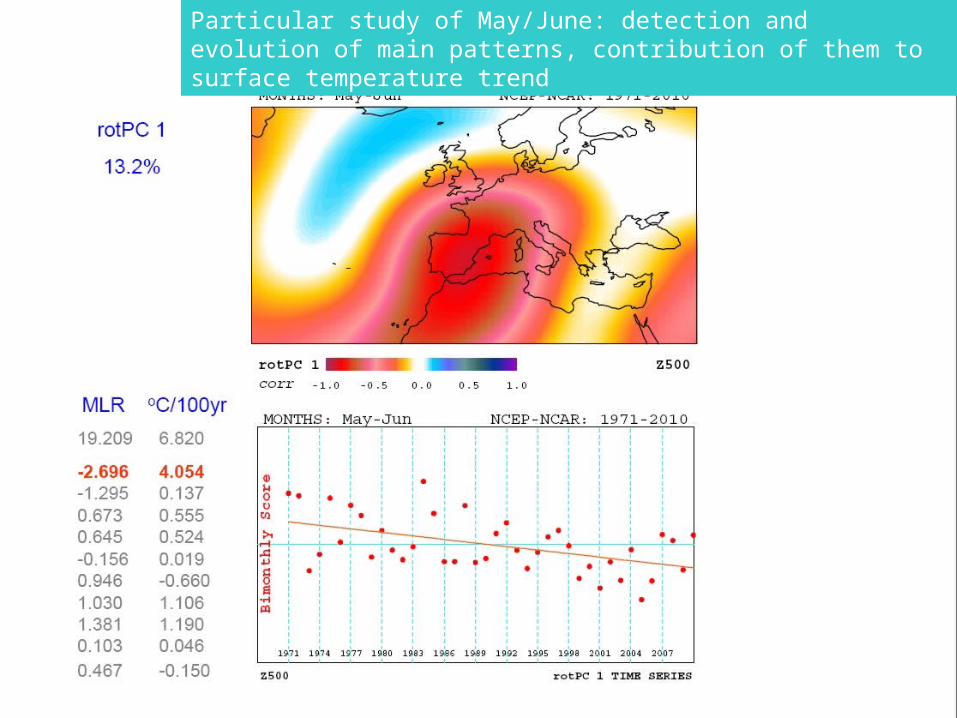
Particular study of May/June: detection and evolution of main patterns, contribution of them to surface temperature trend

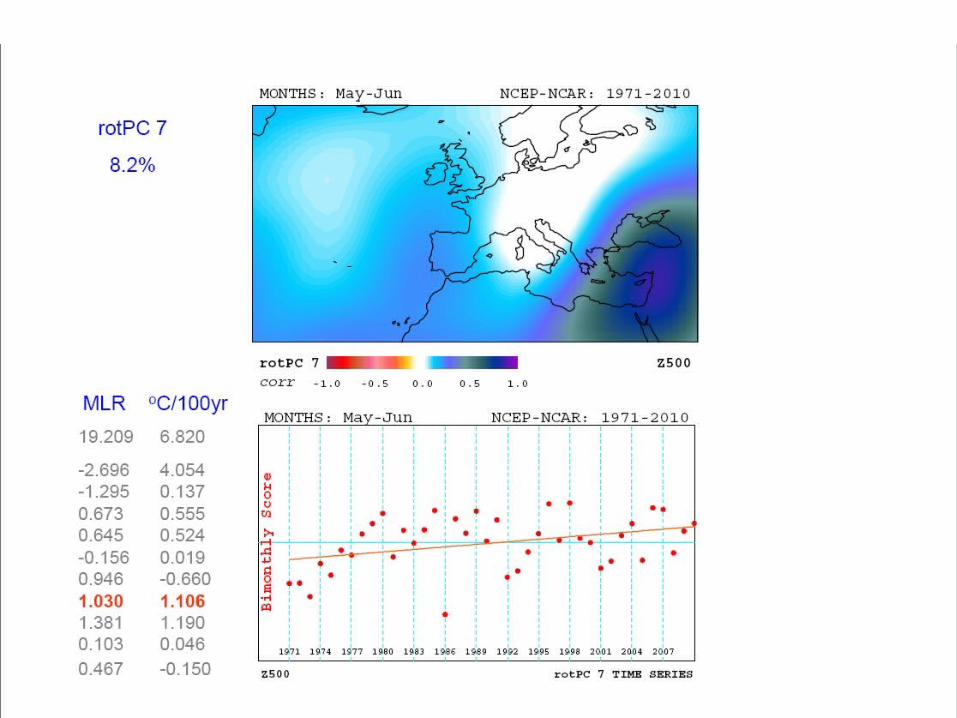
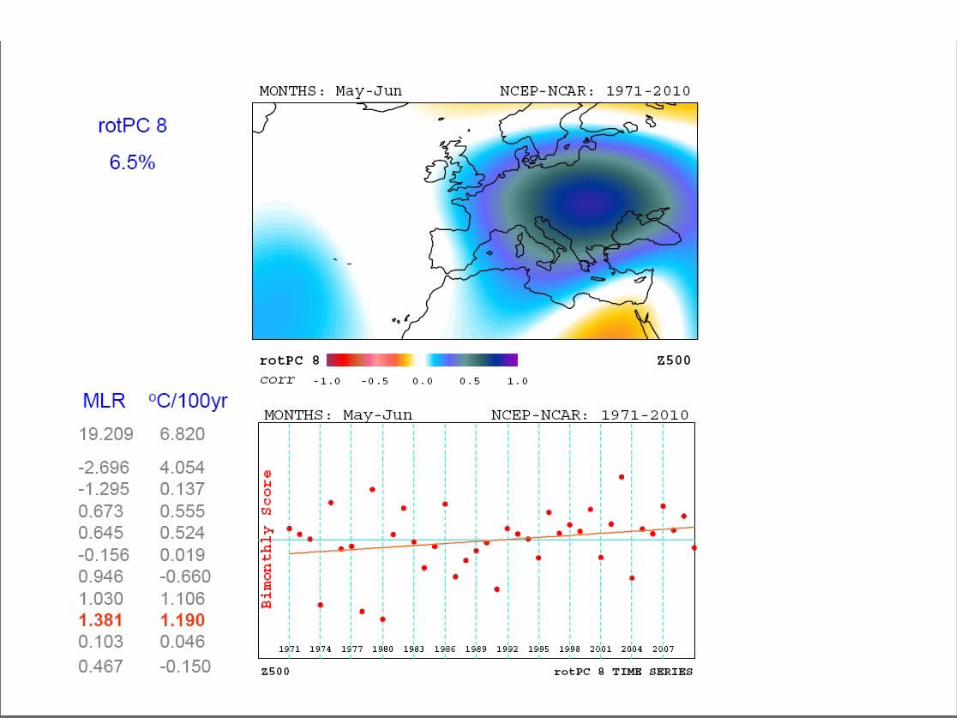
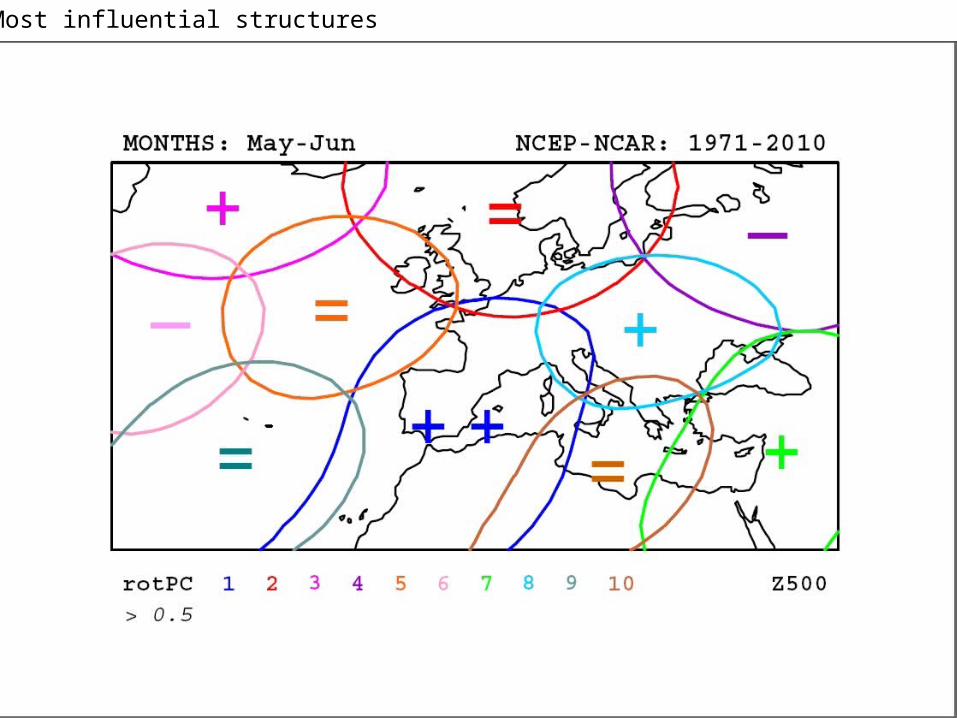
Most influential structures

Goodness of the MLR model (surface local temperature as regional PC scores function)

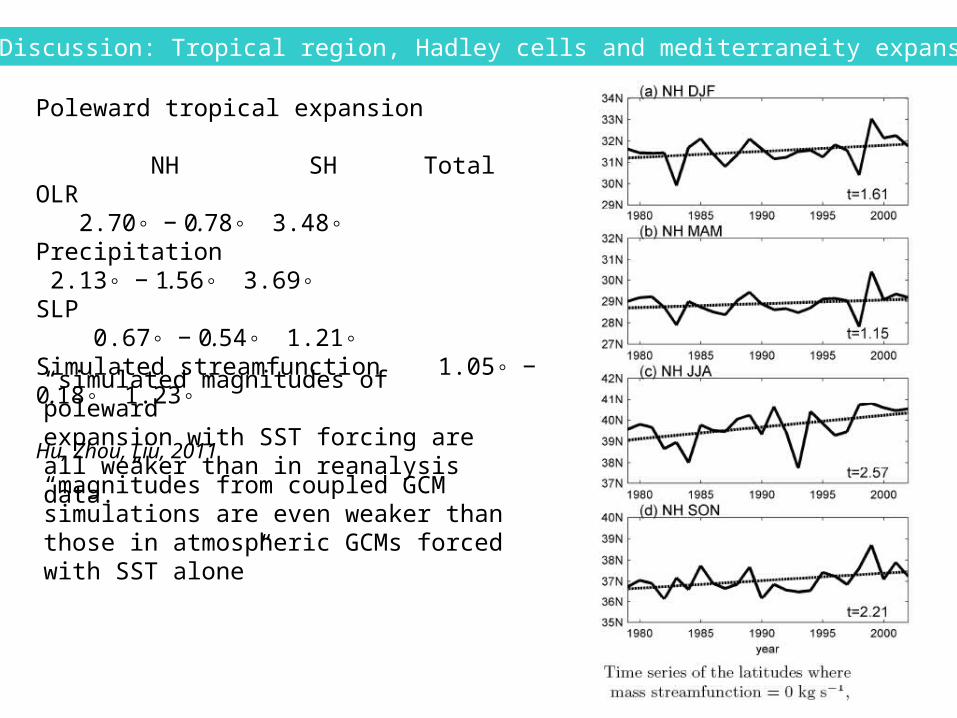
Discussion: Tropical region, Hadley cells and mediterraneity expansion
Poleward tropical expansion NH SH TotalOLR 2.70◦ − 0.78◦ 3.48◦Precipitation 2.13◦ − 1.56◦ 3.69◦SLP 0.67◦ − 0.54◦ 1.21◦Simulated streamfunction 1.05◦ − 0.18◦ 1.23◦
Hu, Zhou, Liu, 2011
“simulated magnitudes of polewardexpansion with SST forcing are all weaker than in reanalysis data.”
“magnitudes from coupled GCM simulations are even weaker than those in atmospheric GCMs forced with SST alone”

GF, MJ, JAModel HadGEM2 – Experiments-Històric 1951-2005-RCP45 2006-2100-RCP85 2006-2100
Indication of insufficiency of climatic models simulations
Dins de l’experiment històric, per al subperíode 1973-2005, només són significatives algunes tendències de HadGEM2: MJ JA SO 0,53 0,41 0,71