Exhibit ES-1. Synergistic Strategy: Potential Cumulative Savings Compared with Current Baseline...
12
Exhibit ES-1. Synergistic Strategy: Potential Cumulative Savings Compared with Current Baseline Projection, 2013–2023 Total NHE Federal governmen t State and local governmen t Private employers Household s 2013– 2018 –$686 –$345 –$84 –$66 –$192 2013– 2023 –$2,004 –$1,036 –$242 –$189 –$537 Net impact in $ billions* Note: NHE = national health expenditures. * Net effect does NOT include potential impact of spending target policy. Source: Estimates by Actuarial Research Corporation for The Commonwealth Fund. Current baseline projection assumes that the cuts to Medicare physician fees under the sustainable growth rate (SGR) formula are repealed and basic physician fees are instead increased by 1% in 2013 and held constant from 2014 through 2023.
-
Upload
britton-casey -
Category
Documents
-
view
215 -
download
1
Transcript of Exhibit ES-1. Synergistic Strategy: Potential Cumulative Savings Compared with Current Baseline...

Exhibit ES-1. Synergistic Strategy: Potential Cumulative Savings Compared with Current Baseline Projection, 2013–2023
Total NHEFederal
government
State and local
governmentPrivate
employers Households
2013–2018 –$686 –$345 –$84 –$66 –$192
2013–2023 –$2,004 –$1,036 –$242 –$189 –$537
Net impact in $ billions*
Note: NHE = national health expenditures.* Net effect does NOT include potential impact of spending target policy.Source: Estimates by Actuarial Research Corporation for The Commonwealth Fund. Current baseline projection assumes that the cuts to Medicare physician fees under the sustainable growth rate (SGR) formula are repealed and basic physician fees are instead increased by 1% in 2013 and held constant from 2014 through 2023.

Exhibit ES-2. Projected National Health Expenditures (NHE), 2013–2023: Potential Impact of Synergistic Strategy
2013 2014 2015 2016 2017 2018 2019 2020 2021 2022 2023$0.0
$1.0
$2.0
$3.0
$4.0
$5.0
$6.0
$2.9
$5.5Current baseline NHE projection
Projected NHE net of policy impacts
NHE as percentage of GDP— Current projection: 18% in 2013→21% in 2023 Under unified strategy: 18% in 2013→19% in 2023 Cumulative NHE savings under synergistic strategy: $2.0 trillion
$5.1
Note: GDP = gross domestic product.Source: Estimates by Actuarial Research Corporation for The Commonwealth Fund. Current baseline projection assumes that the cuts to Medicare physician fees under the sustainable growth rate (SGR) formula are repealed and basic physician fees are instead increased by 1% in 2013 and held constant from 2014 through 2023.
NHE in $ trillions

Exhibit ES-3. Cumulative Net Impacts of Payment, Engaging Consumers, and Systemwide Policies, 2013–2023
2013–2018
2019–2023
Total 2013–2023
Payment reforms to pay for value to accelerate delivery system innovation
–$442 –$891 –$1,333
Policies to expand and encourage high-value choices by consumers
–$41 –$148 –$189
Systemwide actions to improve how health care markets function*
–$203 –$279 –$481
Cumulative NHE impact** –$686 –$1,318 –$2,004
Note: NHE = national health expenditures. Totals may not add because of rounding.* Net savings do NOT include the potential impact of the spending target policy. Malpractice savings included in impact of provider payment reforms.** Cumulative NHE impact adjusted for potential overlap of component policy impacts.Source: Estimates by Actuarial Research Corporation for The Commonwealth Fund. Current baseline projection assumes that the cuts to Medicare physician fees under the sustainable growth rate (SGR) formula are repealed and basic physician fees are instead increased by 1% in 2013 and held constant from 2014 through 2023.
Net savings in $ billions

Exhibit 1. International Comparison of Spending on Health, 1980–2010
19
80
19
82
19
84
19
86
19
88
19
90
19
92
19
94
19
96
19
98
20
00
20
02
20
04
20
06
20
08
20
10
$0
$1,000
$2,000
$3,000
$4,000
$5,000
$6,000
$7,000
$8,000
US
SWIZ
NETH
CAN
GER
FR
AUS
UK
JPN
Average spending on healthper capita ($US PPP)
19
80
19
82
19
84
19
86
19
88
19
90
19
92
19
94
19
96
19
98
20
00
20
02
20
04
20
06
20
08
20
10
0
2
4
6
8
10
12
14
16
18
USNETHFRGERCANSWIZUKJPNAUS
Total health expenditures aspercent of GDP
Notes: PPP = purchasing power parity; GDP = gross domestic product.Source: Commonwealth Fund, based on OECD Health Data 2012.
4

Exhibit 2. Medicare Spending per Enrollee Projected to Increase More Slowly Than Private Insurance Spending per Enrollee and GDP per Capita
2008–2011 2011–2021 (projected)0.0
1.0
2.0
3.0
4.0
5.0
6.0
7.0
8.0
2.7
3.83.7
2.9
GDP per capita
Medicare spending per enrollee
Employer-sponsored insurance spending per enrollee
4.5 4.6
Annual rate of growth (percent)
Note: GDP = gross domestic product.Source: CMS Office of the Actuary, National Health Expenditure Projections, 2011–2021, updated June 2012.

2001
2003
2005
2007
2009
2011
2013
2015
2017
2019
2021
0
5
10
15
20
25
30
35
1213
1517
18 18 18 18 1920
22 23 24 25 26 26 27 28 29 30 31
1999
2000
2001
2002
2003
2004
2005
2006
2007
2008
2009
2010
2011
2012
0
25
50
75
100
125
150
175
200Health insurance premiums
Workers' contribution to premiums
Workers' earnings
Overall inflation
Exhibit 3. Premiums Rising Faster Than Inflation and Wages
Sources: (left) Kaiser Family Foundation/Health Research and Educational Trust, Employer Health Benefits Annual Surveys, 1999–2012; (right) authors’ estimates based on CPS ASEC 2001–12, Kaiser/HRET 2001–12, CMS OACT 2012–21.
Projected average family premium as a percentage of median family income,
2013–2021
Cumulative changes in insurance premiums and workers’ earnings,
1999–2012
Percent Percent
180%
47%
38%
Projected
172%
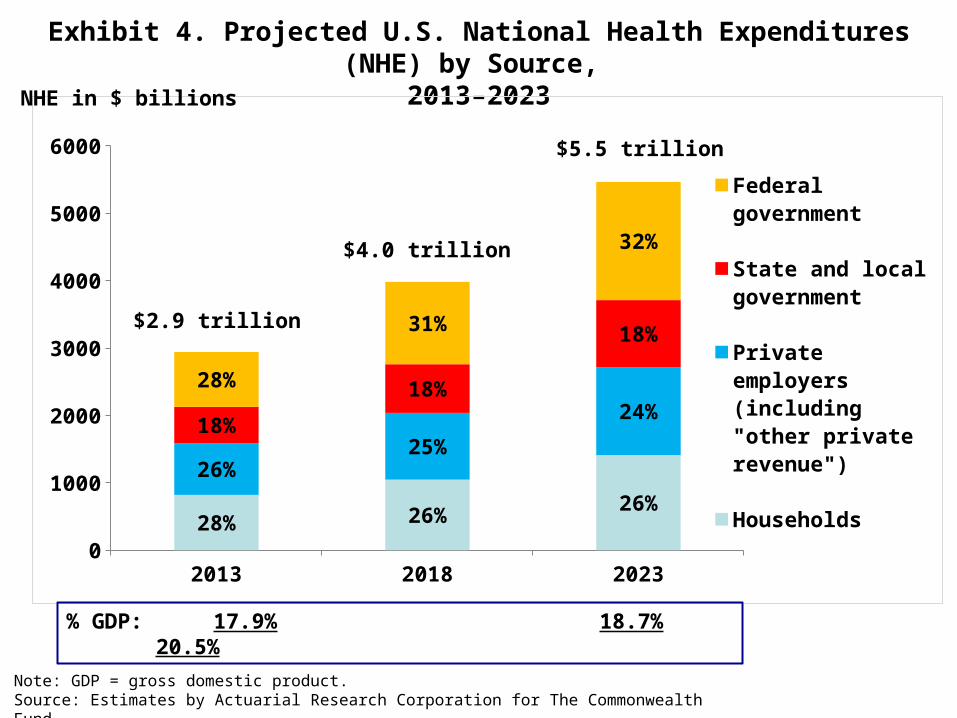
Exhibit 4. Projected U.S. National Health Expenditures (NHE) by Source, 2013–2023
2013 2018 20230
1000
2000
3000
4000
5000
6000
28% 26%26%
26%25%
24%18%
18%
18%
28%
31%
32%
Federal government
State and local government
Private employers (including "other private revenue")
Households
$2.9 trillion
$4.0 trillion
$5.5 trillion
Note: GDP = gross domestic product.Source: Estimates by Actuarial Research Corporation for The Commonwealth Fund.
NHE in $ billions
% GDP: 17.9% 18.7% 20.5%
Exhibit 5. High Performance Health System Criteria for Developing Options to Stabilize Spending Growth
• Set targets for total spending growth
• Pay for value to accelerate delivery system reform for better outcomes, better care, at lower costs
• Address the systemwide causes of health spending growth―not just federal health costs
• Align incentives for providers and consumers across public and private payers
• Protect access and enhance equity, but also engage and inform consumers
• Invest in information systems to guide action

Exhibit 6. Synergistic Strategy: Potential Cumulative Savings Compared with Current Baseline Projection, 2013–2023
Total NHEFederal
government
State and local
governmentPrivate
employers Households
2013–2018 –$686 –$345 –$84 –$66 –$192
2013–2023 –$2,004 –$1,036 –$242 –$189 –$537
Net impact in $ billions*
Note: NHE = national health expenditures.* Net effect does NOT include potential impact of spending target policy.Source: Estimates by Actuarial Research Corporation for The Commonwealth Fund. Current baseline projection assumes that the cuts to Medicare physician fees under the sustainable growth rate (SGR) formula are repealed and basic physician fees are instead increased by 1% in 2013 and held constant from 2014 through 2023.

Exhibit 7. Synergistic Strategy: Cumulative Savings, 2013–2023
Payment reforms to accelerate delivery system innovation ($1,333 billion)
• Pay for value: replace the SGR with provider payment incentives to improve care
• Strengthen patient-centered primary care and support care teams
• Bundle hospital payments to focus on total cost and outcomes
• Align payment incentives across public and private payers
Policies to expand and encourage high-value choices ($189 billion)
• Offer new Medicare Essential plan with integrated benefits through Medicare, offering positive incentives for use of high-value care and care systems
• Provide positive incentives to seek care from patient-centered medical homes, care teams, and accountable care networks (Medicare, Medicaid, private plans)
• Enhance clinical information to inform choice
Systemwide actions to improve how health care markets function ($481 billion)
• Simplify and unify administrative policies and procedures
• Reform malpractice policy and link to payment*
• Target total public and private payment (combined) to grow at rate no greater than GDP per capita**
Notes: SGR = sustainable growth rate formula; GDP = gross domestic product.* Malpractice policy savings included with provider payment policies.** Target policy was not scored.

Exhibit 8. Projected National Health Expenditures (NHE), 2013–2023: Potential Impact of Synergistic Strategy
2013 2014 2015 2016 2017 2018 2019 2020 2021 2022 2023$0.0
$1.0
$2.0
$3.0
$4.0
$5.0
$6.0
$2.9
$5.5Current baseline NHE projection
Projected NHE net of policy impacts
NHE as percentage of GDP— Current projection: 18% in 2013→21% in 2023 Under unified strategy: 18% in 2013→19% in 2023 Cumulative NHE savings under synergistic strategy: $2.0 trillion
$5.1
Note: GDP = gross domestic product.Source: Estimates by Actuarial Research Corporation for The Commonwealth Fund. Current baseline projection assumes that the cuts to Medicare physician fees under the sustainable growth rate (SGR) formula are repealed and basic physician fees are instead increased by 1% in 2013 and held constant from 2014 through 2023.
NHE in $ trillions

Exhibit 9. Impact of Synergistic Strategy on Projected Annual Hospital and Physician Spending, 2013–2023
Source: Estimates by Actuarial Research Corporation for The Commonwealth Fund. Current baseline projection assumes that the cuts to Medicare physician fees under the sustainable growth rate (SGR) formula are repealed and basic physician fees are instead increased by 1% in 2013 and held constant from 2014 through 2023.
Spending in $ billions
2013 2014 2015 2016 2017 2018 2019 2020 2021 2022 2023$0
$250
$500
$750
$1,000
$1,250
$1,500
$1,750
$2,000
$902
$1,646
$1,509
$597
$1,122
$1,055
Hospital (baseline)
Hospital (net of policy impacts)
Physician (baseline)
Physician (net of policy impacts)
Projected growth of hospital spending, 2013–2023:• Baseline projection: 82% (6.2% annual)• Net of policy impact: 67% (5.3% annual)Projected growth of physician spending, 2013–2023:• Baseline projection: 88% (6.5% annual)• Net of policy impact: 77% (5.9% annual)