Exhibit 99.1 CELESTICA INC. MANAGEMENT’S DISCUSSION AND ...
31
Exhibit 99.1 CELESTICA INC. MANAGEMENT’S DISCUSSION AND ANALYSIS OF FINANCIAL CONDITION AND RESULTS OF OPERATIONS FOR THE THREE AND SIX MONTHS ENDED JUNE 30, 2019 The following Management’s Discussion and Analysis of Financial Condition and Results of Operations (MD&A) should be read in conjunction with our June 30, 2019 unaudited interim condensed consolidated financial statements (Q2 2019 Interim Financial Statements), and our Annual Report on Form 20-F for the year ended December 31, 2018 (2018 20-F), including our 2018 audited consolidated financial statements (2018 AFS) contained therein. Unless otherwise noted, all dollar amounts are expressed in U.S. dollars. The information in this discussion is provided as of July 24, 2019 unless we indicate otherwise. Certain statements contained in this MD&A constitute forward-looking statements within the meaning of Section 27A of the U.S. Securities Act of 1933, as amended, and Section 21E of the U.S. Securities Exchange Act of 1934, as amended (U.S. Exchange Act), and contain forward-looking information within the meaning of Canadian securities laws. Such forward-looking information includes, without limitation, statements related to: our priorities, intended areas of focus, targets, objectives, and goals; trends in the electronics manufacturing services (EMS) industry and our segments, and their anticipated impact on our business; the anticipated continuation and impact of specified adverse market conditions in each of our segments; the anticipated impact and timing of, our cost efficiency initiative; the anticipated impact of our comprehensive Connectivity & Cloud Solutions (CCS) segment portfolio review (CCS Review); the intended method of funding and use of subordinate voting share repurchases; our growth and diversification strategies and plans (and potential hindrances thereto); the expected continuation, and adverse impact on our business, of materials constraints; the anticipated impact of completed acquisitions and program wins, transfers, losses or disengagements on our business; anticipated expenses, restructuring actions and charges, capital expenditures and other anticipated working capital requirements, including the anticipated amounts, timing, impact and funding thereof; the potential impact on our operations of any new significant tariffs on items imported into the U.S. and related countermeasures; the anticipated repatriation of undistributed earnings from foreign subsidiaries; the impact of tax and litigation outcomes; our anticipated ability to use certain net operating losses; intended investments in our business and associated risks; the potential impact of the pace of technological changes, customer outsourcing, program transfers, and the global economic environment on our business; raw materials prices; the timing of the commencement of, and amount of payments under, the lease for our new corporate headquarters; our expectations with respect to days in cash deposits; the impact of outstanding indebtedness under our credit facility on our business; the anticipated impact of recent U.S. tax reform on our business; the impact of price reductions and longer-term contracts on our business; the potential use and effect of cash, securities issuances and further increases in third-party indebtedness to fund our operations or acquisitions; the potential adverse impacts of Britain's intention to leave the European Union (Brexit) and/or policies or legislation proposed or instituted by the current administration in the U.S.; the anticipated impact of the integration of Impakt Holdings, LLC (Impakt) on our internal controls; and the anticipated impact of the expiration of one of our income tax incentives in Thailand. Such forward-looking statements may, without limitation, be preceded by, followed by, or include words such as “believes,” “expects,” “anticipates,” “estimates,” “intends,” “plans,” “continues,” “project,” “potential,” “possible,” “contemplate,” “seek,” or similar expressions, or may employ such future or conditional verbs as “may,” “might,” “will,” “could,” “should” or “would,” or may otherwise be indicated as forward-looking statements by grammatical construction, phrasing or context. For those statements, we claim the protection of the safe harbor for forward-looking statements contained in the U.S. Private Securities Litigation Reform Act of 1995, and applicable Canadian securities laws. Forward-looking statements are provided to assist readers in understanding management’s current expectations and plans relating to the future. Readers are cautioned that such information may not be appropriate for other purposes. Forward- looking statements are not guarantees of future performance and are subject to risks that could cause actual results to differ materially from those expressed or implied in such forward-looking statements, including, among others, risks related to: our customers’ ability to compete and succeed with our products and services; customer and segment concentration; challenges of replacing revenue from completed or lost programs or customer disengagements; changes in our mix of customers and/or the types of products or services we provide; the impact on gross profit of higher concentrations of lower margin programs; competitive factors and adverse market conditions affecting the EMS industry in general and our segments in particular; the cyclical nature of our capital equipment business, in particular our semiconductor business; delays in the delivery and availability of components, services and materials; the expansion or consolidation of our operations; defects or deficiencies in our products, services or designs; integrating acquisitions and "operate-in-place" arrangements, and achieving the anticipated benefits therefrom; negative impacts on our business resulting from recent increases in third-party indebtedness; our response to changes in demand, and 1
Transcript of Exhibit 99.1 CELESTICA INC. MANAGEMENT’S DISCUSSION AND ...

Exhibit 99.1CELESTICA INC.
MANAGEMENT’S DISCUSSION AND ANALYSISOF FINANCIAL CONDITION AND RESULTS OF OPERATIONS
FOR THE THREE AND SIX MONTHS ENDED JUNE 30, 2019
The following Management’s Discussion and Analysis of Financial Condition and Results of Operations (MD&A) shouldbe read in conjunction with our June 30, 2019 unaudited interim condensed consolidated financial statements (Q2 2019 InterimFinancial Statements), and our Annual Report on Form 20-F for the year ended December 31, 2018 (2018 20-F), including our2018 audited consolidated financial statements (2018 AFS) contained therein. Unless otherwise noted, all dollar amounts areexpressed in U.S. dollars. The information in this discussion is provided as of July 24, 2019 unless we indicate otherwise.
Certain statements contained in this MD&A constitute forward-looking statements within the meaning of Section 27A of
the U.S. Securities Act of 1933, as amended, and Section 21E of the U.S. Securities Exchange Act of 1934, as amended (U.S.Exchange Act), and contain forward-looking information within the meaning of Canadian securities laws. Such forward-lookinginformation includes, without limitation, statements related to: our priorities, intended areas of focus, targets, objectives, andgoals; trends in the electronics manufacturing services (EMS) industry and our segments, and their anticipated impact on ourbusiness; the anticipated continuation and impact of specified adverse market conditions in each of our segments; the anticipatedimpact and timing of, our cost efficiency initiative; the anticipated impact of our comprehensive Connectivity & Cloud Solutions(CCS) segment portfolio review (CCS Review); the intended method of funding and use of subordinate voting share repurchases;our growth and diversification strategies and plans (and potential hindrances thereto); the expected continuation, and adverseimpact on our business, of materials constraints; the anticipated impact of completed acquisitions and program wins, transfers,losses or disengagements on our business; anticipated expenses, restructuring actions and charges, capital expenditures and otheranticipated working capital requirements, including the anticipated amounts, timing, impact and funding thereof; the potentialimpact on our operations of any new significant tariffs on items imported into the U.S. and related countermeasures; the anticipatedrepatriation of undistributed earnings from foreign subsidiaries; the impact of tax and litigation outcomes; our anticipated abilityto use certain net operating losses; intended investments in our business and associated risks; the potential impact of the pace oftechnological changes, customer outsourcing, program transfers, and the global economic environment on our business; rawmaterials prices; the timing of the commencement of, and amount of payments under, the lease for our new corporate headquarters;our expectations with respect to days in cash deposits; the impact of outstanding indebtedness under our credit facility on ourbusiness; the anticipated impact of recent U.S. tax reform on our business; the impact of price reductions and longer-term contractson our business; the potential use and effect of cash, securities issuances and further increases in third-party indebtedness to fundour operations or acquisitions; the potential adverse impacts of Britain's intention to leave the European Union (Brexit) and/orpolicies or legislation proposed or instituted by the current administration in the U.S.; the anticipated impact of the integrationof Impakt Holdings, LLC (Impakt) on our internal controls; and the anticipated impact of the expiration of one of our income taxincentives in Thailand. Such forward-looking statements may, without limitation, be preceded by, followed by, or include wordssuch as “believes,” “expects,” “anticipates,” “estimates,” “intends,” “plans,” “continues,” “project,” “potential,” “possible,”“contemplate,” “seek,” or similar expressions, or may employ such future or conditional verbs as “may,” “might,” “will,”“could,” “should” or “would,” or may otherwise be indicated as forward-looking statements by grammatical construction,phrasing or context. For those statements, we claim the protection of the safe harbor for forward-looking statements contained inthe U.S. Private Securities Litigation Reform Act of 1995, and applicable Canadian securities laws.
Forward-looking statements are provided to assist readers in understanding management’s current expectations andplans relating to the future. Readers are cautioned that such information may not be appropriate for other purposes. Forward-looking statements are not guarantees of future performance and are subject to risks that could cause actual results to differmaterially from those expressed or implied in such forward-looking statements, including, among others, risks related to: ourcustomers’ ability to compete and succeed with our products and services; customer and segment concentration; challenges ofreplacing revenue from completed or lost programs or customer disengagements; changes in our mix of customers and/or thetypes of products or services we provide; the impact on gross profit of higher concentrations of lower margin programs; competitivefactors and adverse market conditions affecting the EMS industry in general and our segments in particular; the cyclical natureof our capital equipment business, in particular our semiconductor business; delays in the delivery and availability of components,services and materials; the expansion or consolidation of our operations; defects or deficiencies in our products, services ordesigns; integrating acquisitions and "operate-in-place" arrangements, and achieving the anticipated benefits therefrom; negativeimpacts on our business resulting from recent increases in third-party indebtedness; our response to changes in demand, and
1

rapidly evolving and changing technologies; challenges associated with new customers or programs, or the provision of newservices; the incurrence of future restructuring charges, impairment charges or other write-downs of assets; managing ouroperations, growth initiatives, and our working capital performance during uncertain market and economic conditions; disruptionsto our operations, or those of our customers, component suppliers and/or logistics partners, including as a result of global orlocal events outside our/their control and the impact of significant tariffs on items imported into the U.S.; changes to our operatingmodel; changing commodity, materials and component costs as well as labor costs and conditions; retaining or expanding ourbusiness due to execution or quality issues (including our ability to successfully resolve these challenges); maintaining sufficientfinancial resources and working capital to fund currently anticipated financial obligations and to pursue desirable businessopportunities; negative impacts on our business resulting from any significant uses of cash, securities issuances, and/or additionalincreases in third-party indebtedness for additional acquisitions or to otherwise fund our operations; our financial exposure toforeign currency volatility; our dependence on industries affected by rapid technological change; increasing taxes, tax audits, andchallenges of defending our tax positions; obtaining, renewing or meeting the conditions of tax incentives and credits; computerviruses, malware, hacking attempts or outages that may disrupt our operations; the variability of revenue and operating results;compliance with applicable laws, regulations, and government grants; and current or future litigation, governmental actions, and/or changes in legislation. The foregoing and other material risks and uncertainties are discussed in our public filings atwww.sedar.com and www.sec.gov, including in this MD&A, our most recent Annual Report on Form 20-F filed with, and subsequentreports on Form 6-K furnished to, the U.S. Securities and Exchange Commission, and as applicable, the Canadian SecuritiesAdministrators.
Our forward-looking statements are based on various assumptions, many of which involve factors that are beyond ourcontrol. Our material assumptions include those related to the following: fluctuation of production schedules from our customersin terms of volume and mix of products or services; the timing and execution of, and investments associated with, ramping newbusiness; the successful pursuit, completion and integration of acquisitions; the success of our customers’ products; our abilityto retain programs and customers; the stability of general economic and market conditions, currency exchange rates, and interestrates; supplier performance, pricing and terms; compliance by third parties with their contractual obligations and the accuracyof their representations and warranties; the costs and availability of components, materials, services, equipment, labor, energyand transportation; that our customers will retain liability for recently-imposed tariffs and countermeasures; our ability to keeppace with rapidly changing technological developments; the timing, execution and effect of restructuring actions; the successfulresolution of quality issues that arise from time to time; our having sufficient financial resources and working capital to fundcurrently anticipated financial obligations and to pursue desirable business opportunities; our ability to successfully diversify ourcustomer base and develop new capabilities; the availability of cash resources for repurchases of outstanding subordinate votingshares; that we achieve the expected benefits from our recent acquisitions; and the impact of the CCS Review on our business.Although management believes its assumptions to be reasonable under the current circumstances, they may prove to be inaccurate,which could cause actual results to differ materially (and adversely) from those that would have been achieved had such assumptionsbeen accurate. Forward-looking statements speak only as of the date on which they are made, and we disclaim any intention orobligation to update or revise any forward-looking statements, whether as a result of new information, future events or otherwise,except as required by applicable law.
All forward-looking statements attributable to us are expressly qualified by these cautionary statements.
2
Overview Celestica's business:
We deliver innovative supply chain solutions globally to customers in two operating and reportable segments: AdvancedTechnology Solutions (ATS) and Connectivity & Cloud Solutions (CCS). Our ATS segment consists of our ATS end market, andis comprised of our aerospace and defense (A&D), industrial, smart energy, healthtech, and capital equipment businesses. Ourcapital equipment business is comprised of our semiconductor, display, and power & signal distribution equipment businesses.Our CCS segment consists of our Communications and Enterprise end markets, and is comprised of our enterprise communications,telecommunications, servers and storage businesses. Our customers include original equipment manufacturers (OEMs), cloud-based and other service providers, and other companies in a wide range of industries. Our global headquarters is located in Toronto,Canada. We operate a network of sites and centers of excellence strategically located in North America, Europe and Asia, withspecialized end-to-end supply chain capabilities tailored to meet specific market and customer product lifecycle requirements.Information regarding our reportable segments is included in note 3 to our Q2 2019 Interim Financial Statements, filed atwww.sedar.com and furnished with this MD&A on Form 6-K at www.sec.gov.

We offer a comprehensive range of product manufacturing and related supply chain services to customers in both of oursegments, including design and development, new product introduction, engineering services, component sourcing, electronicsmanufacturing and assembly, testing, complex mechanical assembly, systems integration, precision machining, order fulfillment,logistics, asset management, product licensing, and after-market repair and return services. Within design and development, ourJoint Design and Manufacturing (JDM) offering includes the creation of hardware platforms and design solutions in collaborationwith customers, as well as the management of aspects of the supply chain and manufacturing.
Products and services in our ATS segment are extensive and are often more regulated than in our CCS segment, and caninclude the following: government-certified and highly-specialized manufacturing, electronic and enclosure-related services forA&D-related customers; high-precision semiconductor and display equipment and integrated subsystems ; a wide range of industrialautomation, controls, test and measurement devices; advanced solutions for surgical instruments, diagnostic imaging and patientmonitoring; and efficiency products to help manage and monitor the energy and power industries. Our ATS segment businessestypically have a higher margin profile and longer product life cycles than the businesses in our CCS segment.
Products and services in our CCS segment consist predominantly of enterprise-level data communications and informationprocessing infrastructure products, and can include routers, switches, servers and storage-related products used by a wide rangeof businesses and cloud-based service providers to manage digital connectivity, commerce and social media applications. OurCCS segment businesses typically have a lower margin profile and higher volumes than the businesses in our ATS segment.
Overview of business environment:
The EMS industry is highly competitive. Demand can be volatile from period to period, and aggressive pricing is acommon business dynamic, particularly in our CCS segment. Customers may shift production between EMS providers, increasethe amount of business they outsource, insource previously outsourced business, or change the concentration or location of theirEMS suppliers. As a result, customer and segment revenue mix, as well as overall profitability, are difficult to forecast.
Product lifecycles in the markets we serve, production lead times required by our customers, rapid shifts in technology,model obsolescence, commoditization of certain products, the emergence of new business models, shifting patterns of demand(such as the shift from traditional network infrastructures to highly virtualized and cloud-based environments, and declines in end-market demand for customer-specific proprietary systems in favor of open systems with standardized technologies), the prevalenceof solid state or flash memory technology as a replacement for hard disk drives, the proliferation of software-defined technologiesenabling the disaggregation of software and hardware, product oversupply, and the build-up by OEM customers of inventorybuffers, all contribute to the complexity of managing our operations and fluctuations in our financial results. See "RecentDevelopments" below.
Other external factors that could adversely impact the EMS industry and our business include natural disasters and relateddisruptions, political instability, terrorism, armed conflict, labor or social unrest, criminal activity, disease or illness that affectslocal, national or international economies, unusually adverse weather conditions, and other risks present in the jurisdictions inwhich we, our customers, our suppliers, and/or our logistics partners operate. In addition, uncertainties resulting from Brexit (giventhe lack of comparable precedent) and/or policies or legislation proposed or instituted by the current administration in the U.S.,and/or increased tensions between the U.S. and other countries, may adversely affect our business, results of operations and financialcondition.
The current U.S. administration has increased tariffs on certain items imported into the U.S. from several countries,including China, Mexico, and the European Union. Each of these countries has imposed retaliatory tariffs on specified items,which have been challenged by the U.S. We currently ship a significant portion of our worldwide production to customers in theU.S. from other countries. Increased tariffs, and/or changes to international trade agreements (including the revised trade agreementamong the U.S., Canada, and Mexico, which has not yet been ratified by the U.S. or Canada), may cause our U.S. customers toinsource programs previously outsourced to us, transfer manufacturing to locations within our global network that are not impactedby such actions (potentially increasing production costs), and/or shift their business to other EMS providers. Additionally, tariffson imported components for use in our U.S. production could have an adverse impact on demand for such production. Retaliatorytariffs could reduce demand for our U.S.-based production or make such production less profitable. We continue to assess theimpact on such tariffs on our global network, and discussions with impacted customers are ongoing. In connection therewith, wehave transferred certain programs from China to unaffected countries during each of the first and second quarters of 2019. Inaddition, certain customers have requested pricing for manufacturing services from sites not impacted by these tariffs. If suchrequests increase, the profitability of such services may be adversely impacted in future periods. In addition, future customerrequirements may result in unexpected investments and costs in new manufacturing footprint which may require us to reduce
3

existing operations as volumes drop in the geographies impacted by these trade actions. Although these factors have not had asignificant impact on our operating results to date, given the uncertainty regarding the scope and duration of these trade actionsby the U.S. and other governments, whether trade tensions will escalate further, and whether our customers will continue to bearthe cost of the tariffs, their impact on our operations and results for future periods cannot be currently quantified, but may bematerial.
Uncertainty in the global economy and financial markets may also impact current and future demand for our customers'products and services, and consequently, our operations. We continue to monitor the dynamics and impacts of the global economicand financial environment and work to manage our priorities, costs and resources to anticipate and prepare for any changes wedeem necessary.
See Item 5. "Operating and Financial Review and Prospects — Overview — Overview of business environment" of our2018 20-F for further detail.
Recent Developments:
Segment Environment
General:
Both of our segments have been adversely impacted in recent periods by materials constraints from certain suppliers, duein part to industry-wide shortages for certain electronic components. These shortages have resulted in higher materials costs, aswell as operational and materials inefficiencies (including production delays, and a need to carry higher than expected levels ofinventory), in particular within our A&D business in the first half of 2019 (1H 2019). During the second quarter of 2019 (Q2 2019),we saw general improvements in the availability of previously constrained materials across our businesses, and marginalimprovements in the availability of certain high reliability parts with respect to our A&D business.
ATS Segment:
Capital Equipment Business: Revenue from our semiconductor capital equipment customers continues to be adverselyimpacted by cyclical decreases in demand that started in the second half of 2018. As a result, our capital equipment businessoperated at a loss in Q2 2019 in the high single-digit million dollar range, which was higher than expected due to lower demandand continued volatility in this business. In addition, some next generation display programs that were originally anticipated toramp in the second half of 2019 have been further delayed as lower capital spending is delaying the ramp up of next generationprograms. We currently expect this demand softness to persist into 2020. Although we remain focused on implementing actionsintended to better align this business to the current demand environment, while maintaining our capabilities in this market, weexpect to operate at a similar loss in the third quarter of 2019. Notwithstanding the foregoing, we continue to believe that newprogram wins, market share gains, and anticipated growth in electronic content position us favorably to benefit from potentialgrowth in this business in the future.
Industrial and Healthtech Businesses: Although the cost of ramping multiple new programs as we expand our presencein these businesses adversely impacted their profitability in the first quarter of 2019 (Q1 2019), their profitability improved in Q22019.
A&D Business: We saw marginal improvement in materials availability and improved profitability in our A&D businessfor Q2 2019. This business continued to be adversely impacted by materials shortages in Q2 2019 particularly with respect to theavailability of certain high reliability parts resulting in a continued backlog of orders. We currently expect this backlog to improvegradually in the second half of the year.
More generally, we continue to pursue new customers and invest in our ATS segment to expand our market share, todiversify our end market mix, and to enhance and add new technologies and capabilities to our offerings.
CCS Segment:
Our CCS segment generally experiences a high degree of volatility in terms of revenue and product/service mix, and hasbeen adversely impacted in recent periods (and continues to be impacted) by sustained negative pricing pressures, which havesignificantly impacted our profitability in recent quarters, as well as rapid shifts in technology, model obsolescence and thecommoditization of certain products. These factors, which are characteristic of the highly competitive nature of this market, are
4

not expected to abate. As a result, and in light of the high concentration of our business in the CCS marketplace, we expect continuedcompetitive pressures, aggressive pricing and technology-driven demand shifts, as well as the materials constraints discussedabove (but to a lesser extent than in previous periods), to continue to negatively impact our CCS businesses and overall profitabilityin future periods. We have also experienced a shift in the mix of our programs in recent periods, including an increase of the useof our CCS segment products and services by cloud-based service providers. These customers and markets are cyclically differentfrom our traditional OEM customers, creating more volatility and unpredictability in our revenue patterns as we adjust to this shift,and additional challenges with respect to the management of our working capital requirements. We believe that over time, growthin demand from cloud-based service customers will help offset the decline in business from our traditional OEM customers.
We continue to make progress on actions associated with the comprehensive review of our CCS revenue portfolio (CCSReview). In Q2 2019, we implemented further planned program disengagements in our Enterprise end market, and continue toexpect to complete the majority of the remaining actions identified by the CCS Review in 2019, including intended restructuringactions (which have been built into our current cost efficiency initiative). Actions associated with the CCS Review are currentlyexpected to result in an aggregate annualized decline in our CCS segment revenue of approximately $500 million (subject tochange based on the growth or contraction of CCS programs not subject to the CCS Review). For 2019, we expect an aggregaterevenue decline in our CCS segment from such actions of just over $400 million as compared to 2018. Notwithstanding thisanticipated decline in CCS segment revenue, we intend to maintain a significant majority of our CCS business, and continue toinvest in areas we believe are key to the long-term success of our CCS segment, including our JDM offering, to help drive improvedfinancial performance in future periods.
The decrease in CCS segment revenue in Q2 2019 as compared to the prior year period was primarily due to plannedEnterprise end market program disengagements, persistent demand softness from certain Communications customers who continueto consume existing inventory buffers, and the continued impact of next generation program transitions. Although revenue fromcloud-based service providers increased in Q2 2019 as compared to the prior year period, such new business was more than offsetby these declines in business from our traditional OEM customers. We expect these adverse market dynamics in our Communicationsend market to continue into the second half of 2019.
As a result of the CCS segment declines and lower Capital Equipment demand, we expect total company revenue for2019 to decrease in the low teens percentage range year over year, which is above the high single digit percentage range previouslyanticipated. Toronto Real Property Transition Matters:
On March 7, 2019, we completed the sale of our Toronto real property. See “Liquidity — Toronto Real Property andRelated Transactions” below for a discussion of transition and capital costs incurred in connection with relocations related to thesale.
Restructuring Update:
We have recorded $59.5 million in restructuring charges from the commencement of our cost efficiency initiative (CEI)through the end of Q2 2019 (Q2 2019 — $9.0 million). Based on current plans, we estimate total restructuring charges for the CEI(which are primarily cash charges) to be at the high end of our previously disclosed range of between $50-$75 million, and continueto expect the remainder of the charges to be recorded by the end of 2019.
Share Repurchase Plan:
During Q2 2019, we paid $22.8 million (including transaction fees) to repurchase and cancel 3.2 million subordinatevoting shares under our current normal course issuer bid (2018/2019 NCIB). No subordinate voting shares were repurchased duringQ2 2019 to satisfy delivery requirements under our stock-based compensation plans. As of June 30, 2019, up to approximately1.2 million additional subordinate voting shares remain available for purchase under the 2018/2019 NCIB. We intend to use suchremaining availability for repurchases to satisfy delivery requirements under our stock-based compensation plans.
5

Operating Goals and Priorities:
Our current priorities are focused on evolving our revenue portfolio; expanding our non-International Financial ReportingStandings (IFRS) operating margin* and segment margins; and maintaining a balanced approach to capital allocation. Managementbelieves that each of these goals and priorities is reasonable.
Evolving our Revenue Portfolio — To evolve our revenue portfolio, we intend to continue to focus on: (i) realigning our portfoliotowards more diversified revenue, (ii) driving sustainable profitable revenue growth, (iii) growing our ATS segment revenueorganically by an average of 10% per year over the long term, (iv) supplementing our organic growth with disciplined, targetedacquisitions intended to expand capabilities, and (v) optimizing and reshaping our portfolio to drive more consistent returns andprofitability.
Expanding Margins — With respect to margins, we intend to focus on achieving: (i) non-IFRS operating margin* in the targetrange of 3.75% to 4.5%, (ii) ATS segment margin in the target range of 5.0% to 6.0%, and CCS segment margin in the target rangeof 2.0% to 3.0%, and (iii) greater than 50% of total segment income from our ATS segment. In order to achieve our ATS segmentincome and margin, and non-IFRS operating margin* goals: (i) the current demand environment in capital equipment must returnto prior levels; (ii) the materials environment must stabilize, so that we can maximize both our labor and materials efficiencies;and (iii) we must successfully execute the ramping of new ATS programs to their intended profitability. Because the materials andcapital equipment demand environments are volatile, the timeline to achieve these goals cannot be assured. To maintain our CCSsegment margin, we must (i) complete the actions from our CCS Review and (ii) achieve high levels of cost productivity in avolatile demand environment.
Balanced Approach to Capital Allocation — In terms of capital allocation, we are focused on: (i) returning approximately 50%of non-IFRS free cash flow* to shareholders annually, on average, over the long term, (ii) investing 1.5% to 2.0% of annual revenuein capital expenditures to support our organic growth, and (iii) executing on strategic acquisitions as part of a disciplined capitalallocation framework. We are also focused on maintaining a strong balance sheet, as well as lowering outstanding borrowings.
The foregoing priorities and areas of intended focus constitute our objectives and goals, and are not intended tobe projections or forecasts of future performance. Our future performance is subject to risks, uncertainties and otherfactors that could cause actual outcomes and results to differ materially from the goals and priorities described above.
Segment performance is evaluated based on segment revenue, segment income and segment margin (segment income asa percentage of segment revenue), each of which is defined in "Operating Results — Segment income and margin" below.
* Operating margin and free cash flow are non-IFRS measures without standardized meanings and may not be comparable tosimilar measures presented by other companies. See "Non-IFRS measures" below for a discussion of the non-IFRS measuresincluded herein (including a description of modifications to our calculation of each of non-IFRS free cash flow and non-IFRSadjusted return on invested capital (ROIC) that commenced in Q1 2019), and a reconciliation of our non-IFRS measures to themost directly comparable IFRS measures. We do not provide reconciliations for forward-looking non-IFRS financial measures,as we are unable to provide a meaningful or accurate calculation or estimation of reconciling items and the information is notavailable without unreasonable effort. This is due to the inherent difficulty of forecasting the timing or amount of various eventsthat have not yet occurred, are out of our control and/or cannot be reasonably predicted, and that would impact the most directlycomparable forward-looking IFRS financial measure. For these same reasons, we are unable to address the probable significanceof the unavailable information. Forward-looking non-IFRS financial measures may vary materially from the corresponding IFRSfinancial measures.
Our Strategy
Within both our CCS and ATS segments, we are focused on higher-value added services, including design and development,engineering, and after-market services, and diversification of our capabilities. The costs of investments that we deem desirablemay be prohibitive, however, and therefore prevent us from achieving our diversification objectives. In addition, the rampingactivities associated with investments that we do make may be significant and could negatively impact our margins in the shortand medium term. See "Recent Developments — Segment Environment" above. To counteract these factors, we continue to investin and deploy automation throughout our network to improve quality and cost productivity. We also continue to invest in anddeploy digital factory solutions, primarily using our shop floor tools, and we have commenced the development of more sophisticateddigital factory capabilities. Our current CEI, and related restructuring actions, are also intended to further streamline our business,increase operational efficiencies and improve our productivity.
6

As we expand our business, open new sites, or transfer business within our network to accommodate growth or achievesynergies, however, we may encounter difficulties that result in higher than expected costs associated with such activities. Potentialdifficulties related to such activities are described in detail under the caption "We may encounter difficulties expanding orconsolidating our operations or introducing new competencies or new offerings, which could adversely affect our operating results"in the Risk Factors section of our 2018 20-F. Any such difficulties could prevent us from realizing the anticipated benefits ofgrowth in our business, including in new markets or technologies, which could materially adversely affect our business and operatingresults. We may, at any time, be in discussions with respect to possible acquisitions or strategic transactions. There can be noassurance that any of such discussions will result in a definitive agreement and, if they do, what the terms or timing of any suchagreement would be. There can also be no assurance that any acquisition or other strategic transaction will be successfully integratedor will generate the returns we expect. We may fund our acquisitions and other strategic transactions from cash on hand, third-party borrowings, the issuance of securities, or a combination thereof.
7
Summary of Q2 2019
Our Q2 2019 Interim Financial Statements have been prepared in accordance with International Accounting Standard(IAS) 34, Interim Financial Reporting, as issued by the International Accounting Standards Board (IASB) and accounting policieswe adopted in accordance with IFRS. The Q2 2019 Interim Financial Statements reflect all adjustments that are, in the opinion ofmanagement, necessary to present fairly our financial position as at June 30, 2019 and the financial performance, comprehensiveincome and cash flows for the three and six months ended June 30, 2019. We adopted IFRS 16 (Leases) as of January 1, 2019,and no restatements of comparative period financial information were required in connection therewith.
The following table sets forth certain key operating results and financial information for the periods indicated (in millions,
except per share amounts and percentages):
Three months ended June 30 Six months ended June 30
2018 2019%
Change 2018 2019%
ChangeRevenue ............................................................. $ 1,695.2 $ 1,445.6 (15)% $ 3,194.9 $ 2,878.7 (10)%Gross profit ........................................................ 104.8 97.8 (7)% 198.3 185.2 (7)%Selling, general and administrative expenses
(SG&A) ...................................................... 52.7 60.7 15 % 105.0 116.8 11 %Other charges (recoveries)................................. 15.8 10.5 (34)% 26.3 (81.0) (408)%Net earnings (loss) ............................................. 16.1 (6.1) (138)% 30.2 84.2 179 %Diluted earnings (loss) per share ....................... $ 0.11 $ (0.05) (145)% $ 0.21 $ 0.63 200 %
Three months ended Six months endedSegment revenue* as a percentage of total revenue: June 30 June 30
2018 2019 2018 2019ATS revenue (% of total revenue) ....................................... 33% 39% 34% 40%CCS revenue (% of total revenue)....................................... 67% 61% 66% 60%
Three months ended June 30 Six months ended June 30Segment income and segment margin*: 2018 2019 2018 2019
SegmentMargin
SegmentMargin
SegmentMargin
SegmentMargin
ATS segment.................................................... $ 28.2 5.1% $ 15.8 2.8% $ 56.1 5.2% $ 30.9 2.7%CCS segment ................................................... 24.9 2.2% 20.9 2.4% 41.7 2.0% 40.9 2.4%
* Segment performance is evaluated based on segment revenue, segment income and segment margin (segment income as a percentage of segmentrevenue), each of which are defined in “Operating Results — Segment income and margin” below.

December 31 2018
June 30 2019
Cash and cash equivalents........................................................................................... $ 422.0 $ 436.5Total assets .................................................................................................................. 3,737.7 3,633.7Borrowings under term loans ...................................................................................... 598.3 595.3Borrowings under revolving credit facility ................................................................. 159.0 53.0
Three months ended Six months endedJune 30 June 30
2018 2019 2018 2019Cash provided by (used in) operating activities.............................................. $ (14.9) $ 90.3 $ (20.3) $ 161.6Shares repurchased for cancellation — aggregate price (includingtransaction fees) .............................................................................................. $ 3.2 $ 22.8 $ 38.3 $ 67.3 — # (in millions)................................... 0.3 3.2 3.6 8.3Shares repurchased for delivery under stock-based plans — aggregate price(including transaction fees) ............................................................................. $ 5.3 $ — $ 9.6 $ — — # (in millions).. 0.4 — 0.8 —
A discussion of the foregoing information is set forth under "Operating Results" below.
Other performance indicators:
In addition to the key operating results and financial information described above, management reviews the followingmeasures (which are not measures defined under IFRS):
1Q18 2Q18 3Q18 4Q18 1Q19 2Q19Cash cycle days:Days in A/R ........................................................................................... 62 57 60 62 71 65Days in inventory .................................................................................. 57 56 59 61 74 73Days in A/P............................................................................................ (62) (60) (65) (65) (70) (64)Days in cash deposits*........................................................................... (2) (1) (1) (2) (6) (9)Cash cycle days ..................................................................................... 55 52 53 56 69 65Inventory turns....................................................................................... 6.4x 6.6x 6.2x 6.0x 5.0x 5.0x
* Represents cash deposits made by certain customers to cover our risk of excess and/or obsolete inventory. As a result of the recent increased use of cash depositsto mitigate higher inventory levels, commencing in Q1 2019, we deduct cash deposit days in our calculation of cash cycle days, and have restated the prior periodcomparatives shown above to conform to the current presentation.
2018 2019March 31 June 30 September 30 December 31 March 31 June 30
A/R Sales (in millions) .................................. $ 113.0 $ 113.0 $ 113.0 $ 130.0 $ 130.0 $ 136.6Supplier Financing Program* (in millions)... 77.8 76.0 81.0 50.0 24.9 11.5Total (in millions) .......................................... $ 190.8 $ 189.0 $ 194.0 $ 180.0 $ 154.9 $ 148.1
* Represents A/R sold to a third party bank in connection with a customer's uncommitted supplier financing program.
Days in A/R is defined as the average A/R for the quarter divided by the average daily revenue. Days in inventory, daysin accounts payable (A/P) and days in cash deposits are calculated by dividing the average balance for each item for the quarterby the average daily cost of sales. Cash cycle days is defined as the sum of days in A/R and days in inventory minus the days inA/P and days in cash deposits. Inventory turns are determined by dividing 365 by the number of days in inventory. A lower numberof days in A/R, days in inventory, and cash cycle days, and a higher number of days in A/P, days in cash deposits, and inventoryturns generally reflect improved cash management performance.
8

Days in A/R for Q2 2019 decreased 6 days sequentially from Q1 2019, mainly due to the decline in revenue from thefourth quarter of 2018 (Q4 2018) to Q1 2019, which resulted in higher average A/R balances in Q1 2019 compared to Q2 2019.Days in A/R for Q2 2019 increased 8 days from Q2 2018 due to an unfavorable mix of revenue (with longer A/R terms) and timingof collections. Days in inventory for Q2 2019 decreased one day sequentially as average inventory and cost of sales levels weresimilar to the prior quarter. Days in inventory increased 17 days compared to Q2 2018 due to higher inventory levels resultingfrom the constrained materials environment, varying program mix and increased levels of slower-turning inventory in our ATSsegment. Days in A/P for Q2 2019 decreased 6 days sequentially from Q1 2019, as the decline in cost of sales from Q4 2018 toQ1 2019 resulted in higher average A/P balances in Q1 2019 compared to Q2 2019. Days in A/P for Q2 2019 increased 4 dayscompared to Q2 2018, primarily due to the timing of payments. Days in cash deposits for Q2 2019 increased by 3 days sequentiallyfrom Q1 2019 and 8 days compared to Q2 2018, primarily due to higher cash deposits we received from customers in the 2019periods, to reduce our working capital requirements. Customer cash deposits have increased to $138.6 million as at June 30, 2019,compared to $57.9 million as at December 31, 2018. Although there were 9 days in cash deposits in Q2 2019, we continue toexpect this number to decrease during the remainder of 2019 as we work with our customers to reduce our inventory levels.
We believe that cash cycle days (and the components thereof) and inventory turns are useful measures in providinginvestors with information regarding our cash management performance and are accepted measures of working capital managementefficiency in our industry. These are not measures of performance under IFRS, and may not be defined and calculated in the samemanner by other companies. These measures should not be considered in isolation or as an alternative to working capital as anindicator of performance.
Management also reviews other non-IFRS measures including adjusted net earnings, operating margin, adjusted ROICand free cash flow. See "Non-IFRS measures" below.
9
Critical Accounting Policies and Estimates
The preparation of financial statements in conformity with IFRS requires management to make judgments, estimates andassumptions that affect the application of accounting policies and the reported amounts of assets and liabilities, revenue andexpenses, and the related disclosures of contingent assets and liabilities. We base our judgments, estimates and assumptions oncurrent facts, historical experience and various other factors that we believe are reasonable under the circumstances. The economicenvironment could also impact certain estimates necessary to prepare our consolidated financial statements, including estimatesrelated to the recoverable amounts used in our impairment testing of our non-financial assets (see notes 8 and 9 to our 2018 AFS),the discount rates applied to our net pension and non-pension post-employment benefit assets or liabilities (see note 19 to our 2018AFS), and the discount rates applied to our right-of-use (ROU) assets and related lease obligations under IFRS 16. Our assessmentof these factors forms the basis for our judgments on the carrying values of assets and liabilities and the accrual of costs andexpenses. Actual results could differ materially from these estimates and assumptions. We review our estimates and underlyingassumptions on an ongoing basis and make revisions as determined necessary by management. Revisions are recognized in theperiod in which the estimates are revised and may impact future periods as well. Significant accounting policies and methods usedin the preparation of our consolidated financial statements are described in note 2 to our 2018 AFS. The following identifies thoseaccounting policies which management considers to be “critical,” defined as accounting policies that management believes areboth most important to the portrayal of our financial condition and results and require application of management’s most difficult,subjective or complex judgments, often as a result of the need to make estimates about the effects of matters that are inherentlyuncertain. There have been no significant changes to our assumptions or the judgments affecting the application of our estimatesor assumptions during Q2 2019 or 1H 2019 from those described in the notes to our 2018 AFS. However, on January 1, 2019, weadopted IFRS 16, Leases. As a result, we have modified the significant accounting policies set forth in notes 2(j) and (x) to our2018 AFS. See note 2 to our Q2 2019 Interim Financial Statements for a description of our adoption of this standard, and relatedmodifications to our accounting policies.
Key sources of estimation uncertainty and judgment: We have applied significant estimates, judgment and assumptions in thefollowing areas which we believe could have a significant impact on our reported results and financial position: determination ofthe timing of revenue recognition, measures of work in progress, revenue and related costs; our valuations of inventory and incometaxes; the measurement of the recoverable amounts of our cash generating units (or CGUs, which are the smallest identifiablegroup of assets that cannot be tested individually and generate cash inflows that are largely independent of those of other assetsor groups of assets), which includes estimating future growth, profitability, discount and terminal growth rates; ROU assets andrelated lease liabilities, employee stock-based compensation expense, provisions and contingencies; and the allocation of thepurchase price and other valuations related to our business acquisitions.

We have also applied significant judgment in the following areas: the determination of our CGUs (which can be comprisedof a single site, a group of sites, or a line of business) and whether events or changes in circumstances during the relevant periodare indicators that a review for impairment should be conducted.
10
Operating Results
Our annual and quarterly operating results are affected by, among other factors: the level and timing of customer orders;our customer and business mix and the types of products or services we provide; the rate at which, the costs associated with, andthe execution of, new program ramps; demand volumes and the seasonality of our business; price competition and other competitivefactors; the mix of manufacturing or service value-add; manufacturing capacity, utilization and efficiency; the degree of automationused in the assembly process; the availability of components or labor; the location of qualified personnel; costs and inefficienciesof transferring programs between sites; program completions or losses, or customer disengagements and the timing and the marginof follow-on business or any replacement business; the impact of foreign exchange fluctuations; the performance of third-partyproviders; our ability to manage inventory, production location and equipment effectively; our ability to manage changing labor,component, energy and transportation costs effectively; fluctuations in variable compensation costs; the timing of our expendituresin anticipation of forecasted sales levels; and the timing of any acquisitions and related integration costs. Significant period-to-period variations can also result from the timing of new programs reaching full production or programs reaching end-of-life, thetiming of follow-on or next generation programs and/or the timing of existing programs being fully or partially transferred internallyor to a competitor. Because our industry is working capital intensive, we believe that non-IFRS adjusted ROIC, which is primarilybased on non-IFRS operating earnings (each discussed in "Non-IFRS measures" below) and investments in working capital andequipment, is an important metric for measuring our financial performance.
Operating results expressed as a percentage of revenue:
Three months ended June 30 Six months ended June 302018 2019 2018 2019
Revenue.............................................................. 100.0% 100.0 % 100.0% 100.0%Cost of sales ....................................................... 93.8 93.2 93.8 93.6Gross profit......................................................... 6.2 6.8 6.2 6.4SG&A................................................................. 3.1 4.2 3.3 4.1Research and development costs........................ 0.4 0.5 0.4 0.5Amortization of intangible assets ....................... 0.2 0.5 0.2 0.5Other charges (recoveries).................................. 1.0 0.7 0.8 (2.8)Finance costs ...................................................... 0.3 0.9 0.3 0.9Earnings (loss) before income tax ...................... 1.2 — 1.2 3.2Income tax expense ............................................ 0.3 0.4 0.3 0.3Net earnings (loss).............................................. 0.9% (0.4)% 0.9% 2.9%

Revenue:
Aggregate revenue of $1.45 billion for Q2 2019 decreased 15% compared to Q2 2018. Aggregate revenue of $2.88 billionfor 1H 2019 decreased 10% compared to the first half of 2018 (1H 2018).
The following table sets forth revenue from our reportable segments, as well as segment and end market revenue as apercentage of total revenue, for the periods indicated (in millions, except percentages):
Three months ended June 30 Six months ended June 302018 2019 2018 2019
ATS segment revenue . $ 553.2 33% $ 562.7 39% $ 1,086.0 34% $ 1,140.9 40%CCS segment revenue. 1,142.0 67% 882.9 61% 2,108.9 66% 1,737.8 60%
Communications .... 42% 39% 41% 39%Enterprise ............... 25% 22% 25% 21%
Total revenue .............. $ 1,695.2 $ 1,445.6 $ 3,194.9 $ 2,878.7
ATS segment revenue represented 39% of total revenue for Q2 2019, up from 33% of total revenue for Q2 2018, and40% of total revenue for 1H 2019, up from 34% of total revenue for 1H 2018. ATS segment revenue for Q2 2019 and 1H 2019increased $9.5 million (2%) and $54.9 million (5%), respectively, compared to the same periods in 2018, reflecting low double-digit growth in our A&D, industrial and healthtech businesses, offset in large part by significant reductions in demand in our capitalequipment business. See "Overview — Recent Developments" above. Revenue growth in our A&D business for each of Q2 2019and 1H 2019 as compared to the prior year periods was driven by strong demand, including from Atrenne Integrated Solutions,Inc. (Atrenne), but was negatively impacted by production delays caused by the materials constraints in certain high reliabilityparts described above.
CCS segment revenue represented 61% of total revenue for Q2 2019, down from 67% of total revenue for Q2 2018, and60% of total revenue for 1H 2019, down from 66% of total revenue for 1H 2018. CCS segment revenue for Q2 2019 and 1H 2019decreased $259.1 million (23%) and $371.1 million (18%), respectively, compared to the same periods in 2018. Communicationsend market revenue for Q2 2019 and 1H 2019 decreased $149.3 million (21%) and $181.0 million (14%), respectively, comparedto the same periods in 2018, primarily due to demand softness from our traditional OEM customers, partially offset by demandstrength and new program revenue in support of data center growth. See "Overview —Recent Developments" above. Enterpriseend market revenue for Q2 2019 and 1H 2019 decreased $109.8 million (26%) and $190.1 million (24%), respectively, comparedto the same periods in 2018, primarily due to planned program disengagements resulting from our CCS Review.
We depend on a small number of customers for a substantial portion of our revenue. In the aggregate, our top 10 customers
represented 65% and 64% of total revenue for Q2 2019 and 1H 2019, respectively (each of Q2 2018 and 1H 2018 — 71%). Foreach of Q2 2019 and 1H 2019, we had two customers (one from each of our segments), that represented more than 10% of totalrevenue (each of Q2 2018 and 1H 2018 — one customer from our CCS segment). We generally enter into master supply agreementswith our customers that provide the framework for our overall relationship. These agreements typically do not guarantee a particularlevel of business or fixed pricing. Instead, we bid on a program-by-program basis and typically receive customer purchase ordersfor specific quantities and timing of products. Customers may also cancel contracts, and volume levels can be changed or delayed,any of which could have a material adverse impact on our results of operations and working capital performance. We cannot assurethe replacement of completed, delayed, cancelled or reduced orders, or that our current customers will continue to utilize ourservices. In addition, in any given quarter, we can experience quality and process variances related to materials, testing or othermanufacturing or supply chain activities. Although we are successful in resolving the majority of these issues, the existence ofthese variances could have a material adverse impact on the demand for our services in future periods from any affected customers.Further, some of our customer agreements require us to provide specific price reductions to our customers over the term of thecontracts, which has significantly impacted revenue and margins in our CCS segment. As longer-term contracts are becomingmore prevalent, we anticipate that these adverse effects will increasingly impact our business in future periods. Recent marketshifts to generic, cloud-based hardware platforms are also adversely impacting demand from our traditional OEM Communicationscustomers. See "Overview — Recent Developments — Segment Environment" above. There can be no assurance that revenuefrom any of our major customers will continue at historical levels or will not decrease in absolute terms or as a percentage of totalrevenue. A significant revenue decrease or pricing pressures from these or other customers, or a loss of a major customer or program,could have a material adverse impact on our business, our operating results and our financial position.
11

Gross profit:
The following table shows gross profit and gross margin (gross profit as a percentage of total revenue) for the periodsindicated:
Three months ended June 30 Six months ended June 302018 2019 2018 2019
Gross profit (in millions).................................................... $ 104.8 $ 97.8 $ 198.3 $ 185.2Gross margin ...................................................................... 6.2% 6.8% 6.2% 6.4%
Gross profit for Q2 2019 decreased by 7% to $97.8 million compared to Q2 2018. Gross margin increased from 6.2% in
Q2 2018 to 6.8% for Q2 2019. The decrease in gross profit resulted primarily from our ATS segment, most significantly the lowerrevenue and losses in our capital equipment business, which more than offset gross profit increases in our other ATS businesses,as well as lower gross profit in our CCS segment predominately due to lower CCS segment revenue. The increase in gross marginin Q2 2019 as compared to the prior year period was the result of favorable changes in mix and productivity, which more thanoffset the weaker capital equipment performance. Gross profit for 1H 2019 decreased by 7% to $185.2 million compared to 1H2018, for reasons substantially similar to those described for the quarterly period. Gross margin for 1H 2019 increased from 6.2%in 1H 2018 to 6.4%, for reasons substantially similar to those described for the quarterly period. In addition, gross profit for eachof Q2 2018 and 1H 2018 was negatively impacted by higher inventory provisions as compared to Q2 2019 and 1H 2019 (describedbelow).
We recorded net inventory provisions of $1.5 million in Q2 2019, related primarily to our ATS segment, and reflectingan increase in aged ATS segment inventory as compared to the prior year period, compared to $8.1 million of net inventoryprovisions in Q2 2018, approximately three-quarters of which related to our CCS segment. We recorded net inventory provisionsof $6.2 million in 1H 2019, related primarily to our ATS segment, and reflecting an increase in aged ATS segment inventorycompared to the prior year period (1H 2018 — $9.1 million, approximately three-quarters of which related to our CCS segment).We regularly review our estimates and assumptions used to value our inventory through analysis of historical performance.
As noted above, some of our customer agreements require us to provide specific price reductions over the contract term,which has significantly impacted revenue and margins in our CCS segment in recent periods, and is expected to continue. SeeItem 5. "Operating and Financial Review and Prospects — Operating Results — Gross profit" of our 2018 20-F for a generaldiscussion of the factors that can cause gross margin to fluctuate from period to period, including order cancellations/delays,competitive pricing pressures and/or mix changes.
Selling, general and administrative expenses:
SG&A for Q2 2019 of $60.7 million (4.2% of total revenue) increased $8.0 million compared to $52.7 million (3.1% oftotal revenue) for Q2 2018. SG&A for 1H 2019 of $116.8 million (4.1% of total revenue) increased $11.8 million compared to$105.0 million (3.3% of total revenue) for 1H 2018. The increase for Q2 2019 compared to Q2 2018 was primarily due to theoperations of recently-acquired Impakt (ATS segment) (approximately $3.3 million), as well as a $3.1 million foreign exchangeloss we recorded in Q2 2019. The increase in SG&A for 1H 2019 as compared to 1H 2018 reflected these items, as well as theoperations of Atrenne (ATS segment) acquired in April 2018 (approximately $3 million per quarter).
Segment income and margin:
Segment performance is evaluated based on segment revenue (set forth above), segment income and segment margin(segment income as a percentage of segment revenue). Revenue is attributed to the segment in which the product is manufacturedor the service is performed. Segment income is defined as a segment’s net revenue less its cost of sales and its allocable portionof selling, general and administrative expenses and research and development expenses (collectively, Segment Costs). IdentifiableSegment Costs are allocated directly to the applicable segment while other Segment Costs, including indirect costs and certaincorporate charges, are allocated to our segments based on an analysis of the relative usage or benefit derived by each segmentfrom such costs. Segment income excludes finance costs (defined below), amortization of intangible assets (excluding computersoftware), employee stock-based compensation expense, net restructuring, impairment and other charges (recoveries), and whenrecognized, fair value adjustments for acquired inventory (each of which exclusions is quantified herein), as these costs and charges/
12
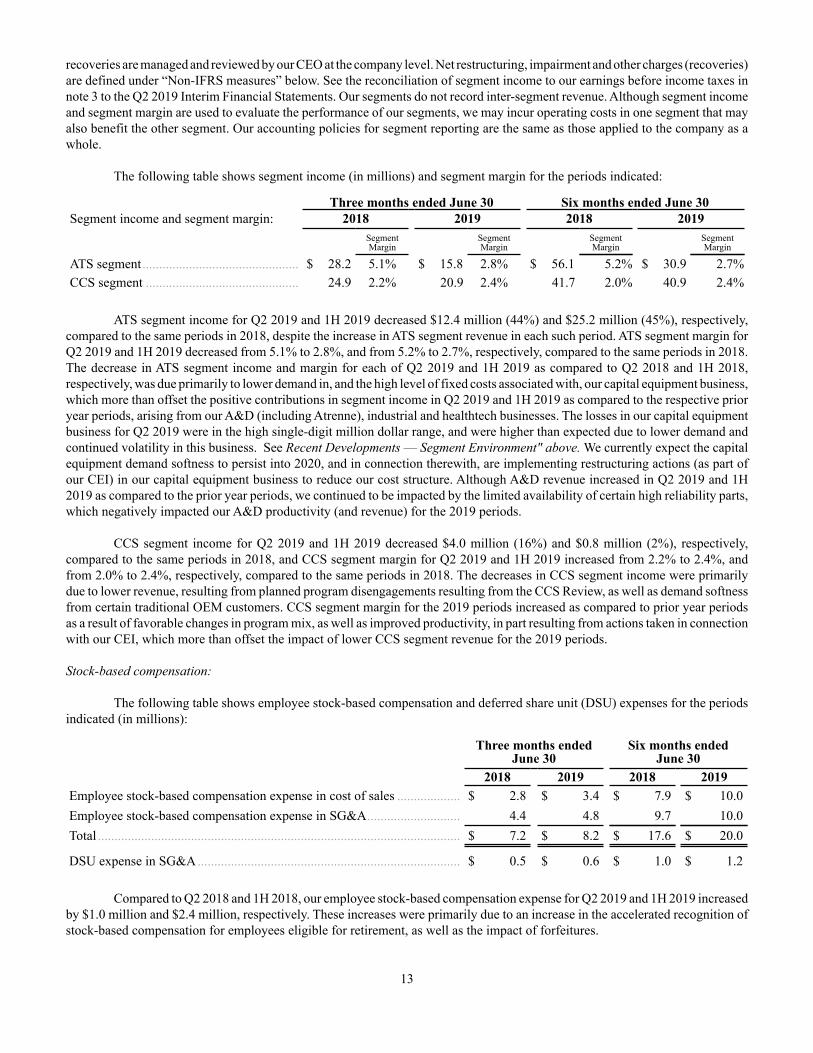
recoveries are managed and reviewed by our CEO at the company level. Net restructuring, impairment and other charges (recoveries)are defined under “Non-IFRS measures” below. See the reconciliation of segment income to our earnings before income taxes innote 3 to the Q2 2019 Interim Financial Statements. Our segments do not record inter-segment revenue. Although segment incomeand segment margin are used to evaluate the performance of our segments, we may incur operating costs in one segment that mayalso benefit the other segment. Our accounting policies for segment reporting are the same as those applied to the company as awhole.
The following table shows segment income (in millions) and segment margin for the periods indicated:
Three months ended June 30 Six months ended June 30Segment income and segment margin: 2018 2019 2018 2019
SegmentMargin
SegmentMargin
SegmentMargin
SegmentMargin
ATS segment............................................... $ 28.2 5.1% $ 15.8 2.8% $ 56.1 5.2% $ 30.9 2.7%CCS segment .............................................. 24.9 2.2% 20.9 2.4% 41.7 2.0% 40.9 2.4%
ATS segment income for Q2 2019 and 1H 2019 decreased $12.4 million (44%) and $25.2 million (45%), respectively,compared to the same periods in 2018, despite the increase in ATS segment revenue in each such period. ATS segment margin forQ2 2019 and 1H 2019 decreased from 5.1% to 2.8%, and from 5.2% to 2.7%, respectively, compared to the same periods in 2018.The decrease in ATS segment income and margin for each of Q2 2019 and 1H 2019 as compared to Q2 2018 and 1H 2018,respectively, was due primarily to lower demand in, and the high level of fixed costs associated with, our capital equipment business,which more than offset the positive contributions in segment income in Q2 2019 and 1H 2019 as compared to the respective prioryear periods, arising from our A&D (including Atrenne), industrial and healthtech businesses. The losses in our capital equipmentbusiness for Q2 2019 were in the high single-digit million dollar range, and were higher than expected due to lower demand andcontinued volatility in this business. See Recent Developments — Segment Environment" above. We currently expect the capitalequipment demand softness to persist into 2020, and in connection therewith, are implementing restructuring actions (as part ofour CEI) in our capital equipment business to reduce our cost structure. Although A&D revenue increased in Q2 2019 and 1H2019 as compared to the prior year periods, we continued to be impacted by the limited availability of certain high reliability parts,which negatively impacted our A&D productivity (and revenue) for the 2019 periods.
CCS segment income for Q2 2019 and 1H 2019 decreased $4.0 million (16%) and $0.8 million (2%), respectively,compared to the same periods in 2018, and CCS segment margin for Q2 2019 and 1H 2019 increased from 2.2% to 2.4%, andfrom 2.0% to 2.4%, respectively, compared to the same periods in 2018. The decreases in CCS segment income were primarilydue to lower revenue, resulting from planned program disengagements resulting from the CCS Review, as well as demand softnessfrom certain traditional OEM customers. CCS segment margin for the 2019 periods increased as compared to prior year periodsas a result of favorable changes in program mix, as well as improved productivity, in part resulting from actions taken in connectionwith our CEI, which more than offset the impact of lower CCS segment revenue for the 2019 periods.
Stock-based compensation:
The following table shows employee stock-based compensation and deferred share unit (DSU) expenses for the periodsindicated (in millions):
Three months endedJune 30
Six months endedJune 30
2018 2019 2018 2019Employee stock-based compensation expense in cost of sales ................... $ 2.8 $ 3.4 $ 7.9 $ 10.0Employee stock-based compensation expense in SG&A............................ 4.4 4.8 9.7 10.0Total ............................................................................................................. $ 7.2 $ 8.2 $ 17.6 $ 20.0
DSU expense in SG&A............................................................................... $ 0.5 $ 0.6 $ 1.0 $ 1.2
Compared to Q2 2018 and 1H 2018, our employee stock-based compensation expense for Q2 2019 and 1H 2019 increasedby $1.0 million and $2.4 million, respectively. These increases were primarily due to an increase in the accelerated recognition ofstock-based compensation for employees eligible for retirement, as well as the impact of forfeitures.
13

Other charges (recoveries):
We have recorded the following restructuring and other charges (recoveries) for the periods indicated (in millions):
Three months ended June 30 Six months ended June 302018 2019 2018 2019
Restructuring charges......................................................... $ 8.8 $ 9.0 $ 15.7 $ 16.1Transition Costs (Recoveries) ............................................ 3.5 0.6 5.2 (98.2)Accelerated amortization of unamortized deferredfinancing costs* ................................................................. 1.2 — 1.2 —Acquisition costs and other................................................ 2.3 0.9 4.2 1.1
$ 15.8 $ 10.5 $ 26.3 $ (81.0)* Recorded in connection with the extinguishment of our prior credit facility.
Restructuring:
We perform ongoing evaluations of our business, operational efficiency and cost structure, and implement restructuringactions as we deem necessary. We are currently implementing restructuring actions under our previously-disclosed CEI, includingactions related to our CCS Review and our capital equipment business. We have recorded $59.5 million in restructuring chargesfrom the commencement of our CEI through the end of Q2 2019, including the restructuring charges recorded in the periodsdescribed below. The majority of these charges pertained to workforce reductions at sites associated primarily with our CCSsegment. One-third of the restructuring charges in Q2 2019 pertained to our capital equipment business within our ATS segment.
Restructuring charges of $9.0 million and $16.1 million for Q2 2019 and 1H 2019, respectively, consisted of cash chargesof $5.9 million and $12.3 million, respectively, primarily for employee termination costs in Q2 2019, and employee and leasetermination costs in 1H 2019, and non-cash charges of $3.1 million and $3.8 million, respectively, to write off certain equipmentrelated to our capital equipment business, as well as disengaged programs in connection with our CCS Review. Net restructuringcharges of $8.8 million for Q2 2018 consisted of cash charges of $8.9 million, primarily for consultant costs and employeetermination costs, offset in part by a non-cash recovery of $0.1 million, representing gains on the sale of surplus equipment.Restructuring charges of $15.7 million for 1H 2018 consisted of cash charges of $15.5 million, primarily for consultant costs andemployee termination costs, and non-cash charges of $0.2, representing losses on the sale of surplus equipment. Our restructuringprovision at June 30, 2019 was $7.5 million (December 31, 2018 — $10.3 million), which we currently expect to pay in 2019. Allcash outlays have been, and the balance is expected to be, funded with cash on hand.
We may also propose additional future restructuring actions or divestitures as a result of changes in our business, themarketplace and/or our exit from less profitable, under-performing, non-core or non-strategic operations. In addition, an increasein the frequency of customers transferring business to our EMS competitors, changes in the volumes they outsource, pricingpressures, or requests to transfer their programs among our sites or to lower-cost locations, may also result in our taking futurerestructuring actions. We may incur higher operating expenses during periods of transitioning programs within our network or toour competitors. Any such restructuring activities, if undertaken at all, could adversely impact our operating and financial results,and may require us to further adjust our operations.
Transition Costs (Recoveries):
Transition Costs are comprised of transition-related relocation and duplicate costs pertaining to the relocation of ourToronto manufacturing operations and our corporate headquarters in connection with the sale of our Toronto real property. TransitionRecoveries consist of the $102 million gain we recorded on the sale of our Toronto real property in Q1 2019 (Property Gain). See"Non-IFRS measures" below for further detail.
During Q2 2019 and 1H 2019, we recorded aggregate Transition Costs of $0.6 million and $3.8 million respectively,pertaining primarily to the relocation of our temporary corporate headquarters (Q2 2018 and 1H 2018 — $3.5 million and $5.2million, respectively, pertaining to the relocation of our Toronto manufacturing operations). In 1H 2019, we also recorded theProperty Gain.
14

Acquisition costs and other:
Acquisition costs consist of consulting, transaction and integration costs relating to potential and completed acquisitions,and in 2019, charges related to the subsequent re-measurement of indemnification assets recorded in connection with our Impaktacquisition. During Q2 2019 and 1H 2019, we recorded $1.8 million and $3.1 million in Acquisition costs (including $1.6 millionand $2.2 million in such re-measurement charges), respectively (Q2 2018 and 1H 2018 — Acquisition costs of $2.2 million and$3.9 million, respectively). Acquisition costs in Q2 2019 and 1H 2019 were offset in part by legal recoveries (for prior periodfreight charges) in connection with the settlement of class action lawsuits in which we were a plaintiff.
Finance costs:
During Q2 2019 and 1H 2019, we recorded $12.6 million and $26.2 million of finance costs, respectively (Q2 2018 and1H 2018 — $4.9 million and $8.2 million, respectively). Finance costs are comprised of interest expense and fees related to ourcredit facility (including debt issuance and related amortization costs), our interest rate swap agreements (commencing in the thirdquarter of 2018), our accounts receivable sales program and a customer's supplier financing program, and, beginning Q1 2019,interest expense on our lease obligations under IFRS 16. The increase in finance costs in Q2 2019 and 1H 2019 as compared tothe prior year periods was primarily due to increased borrowings under our credit facility, as well as increases in applicable interestrates.
Income taxes:
For Q2 2019, we had a net income tax expense of $5.1 million on loss before tax of $1.0 million, compared to a netincome tax expense of $4.8 million on earnings before tax of $20.9 million for Q2 2018. For 1H 2019, we had a net income taxexpense of $9.6 million on earnings before tax of $93.8 million, compared to a net income tax expense of $10.1 million on earningsbefore tax of $40.3 million for 1H 2018. The earnings for 1H 2019 included the Property Gain (discussed above), which had nonet tax impact, as such gain was offset by the utilization of previously unrecognized tax losses.
During Q2 2019, our net income taxes were favorably impacted by a $1.3 million reversal of previously recorded taxliabilities resulting from the favorable conclusion of a liquidation audit in Asia, as well as $3.3 million in certain previously-recorded tax uncertainties becoming statute-barred. These income tax benefits were offset in part by additional taxes due to adversetaxable foreign exchange impacts arising from the weakening of the Chinese renminbi relative to the U.S. dollar (our functionalcurrency).
During Q2 2018 and 1H 2018, we received a favorable conclusion to our application for a bi-lateral advance pricingarrangement (BAPA) between the U.S. and Mexican tax authorities. Accordingly, we reversed $6.0 million of Mexican incometaxes previously accrued to reflect the approved BAPA terms, which favorably impacted our net income tax expense for Q2 2018.In addition, as a result of our Atrenne acquisition, we recognized $3.7 million of previously unrecognized deferred tax assets inour U.S. group of subsidiaries in Q2 2018, which partially offset the net deferred tax liabilities that arose in connection with suchacquisition. These income tax benefits were offset in part by additional taxes due to an increased proportion of profits earned intaxable jurisdictions, and with respect to Q2 2018, adverse taxable foreign exchange impacts arising from the weakening of theMalaysian ringgit, Chinese renminbi and Thai baht relative to the U.S. dollar.
Based on currently available information, we continue to believe that the impact of the recently-enacted U.S. Tax Cutsand Jobs Act will not be material.
We have three income tax incentives in Thailand with varying exemption periods. These incentives initially allow for a100% income tax exemption (including distribution taxes), which after eight years transition to a 50% income tax exemption forthe next five years (excluding distribution taxes). Upon full expiry of each of the incentives, taxable profits associated with suchexpired tax incentives become fully taxable. One of our Thailand tax incentives will expire in October 2019, another will expirein 2020, and the third will transition to the 50% exemption in 2022, and expire in 2027. Based on our current levels of businessin Thailand, we do not anticipate any significant additional tax expense upon the expiry of the first tax incentive in 2019. Our taxexpense could increase significantly if certain tax incentives from which we benefit are retracted. See Item 5, "Operating andFinancial Review and Prospects — Operating Results — Income taxes" of our 2018 20-F for a discussion of general factors thatimpact our effective tax rate.
In certain jurisdictions, primarily in the Americas and Europe, we currently have significant net operating losses and otherdeductible temporary differences, some of which we expect will be used to reduce taxable income in these jurisdictions infuture periods, although not all are currently recognized as deferred tax assets. In addition, the tax benefits we are able to record
15

related to restructuring charges and stock-based compensation expenses are limited as a significant portion of such amounts areincurred in jurisdictions with unrecognized loss carryforwards. Tax benefits we are able to record related to the accountingamortization of intangible assets are also limited.
We are subject to tax audits in various jurisdictions. Reviews by tax authorities generally focus on, but are not limited to,the validity of our inter-company transactions, which may involve subjective areas of taxation and significant judgment. We believewe adequately accrue for any probable potential adverse tax ruling. However, there can be no assurance as to the final resolutionof any claims and any resulting proceedings. If any claims and any ensuing proceedings are determined adversely to us, the amountswe may be required to pay could be material, in excess of amounts accrued, and/or have a significant adverse impact on our futureearnings and future cash flows.
In 2017, the Brazilian Ministry of Science, Technology, Innovation and Communications issued assessments seeking to
disqualify certain amounts of research and development expenses for the years 2006 to 2009, which entitled our Brazilian subsidiary(which ceased operations in 2009) to charge reduced sales tax levies to its customers. The assessments remain under appeal andthere have been no changes in the status of this matter during Q2 2019. See 2018 AFS for further details.
Net earnings (loss):
Net loss for Q2 2019 of $6.1 million represented a decrease of $22.2 million compared to net earnings of $16.1 millionfor Q2 2018. This decrease was primarily due to $7.0 million in lower gross profit, $8.0 million in increased SG&A expenses, and$7.7 million in higher finance costs in Q2 2019 as compared to the same period in 2018. Net earnings for 1H 2019 of $84.2 millionincreased $54.0 million compared to 1H 2018. The increase was primarily due to the gain of $102.0 million on the sale of theToronto real property in Q1 2019, offset by $13.1 million in lower gross profit, $11.8 million in higher SG&A expenses and $9.9million in higher amortization of intangible assets (with respect to SG&A and intangibles amortization, both primarily due to ourAtrenne and Impakt acquisitions in 2018), and $18.0 million in higher finance costs in 1H 2019 as compared to the same periodin 2018, as discussed above, and with respect to intangibles amortization, in note 4 to the Q2 2019 Interim Financial Statements.
16
Liquidity and Capital Resources
Liquidity
The following tables set forth key liquidity metrics for the periods indicated (in millions):
December 31 June 302018 2019
Cash and cash equivalents ............................................................................................. $ 422.0 $ 436.5Borrowings under credit facility.................................................................................... 757.3 648.3
Three months ended June 30 Six months ended June 302018 2019 2018 2019
Cash provided by (used in) operating activities ............... $ (14.9) $ 90.3 $ (20.3) $ 161.6Cash provided by (used in) investing activities................ (166.8) (21.8) (180.5) 71.5Cash provided by (used in) financing activities ............... 147.4 (89.8) 87.0 (218.6)
Changes in non-cash working capital items (included inoperating activities above):
A/R.................................................................................... $ (104.8) $ 12.3 $ (86.4) $ 182.8Inventories ........................................................................ (65.3) (7.7) (170.1) 4.0Other current assets........................................................... (6.2) 20.6 (9.6) 15.3A/P, accrued and other current liabilities and provisions . 121.4 11.6 166.6 (152.8)Working capital changes................................................... $ (54.9) $ 36.8 $ (99.5) $ 49.3

Cash provided by (used in) operating activities:
In Q2 2019, we generated $90.3 million of cash from operating activities compared to $14.9 million of cash used inoperating activities in Q2 2018. For 1H 2019, we generated $161.6 million of cash from operating activities compared to $20.3million of cash used in operating activities in 1H 2018. The increase in cash from operations in Q2 2019 and 1H 2019 as comparedto the prior year periods was primarily due to $91.7 million and $148.8 million in lower working capital requirements, respectively.Lower working capital requirements for Q2 2019 as compared to Q2 2018 were driven by improvements in accounts receivable($117.1 million), inventory ($57.6 million) and other current assets ($26.8 million), offset in part by a decrease in accounts payablebalances ($109.8 million). Lower working capital requirements for 1H 2019 as compared to 1H 2018 were driven by improvementsin accounts receivable ($269.2 million), inventory ($174.1 million) and other current assets ($24.9 million), offset in part by adecrease in accounts payable balances ($319.4 million). The improvements in A/R for Q2 2019 and 1H 2019 as compared to sameperiods in 2018 reflect the improved timing of collections, as well as the lower revenue levels during Q2 2019 and 1H 2019. Theimprovements in inventory for Q2 2019 and 1H 2019 compared to the same periods in 2018 reflect lower inventory levels requiredto support the business, including as a result of disengaged programs resulting from the CCS Review, offset in part by the impactof materials constraints, as well as the build-up of inventory for new program ramps in both of our segments. The decrease inaccounts payable for Q2 2019 and 1H 2019 as compared to same periods in 2018 reflects the decreased level of inventory purchases,and timing of payments, offset in part by $18.2 million and $80.7 million in higher customer cash deposits during the 2019 periods,respectively.
From time to time, we extend payment terms applicable to certain customers, and/or provide longer payment terms tonew customers or with respect to new programs. If this becomes more prevalent, it could adversely impact our working capitalrequirements, and increase our financial exposure and credit risk. To substantially offset the effect of extended payment terms fora particular customer on our working capital, we participate in such customer's supplier financing program (SFP) pursuant to whichparticipating suppliers may sell A/R from such customer to a third-party bank on an uncommitted basis in order to receive earlierpayment. At June 30, 2019, we sold $11.5 million of A/R under the SFP (June 30, 2018 — $76.0 million; December 31, 2018 —$50.0 million). We pay discount charges with respect to this arrangement, which we record as finance costs in our consolidatedstatement of operations. The decrease in amounts of A/R sold under the SFP during Q2 2019 and 1H 2019 as compared to theprior year periods reflects our disengagement from various programs with such customer as a result of the CCS Review.
Free cash flow (non-IFRS):
Non-IFRS free cash flow is defined as cash provided by or used in operations after the purchase of property, plant andequipment (net of proceeds from the sale of certain surplus equipment and property), lease payments (including lease paymentsunder IFRS 16), and finance costs paid (excluding debt issuance costs paid). As a measure of liquidity, and consistent with theinclusion of our Toronto relocation capital expenditures and Transition Costs in non-IFRS free cash flow in the periods incurred,we have included the $113.0 million in proceeds from our Toronto real property sale in non-IFRS free cash flow in Q1 2019 (theperiod of receipt). We incurred debt issuance costs in connection with our recent credit facility (upon execution and subsequentsecurity arrangements) which we do not consider to be part of our core operating expenses. As a result, we modified our non-IFRSfree cash flow calculation, commencing in Q1 2019, to exclude debt issuance costs from total finance costs paid ($0.9 million and$1.8 million in Q2 2019 and 1H 2019, respectively; $7.4 million in Q2 2018 and 1H 2018). Prior period comparatives have beenrestated to conform to the current presentation. In addition, as of January 1, 2019, as a result of our adoption of IFRS 16 (Leases),we have also modified our non-IFRS free cash flow calculation to subtract lease payments under IFRS 16, as such payments werepreviously (but are no longer) reported in cash provided by (used in) operations. IFRS 16 did not require the restatement of priorperiod financial statements. Accordingly, and in order to preserve comparability with prior calculations, commencing in Q1 2019,such lease payments are subtracted from cash provided by (used in) operations in our determination of non-IFRS free cash flow.Note that non-IFRS free cash flow, however, does not represent residual cash flow available to Celestica for discretionaryexpenditures. Management uses non-IFRS free cash flow as a measure, in addition to IFRS cash provided by or used in operations,to assess our operational cash flow performance. We believe non-IFRS free cash flow provides another level of transparency toour liquidity.
17

A reconciliation of this measure to cash provided by (used in) operating activities measured under IFRS is set forth below(in millions):
Three months ended June 30 Six months ended June 302018 2019 2018 2019
restated restatedIFRS cash provided by (used in) operations ........................ $ (14.9) $ 90.3 $ (20.3) $ 161.6
Purchase of property, plant and equipment, net of salesproceeds............................................................................. (25.1) (23.2) (38.8) 70.1Lease payments ................................................................. (0.8) (9.5) (12.6) (18.8)Finance costs paid (excluding debt issuance costs paid)... (4.8) (11.1) (8.0) (21.7)
Non-IFRS free cash flow ..................................................... $ (45.6) $ 46.5 $ (79.7) $ 191.2
Our non-IFRS free cash flow (defined above) of positive $46.5 million and positive $191.2 million, for Q2 2019 and 1H2019, respectively, increased $92.1 million and $270.9 million, respectively, compared to negative $45.6 million and negative$79.7 million for Q2 2018 and 1H 2018, respectively, primarily due to higher cash generated from operating activities (discussedabove) and the $113.0 million in proceeds we received from the sale of our Toronto real property in March 2019 (included in"purchase of property, plant and equipment, net of sales proceeds" in the table above).
Cash provided by (used in) investing activities:
Our capital expenditures for Q2 2019 and1H 2019 were $23.2 million and $42.9 million, respectively (Q2 2018 and 1H2018 — $25.1 million and $42.3 million, respectively), primarily to enhance our manufacturing capabilities in various geographiesand to support new customer programs (split approximately evenly between our segments). Our capital expenditures for Q2 2019and 1H 2019 included $0.6 million and $5.0 million, respectively, related to our temporary corporate headquarters. We funded ourcapital expenditures from cash on hand.
In March 2019, the $113.0 million in proceeds from the sale of our Toronto real property were reported as cash providedby investing activities for 1H 2019.
Cash provided by (used in) financing activities:
Share repurchases:
During Q2 2019 and 1H 2019, we paid $22.8 million and $67.3 million, respectively (Q2 2018 and 1H 2018 — $3.2million and $38.3 million, respectively) (including transaction fees) to repurchase and cancel 3.2 million and 8.3 million subordinatevoting shares, respectively (Q2 2018 and 1H 2018 — 0.3 million and 3.6 million subordinate voting shares, respectively), at aweighted average price of $7.15 and $8.15 per share, respectively (Q2 2018 and 1H 2018 — $12.28 and $10.75 per share,respectively), under our applicable normal course issuer bid.
During Q2 2019 and 1H 2019, we did not purchase any subordinate voting shares to satisfy obligations under our stock-based compensation plans. During Q2 2018 and 1H 2018, we paid $5.3 million and $9.6 million (including transaction fees),respectively, for a broker's purchase of 0.4 million and 0.8 million subordinate voting shares, respectively, for such purpose.
Financing:
During Q2 2019 and 1H 2019, we made aggregate scheduled principal repayments of $1.5 million and $3.0 million,respectively, under our term loans (Q2 2018 and 1H 2018 — $6.25 million and $12.5 million, respectively).
During Q1 2019, we borrowed $48.0 million under our Revolver (defined under "Cash requirements" below), primarilyto fund our share repurchases. During Q1 2019, we repaid $110.0 million of the outstanding amounts under our Revolver, usingthe proceeds from the sale of our Toronto real property. During Q2 2019, we repaid an additional $44.0 million under our Revolver.During Q2 2018 and 1H 2018, we borrowed $163.0 million under a prior revolver, primarily to fund our Atrenne acquisition andfor working capital purposes. We repaid such amounts and amounts outstanding under our prior term loan ($175.0 million) in Q22018 (terminating the entire prior facility) using the proceeds from the Initial Term Loan (defined below).
18

During Q2 2019 and 1H 2019, we paid finance costs of $12.0 million and $23.5 million, respectively, including debtissuance costs of $0.9 million and $1.8 million, respectively. During Q2 2018 and 1H 2018, we paid finance costs of $12.2 millionand $15.4 million, respectively, including debt issuance costs of $7.4 million in Q2 2018. The increase in finance costs was primarilydue to higher interest expense under our credit facility resulting from increased borrowings, as well as increases in interest ratescompared to Q2 2018 and 1H 2018. Outstanding credit facility balances and interest rates as of June 30, 2019 are discussed below.
Lease payments:
During Q2 2019 and 1H 2019, we paid $9.5 million and $18.8 million, respectively (Q2 2018 and 1H 2018 — $0.8 millionand $12.6 million, respectively) in lease payments (see "Cash Requirements" below), including $8.9 million and $17.2 million,respectively, for lease payments under IFRS 16 (effective January 1, 2019). Lease payments for 1H 2018 included $11.3 million(including fees and accrued interest) we paid in January 2018 to settle and terminate our solar panel equipment leases. Leasepayments reduce our non-IFRS free cash flow. See "Non-IFRS free cash flow" above for a discussion of modifications to ourcalculation of such measurement with respect to lease payments under IFRS 16. At June 30, 2019, we had a total of $131.3 millionin lease obligations outstanding (December 31, 2018 — $10.4 million in lease obligations outstanding).
Cash requirements:
In June 2018, we entered into an $800.0 million credit facility (Credit Facility) providing a $350.0 million term loan(Initial Term Loan) and a $450.0 million revolver (Revolver). In November 2018, we added a $250.0 million term loan (IncrementalTerm Loan). The Initial Term Loan and the Incremental Term Loan are referred to collectively as the Term Loans.
We maintain the Revolver, uncommitted bank overdraft facilities, and an A/R sales program, and we participate in theSFP, to provide short-term liquidity and to have funds available for working capital and other investments to support our strategicpriorities. See "Capital Resources" below for a discussion of swing line and letter of credit sub-limits under the Revolver, as wellas the accordion feature of the Credit Facility. Our working capital requirements can vary significantly from month-to-month dueto a range of business factors, including the ramping of new programs, expansion of our services and business operations, timingof purchases, higher levels of inventory for new programs and anticipated customer demand, timing of payments and A/R collections,and customer forecasting variations. The international scope of our operations may also create working capital requirements incertain countries while other countries generate cash in excess of working capital needs. Moving cash between countries on ashort-term basis to fund working capital is not always expedient due to local currency regulations, tax considerations, and otherfactors. To meet our working capital requirements and to provide short-term liquidity, we may draw on the Revolver, sell A/Rthrough our A/R sales program or participate in the SFP, while available. The timing and the amounts we borrow or repay underthese facilities can vary significantly from month-to-month depending upon our cash requirements. As at June 30, 2019, other thanordinary course letters of credit, $53.0 million was outstanding under the Revolver (December 31, 2018 — $159.0 million). See"Capital Resources" below.
We do not believe that the aggregate amounts outstanding under our Credit Facility as at June 30, 2019 (described under
"Capital Resources" below) have had (or will have) a significant adverse impact on our liquidity, our results of operations orfinancial condition. At June 30, 2019, we had $374.8 million available under our Revolver for future borrowings, reflectingoutstanding borrowings and letters of credit (December 31, 2018 — $269.7 million available). We believe that cash flow fromoperating activities, together with cash on hand, remaining availability under the Revolver, intra-day and overnight bank overdraftfacilities, and cash from the sale of A/R, will continue to be sufficient to fund our currently anticipated working capital needs andplanned capital spending (including the commitments described elsewhere herein). In addition, we believe that our current levelof leverage is acceptable for a company of our size and that we will remain in compliance with the financial covenants under theCredit Facility.
Notwithstanding the foregoing, however, our increased indebtedness, together with the mandatory prepayment provisionsof the Credit Agreement (described below), has reduced our ability to fund future acquisitions and/or to respond to unexpectedcapital requirements, and will require us to use an increased amount of our cash flow to service such debt. See Item 5. "Operatingand Financial Review and Prospects — Liquidity — Cash requirements" of our 2018 20-F for a discussion of other potentialadverse effects of such increased indebtedness, as well as a discussion of adverse effects that may result from any significant useof cash, issuance of securities, and/or further increase in our levels of third-party indebtedness to fund operations and/or makeadditional acquisitions.
19

In addition to required aggregate quarterly principal repayments on the Term Loans of $1.5 million, commencing in 2020,we will be required to make an annual prepayment of outstanding obligations under the Credit Facility (applied first to the TermLoans, then to the Revolver, in the manner set forth in the Credit Facility) ranging from 0% — 50% (based on a defined leverageratio) of specified excess cash flow (as defined in the Credit Facility) for the prior fiscal year. Proceeds from the sale of our Torontoreal property will be taken into account in the determination of excess cash flow. In addition, prepayments of outstanding obligationsunder the Credit Facility (applied as described above) may also be required in the amount of specified net cash proceeds receivedabove a specified annual threshold (including proceeds from the disposal of certain assets, but excluding the net proceeds fromthe sale of our Toronto real property). Repaid amounts on the Term Loans may not be re-borrowed. Repaid amounts on the Revolvermay be re-borrowed.
Interest expense for Q2 2019 and 1H 2019 under the Credit Facility, and including the impact of our interest rate swapagreements, was approximately $10 million and $20 million, respectively (Q2 2018 and 1H 2018 — approximately $4 millionand $6 million, respectively). Any increase in prevailing interest rates, margins, or amounts outstanding, would cause this amountto increase. Commitment fees paid during Q2 2019 and 1H 2019 were $0.3 million and $0.6 million, respectively (Q2 2018 and1H 2018 — $0.6 million and $0.9 million, respectively).
As at June 30, 2019, a significant portion of our cash and cash equivalents was held by foreign subsidiaries outside ofCanada, a large part of which may be subject to withholding taxes upon repatriation under current tax laws. Cash and cash equivalentsheld by subsidiaries related to undistributed earnings that are considered indefinitely reinvested outside of Canada (which we donot intend to repatriate in the foreseeable future) are not subject to these withholding taxes. We currently expect to repatriateapproximately $30 million from various foreign subsidiaries in the near term, and have recorded any anticipated future withholdingtaxes as deferred income tax liabilities. While some of our subsidiaries are subject to local governmental restrictions on the flowof capital into and out of their jurisdictions (including in the form of cash dividends, loans or advances to us), which is requiredor desirable from time to time to meet our international working capital needs and other business objectives (as described above),these restrictions have not had a material impact on our ability to meet our cash obligations. At June 30, 2019, we had approximately$377 million (December 31, 2018 — $355 million) of cash and cash equivalents held by foreign subsidiaries outside of Canadathat we do not intend to repatriate in the foreseeable future.
Our capital spending varies each period based on the timing of new business wins and forecasted sales levels. Based onour current operating plans, we anticipate capital spending for 2019 to be approximately 1.5% to 2.0% of revenue, and expect tofund these expenditures from cash on hand and through the financing agreements described below under "Capital Resources."
Toronto Real Property and Related Transactions:
On March 7, 2019, we completed the sale of our Toronto real property and received proceeds of $113.0 million, includinga high density bonus and an early vacancy incentive related to the temporary relocation of our corporate headquarters. The $102.0million Property Gain was recorded in other charges (recoveries). See note 8 to our 2018 AFS for a description of the sale agreement(Property Sale Agreement), including its assignment from the original purchaser (the Property Purchaser) to a new purchaser(Assignee) in September 2018. See "Related Party Transactions" below for a description of the ownership of the Property Purchaserand its 5% non-voting interest in the Assignee.
In connection with the then-anticipated sale, we entered into a long-term lease in November 2017 for the relocation ofour Toronto manufacturing operations, which was completed in February 2019. As part of the property sale, we also entered intoa 10-year lease in March 2019 with the Assignee for our new corporate headquarters (described below), to be built by the Assigneeon the site of our former location. In connection therewith, we completed the temporary relocation of our corporate headquartersin Q2 2019 (pursuant to a 3-year lease executed in September 2018) while our new corporate headquarters is under construction.In connection with such relocations, we capitalized building improvements and equipment costs related to our new manufacturingsite (nil and $1.2 million in Q2 2019 and 1H 2019, respectively; $17 million since commencement in the fourth quarter of 2017through completion), and our temporary corporate headquarters ($0.6 million and $5.0 million in Q2 2019 and 1H 2019, respectively;nil prior to 2019). We also incurred Transition Costs (defined under "IFRS Measures" below) of $0.6 million and $3.8 million inQ2 2019 and 1H 2019, respectively; and $18.6 million since commencement, which we recorded in other charges.
The commencement date of the 10-year lease for our new corporate headquarters will be determined by the Assignee,and is currently targeted to be May 2022. Upon such commencement, our estimated annual basic rent will be approximately $2.5million Canadian dollars for each of the first five years, and approximately $2.7 million Canadian dollars for each of the remainingfive years. We may, at our option, extend the lease for two further consecutive five year periods.
20

Share Repurchases:
We have funded and intend to continue to fund our share repurchases from cash on hand, borrowings under our Revolver,or a combination thereof. See "Cash provided by (used in) financing activities" above.
Indemnities:
We provide routine indemnifications, the terms of which range in duration and often are not explicitly defined. Thesemay include indemnifications against third-party intellectual property infringement claims and certain third-party negligence claimsfor property damage. We have also provided indemnifications in connection with the sale of certain businesses and real property.The maximum potential liability from these indemnifications cannot be reasonably estimated. In some cases, we have recourseagainst other parties to mitigate our risk of loss from these indemnifications. Historically, we have not made significant paymentsrelating to these types of indemnifications.
Litigation and contingencies:
In the normal course of our operations, we may be subject to lawsuits, investigations and other claims, includingenvironmental, labor, product, customer disputes, and other matters. Management believes that adequate provisions have beenrecorded where required. Although it is not always possible to estimate the extent of potential costs, if any, management believesthat the ultimate resolution of all such pending matters will not have a material adverse impact on our financial performance,financial position or liquidity. See "Operating Results — Income Taxes" above for a description of certain tax matters.
21
Capital Resources
Our capital resources consist of cash provided by operating activities, access to the Revolver, intraday and overnight bankoverdraft facilities, an A/R sales program, the SFP, and our ability to issue debt or equity securities. We regularly review ourborrowing capacity and make adjustments, as permitted, for changes in economic conditions and changes in our requirements. Aspart of our strategic initiatives to scale and diversify our ATS revenue base and expand our capabilities in our ATS segment, wehave increased our levels of third-party indebtedness, and had previously increased A/R sales in order to fund acquisitions andworking capital needs. In addition, we may use cash on hand, issue equity or debt, or further increase our levels of third-partyindebtedness (or any combination of the foregoing) in order to fund operations or additional acquisitions. See "Liquidity — Cashrequirements" above, and Item 5. "Operating and Financial Review and Prospects — Liquidity — Cash requirements" of our 201820-F for a discussion of anticipated and potential adverse impacts resulting from such actions. We centrally manage our fundingand treasury activities in accordance with corporate policies, the main objectives of which are to ensure appropriate levels ofliquidity, to have funds available for working capital or other investments we determine are required to grow our business, tocomply with debt covenants, to maintain adequate levels of insurance, and to balance our exposures to market risks.
At June 30, 2019, we had cash and cash equivalents of $436.5 million (December 31, 2018 — $422.0 million), of which
approximately 85% was cash and 15% was cash equivalents, consisting of bank deposits. The majority of our cash and cashequivalents was denominated in U.S. dollars, and the remainder was held primarily in Chinese renminbi and the Euro. Our cashand cash equivalents are subject to intra-quarter swings, generally related to the timing of A/R collections, inventory purchasesand payments, and other capital uses.
Until June 27, 2018, we were party to a credit facility (Prior Facility), that consisted of a $300.0 million revolver and afully drawn $250.0 million term loan, each of which was scheduled to mature in May 2020. The Prior Facility is described in Item5. "Operating and Financial Review and Prospects — Capital Resources" of our 2018 20-F.
In June 2018, we entered into the $800.0 million Credit Facility providing for the $350.0 million Initial Term Loan andthe $450.0 million Revolver. In November 2018, we added the $250.0 million Incremental Term Loan. As of June 30, 2019, anaggregate of $595.3 million was outstanding under the Term Loans, and other than ordinary course letters of credit, $53.0 millionwas outstanding under the Revolver (December 31, 2018 — $598.3 million outstanding under the Term Loans, and other thanordinary course letters of credit, $159.0 million outstanding under the Revolver).
The Initial Term Loan requires quarterly principal repayments of $0.875 million, which commenced on September 30,2018, and the Incremental Term Loan requires quarterly principal repayments of $0.625 million, which commenced on March 31,

2019, and in each case, a lump sum repayment of the remainder outstanding at maturity (see "Liquidity — Cash requirements"above for a discussion of mandatory prepayments required under the Credit Facility). Except under specified circumstances, andsubject to the payment of breakage costs (if any), we are generally permitted to make voluntary prepayments of outstanding amountsunder the Revolver and the Term Loans without any other premium or penalty.
The Credit Facility has an accordion feature that allows us to increase the term loans and/or revolving loan commitmentsby approximately $110 million, plus an unlimited amount to the extent that a specified leverage ratio on a pro forma basis doesnot exceed specified limits, in each case on an uncommitted basis and subject to the satisfaction of certain terms and conditions.The Revolver also includes a $50.0 million sub-limit for swing line loans, providing for short-term borrowings up to a maximumof ten business days, as well as a $150.0 million sub-limit for letters of credit, in each case subject to the overall Revolver creditlimit. The Revolver permits us and certain designated subsidiaries to borrow funds (subject to specified conditions) for generalcorporate purposes, including for capital expenditures, certain acquisitions, and working capital needs. Borrowings under theRevolver bear interest at LIBOR, Canadian Prime, or Base Rate (each as defined in the Credit Facility) plus a specified margin,or in the case of any bankers' acceptance, at the B/A Discount Rate (as defined in the Credit Facility). The margin for borrowingsunder the Revolver ranges from 0.75% to 2.5%, depending on the rate we select and our consolidated leverage ratio. The InitialTerm Loan currently bears interests at LIBOR plus 2.125%. The Incremental Term Loan currently bears interest at LIBOR plus2.5%.
As part of our risk management program, we attempt to mitigate interest rate risk through interest rate swaps. In order topartially hedge against our exposure to interest rate variability on the Term Loans, we entered into 5-year agreements with asyndicate of third-party banks in August and December 2018 to swap the variable interest rate with a fixed rate of interest on$175.0 million of the total borrowings outstanding under each of the Initial Term Loan and the Incremental Term Loan (for anaggregate of $350.0 million). Our unhedged borrowings under the Credit Facility at June 30, 2019 were $298.3 million (comprisedof $245.3 million of unhedged borrowings under the Term Loans and $53.0 million outstanding under the Revolver) (December 31,2018 — $407.3 million, comprised of $248.3 million of unhedged borrowings under the Term Loans and $159.0 million outstandingunder the Revolver). A one-percentage point increase in relevant interest rates would increase interest expense, based on theoutstanding unhedged borrowings at June 30, 2019, by $2.9 million annually. See note 21 of our 2018 AFS for further informationregarding our interest rate swap agreements.
We are required to comply with certain restrictive covenants under the Credit Facility, including those relating to theincurrence of certain indebtedness, the existence of certain liens, the sale of certain assets (excluding real property then held forsale), specified investments and payments, sale and leaseback transactions, and certain financial covenants relating to a definedinterest coverage ratio and leverage ratio that are tested on a quarterly basis. At June 30, 2019, we were in compliance with allrestrictive and financial covenants under the Credit Facility. The obligations under the Credit Facility are guaranteed by us andcertain specified subsidiaries. Subject to specified exemptions and limitations, all assets of the guarantors are pledged as securityfor the obligations under the Credit Facility. The Credit Facility contains customary events of default. If an event of default occursand is continuing, the administrative agent may declare all amounts outstanding under the Credit Facility to be immediately dueand payable and may cancel the lenders’ commitments to make further advances thereunder. In the event of a payment or otherspecified defaults, outstanding obligations accrue interest at a specified default rate.
We incurred debt issuance costs of $11.5 million in connection with the Term Loans, which we recorded as an offsetagainst the proceeds therefrom. Such costs have been deferred (as long-term debt on our consolidated balance sheet) and will beamortized over their respective terms using the effective interest rate method. We incurred debt issuance costs of $3.8 million inconnection with the Revolver, which have been deferred (as other assets on our consolidated balance sheet) and will be amortizedover its term. We accelerated the amortization of the remaining $1.2 million of unamortized deferred financing costs related to thePrior Facility upon its termination, and recorded it to other charges in our consolidated financial statements in June 2018.
At June 30, 2019, we had $22.2 million outstanding in letters of credit under the Revolver (December 31, 2018 — $21.3million outstanding in letters of credit under the Revolver). We also arrange letters of credit and surety bonds outside our Revolver.At June 30, 2019, we had $14.7 million (December 31, 2018 — $14.4 million) of such letters of credit and surety bonds outstanding.
At June 30, 2019, we also had a total of $132.8 million of uncommitted bank overdraft facilities available for intradayand overnight operating requirements (December 31, 2018 — $132.8 million). There were no amounts outstanding under theseoverdraft facilities at June 30, 2019 or December 31, 2018. See "Liquidity — Cash requirements" above for amounts available forfuture borrowings under the Revolver.
22

We have an agreement to sell up to $250.0 million in accounts receivable on an uncommitted basis (subject to pre-determined limits by customer) to two third-party banks. The term of this agreement has been annually extended in recent yearsfor additional one-year periods (and is currently extendable to November 2020 under specified circumstances), but may beterminated earlier as provided in the agreement. At June 30, 2019, $136.6 million (December 31, 2018 — $130.0 million) ofA/R were sold under this program, and de-recognized from our accounts receivable balance. As our A/R sales program is on anuncommitted basis, there can be no assurance that any of the banks will purchase the A/R we intend to sell to them under thisprogram.
We have entered into a customer's SFP, pursuant to which participating suppliers may sell accounts receivable from suchcustomer to a third-party bank on an uncommitted basis in order to receive earlier payment. At June 30, 2019, we sold $11.5 millionof accounts receivable under the SFP (December 31, 2018 — $50.0 million). We utilized the SFP to substantially offset the effectof extended payment terms required by such customer on our working capital for the period. As the SFP is on an uncommittedbasis, there can be no assurance that the bank will purchase the A/R we intend to sell to them thereunder. Due to our disengagementfrom a portion of this customer's programs resulting from the CCS Review, we have decreased the amount of A/R sold under theSFP.
Our strategy on capital risk management has not changed significantly since the end of 2018. Other than the restrictiveand financial covenants associated with our Credit Facility noted above, we are not subject to any contractual or regulatory capitalrequirements. While some of our international operations are subject to government restrictions on the flow of capital into and outof their jurisdictions, these restrictions have not had a material impact on our operations or cash flows.
Financial instruments:
Our short-term investment objectives are to preserve principal and to maximize yields without significantly increasingrisk, while at the same time not materially restricting our short-term access to cash.
The majority of our cash balances are held in U.S. dollars. We price the majority of our products in U.S. dollars and themajority of our materials costs are also denominated in U.S. dollars. However, a significant portion of our non-materials costs(including payroll, pensions, site costs and costs of locally sourced supplies and inventory) are denominated in various othercurrencies. As a result, we may experience foreign exchange gains or losses on translation or transactions due to currencyfluctuations. We have a foreign exchange risk management policy in place to govern our hedging activities. We do not enter intospeculative trades. Our current hedging activity is designed to reduce the variability of our foreign currency costs where we havelocal manufacturing operations. We enter into foreign exchange forward contracts to hedge our cash flow exposures and foreigncurrency swaps to hedge our balance sheet exposures. Balance sheet hedges are based on our forecasts of the future position ofnet monetary assets or liabilities denominated in foreign currencies and, therefore, may not mitigate the full impact of any translationimpacts in the future. There can be no assurance that our hedging transactions will be successful in mitigating our foreign exchangerisk. See note 13 to our Q2 2019 Interim Financial Statements for a listing of our foreign exchange forwards and swaps to tradeU.S. dollars in exchange for specified currencies at June 30, 2019. The fair value of the outstanding contracts at June 30, 2019was a net unrealized gain of $6.0 million (December 31, 2018 — net unrealized loss of $14.2 million). The unrealized gains orlosses are a result of fluctuations in foreign exchange rates between the date the currency forward or swap contracts were enteredinto and the valuation date at period end.
There have been no material changes to our primary market risk exposures or our management of such exposures duringQ2 2019 from the description set forth in Item 5, "Operating and Financial Review and Prospects — Capital Resources — FinancialRisks" of the 2018 20-F.
Related Party Transactions
Onex Corporation (Onex) beneficially owns or controls, directly or indirectly, all of our outstanding multiple votingshares. Accordingly, Onex has the ability to exercise significant influence over our business and affairs and generally has the powerto determine all matters submitted to a vote of our shareholders where the subordinate voting shares and multiple voting sharesvote together as a single class. Mr. Gerald Schwartz, the Chairman of the Board, President and Chief Executive Officer of Onex,indirectly owns shares representing the majority of the voting rights of Onex.
Onex has entered into an agreement with Celestica and with Computershare Trust Company of Canada (as successor tothe Montreal Trust Company of Canada), as trustee for the benefit of the holders of the subordinate voting shares, for the purpose
23

of ensuring that the holders of subordinate voting shares will not be deprived of any rights under applicable take-over bid legislationto which they would be otherwise entitled in the event of a take-over bid (as that term is defined in applicable securities legislation)if multiple voting shares and subordinate voting shares were of a single class of shares. Subject to certain permitted forms of sale,such as identical or better offers to all holders of subordinate voting shares, Onex has agreed that it, and any of its affiliates thatmay hold multiple voting shares from time to time, will not sell any multiple voting shares, directly or indirectly, pursuant to atake-over bid (as that term is defined under applicable securities legislation) under circumstances in which any applicable securitieslegislation would have required the same offer or a follow-up offer to be made to holders of subordinate voting shares if the salehad been a sale of subordinate voting shares rather than multiple voting shares, but otherwise on the same terms.
We are party to a Services Agreement with Onex for the services of Mr. Tawfiq Popatia, an officer of Onex, as a directorof Celestica, pursuant to which Onex receives compensation for such services. This agreement automatically renews for successiveone-year terms unless either party provides a notice of intent not to renew. Under such agreement, the annual fee payable to Onexis $235,000 payable in DSUs in equal quarterly installments in arrears. The Services Agreement terminates automatically and therights of Onex to receive compensation (other than accrued and unpaid compensation) will terminate (a) 30 days after the first dayon which Onex ceases to hold at least one multiple voting share of Celestica or any successor company or (b) the date Mr. Popatiaceases to be a director of Celestica for any reason.
The original parties to the Property Sale Agreement were the Company and the Property Purchaser (approximately 27%of the interests of which are held by a privately-held partnership in which Mr. Schwartz has a material interest; and approximately25% of the interests of which are held by a partnership in which Mr. Schwartz has a non-voting interest). The Property Purchaserholds a 5% non-voting interest in the Assignee. See "Liquidity — Toronto Real Property and Related Transactions" above.
Outstanding Share Data As of July 18, 2019, we had 109,822,815 outstanding subordinate voting shares and 18,600,193 outstanding multiple
voting shares. As of such date, we also had 345,577 outstanding stock options, 5,138,740 outstanding restricted share units (RSUs),3,982,124 outstanding performance share units (PSUs) (assuming vesting of 100% of the target amount granted (amounts that willvest range from 0% to 200% of the target amount granted)), and 1,735,558 outstanding DSUs; each vested option or unit entitlingthe holder thereof to receive one subordinate voting share (or in certain cases, cash) pursuant to the terms thereof subject to certaintime or performance-based vesting conditions.
24
Controls and Procedures Evaluation of disclosure controls and procedures:
Our management is responsible for establishing and maintaining a system of disclosure controls and procedures (as defined
in Rules 13a-15(e) and 15d-15(e) under the U.S. Exchange Act) designed to ensure that information we are required to disclosein the reports that we file or submit under the U.S. Exchange Act is recorded, processed, summarized and reported within the timeperiods specified in the U.S. Securities and Exchange Commission’s rules and forms. Disclosure controls and procedures include,without limitation, controls and procedures designed to ensure that information required to be disclosed by an issuer in the reportsthat it files or submits under the U.S. Exchange Act is accumulated and communicated to the issuer’s management, including itsprincipal executive officer or officers and principal financial officer or officers, or persons performing similar functions, asappropriate, to allow timely decisions regarding required disclosure.
Under the supervision of and with the participation of management, including our principal executive officer and principal
financial officer, we have evaluated the effectiveness of the design and operation of our disclosure controls and procedures as ofJune 30, 2019. Based on that evaluation, our principal executive officer and principal financial officer have concluded that, as ofJune 30, 2019, our disclosure controls and procedures are effective to meet the requirements of Rules 13a-15(e) and 15d-15(e) underthe U.S. Exchange Act.
A control system, no matter how well conceived and operated, can provide only reasonable, not absolute, assurance that
its objectives are met. Due to inherent limitations in all such systems, no evaluation of controls can provide absolute assurancethat all control issues within a company have been detected. Accordingly, our disclosure controls and procedures are designed toprovide reasonable, not absolute, assurance that the objectives of our disclosure control system are met.

Changes in internal control over financial reporting:
We did not identify any change in our internal control over financial reporting in connection with our evaluation thereofthat occurred during the quarter ended June 30, 2019 that has materially affected, or is reasonably likely to materially affect, ourinternal control over financial reporting.
On November 9, 2018, we completed the acquisition of Impakt, and are integrating its processes and internal controlsinto our existing system of internal control over financial reporting. Although this process may result in changes to our internalcontrol over financial reporting, we do not currently anticipate that the integration of Impakt will result in changes that wouldmaterially affect, or would be reasonably likely to materially affect, our internal control over financial reporting.
Unaudited Quarterly Financial Highlights* (in millions, except percentages and per share amounts):
2017** 2018 2019Third
QuarterFourthQuarter
FirstQuarter
SecondQuarter
ThirdQuarter
FourthQuarter
FirstQuarter
SecondQuarter
Revenue ......................................................... $1,532.8 $1,570.2 $1,499.7 $1,695.2 $1,711.3 $1,727.0 $1,433.1 $1,445.6Gross margin ................................................. 6.9% 6.5% 6.2% 6.2% 6.6% 6.9% 6.1% 6.8%Net earnings (loss)......................................... $ 34.8 $ 13.6 $ 14.1 $ 16.1 $ 8.6 $ 60.1 $ 90.3 $ (6.1)Weighted average # of basic shares............... 143.7 143.3 142.2 139.6 139.0 136.8 135.7 131.1Weighted average # of diluted shares ............ 145.7 145.5 143.5 140.7 140.3 138.0 136.6 131.1# of shares outstanding .................................. 143.7 141.8 139.6 139.3 137.4 136.3 131.6 128.4IFRS EPS:
basic ............................................................ $ 0.24 $ 0.09 $ 0.10 $ 0.12 $ 0.06 $ 0.44 $ 0.67 $ (0.05)diluted ......................................................... $ 0.24 $ 0.09 $ 0.10 $ 0.11 $ 0.06 $ 0.44 $ 0.66 $ (0.05)
* All quarters in the table above have been impacted by our restructuring charges, the amounts of which vary from quarter-to-quarter.
** 2017 quarterly results have been restated to reflect the adoption of IFRS 15.
Q2 2019 compared to Q1 2019:
Revenue of $1.45 billion for Q2 2019 increased 1% compared to Q1 2019. Compared to the previous quarter, CCS segmentrevenue increased $28.0 million (3%), offset in part by an overall sequential decrease in ATS segment revenue. Communicationsend market revenue increased $5.7 million (1%) primarily due to seasonality and new programs. Enterprise end market revenueincreased $22.3 million (8%), primarily due to seasonality and new programs, offset in part by planned program disengagementsresulting from our CCS Review. ATS segment revenue decreased $15.5 million (3%) compared to Q1 2019, primarily due to lowerdemand in our capital equipment business and our disengagement from an unprofitable Energy business customer. These decreaseswere partially offset by stronger demand and new programs in our A&D and healthtech businesses. Gross profit for Q2 2019increased 12% compared to Q1 2019, and gross margin increased from 6.1% in Q1 2019 to 6.8% in Q2 2019, reflecting improvedproductivity, including lower variable spending, across the majority of our businesses, offset in part by weaker demand andperformance within our capital equipment business. CCS segment income for Q2 2019 of $20.9 million (2.4% of CCS segmentrevenue) increased from $20.0 million (2.3% of CCS segment revenue) for Q1 2019, primarily as a result of higher revenues inQ2 2019 as compared to Q1 2019. ATS segment income for Q2 2019 of $15.8 million (2.8% of ATS segment revenue) increasedfrom $15.1 million (2.6% of ATS segment revenue) in Q1 2019, reflecting improved performance in our A&D, industrial andhealthtech businesses due to changes in mix and as we progressed with the ramping of new programs, offset in part by weakerperformance in our capital equipment business. Our capital equipment business continued to be impacted by a soft demandenvironment, which resulted in operating losses in Q2 2019 in the high single-digit million dollar range. Net loss for Q2 2019 of$6.1 million represented a decrease of $96.4 million compared to net earnings of $90.3 million for Q1 2019, which included theProperty Gain recorded in Q1 2019.
25

Selected Q2 2019 IFRS results:
ActualIFRS revenue (in billions) .............................................................................................................................. $1.45IFRS loss per share * ...................................................................................................................................... $(0.05)IFRS loss before income taxes as a % of revenue .......................................................................................... —%IFRS SG&A (in millions) ............................................................................................................................... $60.7
* IFRS loss per share for Q2 2019 included an aggregate charge of $0.18 (pre-tax) per share for employee stock-based compensationexpense, amortization of intangible assets (excluding computer software), Transition Costs (described below), and restructuringcharges. This aggregate charge is within the range we provided on April 25, 2019 of between $0.15 to $0.21 per share for theseitems. Q2 2019 actual compared to Q2 2019 guidance:
Q2 2019Guidance Actual
IFRS revenue (in billions) ....................................... $1.4 to $1.5 $1.45
Non-IFRS operating margin ....................................2.4% at the mid-point of our revenue andnon-IFRS adjusted EPS guidance ranges 2.5%
Non-IFRS adjusted SG&A (in millions) ................. $53.0 to $55.0 $55.9Non-IFRS adjusted EPS (diluted) ........................... $0.09 to $0.15 $0.12
For Q2 2019, our revenue was at the mid-point of our guidance range. Overall revenue from our ATS segment was inline with our expectations, while stronger-than-expected demand from our Enterprise customers offset weaker-than-expecteddemand from our Communications customers. Non-IFRS operating margin for Q2 2019 was slightly above the mid-point of ourrevenue and non-IFRS adjusted EPS guidance ranges, resulting primarily from beneficial changes in mix, offsetting higher thanexpected losses in our capital equipment business. Non-IFRS adjusted SG&A for Q2 2019 was slightly above our guidance range,resulting primarily from foreign exchange losses. Non-IFRS adjusted EPS was at the mid-point of our guidance range,notwithstanding a $0.01 per share negative impact due to taxable foreign exchange resulting from the weakening of the Chineserenminbi against the U.S. dollar. Our non-IFRS adjusted effective tax rate for Q2 2019 was 36% (we had anticipated a rate similarto Q1 2019 (27%)), driven primarily by an unfavorable geographical mix of profits, and the negative impact of taxable foreignexchange. Our guidance includes a range for adjusted EPS (which is a non-IFRS measure and is defined below). Managementconsiders non-IFRS adjusted EPS to be an important measure for investors to understand our core operating performance. Areconciliation of non-IFRS adjusted net earnings to IFRS net earnings is set forth below.
Non-IFRS measures:
Management uses adjusted net earnings and the other non-IFRS measures described herein (i) to assess operatingperformance and the effective use and allocation of resources, (ii) to provide more meaningful period-to-period comparisons ofoperating results, (iii) to enhance investors’ understanding of the core operating results of our business, and (iv) to set managementincentive targets. We believe the non-IFRS measures we present herein are useful to investors, as they enable investors to evaluateand compare our results from operations in a more consistent manner (by excluding specific items that we do not consider to bereflective of our ongoing operating results), to evaluate cash resources that we generate each period, and to provide an analysis ofoperating results using the same measures our chief operating decision makers use to measure performance. In addition, managementbelieves that the use of a non-IFRS adjusted tax expense and a non-IFRS adjusted effective tax rate provides improved insightinto the tax effects of our ongoing business operations, and is useful to management and investors for historical comparisons andforecasting. These non-IFRS financial measures result largely from management’s determination that the facts and circumstancessurrounding the excluded charges or recoveries are not indicative of the ordinary course of the ongoing operation of our business.We believe investors use both IFRS and non-IFRS measures to assess management’s past, current and future decisions associatedwith our priorities and our allocation of capital, as well as to analyze how our business operates in, or responds to, swings ineconomic cycles or to other events that impact our core operations.
26

Non-IFRS measures do not have any standardized meaning prescribed by IFRS and therefore may not be comparable tosimilar measures presented by other companies. Non-IFRS measures are not measures of performance under IFRS and should notbe considered in isolation or as a substitute for any standardized measure under IFRS. The most significant limitation tomanagement’s use of non-IFRS financial measures is that the charges or credits excluded from the non-IFRS measures arenonetheless charges or credits that are recognized under IFRS and that have an economic impact on us. Management compensatesfor these limitations primarily by issuing IFRS results to show a complete picture of our performance, and reconciling non-IFRSfinancial measures back to the most directly comparable IFRS financial measures.
In addition to cash cycle days (including the components thereof) and inventory turns (each described under the caption"Other Performance Indicators" above), which have no defined meanings under IFRS, we use the following non-IFRS measures:adjusted gross profit, adjusted gross margin (adjusted gross profit as a percentage of revenue), adjusted SG&A, adjusted SG&Aas a percentage of revenue, operating earnings (adjusted EBIAT), operating margin (operating earnings or adjusted EBIAT as apercentage of revenue), adjusted net earnings, adjusted EPS, adjusted ROIC, free cash flow, adjusted tax expense and adjustedeffective tax rate. Adjusted EBIAT, adjusted ROIC, free cash flow (including a description of modifications to our calculation ofadjusted ROIC and free cash flow that commenced in Q1 2019), adjusted tax expense and adjusted effective tax rate are furtherdescribed in the tables below. In calculating these non-IFRS financial measures, management excludes the following items, whereapplicable: employee stock-based compensation expense, amortization of intangible assets (excluding computer software),restructuring and other charges, net of recoveries (as defined below), impairment charges, and acquisition inventory fair valueadjustments, all net of the associated tax adjustments (which are set forth in the table below), and non-core tax impacts (taxadjustments related to acquisitions, and certain other tax costs or recoveries related to restructuring actions or restructured sites).The economic substance of these exclusions and management’s rationale for excluding them from non-IFRS financial measuresis provided below:
Employee stock-based compensation expense, which represents the estimated fair value of stock options, RSUs and PSUs
granted to employees, is excluded because grant activities vary significantly from quarter-to-quarter in both quantity and fair value.In addition, excluding this expense allows us to better compare core operating results with those of our competitors who alsogenerally exclude employee stock-based compensation expense in assessing their operating performance, who may have differentgranting patterns and types of equity awards, and who may use different valuation assumptions than we do, including thosecompetitors who report under U.S. GAAP and use non-U.S. GAAP measures to present similar metrics.
Amortization charges (excluding computer software) consist of non-cash charges against intangible assets that are
impacted by the timing and magnitude of acquired businesses. Amortization of intangible assets varies among our competitors,and we believe that excluding these charges permits a better comparison of core operating results with those of our competitorswho also generally exclude amortization charges in assessing operating performance.
Restructuring and other charges, net of recoveries, consist of costs relating to employee severance, lease terminations,
site closings and consolidations, write-downs of owned property and equipment which are no longer used and are available forsale, reductions in infrastructure, Transition Costs (Recoveries) (defined below), acquisition-related consulting, transaction andintegration costs, and in 2019, charges related to the subsequent re-measurement of indemnification assets recorded in connectionwith acquisitions (Acquisition Costs), legal settlements (recoveries), and the accelerated amortization of unamortized deferredfinancing costs recorded on the extinguishment of our Prior Facility during the Q2 2018. We exclude these restructuring and othercharges, net of recoveries, because we believe that they are not directly related to ongoing operating results and do not reflectexpected future operating expenses after completion of these activities. We believe these exclusions permit a better comparisonof our core operating results with those of our competitors who also generally exclude these charges, net of recoveries, in assessingoperating performance.
Transition Costs are costs recorded in connection with the relocation of our Toronto manufacturing operations, and themove of our corporate headquarters into and out of a temporary location during, and upon completion, of the construction of spacein a new office building at our former location (all in connection with the sale of our Toronto real property). Transition Costsconsist of direct relocation costs, duplicate costs (such as rent expense, utility costs, depreciation charges, and personnel costs)incurred during the transition period, as well as cease-use costs incurred in connection with idle or vacated portions of the relevantpremises that we would not have incurred but for these relocations. Transition Recoveries consist of the Property Gain. We believethat excluding these costs and recoveries permits a better comparison of our core operating results from period-to-period, as thesecosts will not reflect our ongoing operations once these relocations are complete, and the recovery pertains only to Q1 2019.
27

Impairment charges, which consist of non-cash charges against goodwill, intangible assets and property, plant andequipment, result primarily when the carrying value of these assets exceeds their recoverable amount. Our competitors may recordimpairment charges at different times, and we believe that excluding these charges permits a better comparison of our core operatingresults with those of our competitors who also generally exclude these charges in assessing operating performance.
Acquisition inventory fair value adjustments relate to the write-up of the inventory acquired in connection with ouracquisitions, representing the difference between the cost and fair value of such inventory. We exclude the impact of the recognitionof these adjustments, when incurred, because we believe such exclusion permits a better comparison of our core operating resultsfrom period-to-period, as their impact is not indicative of our ongoing operating performance.
Non-core tax impacts are excluded, as we believe these costs or recoveries do not reflect core operating performance andvary significantly among those of our competitors who also generally exclude these charges or recoveries in assessing operatingperformance.
The following table sets forth, for the periods indicated, the various non-IFRS measures discussed above, and areconciliation of non-IFRS measures to the most directly comparable IFRS measures (in millions, except percentages and pershare amounts):
28

Three months ended June 30 Six months ended June 302018 2019 2018 2019
% ofrevenue
% ofrevenue
% ofrevenue
% ofrevenue
IFRS revenue....................................................... $ 1,695.2 $1,445.6 $ 3,194.9 $ 2,878.7
IFRS gross profit................................................. $ 104.8 6.2% $ 97.8 6.8 % $ 198.3 6.2% $ 185.2 6.4%
Employee stock-based compensation expense. 2.8 3.4 7.9 10.0 Acquisition inventory fair value adjustment ........ 1.6 — 1.6 —Non-IFRS adjusted gross profit......................... $ 109.2 6.4% $ 101.2 7.0 % $ 207.8 6.5% $ 195.2 6.8%
IFRS SG&A .......................................................... $ 52.7 3.1% $ 60.7 4.2 % $ 105.0 3.3% $ 116.8 4.1%
Employee stock-based compensation expense. (4.4) (4.8) (9.7) (10.0)Non-IFRS adjusted SG&A .................................. $ 48.3 2.8% $ 55.9 3.9 % $ 95.3 3.0% $ 106.8 3.7%
IFRS earnings (loss) before income taxes ....... $ 20.9 1.2% $ (1.0) — % $ 40.3 1.2% $ 93.8 3.2%
Finance costs (1) ................................................. 4.9 12.6 8.2 26.2Employee stock-based compensation expense. 7.2 8.2 17.6 20.0
Amortization of intangible assets (excludingcomputer software) ............................................ 2.7 6.4 3.8 12.8
Net restructuring, impairment and othercharges (recoveries) .......................................... 15.8 10.5 26.3 (81.0)
Acquisition inventory fair value adjustment ........ 1.6 — 1.6 —
Non-IFRS operating earnings (adjustedEBIAT) (1) .............................................................. $ 53.1 3.1% $ 36.7 2.5 % $ 97.8 3.1% $ 71.8 2.5%
IFRS net earnings (loss)..................................... $ 16.1 0.9% $ (6.1) (0.4)% $ 30.2 0.9% $ 84.2 2.9%
Employee stock-based compensation expense. 7.2 8.2 17.6 20.0
Amortization of intangible assets (excludingcomputer software) ............................................ 2.7 6.4 3.8 12.8
Net restructuring, impairment and othercharges (recoveries) .......................................... 15.8 10.5 26.3 (81.0)
Acquisition inventory fair value adjustment........ 1.6 — 1.6 —
Adjustments for taxes (2) (3.2) (3.6) (5.4) (4.8)
Non-IFRS adjusted net earnings ....................... $ 40.2 $ 15.4 $ 74.1 $ 31.2
Diluted EPS .........................................................Weighted average # of shares (in millions) (5) .... 140.7 131.9 142.1 134.3IFRS earnings (loss) per share (5) ...................... $ 0.11 $ (0.05) $ 0.21 $ 0.63Non-IFRS adjusted earnings per share ............. $ 0.29 $ 0.12 $ 0.52 $ 0.23
# of shares outstanding at period end (inmillions) .............................................................. 139.3 128.4 139.3 128.4
(restated) (restated)
IFRS cash provided by (used in) operations.... $ (14.9) $ 90.3 $ (20.3) $ 161.6
Purchase of property, plant and equipment, netof sales proceeds............................................... (25.1) (23.2) (38.8) 70.1
Lease payments (3) ............................................. (0.8) (9.5) (12.6) (18.8)
Finance costs paid (excluding debt issuancecosts paid) (3) ...................................................... (4.8) (11.1) (8.0) (21.7)
Non-IFRS free cash flow (3)................................. $ (45.6) $ 46.5 $ (79.7) $ 191.2
IFRS ROIC % (4).................................................... 6.3% (0.2)% 6.2% 10.6%Non-IFRS adjusted ROIC % (4)............................ 16.0% 8.4 % 15.1% 8.1%
29

(1) Management uses non-IFRS operating earnings (adjusted EBIAT) as a measure to assess performance related to our core operations. Non-IFRS adjusted EBIATis defined as earnings (loss) before income taxes, finance costs (defined below), amortization of intangible assets (excluding computer software), employee stock-based compensation expense, net restructuring and other charges (recoveries) (defined above), impairment charges (recoveries), and in applicable periods, acquisitioninventory fair value adjustments. Finance costs consist of interest expense and fees related to our credit facility (including any debt issuance and related amortizationcosts), our interest rate swap agreements, our accounts receivable sales program and the SFP, and, beginning Q1 2019, interest expense on our lease obligationsunder IFRS 16. See "Operating Results — Other charges" for separate quantification and discussion of impairment charges, if any, and the components of netrestructuring and other charges (recoveries).
(2) The adjustments for taxes, as applicable, represent the tax effects of our non-IFRS adjustments and non-core tax impacts (described in the table below).
(3) Management uses non-IFRS free cash flow as a measure, in addition to IFRS cash provided by (used in) operations, to assess our operational cash flow performance.We believe non-IFRS free cash flow provides another level of transparency to our liquidity. Non-IFRS free cash flow is defined as cash provided by (used in)operations after the purchase of property, plant and equipment (net of proceeds from the sale of certain surplus equipment and property), lease payments (including$8.9 million and $17.2 million in Q2 2019 and 1H 2019, respectively, for lease payments under IFRS 16) and finance costs paid (excluding any debt issuancecosts paid). As a measure of liquidity, and consistent with the inclusion of our Toronto relocation capital expenditures and Transition Costs in non-IFRS free cashflow in the periods incurred, we have included the $113.0 million in proceeds from the sale of our Toronto real property in non-IFRS free cash flow in Q1 2019(the period of receipt). See note 11(b) to the Q2 2019 Interim Financial Statements.We incurred debt issuance costs in connection with our recent credit facility(upon execution and subsequent security arrangements) which we do not consider to be part of our core operating expenses. As a result, we modified our non-IFRS free cash flow calculation, commencing in Q1 2019, to exclude debt issuance costs from total finance costs paid ($0.9 million and $1.8 million in Q2 2019and 1H 2019, respectively, and $7.4 million in Q2 2018 and 1H 2018). Prior period comparatives have been restated to conform to the current presentation. Inaddition, as of January 1, 2019, as a result of our adoption of IFRS 16 (Leases), we have also modified our non-IFRS free cash flow calculation to subtract leasepayments under IFRS 16, as such payments were previously (but are no longer) reported in cash provided by (used in) operations. IFRS 16 did not require therestatement of prior period financial statements. Accordingly, and in order to preserve comparability with prior calculations, commencing in Q1 2019, such leasepayments are subtracted from cash provided by (used in) operations in our determination of non-IFRS free cash flow. See footnote (4) below. Note that non-IFRSfree cash flow, however, does not represent residual cash flow available to Celestica for discretionary expenditures.
(4) Management uses non-IFRS adjusted ROIC as a measure to assess the effectiveness of the invested capital we use to build products or provide services to ourcustomers, by quantifying how well we generate earnings relative to the capital we have invested in our business. Non-IFRS adjusted ROIC is calculated bydividing non-IFRS adjusted EBIAT by average net invested capital. Net invested capital (calculated in the table below) is defined as total assets less: cash, ROUassets (described below), accounts payable, accrued and other current liabilities and provisions, and income taxes payable. We use a two-point average to calculateaverage net invested capital for the quarter and a three-point average to calculate average net invested capital for the six-month period. A comparable measureunder IFRS would be determined by dividing IFRS earnings before income taxes by average net invested capital (which we have set forth in the charts above andbelow), however, this measure (which we have called IFRS ROIC), is not a measure defined under IFRS. In connection with our adoption of IFRS 16 as of January1, 2019, we recognize ROU assets and related lease obligation on the applicable lease commencement dates. See note 2 to the Q2 2019 Interim Financial Statementsfor further detail. As IFRS 16 did not require the restatement of prior period financial statements, we have not restated prior period calculations of non-IFRSadjusted ROIC to account for ROU assets. Accordingly, and in order to preserve comparability with prior calculations, commencing in Q1 2019, we exclude theimpact of our ROU assets from our calculation of net invested capital.
(5) IFRS earnings (loss) per diluted share is calculated by dividing IFRS net earnings (loss) by the number of diluted weighted average shares outstanding (DWAS).In order to calculate IFRS loss per diluted share for Q2 2019, we used a DWAS of 131.1 million as at June 30, 2019. Because we reported a net loss on an IFRSbasis in Q2 2019, the DWAS for such period-end excluded 0.8 million shares underlying in-the-money stock-based awards, as including these shares would beanti-dilutive. However, we included these shares in the DWAS used to calculate non-IFRS adjusted earnings (per diluted share) for Q2 2019, because such shareswere dilutive in relation to this non-IFRS measure.
The following table sets forth a reconciliation of our IFRS tax expense and IFRS effective tax rate to our non-IFRS adjusted taxexpense and our non-IFRS adjusted effective tax rate for the periods indicated, in each case determined by excluding the taxbenefits or costs associated with the listed items (in millions, except percentages) from our IFRS tax expense for such periods:
Three months ended Six months endedJune 30 June 30
2018Effectivetax rate 2019
Effectivetax rate 2018
Effectivetax rate 2019
Effectivetax rate
IFRS tax expense and IFRS effective tax rate ............ $ 4.8 23% $ 5.1 (510)% $ 10.1 25% $ 9.6 10%Tax costs (benefits) of the following itemsexcluded from IFRS tax expense:Employee stock-based compensation expense......... 0.6 0.1 1.0 0.5Net restructuring, impairment and other charges ..... 0.5 0.2 0.4 0.4Non-core tax impact related to tax uncertainties*.... — 3.3 — 3.9Non-core tax impact related to fair valueadjustment on acquisitions ** .................................. 3.7 (1.3) 3.7 (1.3)Non-core tax impacts related to restructured sites* . (1.6) 1.3 0.3 1.3
Non-IFRS adjusted tax expense and non-IFRSadjusted effective tax rate ........................................... $ 8.0 17% $ 8.7 36 % $ 15.5 17% $ 14.4 32%
*See note 12 to the Q2 2019 Interim Financial Statements. ** Consists of the Atrenne Benefit for the 2018 periods, and a deferred tax adjustment attributable to our Impakt acquisition for the 2019 periods.
30
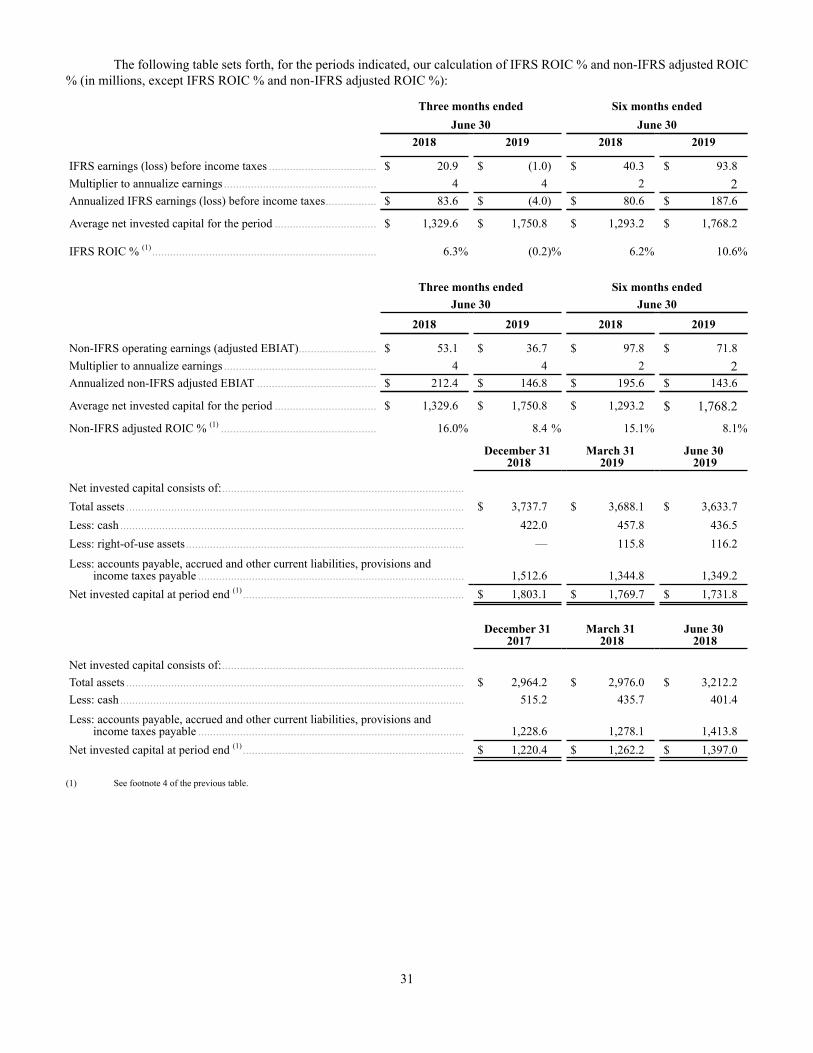
The following table sets forth, for the periods indicated, our calculation of IFRS ROIC % and non-IFRS adjusted ROIC% (in millions, except IFRS ROIC % and non-IFRS adjusted ROIC %):
Three months ended Six months endedJune 30 June 30
2018 2019 2018 2019
IFRS earnings (loss) before income taxes .................................... $ 20.9 $ (1.0) $ 40.3 $ 93.8Multiplier to annualize earnings ................................................... 4 4 2 2Annualized IFRS earnings (loss) before income taxes................. $ 83.6 $ (4.0) $ 80.6 $ 187.6
Average net invested capital for the period .................................. $ 1,329.6 $ 1,750.8 $ 1,293.2 $ 1,768.2
IFRS ROIC % (1)........................................................................... 6.3% (0.2)% 6.2% 10.6%
Three months ended Six months endedJune 30 June 30
2018 2019 2018 2019
Non-IFRS operating earnings (adjusted EBIAT).......................... $ 53.1 $ 36.7 $ 97.8 $ 71.8Multiplier to annualize earnings ................................................... 4 4 2 2Annualized non-IFRS adjusted EBIAT ........................................ $ 212.4 $ 146.8 $ 195.6 $ 143.6
Average net invested capital for the period .................................. $ 1,329.6 $ 1,750.8 $ 1,293.2 $ 1,768.2Non-IFRS adjusted ROIC % (1) .................................................... 16.0% 8.4 % 15.1% 8.1%
December 31 2018
March 31 2019
June 30 2019
Net invested capital consists of:.................................................................................Total assets ................................................................................................................. $ 3,737.7 $ 3,688.1 $ 3,633.7Less: cash ................................................................................................................... 422.0 457.8 436.5Less: right-of-use assets............................................................................................. — 115.8 116.2
Less: accounts payable, accrued and other current liabilities, provisions andincome taxes payable ......................................................................................... 1,512.6 1,344.8 1,349.2
Net invested capital at period end (1) .......................................................................... $ 1,803.1 $ 1,769.7 $ 1,731.8
December 31 2017
March 31 2018
June 30 2018
Net invested capital consists of:.................................................................................Total assets ................................................................................................................. $ 2,964.2 $ 2,976.0 $ 3,212.2Less: cash ................................................................................................................... 515.2 435.7 401.4
Less: accounts payable, accrued and other current liabilities, provisions andincome taxes payable ......................................................................................... 1,228.6 1,278.1 1,413.8
Net invested capital at period end (1) .......................................................................... $ 1,220.4 $ 1,262.2 $ 1,397.0
(1) See footnote 4 of the previous table.
31