
Exhaust Analysis of Rapeseed Oil Microturbine - Tom Gaca 2004
79
EXHAUST ANALYSIS OF A RAPESEED OIL/DIESEL FUELLED MICRO TURBINE Tomasz Stanislaw Gaca B. Eng. Mechanical Engineering Project Report Department of Mechanical Engineering Curtin University of Technology Completed in association with Fachhochschule Aachen Nowum-Energy 2004
Transcript of Exhaust Analysis of Rapeseed Oil Microturbine - Tom Gaca 2004
EXHAUST ANALYSIS OF A RAPESEED OIL/DIESEL
FUELLED MICRO TURBINE
Tomasz Stanislaw Gaca
B. Eng. Mechanical Engineering Project Report
Department of Mechanical Engineering
Curtin University of Technology
Completed in association with
Fachhochschule Aachen
Nowum-Energy
2004

iii
I would like to thank all the people at Nowum-Energy in Jülich, Germany, who
have been involved with the Micro Turbine Project and to those that have helped
me with the research for this project. They have supported and encouraged me
throughout my stay in Germany and made my time here enjoyable. I would
especially like to extend my appreciation to Dipl-Ing Yvonne Schmellekamp for
her guidance, aid, support and knowledge.
Furthermore, I would like to thank the staff members of the Curtin University
Department of Mechanical Engineering who have made the completion of this
project possible.
Many Thanks.

iv
CONTENTS Submission Letter...................................................................................................ii Acknowledgements ...............................................................................................iii Contents.................................................................................................................iv 1.0 Introduction..................................................................................................... 1
1.1 The Objectives .............................................................................................. 1 1.2 Overview of Results...................................................................................... 2 1.3 Report Synopsis ............................................................................................ 2 1.4 Applications of the Technology.................................................................... 2
2.0 The Micro Turbine ......................................................................................... 4 2.1 Turbine History............................................................................................. 4 2.2 Delocalised Electricity Generation ............................................................... 5 2.3 Capstone C30 Micro Turbine Theory........................................................... 6
3.0 Rapeseed Oil .................................................................................................... 9 3.1 Production of Rapeseed Oil .......................................................................... 9 3.2 Chemical & Physical Properties ................................................................. 10 3.3 Comparison to Diesel.................................................................................. 11
4.0 Combustion and Emissions .......................................................................... 13 4.1 Introduction to Combustion ........................................................................ 13 4.2 Hydrocarbon Combustion........................................................................... 13 4.3 Introduction to Emissions ........................................................................... 15 4.4 Emission Calculation .................................................................................. 19
5.0 The Exhaust Gas Analysis Unit: VISIT 02S............................................... 22 5.1 VISIT 02S Capabilities ............................................................................... 22 5.2 Theory of Operation.................................................................................... 24 5.2.1 Electrochemical Sensor............................................................................ 24 5.2.2 Non-Dispersive Infrared Sensor .............................................................. 27 5.3 Rationale for the VISIT-02S? ..................................................................... 28
6.0 Setup............................................................................................................... 29 7.0 Procedure....................................................................................................... 32
7.1 Testing ........................................................................................................ 32 7.2 Data Analysis .............................................................................................. 35
8.0 Results and Discussion.................................................................................. 36 8.1 Carbon Dioxide Emissions ....................................................................... 37 8.1.1 Analysis ................................................................................................... 38 8.1.2 Discussion................................................................................................ 38
v
8.2 Carbon Monoxide ..................................................................................... 40 8.2.1 Analysis ................................................................................................... 41 8.2.2 Discussion................................................................................................ 41 8.3 Nitrogen Oxides......................................................................................... 44 8.3.1 Analysis ................................................................................................... 45 8.3.2 Discussion................................................................................................ 45 8.4 Lambda ...................................................................................................... 48 8.4.1 Analysis ................................................................................................... 49 8.4.2 Discussion................................................................................................ 49 8.5 Fuel Usage.................................................................................................. 50 8.5.1 Analysis ................................................................................................... 51 8.5.2 Discussion................................................................................................ 51 8.6 Engine Speed ............................................................................................. 52 8.6.1 Analysis ................................................................................................... 53 8.6.2 Discussion................................................................................................ 53 8.7 Exhaust Temperature............................................................................... 54 8.7.1 Analysis ................................................................................................... 55 8.7.2 Discussion................................................................................................ 55 8.8 Efficiency ................................................................................................... 56 8.8.1 Analysis ................................................................................................... 57 8.8.2 Discussion................................................................................................ 57
9.0 Conclusion ..................................................................................................... 59 10.0 References.................................................................................................... 63 Appendix A.......................................................................................................... 66
Carbon Dioxide Calculations using the Combustion Chemical Equation........ 66 Appendix B .......................................................................................................... 70
B.1 Efficiency ................................................................................................... 70 B.2 Lambda....................................................................................................... 70 B.3 Losses ......................................................................................................... 71
Appendix C.......................................................................................................... 72 Appendix D.......................................................................................................... 74 Appendix E .......................................................................................................... 75

1
1.0 Introduction
In the developed world, the lack of space for growth and advancement has led
civilisation to advance upon the environment. The ecosystem has been and is
being disrupted by ongoing expansion and construction. Over time this has
resulted in pockets of natural reserves and conservation areas scattered around the
globe. In the German state of Nordrhein Westfalen, 18 million inhabitants occupy
the 34,000 square kilometres of land space and 180 million people live within
500km of its capital, Düsseldorf. This has placed immense pressure on the
environment. The 700km of waterways within the state provide a large source of
water, income and leisure. The need to provide low risk, clean and low profile
energy within these areas has led to a coolant and lubricant free, vegetable oil
fuelled turbine.
1.1 The Objectives
This paper reports one part, the emission analysis, of an ongoing, long term
project to determine the viability of rapeseed oil as a fuel in micro turbines. The
project is funded by the German government and directed by Nowum-Energy, a
research group operating within the guidance of Fachhochschule Aachen.
To successfully complete the project, it was divided into stages. The first stage
objective was to determine whether the turbine would start and operate on
rapeseed oil. After this was established, the following stages concerned with
efficiency, emissions and applications were to be studied.
It was during the first stage that these emission tests were done. The emission
tests serve to highlight any areas that may need more in-depth research or
investigation. The carbon dioxide, carbon monoxide and nitrous oxide emissions
were explored as well as the fuel to air ratio, exhaust temperature, engine speed,

2
fuel usage and overall efficiency. The results of these tests will be used to direct
the project with the intention of limiting costs and reducing the project duration.
1.2 Overview of Results
The Capstone C30 micro turbine was successfully tested with fuel containing
100% rapeseed oil. Apart from the addition of fuel line heating, no changes were
made to the turbine that was originally designed to run on diesel fuel. The
emission analysis, accomplished with a VISIT 02-S from Messtechnik, showed
that emissions of CO2, CO and NO increased markedly, albeit insufficiently to
rise above recommended limits. Other observed changes include a higher fuel
usage, lower exhaust temperature and higher overall efficiency.
1.3 Report Synopsis
The majority of previous work concerning rapeseed oil has concentrated on the
adaptation of fuel systems in automotive diesel engines to run on rapeseed oil, or
rapeseed oil based bio-diesel. Therefore, to provide a background for this report,
the fundamentals of turbines and rapeseed oil were investigated and are discussed
in the next chapter. The chapter following that is the theory of combustion,
emissions and exhaust gas analysis. After the project setup and testing procedures
are explained, the results and discussion chapter analyse and discuss each
parameter tested before moving on to the next parameter. Conclusions and
suggestions follow to complete the report.
1.4 Applications of the Technology
A power source that is compact, independent, low in emissions, environmentally
safe and efficient has a range of applications. Apart from use in protected, water-
based ecosystems, the technology could be applied to other regions. Isolated or
independent regions, like Antarctica, are regions where protection from toxic

3
liquid-spills and exhausts could see this technology applied. Hospitals, military
installations and isolated towns are other regions that may benefit from this
technology.
Another application is decentralised electricity production. By producing
electricity where it is needed, the inefficiency of electricity transmission and
distribution can be eliminated.

4
2.0 The Micro Turbine
2.1 Turbine History
The operating principle of a turbine was first described in 1500AD by Leonardo
Da Vinci who envisaged turbines propelled by hot rising gases in a chimney
stack. It was after many years that the first turbine was created on modern
principles, by Franz Stolze, in 1872. The turbines that followed were evolutions
of that first turbine by Stolze, slowly increasing power output and efficiency
while reducing bulk and fuel usage.
In the modern era, the most common applications of turbines are in aircraft
propulsion and electricity generation. Aircraft type turbines are fundamentally the
same as electricity generating turbines, known as gas turbines. The main
differences arise from the fact that the two types of turbines have been developed
separately for completely different operating environments resulting in different
adaptations and designs. As a result, aircraft type turbine will not be further
discussed in this report. For further reading regarding jet turbines the reader
should pursue Aircraft Gas Turbine Engine Technology (1970) by Irwin Treager
or, if detailed theory is required, Gas Turbine Aero-Thermodynamics with Special
Reference to Aircraft Propulsion (1981), written by Sir Frank Whittle.
Since the main land-based application of turbines is in electricity production, the
size and power of gas turbines has grown to keep up with the ever increasing
demand for electricity, with modern units being able to develop in excess of
200MW. The continual demand for larger turbines has meant that research into
low-output, compact gas turbines was largely overlooked for a long period of
time. The existence of niche markets and experimentation however, has allowed
for development to persist. Currently there are numerous low power turbines
available for procurement.

5
2.2 Delocalised Electricity Generation
Micro turbines are becoming more popular, especially in Germany, due to the
trend to produce power in a decentralised fashion. The trend towards localised
power production has been caused by many reasons including the realisation that
the congestion of modern transmission and distribution (T&D) electricity grids
has seen energy losses rise to 15% during peak usage times [4]. Other reasons for
the trend are that centralised power production is unable to match the efficiency
of combined heat and power plants (CHP) which can achieve up to 95%
efficiency, three times higher than conventional central generation [4]. CHP
achieves this efficiency by recycling waste heat; however the CHP must be
located near the thermal users. Thus, decentralised generation (DG) can operate
with high efficiency and avoids the losses of the T&D grid. The other advantage
of DG is that excess electricity can be transferred to neighbouring units when they
are under high load. This eliminates the waste associated with T&D grids and,
furthermore, the dynamic nature of smaller electricity generation plants allows
them to respond faster to peaks and troughs in the electricity demand. These
benefits and the inherent nature of renewable energy to be small scale; e.g. wind
power, solar panels; has meant that DG has become a common feature of
Germany and other developed European countries.

6
2.3 Capstone C30 Micro Turbine Theory
One producer of micro turbines, Capstone, is an American company that currently
produces two models; a 30kW multi-fuel turbine and a 60kW high-pressure
natural gas turbine. The turbines offered by Capstone are similar to many other
turbines regarding their operation and thermodynamic cycle. A comparison of
available turbines is shown in Figure 2.1.
Manufacturer Capstone Cummins Ingersoll-Rand Elliott TurbecModel C30 GTAA 70L TA-100 T100Country USA USA USA Japan Sweden
Power Electrical kW 29 30 70 100 105Power Heat kW 85 - - 172 167Electrical Efficiency % 25% 26% 28% 29% 30%Heat Rate kJ/kWh 14,400 - 14,300 - -Exhaust Temp C 275 260 232 279 85*Exhaust Energy kJ/hr 327,000 305,000 - 619,000 601,000Weight kg 405 636 2,200 1,814 2,000
*Temperature after heat exchanger. Figure 2.1 - Currently available micro turbines and their specifications. [3, 6, 9,
11, 27]
The Capstone C30 turbine, the model chosen for this research, is unique due to its
lack of lubricant. The turbine is completely cooled by air and makes use of
Capstone patented air bearings to support the shaft, thus resulting in a lubricant
free turbine. Consequently, the turbine was chosen for its environmental safety in
regard to lubricant spills. Since the turbine operates in the absence of lubricants, it
has a few operation and the hardware differences from the other turbines
mentioned above. These include the lack of lubricant pumps, radiators and
lubricant filters.

7
The cross section of the C30 micro turbine in Figure 2.2 shows the simple, all-in-
one design and single rotating shaft. Attached to the shaft is the compressor,
turbine and permanent magnet generator.
Figure 2.2 - Cross section of the Capstone C30 micro turbine. [3]

8
The combustion process can be followed using Figure 2.3 below. Cold air, which
flows past the generator, is drawn in by the compressor. The air cools the
generator and is then compressed by the centrifugal compressor. The compressed
air, now at a pressure of 4 bar and temperature of 205°C, enters the recuperator
where it is heated by the exhaust gas. The air is heated to a temperature of 510°C
and enters the combustion chamber where it is mixed with fuel and ignited. The
turbine is used to expand the gas, which is now at 816°C, and this provides drive
for the generator and compressor. The burnt air is then passed through the
recuperator where its temperature is lowered from 590°C to 275°C as it
exchanges heat with the incoming unburnt air. The exhaust gas is then allowed to
escape to the atmosphere directly or used in a heat exchanger to further extract
energy for heating purposes. [3]
Figure 2.3 - The air flow within the C30 micro turbine. [3]
A power turbine employs the same basic cycle as the one mentioned above. The
major difference is that the process occurs at many different locations. The
pressures are also much higher and the power output can be factors of 1000 or
more higher than the micro turbine versions.

9
3.0 Rapeseed Oil
3.1 Production of Rapeseed Oil
Rapeseed oil (RSO) is produced from the seed of rapeseed plants. Rapeseed
crops, part of the Brassica family, are grown all over the world in temperate
climates. Rapeseed is primarily grown for its oil and as meal for livestock. The
small, black, round seeds found in rapeseed plants are pressed to extract the oil.
World-wide production of rapeseed, in 2002/03, was 32 million metric tons with
the European Union and China producing about 10 million tons each. Germany,
achieving a yield of more than twice that of China, was the largest producer
within the EU. According to A. Czernichowski, M. Czernichowski and K.
Wesolowska [7], a seed yield of 3.3 tons per hectare is possible in Europe, which
would produce 1.35 tons of RSO. The global RSO production for 2002/03 was
12.8 million metric tons. RSO accounts for one third of vegetable oil produced in
Europe and represents are large and growing market.
Rapeseed oil is divided into two main categories; canola oil and industrial
rapeseed. The industrial variation has a different chemical composition (See
Section 3.2) and is used mainly in high-heat stability applications like greases and
lubricants and is not suitable for human consumption. Canola oil (canola and
rapeseed are interchangeable terms) is used in cooking and food processing and
can be used as a fuel in diesel engines with minimal modifications. The
esterification1 of RSO produces rape-methyl-ester, which is a direct substitute for
diesel. Canola oil is the most widely produced RSO and almost all rapeseed crops
grown in Europe are of this kind. Rapeseed production can be expected to grow as
more and more RSO is consumed.
1 Esterification is the process where methanol or ethanol is reacted, in the presence of a catalyst, with oil. The products are methyl ester or ethyl ester and the by-product is glycol.

10
3.2 Chemical & Physical Properties
RSO is a mixture of many different fatty acids that occur naturally in rapeseed
seeds. The fatty acids include palmitic, linoleic, linolenic, oleic and erucic acid.
The percentage composition of these acids in RSO determines whether it is canola
oil or industrial rapeseed oil, also known as HEAR (High Erucic Acid Rapeseed).
Table 3.1 below shows the composition of canola oil and HEAR.
Fatty Acid Name Annotation Canola Oil HEAR
Arachidic Acid C20:0 1% 1%
Erucic Acid C22:1 Trace >45%
Linoleic Acid C18:2 21-23% 14%
Linolenic Acid C18:3 10% 9%
Oleic Acid C18:1 59-61% 15%
Palmitic Acid C16:0 4-5% 5-6%
Chemical Composition of Two RSO Varieties - Canola & HEAR
Table 3.1 - Chemical Composition of Canola oil and HEAR.2 [19]
The long fatty acid chain, erucic acid, according to Davies (1996) [8], gives
HEAR its characteristics that make it suitable for industrial lubricants.
The variability in the amount of these acids in canola oil makes it difficult to
accurately state its chemical formula. However, for the purpose of fundamental
calculations and equation writing, the average formula of C18.1H34.1O2 [7] was
used. The same dilemma is unearthed when trying to pinpoint the physical and
2 The notation C20:0 refers to a hydrocarbon chain of 20 carbon elements with zero double bonds, otherwise known as the saturated fatty acid, eicosanoic acid. Like wise C18:2 is a polyunsaturated fatty acid hydrocarbon with 18 carbon atoms with 2 double bonds.

11
chemical properties of canola oil. Some basic values are given below in Table 3.2
for canola oil with an erucic acid composition of less than 2%.
Density @ 20°C kg/m3 914 - 917Cetane Number 40 - 50Viscosity (Kinemtic @ 20°C) mm2/s 37Flash Point, Open Cup °C 275 - 290
Canola Oil Properties
Table 3.2 – Properties of canola oil. [13, 19]
The values in the above table need to be taken into consideration when attempting
to substitute Diesel for RSO. The next section will compare RSO and diesel.
3.3 Comparison to Diesel
Diesel is a hydrocarbon-based fuel that is extracted from crude oil. In the
distillation process, diesel fuel forms from hydrocarbons that have melting points
ranging between 250°C and 380°C [25]. These distillation temperatures are in the
range of the boiling points of C9 to C12 hydrocarbons. Therefore, like RSO,
diesel is a mixture of many different compounds. However, diesel fuel is refined
to ensure that a standardized quality product is produced. Table 3.3 shows some
properties of diesel fuel.
Density @ 20°C kg/m3 820 - 860Cetane Number 51Viscosity (Kinemtic @ 20°C) mm2/s 2.0 - 4.5Flash Point, Open Cup °C 55
Diesel Properties
Table 3.3 – Properties of diesel fuel. [25]

12
Diesel can be directly substituted by bio-diesel, as mentioned earlier, however,
using the esterification method requires the further addition of energy to refine
natural oil into a bio-fuel. This additional energy can be avoided if the oil can be
used directly. This leads to further pollution control and increased efficiency by
decreasing the fuel’s cost of production.
One difference between RSO and diesel is particularly important in today’s aim
towards renewable energy. The known crude oil reserves of the world have been
estimated to be insufficient to fuel our industries for more than the next few
centuries at best. For this reason it has become important to find sources of fuel
that do not depend on the oil reserve. Renewable oil, such as rapeseed oil, is an oil
that may be a fuel for the future.

13
4.0 Combustion and Emissions
4.1 Introduction to Combustion
Combustion is a phenomenon that can be easily accepted and understood in its
simple form. It is defined by Lissianski, Zamansky and Gardiner Jr. (2000) as a
fast chemical reaction in which a fuel combines with an oxidizer to form
combustion products. In most cases the oxidizer is oxygen from the air and the
fuel is most commonly a form of hydrocarbon. For combustion to occur, the
presence of heat or a source of ignition is vital to allow the reaction to take place.
The fuel must be heated beyond its flame point or ignition temperature to initiate
combustion. If these conditions prevail, combustion will continue. However the
study of the science of combustion is extensive and ongoing. It can be analysed
using chemistry, physics, heat transfer and fluid flow. In this section, combustion
will be looked at chemically, as a reaction, to depict the fundamental compounds
involved and their ratios in the burning of diesel and rapeseed oil in air. For
further information on combustion, there are a great number of books written in
the last 50 years available that deal with combustion exclusively and
comprehensibly.
4.2 Hydrocarbon Combustion
A chemical equation represents the transformation of reactants to products. In this
case, the reactants are air and fuel (diesel or rapeseed oil) and the products are the
exhaust gases, water (and heat).
( )HeatWater Emission Air Fuel ++→+
The micro turbine receives oxygen from the air. Air is a mixture of gases that
includes 78.07% nitrogen, 20.95% oxygen and 0.93% argon [12]. The remainder

14
0.05% is comprised of carbon dioxide, hydrogen and other rare gases. To simplify
the task of writing equations, the content of air is assumed to be 79% nitrogen
(N2) and 21% oxygen (O2) and will be referred to as perfect air. In terms of moles,
this translates to 1 mol of O2 for every 3.76 mol of N2.
The combustion of a hydrocarbon like methane, CH4, in oxygen results in the
following equation.
O2H CO O2CH 2224 +→+
Diesel and rapeseed oil are also hydrocarbons composed of hydrogen and carbon
(rapeseed oil contains oxygen as well). Therefore a similar equation for each can
be written. The difficulty arises when one tries to define the exact chemical
formula. The chemical formula of rapeseed oil was shown earlier to be
C18.1H34.1O2. The chemical formula for diesel is more difficult to define due to the
variability in its composition. Current estimates stand at a mixture of C9 to C20
hydrocarbon chains that are 65% aliphatic and 35% aromatic. This was
interpreted as a chemical formula of C14.5H29.
Therefore the combustion of ‘clean’3 diesel in the presence of perfect air can be
represented as…
( ) 222222914.5 N78.81O14.5H 14.5CO N76.3O75.21HC ++→++ Eq.1
And the combustion of rapeseed oil in perfect air as…
( ) 222222.034.118.1 N35.96O17.05H 18.1CO N76.3O625.25OHC ++→++ Eq.2
3 In this case, clean diesel refers to diesel with no additives or impurities.

15
In reality, such perfect reactions are not realised. There is, almost always, a
presence of excess air, the fuel is contaminated with sulphur based compounds
and other additives and the gases in the air may also react in the reaction, for
example nitrogen to form nitrous oxides (NOX). Further more, small amounts of
carbon leave the reaction in the form of carbon monoxide, an under-oxidised
carbon dioxide molecule. The excess air situation is necessary because the ideal
oxygen volume is not sufficient for complete combustion due to inadequate fuel
and oxygen mixing. By allowing extra oxygen to be present during combustion,
the fuel molecules have a greater chance of being completely oxidised and thus
burning entirely.
These considerations must be taken into account when attempting to predict
combustion emissions. Therefore the most reliable method to determine emission
composition is to measure it. These equations may serve to confirm the magnitude
of the results, to ensure that the figures are within the expected range and that all
elements are or can be accounted for.
4.3 Introduction to Emissions
The reactants of a combustion reaction are termed the emissions or exhaust gases.
Many exhaust gases are air pollutants, poisons or both. For this reason the
quantity and type of emissions must be minimised and must conform to
government regulations. Typical emissions include [12]:
• Nitrogen (N2)
Odourless, colourless, tasteless and harmless gas that acts as a medium for
heat transfer. Largely uninvolved in the combustion process.

16
• Carbon Dioxide (CO2)
Odourless and colourless gas with a slightly sour taste. Produced in all
combustion processes and exist as 0.03% of the atmosphere. At concentrations
of 15% it causes immediate unconsciousness.
• Water Vapour
The hydrogen of the fuel is reacted with the oxygen to form water. Present as
humidity in high temperature exhaust gases.
• Oxygen (O2)
A portion of oxygen that is not consumed during combustion can be used to
assess efficiency, as a reference value or as a method to determine combustion
parameters.
• Carbon monoxide (CO)
Odourless, colourless, tasteless and toxic gas that is formed by incomplete
combustion of carbon-containing matter. CO is lethal and at concentrations
above 700ppm (0.07%) death occurs within hours. A widely recommended
safe workplace exposure concentration is between 30ppm and 50ppm [10, 18].
• Nitrous Oxides (NOX)
Existing as NO and NO2, these are both dangerous and toxic pollutants. NO2
contributes to ozone formation and is a lung poison. NO is formed when
nitrogen from the fuel reacts with oxygen (fuel NOX) or when the nitrogen
(nitrogen from the air) reacts with oxygen in the presence of high
temperatures (thermal NOX). The NO compound is later oxidised and forms
NO2. NOX can be removed from the exhaust by using catalytic converters.

17
The source responsible for NO in exhaust gases is difficult to determine, since
there are four sources from which NO can develop [14]. These are:
1. Thermal NO
2. Nitrous Oxide Mechanism
3. Prompt NO
4. Fuel NO
Each one of these sources may be responsible for some of the several
molecules of NO that are produced per million particles of exhaust gas.
Therefore it is difficult to show conclusively that one mechanism is more
responsible than another. However, by understanding each mechanism, we
can draw conclusions on the relative influence of each.
Thermal NO is the term given to NO that is formed as a result of high
temperature reactions between Nitrogen and Oxygen in the air. At
temperatures in excess of 1850K, nitrogen gas molecules combine with
oxygen atoms to form NO. In fuel rich combustion, oxygen reacts
preferentially with fuel over NO. In fuel lean combustion, sufficient oxygen is
present to react with nitrogen and form NO. According to Snyder, Rosfjord,
McVey and Chiappetta [24], a 650K to 700K combustion temperature using
No 2 Fuel Oil will produce approximately 6 to 20 ppm of NO
Nitrous Oxide Mechanism is, according to Nicol, Malte, Lai, Marinov and
Pratt [16], initiated by the reaction
ON O N 22 =+
The N2O is then oxidized to NO.
NO NO O ON 2 +=+
Prompt NO is the result of a premature reaction of N2 with CH. This occurs
early in the flame region and is gradually transformed to NO through

18
reactions involving HCN, CN and NCO. Prompt NO is independent of
pressure and usually occurs in lean premix combustion [5].
Fuel NO is produced when nitrogen-containing distillate fuels undergo
combustion. The nitrogen in fuel (as much as 1.8%) is oxidized to NO and the
reaction is more prominent at higher temperatures.
According to Nicol et al. [16], the proportion of each form of NO present is
dependant on the fuel/air ratio and the temperature of combustion. Little
information on liquid fuel turbine NO emissions exists and therefore these
proportions are widely unknown.
• Other gases (SO2, H2S, HC’s and Soot)
The sulphur compounds are both toxic and have pungent odours. H2S is
converted to SO2 in exhaust gases due to its high toxicity. SO2 contributes to
acid rain. Sulphur is added in low concentrations to diesel fuel.
• Unburnt hydrocarbons (HC’s) can pose heath hazards since some are a
known carcinogenic. Soot is the term given to the solid carbon particles of
unburnt liquid or solid fuel. These are also called particulate matter and pose
health risks due to there small size (around 10µm).
The German basis for pollution control and prevention is based on the law
amended in 1990 and 1994, Bundesimmisionsschutzgesetz (BimschG) (Federal
Emission Control Act). The BimschG is implemented according to the regulations
outlined in the BimschV (Federal Emission Control Regulation Order). The
Technische Anleitung Luft (TA Luft), (Technical Instruction Air), is the
regulation that supports authorities with the enforcement of the 4th ordinance of
the BimschV. The recommended emission values for turbines, according to these
laws, are shown in Table 4.1.

19
CO2 %CO ppmNO2 ppmNO ppmNOX ppm
* Recommended NL No Limit
Maximum Allowable Gas Concentrations in Exhaust
from TurbinesGas
73NLNL40
7-8%*
Germany
Table 4.1 - The allowable concentrations of certain gases in the exhaust of a
turbine, according to German regulations. [28]
4.4 Emission Calculation
Each of the gases mentioned in 4.3 are formed during the combustion process.
Due to the difficulty associated with accurate combustion analysis, only carbon
dioxide will be analysed using chemical equations. The analysis below will omit
the calculations, however they can be found in Appendix A.
For diesel:
From equation 1, 14.5 moles of carbon dioxide are released for every mole of
diesel combusted. The number of moles of products produced during the reaction
is 110.78 moles when a lambda of 1 is observed (i.e. an ideal air/fuel ratio). This
corresponds to a total mass of 3190.9 grams. The percentage by mass of this
weight that is made up by CO2 is 20.0%, and by volume4, CO2 accounts for
13.1%.
4 The moles of a gas are related to the volume through Avogadro’s Law (equal volumes of gas contain equal numbers of particles) and the Ideal Gas Law (PV = nRT, the relationship between moles, temperature, pressure and volume).

20
For combustion at lambda values other than 1, the following equation can be used
to determine the quantity of products.
( )( )
2222
222914.5
O 2
35.14275.21 N 78.81 OH 14.5 CO 14.5
N76.3O 75.21 HC×−×
+++
→++λλ
λ Eq1.1
For the purpose of demonstration, let us assume λ=8. At this air/fuel ratio, 835.49
moles, or when calculated in terms of mass, 24 103.10 grams of products are
formed. The percentage by mass of this weight that is made up by CO2 is 2.65%,
and by volume, CO2 accounts for 1.74%. These series of calculations can help
confirm the validity of the results obtained by the VISIT 02S. The equations lead
to the information in Table 4.2 that shows the theoretical CO2 emissions as a
percentage by volume for various values of lambda.
Rapeseed Oil Diesel
CO2 Vol % CO2 Vol %
8 1.84 1.749 1.63 1.5410 1.47 1.3911 1.34 1.2712 1.23 1.16
Lambda
Theoretical Carbon Dioxide Concentration of Exhaust Gas
Table 4.2 - The theoretical CO2 concentrations of exhaust gas from either diesel
or rapeseed oil fuelled micro-turbines at common values of lambda are shown
above.

21
For rapeseed oil:
From equation 2 it is seen that 18.1 moles of carbon dioxide are released for every
mole of rapeseed oil reacted. Following the same reasoning as before the
following values result:
Number of moles of products produced: 131.5 moles
Mass of products: 3803.34 grams
Percentage CO2 by mass: 20.9%
Percentage CO2 by volume: 13.8%
For combustion at lambda values other than 1, the following equation can be used
to determine the quantity of products.
( )( ) ( )
2222
222.034.118.1
O2
05.1721.182225.625 N 6.359 OH 17.05 CO 18.1
N76.3O 625.25 OHC+×−+×
+++
→++λλ
λ
Eq.2.1
For the purpose of demonstration, let us once again assume λ=8. At this air/fuel
ratio, 985.33 moles, or when calculated in terms of mass, 28 441.59 grams, of
products are formed. The percentage by mass of this weight that is made up by
CO2 is 2.80%, and by volume, CO2 accounts for 1.84%. Table 3.1.4 above shows
the theoretical CO2 emissions as a percentage by volume for various values of
lambda.

22
5.0 The Exhaust Gas Analysis Unit: VISIT 02S
5.1 VISIT 02S Capabilities
The VISIT 02S System, produced by Messtechnik EHEIM GmbH, is a portable,
multi-function exhaust gas measuring unit that is suitable for continuous
measurement and calculation of exhaust gas constituents. The unit is designed to
be compatible with liquid, gas, solid or biomass fuels and is appropriate for
industrial applications. The VISIT 02S meets the highest quality and
environmental standards of Germany and Europe; these include the:
1. German Federal Pollution Protection Act5 (1. BimSchV), [28]
2. the Voluntary Control Council for Interference by Data Processing
Equipment and Electronic Office Machines (Council Directive
89/336/EEC),
3. the standards EN 50 081 Part 1, EN 50 082 Part 1 and
4. the TÜV (Technischer Überwachungsverein – Technical Control Board)
Bayern-RgG200.
This device is able to measure the gas concentrations in the exhaust gas, ambient
air temperature, exhaust gas temperature and absolute pressure. The VISIT is also
capable of calculating many values internally from the measured parameters.
These include Efficiency (η), Lambda (λ) and Exhaust Gas Losses (qA). Refer to
Table 5.1 below for the range and units of measurements and possible
calculations using the VISIT 02S.
The Eta (η)6 value refers to the efficiency of combustion, expressed as a
percentage. It is calculated as 100 percent minus ASME heat losses. To maintain
brevity, calculations have been omitted and can be found in Appendix B.1.
5 This standard states the limits of emissions allowable from a ‘Small Power Plant’. 6 Eta is the Greek symbol (η). It is usually used to represent efficiency in thermodynamics.

23
The Lambda (λ) value indicates the amount of excess air present during
combustion, using the ratio of total air to stoichiometric air. Otherwise known as
excess air, a λ-value greater than 1 refers to an excess of air in the combustion
mixture. Further information can be found in Appendix B.2.
The Losses refer to the exhaust gas heat losses, calculated using the Siegert
Formula (according to ASME) and expressed as a percentage. Once again refer to
Appendix B.3 for equations and calculation methods.
Table 5.1 - The functioning principle, range and accuracy of the VISIT’s sensors.
[2]
Lower Higher
Air Temp. NiCr-Ni (Type K) -30°C 300°C 0.1°C ± 1°C
Exhaust Temp. NiCr-Ni (Type K) -30°C 800°C 0.1°C ± 4°C @ 400°C
O2 Electrochemical 0% 21% 0.1% ± 0.2 %
CO Electrochemical 0 10,000 1 ppm ± 5 ppm
NO Electrochemical 0 4,000 1 ppm ± 5 ppm
SO2 Electrochemical 0 4,000 1 ppm ± 5 ppm
CO2 NDIR 0 250,000 100 ppm ± 5 %
HC (C3H8) NDIR 0 20,000 5 ppm ± 5 %
Pressure Silicon ?? -350hPa 350hPa 0.1hPa <± 2%
Efficiency (η) Calculated 0 100% - -
Lambda (λ) Calculated 0 9.99 (-) - -
Flue Losses (qA) Calculated 0 100% - -
NOX Calculated - - - -
NO2 Calculated - - - -
CO2 (%) Calculated - - - -
Messtechnik VISIT 02S Measurement & Calculation Details
AccuracyParameter Operating Principle
Range (ppm unless stated) Resolution

24
The calculated parameters are determined using fuel-specific constants stored
within the VISIT memory. The VISIT has internal settings for 14 different fuel
types, which need to be appropriately selected to ensure the VISIT accurately
calculates the efficiency, lambda, losses and CO2 values.
The measurement recording process involves an internal real-time clock and a
512kb RAM. The data measurements (up to 5000) can be stored within this
inbuilt memory. The highest frequency of measurements allowed by the processor
is 14 values performed once per second. The unit may be connected to a PC using
one of the two RS323 ports. Using this connection and the supplied WIN-Data
software, the measurements can be sent in real-time to the PC for continuos
measurement recording. Using this approach it is possible to record data for 24
hours or more.
5.2 Theory of Operation
The VISIT employs electrochemical, non-dispersive infrared, thermoelectric and
silicon semi-conductor measuring bridge sensors to measure the variables of
concentration, temperature and pressure. The theory behind the operation of the
two most important sensors, electrochemical and non-dispersive infrared sensors,
will be explained to better understand the limitations of these sensors and the
requirements for an accurate measurement.
5.2.1 Electrochemical Sensor
Electrochemical sensors measure gas concentrations by converting chemical
reactions rates to electrical signals [26]. All electrochemical sensors function on
the same basic principle and only the materials involved change. Therefore only
the carbon monoxide sensor will be explained in detail.

25
The sensor is composed of three electrodes which are immersed in an electrolyte,
usually a non-metallic liquid such as dissolved salts or acid. The three electrodes
are the working electrode (WE), the reference electrode (RE) and the counter
electrode (CE). The WE is made of platinum, which is a catalyst for the CO, O2
reaction, and is the most important electrode. It is backed by a gas-porous but
waterproof barrier that allows the CO gas to diffuse through to the electrode and
be oxidized according to Equation 1 below.
Eqn. 1 [26]
The electrons freed in the reaction flow from the work electrode to the signal
output node via the external circuit. Figure 5.2 shows a diagrammatic
representation of an electrochemical sensor. The RE provides a stable and
constant electrochemical potential difference in the electrolyte that is ensured by
shielding the electrode from gas, thus maintaining its thermodynamic potential.
This stable electrochemical potential difference assures that the WE maintains a
suitable thermodynamic potential, vital to ensure the oxidation reaction takes
place. To maintain the thermodynamic potential in the RE, no current is allowed
to flow through it. The CE fulfils the role of the second half cell and allows
electrons to flow in or out of the electrolyte. The sensor also employs a
chemically selective filter that removes interfering gases.
2e 2H CO OH CO 2
Platinum
2 ++⇒+ +

26
Figure 5.2 - The diagrammatic representation of an electrochemical
gas sensor and its circuit. [26]
The control circuit is called a potentiostat and it converts the current signal to a
voltage and maintains the potential of the WE. The operational amplifier (op-
amp) U2 is responsible for converting the current signal from the WE to a voltage
signal. The op-amp U1 ensures that the voltage between the RE and the WE is
constant by supplying a voltage to the CE that creates a current at the CE that is
equal and opposite to the WE.
This operational theory applies to all other electrochemical gas sensors installed
in the VISIT. Figure 5.3 shows the WE material that is used for each type of gas
to catalyse the reaction.

27
Gas CatalystNO2 Au
CO PtH2 Au
NO2 AuO2 Au, Ag, Pt
SO2 AuH2S Au
Figure 5.3 - The electrode material used in sensors
to catalyse the required reaction. [26]
5.2.2 Non-Dispersive Infrared Sensor
The non-dispersive infrared (NDIR) sensor uses light reflection and absorption to
measure gas molecule concentration. The amount of IR light absorbed is
proportional to the concentration. Each gas absorbs specific wavelengths of IR
light. These are representative of the type of bonds present. For CO2 gas, the
wavelength 4.26µm has the strongest absorption. The CO2 absorbance spectrum is
unique for hydrocarbons and thus is easy to identify in an exhaust plume. [20]
A NDIR sensor is designed as shown in Figure 5.4. The gas floats in from the top
and passes through the IR radiation from the lamp. The IR detectors have filters
that allow only light with a wavelength of 4.26µm to pass. By changing the filters,
it is possible to measure other hydrocarbons, like propane for example.

28
Figure 5.4 - The design of a NDIR sensor. [20]
5.3 Rationale for the VISIT-02S?
There are many other portable and fixed-location gas analysis instruments that are
available on the market. Many share features and capabilities with the VISIT
model. All have temperature and gas sensors; however the range and accuracy of
measurements may vary. This particular gas analyser was chosen because it is
capable of measuring the data that is of interest, to the accuracy that is required.
Since it was procured by Nowum-Energy for earlier work it was made available
for this project. The accuracy of the analyser is sufficient to ensure the success of
the testing since the variable composition of rapeseed oil means that the exact
Siegert values cannot be input to the VISIT to give accurate calculations of CO2,
NOX and NO2. Furthermore, the diesel/rapeseed oil ratio will be limited in
accuracy due to the current pumping arrangement. Therefore the exact
composition of the fuel and therefore the CO2max value will be difficult to
determine. To ensure, however, that the VISIT was working accurately, it was
calibrated and serviced before testing commenced.
29
6.0 Setup
The two main pieces of equipment that are required for the testing have been
already mentioned and analysed. These are the Capstone micro turbine and VISIT
02-S emission measuring device. However there is a vast array of other tools and
apparatus required to complete the tests. They can be divided into the three
groups: Turbine, Fuel System and Emission Recording.
1. Turbine: The Capstone C30 Micro turbine is the only piece of equipment
in this group. It includes the entire turbine package, the exhaust pipe and
control software as one unit.
2. Fuel System: This group contains all additions and modifications to the
fuel system to monitor and feed fuel into the turbine.
• 2 Storage tanks – One 1000L tank each for diesel and rapeseed oil
stored in the cool dry basement, directly beneath the turbine.
• 2 Feed Pumps – One pump for each fuel tank. The pumps feed fuel
to a premix heating chamber. The 0.55kW positive displacement
230V AC electric pumps sourced from Stimel GmbH have an inline
filter between the pump output and premix heating chamber.
• Premix heating chamber – A spherical, 60 litre, glass flask with
multiple outlets. Used to mix diesel and rapeseed to ensure a
homogeneous mixture and also the vessel where the fuel is preheated.
• Fuel Agitator – An electric agitator mounted on the premix heating
flask to agitate the fuel to produce a homogeneous mixture. The
agitator employs a pair of 2 vane propellers to stir the mixture.
• Flask Heater – A 3 phase heating element that surrounds the
bottom half of the premix chamber. Used to heat the fuel mixture to
ensure the viscosity is below the turbine fuel inlet maximum value.

30
• Fuel line heaters – The heaters are mounted on the fuel line
between the turbine injectors and premix chamber. This is to ensure
that the turbine fuel pump and injectors are supplied with liquid with a
suitable viscosity.
• Inline flow property measuring system – The Promass 83 from
Endress & Hauser GmbH is capable of reporting, in real time, the
viscosity, mass flow, volume flow temperature and density of the
incoming fuel. It is situated between the turbine fuel pump and premix
heating chamber.
3. Emission Recording: This group contains all the tools used in the
measuring and recording of the emission data.
• VISIT 02-S – The emission sensing and measuring device sourced
from Messtechnik GmbH. For further information refer to section 5.1.
• Win-Data Software – For real time emission data collection.
• 1GHz Pentium Computer – Storing and recording data.
Figure 6.1 shows the majority of the equipment described above. Figure 6.2 on
the following page gives a real world view of the test apparatus.
Figure 6.1 – An indication of the setup used to run the turbine tests.

31
Figure 6.2 - (clockwise from top left). The fuel heating, agitation and storage
setup. The filters, pumps and heaters are all visible. The exhaust pipe and exhaust
gas heated probe. The turbine and fuel tank, with the Promass 83 visible.

32
7.0 Procedure
7.1 Testing
The testing procedure begins with the mixing and heating of the fuel and
concludes with the final data interpretation. The procedure is explained as
follows.
• Fuel Preparation
1. The required amount of diesel and rapeseed oil was pumped from
each storage tank to the premix heating chamber to produce the
necessary fuel composition.
2. For mixtures containing more than 30% rapeseed oil, the premix
heating chamber must be heated and the fuel line heaters must be
activated until such time that the viscosity of the fuel, as shown on
the Promass 83, falls below 6cSt.
3. The fuel agitator was set to 200rpm for the last ten minutes before
the test commenced when the speed was reduced to 100rpm for the
duration of the test.
4. The fuel inlet valve on the fuel line leading into the turbine was
opened.
• Turbine Settings
1. A preliminary visual check was completed on the turbine prior to
commencement. This included ensuring fuel line integrity and
checking communication connections.
2. The turbine control software was loaded onto the computer and
settings were set to enable control and data recording of the
turbine.
3. The turbine clock was synchronized with the computer clock.

33
4. The data recording interval was set to 2 seconds and a new file was
created on the hour during the test. See Appendix C for an example
of parameters measured and data recorded.
• Preparing the VISIT 02S
1. The unheated probe, calibration line and temperature sensor were
all attached to their respective orifices on the VISIT.
2. The VISIT was taken outside to a source of fresh air and allowed
to self-calibrate.
3. On completion of calibration, it was brought back to the testing
location and the unheated probe was exchanged for the heated
probe and the calibration line was removed.
4. The communications and main-power connection were re-
established. The probe heater was turned on.
5. The recording software was loaded into the computer and setup
with a data recording interval of 2 seconds. The VISIT clock was
synchronized with the computer clock.
6. Sufficient time, approximately 10mins, was allowed for the probe
to become fully heated
• Initiating the Test
1. Before the test was commenced, atmospheric conditions were
recorded.
2. The turbine was set to 8kW and the data recording systems of both
the turbine and VISIT software were activated.
3. The turbine was started.

34
• Testing Procedure
1. All Promass sourced data was recorded in a spreadsheet as shown
in Appendix C.
2. The fluid properties were measured after the turbine reached a
steady state of operation, judged by when the exhaust temperature
was constant.
3. The power demand was then raised by 2kW and allowed to reach
steady state. The data was again recorded. This was continued until
maximum power output was reached.7
4. The density, viscosity, temperature, volume flow rate and mass
flow rate of the fuel was recorded, along with the time that power
demand was changed and the time that the demanded power was
attained.
5. On completion of testing the turbine was allowed to undertake
standard, automatic shutdown procedures. The data recording
systems were allowed to record data at least until the turbine
reached standby conditions.
6. All associated systems were shut down and the fuel line valve was
closed.
7 The Capstone C30 Micro turbine is capable of producing 30kW maximum power, however due to atmospheric conditions, was able to only produce 26kW for the first 4 tests, therefore this was used as the maximum output.

35
7.2 Data Analysis
The 3 sets of data (turbine, VISIT and Promass 83) were complied together into
one spreadsheet. This was completed by slowly reducing the amount of
information. The start-up and shutdown data was removed first, followed by the
unwanted parameter data recordings (e.g. date and customer ID). Finally,
everything except the last minute of data that was recorded before a power
demand change was removed. In essence, this isolated 60 second ‘packages’ of
data for power outputs from 8kW, in steps of 2kW, to the maximum power output
of 26kW. For each parameter recorded in the package, the average was
determined and used to produce the spreadsheet shown in Appendix C.
This spreadsheet was labelled the ‘One Minute Averages’ spreadsheet and these
values were used to provide comparisons between fuel types. The data is depicted
in the results graphically.

36
8.0 Results and Discussion
The results and discussion, usually presented as individual sections, have been
combined into one chapter. Due to the large quantity of data that will be presented
and discussed, it was concluded that the combination of these two chapters will
aid readability and assist in comprehension. Each section of results will be
followed by the relevant discussion and conclusion.
The testing method and setup allowed for a large number of parameters to be
monitored and recorded. This resulted in vast quantities of examinable data and
trends. The complete set of parameters was used to plot graphs. All graphs
showed the parameter in question plotted against the power demand, which ranges
from 8kW to 26kW, for a few different fuel types, usually D100, R30, R60 and
R1008.
Many parameters were excluded from this final report due to results that showed
no trends or little change and were considered to be of minor interest. These
include the inlet air temperature data (no change), oxygen concentration in
exhaust gas (no change), flue gas losses (opposite to flue gas efficiency), exhaust
static pressure (no change), turbine exit temperature (no change) and turbine
compressor inlet temperature (only related to ambient conditions).
Therefore the eight parameters that will be analysed and discussed further is the
carbon monoxide, carbon dioxide and nitrous oxides emissions, exhaust gas
temperature, lambda values, fuel usage, engine speed and overall efficiency.
8 The letter R refers to rapeseed oil and the number following refers to the percentage presence in the fuel. Therefore, R30 is a 30% rapeseed oil mixture and is equivalent to D70, a 70% diesel mixture.
37
Car
bon
Dio
xide
Em
issi
ons
1600
0
1700
0
1800
0
1900
0
2000
0
2100
0
2200
0
810
1214
1618
2022
2426
Pow
er (k
W)
CO2 ppm
D10
0
R30
R60
R10
0
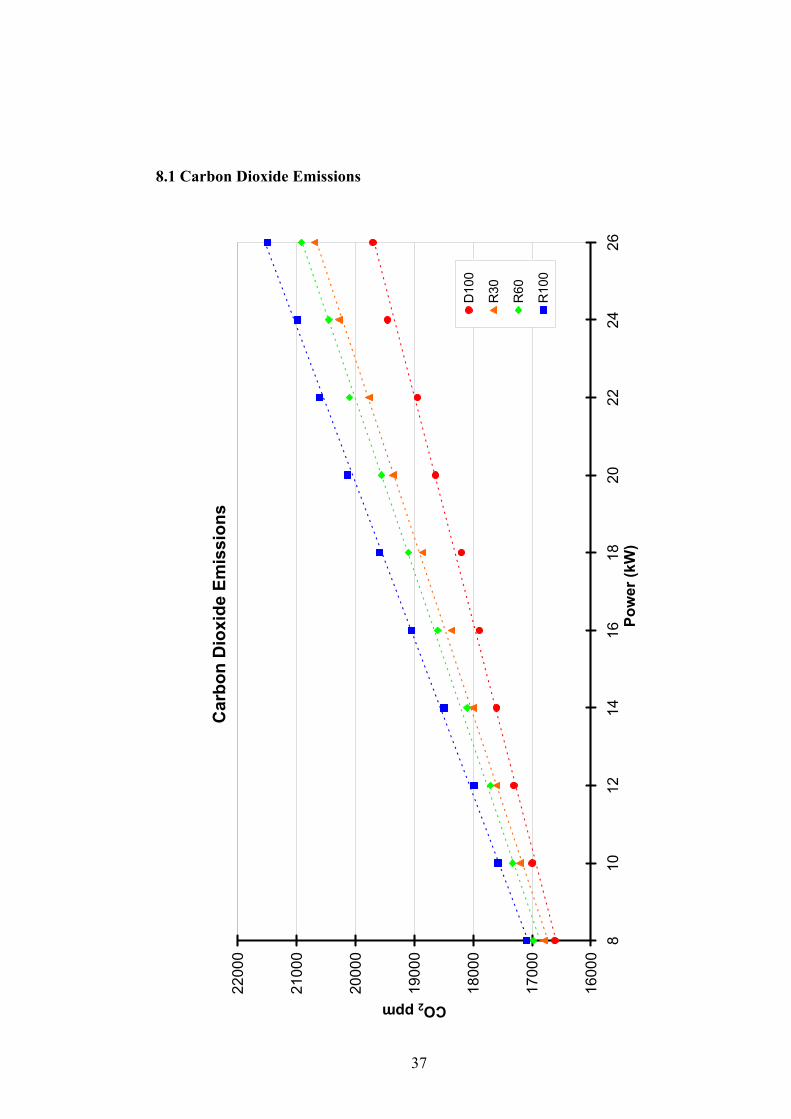
8.1 Carbon Dioxide Emissions

38
8.1.1 Analysis
The previous graph, showing carbon dioxide emissions, reveals many trends. The
quantity of carbon dioxide released during combustion increases as the power
demand of the turbine increased. The increase of emissions seems to abide by
linear growth; a linear line of best fit matches the measured points suitably. This
held true for all fuel types, however the rate of change increased as larger
percentages of rapeseed oil were present in the fuel. As power demand increased,
it was observed that proportionally more CO2 was measured. At 8kW, the
difference in emissions between D100 and R100 was 2.9%, however, at 26kW the
difference had increased to 9.1%.
8.1.2 Discussion
Carbon dioxide is the primary waste-product9 of combustion since hydrocarbons
contain large amounts of carbon. Rapeseed oil has a heating value10 that is more
than 11% lower than that of diesel [21]. Since the turbine must achieve a pre-set
power output, it draws larger quantities of fuel into the combustion chamber to
satisfy its energy requirements. As this occurs the increased numbers of carbon
atoms produce greater numbers of CO2 molecules. This may be one factor that
leads to higher CO2 emissions.
Another factor that may contribute to higher carbon dioxide emissions are the fuel
settings of the turbine and/or the fuel injectors. According to Capstone algorithms,
the fuel used can be represented by two variables. These variables differ for each
fuel type. Since the difference between the fuel variables for R100 and D100 was
of the order of 1%, the injectors seem to have played a larger role. Injectors are
designed with the fuel type in mind. If injectors are required to operate with fuel
9 Excluding water vapor as this is generally considered harmless and rarely of interest in exhaust gas. 10 The heat (energy) gained from combusting a specified amount of fuel.
39
that is other than the design fuel, it may cause problems in fuel atomisation, fuel
distribution and fuel-air mixing [17]. This may lead to inefficient combustion,
hot-spots inside the combustion chamber or incomplete combustion and therefore
result in increased CO2 emissions.
The increase of CO2 emissions can also be interpreted as a sign that the
combustion process is becoming less efficient. If greater quantities of carbon
dioxide are present in the exhaust gas, it suggests that more fuel is used to achieve
the required power output.
Carbon dioxide emissions increased to 21500 ppm, up approximately 10%, when
diesel fuel was substituted by rapeseed oil. It is however, still below
recommended emission figures (7%-8%) and accounts for approximately 2% of
the total exhaust contents.

40
Car
bon
Mon
oxid
e Em
issi
ons
051015202530354045
810
1214
1618
2022
2426
Pow
er (k
W)
CO ppm
D10
0
R30
R60
R10
0
8.2 Carbon Monoxide

41
8.2.1 Analysis
The graph showing carbon monoxide emissions, on the previous page, shows that
CO emissions follow an exponential decay pattern. For an 8kW power demand,
CO emissions were approximately 40 ppm; however at 14kW they had decreased
5 fold to an average value of 8 ppm. At 18kW and above the CO concentration
had fallen to below 5 ppm (0.0005%). Rapeseed oil-fuelled emissions consistently
had a higher CO concentration than diesel emissions. At low power outputs, the
difference is approximately 10ppm, however, at high power outputs, the
difference falls to 3 ppm. Inspecting the figure in Appendix D, which is the
complete version of the graph on the previous page, it is clear that as power
increases, CO concentrations become more consistent between fuel types. At 8
kW, the range in CO concentration is more than 18 ppm11. At 26 kW, the range is
5 ppm with 5 fuel mixtures registering concentrations below 1 ppm.
8.2.2 Discussion
Considering the allowable safe occupational level of CO in Australia is 30 ppm
[18], these values are low. The area surrounding the turbine would be safe for
human presence and even if the turbine would be required to run at low power,
the exhaust system would ensure that dangerous gases do not collect in an
enclosed area.
CO is usually formed during fuel-rich combustion [14]. If the amount of fuel is
greater than what is required for complete combustion, the shortage of oxygen
will result in large quantities of CO. Since oxygen content in the exhaust gas was
high, a lack of oxygen cannot be the cause of CO forming.
11 The results for the R40 test were ignored. The results were irregular and probably caused by to the 3 week break in testing.

42
However, even in fuel-lean combustion, CO is present. This may occur due to
dissociation. At high temperatures, around 1800K, combustion products like CO2
may dissociate into less complex molecules and radicals like CO [14]. Within the
combustion chamber temperatures of 1100K are readily achieved but higher
temperatures may be present at hot-spots or other isolated regions. Even if 1800K
is not reached, there may be dissociation present, though at low levels. Therefore,
CO2 may dissociate into CO. This does not however explain the lower CO levels
at higher power outputs and higher temperatures.
The majority of CO is formed, according to the equilibrium theory, due to
incomplete combustion caused by [14]:
1. Inadequate burning rates due to low fuel/air ratios or insufficient residence
time.
2. Inadequate mixing of fuel and air, resulting in over-rich combustion that
yields high local CO concentrations.
3. Quenching of the flame through contact with the air-cooled combustion
wall.
These factors may explain the trends that appear in the CO emissions. Insufficient
residence time (the duration of fuel presence in the combustion chamber before
combustion) may lead to insufficient combustion and cause CO emissions. The
next two factors, inadequate mixing and quenching, are suspected to be the main
factors.
The injectors are directly responsible for mixing the fuel and air mixture before it
enters the combustion chamber. Due to a design that does not have rapeseed oil in
mind, fuel atomisation may not occur as planned and result in a larger mean drop
size. This reduces the volume available for combustion since more volume is used
for fuel evaporation. This may lead to a CO rise.
Quenching of the flame can result when combustion reactions in the primary
combustion zone migrate towards the combustion walls. The temperature there

43
was low and the CO may have became entrained in the wall cooling air. This
effectively froze the reactions and prevented CO to further oxidise to CO2. Unless
the CO is reintroduced to the central core, the CO will appear in the exhaust gas.
CO emissions become more regular as turbine power increases and hence it can
be concluded that, as the turbine temperature and fuel flow increases, the
conditions in the combustion chamber are less favourable for CO creation. This
may be due to better fuel mixing as a result of higher injection and fuel flow
pressures and/or more turbulence due to higher turbine speeds that better agitates
the combustion chamber and reduces the effect of wall quenching.
CO emissions are difficult to predict and are almost always higher than what is
predicted in equilibrium theory. However the trend of lower emissions as power
and temperature rises is predicted by equilibrium calculations.
The use of rapeseed oil led to larger quantities of CO present in the exhaust gas
than diesel. Apart from the greater number of fuel molecules, and thus carbon
atoms, present to make the same amount of power as diesel fuel, the increased CO
emissions may be attributed to the fuels lower flame and smoke points. This
results in a fuel that is more difficult to combust and thus can cause inefficient
combustion. These conditions would lead directly to greater CO concentrations.
Rapeseed oil, however, does not increase the CO emissions to a level that would
make it unsuitable for widespread use. Apart from low power outputs, below
8kW, the exhaust would be safe enough to release to the environment. If further
cleaning is required, OH or H2O, in low temperature situations, can be added
downstream to oxidise the CO to CO2 [14].

44
Nitr
ous
Oxi
de E
mis
sion
s
024681012
810
1214
1618
2022
2426
Pow
er (k
W)
NO (ppm)
D10
0R
30R
60R
100
8.3 Nitrogen Oxides

45
8.3.1 Analysis
The graph shows the NOx concentrations and since the concentration of NO2 was
0 ppm for all tests, the NOx values are equal to the NO concentrations and shall be
referred to NO from here on. At power outputs less than or equal to 14kW, there
were only slight differences in the NO concentrations. At high power outputs, the
range of NO increased greatly. The emissions rose further as greater quantities of
rapeseed oil were used in the fuel. At 26kW, diesel fuel resulted in a NO
concentration of more than 50% lower than that of rapeseed oil fuel. The largest
concentration of NO recorded was 13ppm, using R100 fuel, at 26kW. After
inspecting the graph in Appendix E, the NO emissions of fuels R70 to R100 were
much greater than the emissions of fuel R60 and below. This was especially
evident in the 8kW to 24kW power range, where operating on D100 to R60 fuel,
resulted in a range of only 1 ppm of NO between the fuel types. Fuels R80, R90
and R100 resulted in NO levels that were much higher than R60 fuels at 16kW
and above.
8.3.2 Discussion
NO can be formed by 4 different methods, as explained previously. For
simplicity, assuming that one type of NO dominates over the others, through
elimination, it could be possible to determine the dominant form. The combustion
conditions in the combustion chamber are composed of 1100K gas temperature,
high gas pressure and an extremely lean mixture. The lambda values show that the
equivalence ratio was around 0.1. This means that there was 10 times more air
than required. The temperature was too low to suggest that thermal NO was the
dominate form, since it occurs most commonly at temperatures of 1850K and
higher. Apart from hotspots and isolated regions, the chamber temperature was
800K lower. Fuel NO was a possible type of NO since organic materials and
diesel both contain small amounts of nitrogen. However, the exact level is
difficult to show without chemical analysis. Fuel NO can represent a large

46
proportion of total NO, especially in liquid fuels [15]. Prompt NO and Nitrous
Oxide Mechanism NO is complex to judge and since no data was available
regarding liquid fuel turbines, it was assumed that they had no effect on the NO
emissions. Considering the conditions and fuel, the fuel NO seemed to represent
the largest proportion of NO in the exhaust. This was further supported by the
mean drop size observations by Rink and Lefebvre [10, 17].
The gradual increase of NO levels as rapeseed oil concentrations rose can be
accredited to the injector design and therefore the mean drop size. According to
Rink et al., the NO emissions in a continuos flow combustor increased when the
mean drop size was increased, especially at low equivalence ratios. This effect is
due to the envelope flame phenomenon. Large droplets of fuel tend to burn in
diffusion mode and form a surrounding layer of flames around the drop. These
regions produce stoichiometric conditions and result in high temperature, high
NO yield zones. This may be the defining cause for NO emissions when running
on rapeseed oil. The fuel drop size would increase as the fuel becomes more
viscous and would thus lead to increased NO emissions.
The similar results for D100 through to R60 fuels was an unexpected result,
especially since the next 4 fuel mixtures (R70-R100) increased so dramatically. A
possible explanation may be that the mean drop size was altered suddenly. The
addition of 10% more rapeseed oil does not necessarily lead to a 10% increase in
viscosity. Another explanation is that, after the R60 test, the fuel line heaters and
the fuel tank heater were used to increase the fuel temperature. This may have
upset the chemical nature of the fuel mixture.
In terms of safety, NO regulations and legislation tends to be complex due to
varying laws between countries and supplements imposed by site-specific boards,
local councils or state governments. The lowest enforceable NO limit is 80 ppm
for turbines developing between 700kW and 7000kW. For turbines below this

47
power output, no legislation exists [14]. At a maximum of 13 ppm, using R100,
the NO concentration is still 6 times lower than the recommended level for much
larger turbines. Generally, the NO emissions are low and safe.

48
Lam
bda
8.00
8.50
9.00
9.50
10.0
0
10.5
0
11.0
0
11.5
0
12.0
0
810
1214
1618
2022
2426
Pow
er (k
W)
Lambda
D10
0
R30
R60
R10
0
8.4 Lambda
49
8.4.1 Analysis
An inverse relationship between Lambda and power was observed and as the
rapeseed oil concentration rose, lambda decreased. The difference between
lambda values over the range of fuels remained approximately constant. Lambda
values from 11.6 to 8.2 were recorded which represents an equivalence ratio of
0.086 to 0.122 respectively.
8.4.2 Discussion
As power increased, the amount of excess air available was reduced. This
observation agrees with expectations, where more power will lead to more fuel
and thus produce a richer combustion mixture. It is suspected that the air volume
would increase, the engine speed rise would lead to higher intake pressures and
flow rates; however, since the lambda value was reduced, it is concluded that
proportionally more fuel was added to the combustion chamber.
For accuracy, and validity, the VISIT-calculated lambda values can be checked by
referring to the calculations in Chapter 4. The predicted CO2 concentrations for
certain lambda values are shown and correspond closely to the measured values.
These can only be taken as a guide since the chemical compositions of each fuel
is based on averages and is variable from batch to batch.
Further analysis of the lambda values would require intensive combustion
chemistry and the measurement of many more parameters. The results analysed
show no unexplained or unpredicted behaviour and agree with Capstone supplied
specifications.
50
Turb
ine
Fuel
Usa
ge
3456789101112
810
1214
1618
2022
2426
Pow
er (k
W)
Fuel Flow (kg/hr)
D10
0
R30
R60
R10
0
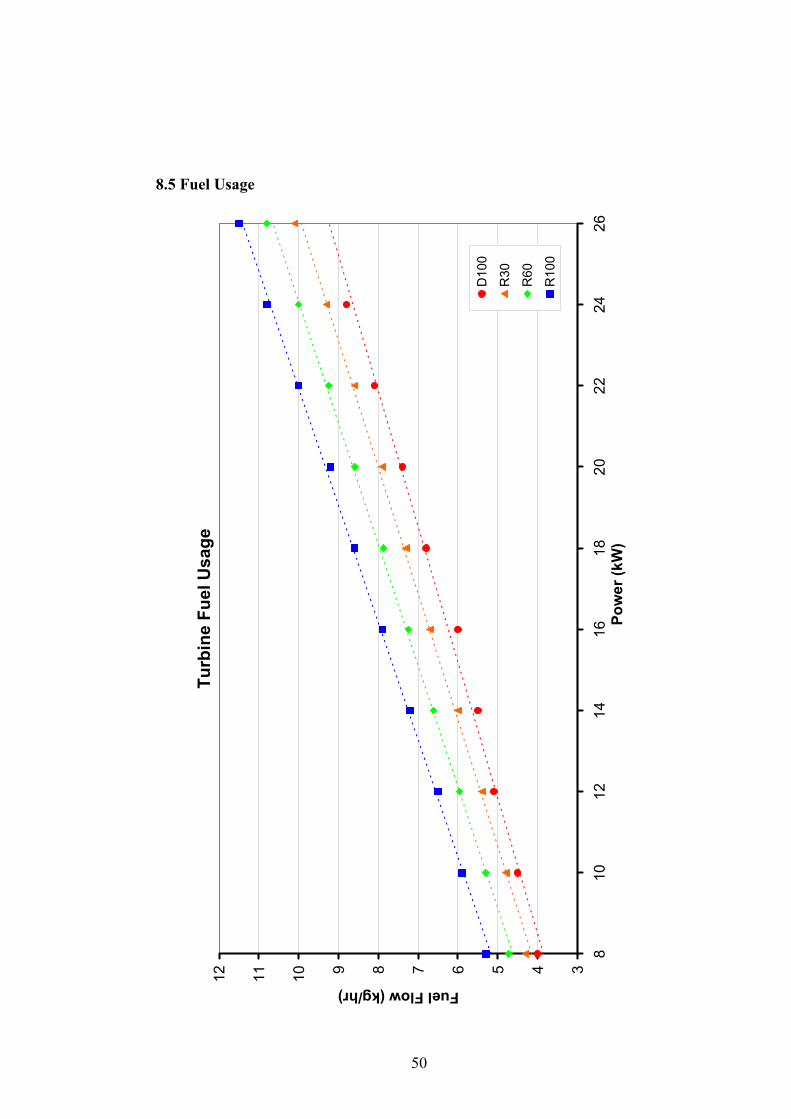
8.5 Fuel Usage

51
8.5.1 Analysis
The fuel mass flow increased in a linear fashion as power was increased. The
addition of rapeseed oil to the fuel led to a left shift of the fuel flow curve,
meaning that fuel usage increased as more rapeseed oil was used. Additionally,
the fuel usage at high power demands showed a larger range over the different
fuel types than low-power-demand fuel usage. This is represented by the
increasing gradient difference. At its lowest, fuel usage was 4kg/hr for D100 at
8kW, 33% lower than RSO at the same power. The highest fuel usage was
11.5kg/hr for R100 at 26kW, representing a 25% increase over diesel fuel.
8.5.2 Discussion
As larger power outputs were demanded, the fuel flow rate increased, as expected.
The higher flow rate of rapeseed oil fuel is due to its lower heating value. The
11% lower heating value relates to an approximate 25% increase in fuel usage.
This may be reduced with the addition of ethanol to the mixture or other
chemicals that may improve the heating value and viscosity. Furthermore, fuel
efficiency may be improved by modifying the fuel system. This may include
changes to the fuel pump, filter, injectors and lines.
The increased fuel usage when running on rapeseed is something that would need
to be weighed up against the environmental benefits in terms of site protection,
not just fuel costs per hour of operation per se. Additionally, the life cycle
emissions would need to be considered.

52
Turb
ine
Spee
d
65707580859095100
810
1214
1618
2022
2426
Pow
er (k
W)
Speed ( '000 rpm)
D10
0
R30
R60
R10
0
8.6 Engine Speed
53
8.6.1 Analysis
The engine speed decreased by 2% when rapeseed oil was used. The speed curve
for all fuel mixtures followed the form of the D100 curve extremely closely and
did not deviate.
8.6.2 Discussion
The relative stability of the engine speed is based on the fact that the micro
turbine uses a preset engine speed and turbine exit temperature to achieve the
desired power output. The turbine exit temperature was unchanged and thus the
engine speed changes were necessary to achieve the desired power output.
The engine speed can be assumed to be independent of the fuel type and turbine
operating conditions. The measurements were taken to see what change to the
service life could be achieved through using rapeseed oil. A 2% reduction in
engine speed would represent negligible increases in service life, and in this case,
the effect of the rapeseed oil on the turbine blades and injectors would be of much
higher relevance for making comments regarding the life of the turbine.
For further comments regarding turbine life, the turbine impeller and stator would
need to be removed and analysed for wear on the blades. This would provide a
better estimate for turbine wear.

54
Exha
ust G
as T
empe
ratu
re
200
210
220
230
240
250
260
270
280
810
1214
1618
2022
2426
Pow
er (k
W)
Temperature °C
D10
0
R30
R60
R10
0
8.7 Exhaust Temperature

55
8.7.1 Analysis
A reduction in exhaust temperature was seen as larger proportions of rapeseed oil
were used in the fuel. The reduction was as high as 7K for 26kW power outputs.
8.7.2 Discussion
The exhaust temperature is a function of many variables. This would include the
volume and pressure of the exhaust gas, the exhaust gas flow rate and the ambient
air conditions. As the turbine speed decreased, the volume of air flowing through
the exhaust would have been lower. This may have resulted in a lower exhaust
mass to transport the temperature and thus the gases would cool faster.
The lower engine speeds also result in a reduced gas flow rate. The reduced flow
rate of gas through the exhaust pipe would increase the potential for heat
exchange with the surroundings and this may have led to the observed reduction
of exhaust temperature.
The ambient air temperature around the exhaust surface could also change the
exhaust temperature; however the large diameter of the exhaust pipe and similar
ambient conditions suggests that this was not a factor in the reduction of exhaust
gas temperature.
The reason for the decrease in exhaust gas temperature between fuel types could
be accredited to the lower heating value of RSO. This would have resulted in less
energy available to heat the exhaust gas. This theory could be supported by the
efficiency increase. A larger proportion of the fuel’s energy is used to produce
mechanical energy, thus the exhaust temperature was lower.

56
Turb
ine
Effic
ienc
y
2526272829303132333435
810
1214
1618
2022
2426
Pow
er (k
W)
Efficiency %
D10
0R
30R
60R
100
8.8 Efficiency

57
8.8.1 Analysis
On average, the usage of rapeseed oil in the fuel increased the efficiency of the
turbine. It must be remembered that the efficiency in this case is a representation
of proportion of the total energy value of the fuel that is converted to power, by
measuring the amount of energy, present as heat, in the exhaust gas. The
efficiency increased from 29% using D100 to 32% using R100.
The other interesting observation that can be made is that the efficiency tends to
peak and pit at similar power outputs for all fuel types. The efficiency increased
from 8kW to 14kW where there was a peak. Another peak in efficiency was
present at the 20kW mark. At 26kW, the efficiency was climbing for all fuel
mixtures. The power outputs that shared pits include the 16-18kW range and the
22-24kW range.
8.8.2 Discussion
The higher efficiency achieved by using rapeseed oil was not expected. The lower
heating value, the fuel flow rate increases and the emission increases all point to a
lower efficiency. The efficiency was calculated using Siegert constants that
represent the burning characteristics of a fuel and are derived from laboratory
tests. The Siegert values for rapeseed were was unavailable, however the
constants that correspond to light fuel oil were used for all tests. This may have
led to errors in the efficiency calculations that are performed by the VISIT and
these errors may have become increasingly large as more rapeseed oil was used.
The efficiency was relatively good and corresponds to the expected electrical
efficiency of a micro turbine as shown in Chapter 2.3. The claimed efficiency by
most micro turbine manufactures was between 25% and 30%. This was matched
and exceed in these tests. The accuracy of these figures, however, would need to

58
be ascertained by at least determining the correct Siegert values and implementing
them into the VISIT calculation algorithms.
The peaks and pits of the efficiency curves may show the ‘sweet-spots’ for
operation. All machines have running characteristics which allow optimum
operation. These may be dependent on temperature, engine speed, fuel
temperature, ambient temperature and load, along with many other factors. It may
be concluded that at conditions where peaks are evident, the turbine is operating
in one of its so called ‘sweet-spots’. Since a large range of variables could be
accountable for this ‘sweet-spot’, it would be difficult to confidently proclaim
which parameter, or group of parameters, is responsible. Judging by the results,
the fuel type is independent of the efficiency peaks and pits.

59
9.0 Conclusion
The analysis of emissions from a Capstone micro turbine operating on rapeseed
oil has shown that, compared to diesel fuel:
• CO2 emissions increased by approximately 10%
• CO emissions increased by approximately 5 to 18 ppm
• NO emissions increased by as much as 50%
• Fuel to air ratio remained largely unchanged
• Fuel usage increased by up to 33%
• Engine speed showed negligible decreases
• Gas exhaust temperature also showed negligible decreases
• Efficiency increased from 29% to 33%
Although all 3 major emissions increased when running on rapeseed oil, the
absolute value of each is within the recommended limits for turbines of much
greater size and should pose no excessive danger to the environment, ecosystem
and human population.
The purpose of the tests was to gain an understanding of the behaviour of the
turbine when operating on fuel it was not specifically designed to operate on. The
results should not be interpreted as anything other than a baseline from which to
start improvements.
The complex nature of combustion makes it difficult to pinpoint reasons or
explanations for the results attained, however, the following points offer possible
causes.

60
• Increasing fuel drop size as a result of injectors not designed specifically
for rapeseed oil and/or increasing fuel viscosity, leading to increased CO2,
CO and NO emissions
• Inadequate turbulence in the combustion chamber leading to wall-
quenching and increased CO production.
• Worse fuel characteristics, including lower heating values, flame points
and viscosity.
• Incorrect calculation of Siegert values and fuel variables for use in VISIT
and Capstone software.
The results may be improved by addressing these possible causes and
incorporating solutions that may improve them. However, it might prove more
efficient to further investigate each result in isolation to determine specific
reasons and thus make changes which may be more appropriate. Some
suggestions include:
1. Independent tests of the injector to establish fuel drop size for different
fuel mixtures at various pressures and temperatures. This would help in
establishing the influence of injector design on mean drop size and
whether controlling the viscosity of the fuel is sufficient to control the
drop-size.
Alternatively, injectors designed for higher viscosity fuels may be tested
to see the effect on drop size. The results would influence a majority of the
tested parameters.
2. Measuring the combustion chamber temperature to determine temperature
distribution within the chamber would help in concluding the causes for
CO and NO emissions.
3. Alternatively, CO sensors could be mounted along the length of the
exhaust pipe to monitor the change of CO levels, thus indicating whether
diffusion of CO2 to CO is a cause of CO emissions.

61
4. To further establish the cause of NO emissions, NO sensors along the
length of the pipe would indicate whether Prompt NO or Nitrous
Mechanism NO is formed after combustion.
5. Chemical analysis of the fuel is one simple method of determining the
possibility of Fuel NO and confirming the efficiency. The nitrogen content
and Siegert values of rapeseed oil and diesel could be established.
6. Repeating the tests multiple times would confirm that results were
accurate. The R40 test, for example, was highly irregular with NO and CO
levels several times higher than expected.
7. Turbine inspections to determine the effects of rapeseed oil on the life of
the turbine.
Several other factors may be improved to provide better results in future tests.
One factor which is fundamental in these tests is the fuel composition. The fuel
tank was filled by hand using a 1 litre measuring beaker. The addition of 25 litres
of fuel in 1 litre increments proved to be a source of human error. The fuel tank
should be drained after each test and a larger (5L) beaker would have reduced the
errors in measurement. For this reason, the percentage of rapeseed oil in the fuel
is estimated and not to be assume 100% accurate.
Many of the above solutions and improvements are feasible. The deciding factor
for the testing accuracy was in all cases a lack of sufficient funding. The long
term project is being completed in steps and currently the project is in its
beginning days.
The results provide a strong belief that the emissions and fuel efficiency may be
improved to levels that will be lower than diesel fuel. If these improvements can
be realised, the large scale utilization of rapeseed oil in micro turbines has a
strong and successful future. However, even if improvements can not be achieved,
the application of these machines to environmentally protected areas, especially

62
waterways, has a future. The zero possibility of non-biodegradable fluid spill and
low emissions ensure that damage to the ecosystem, even under fault conditions,
is extremely limited.
Rapeseed oil and micro turbines provide a strong combination for low pollution
and high environmentally friendly energy and heat production.

63
10.0 References
1. Analytical Specialties, Electrochemical (Trace Oxygen) - Trace O2
Theory,
http://www.analyzer.com/theory/documents/Oxygen%20Analysis/Electroc
hemical%20(Trace%20Oxygen).aspx, Accessed 14 June 2004.
2. Booklet, 2003, The Guide to the VISIT 02-S, Messtechnik GmbH,
Germany.
3. Capstone Turbines, www.capstoneturbine.com/technology/techdownload,
Accessed 22 May 2004.
4. Casten, Thomas R., Collins, Martin J., 2002, Optimizing Future Heat and
Power Generation, www.primaryenergy.com/articles/reports, Accessed 18
May 2004.
5. Correa, S. M., 1991, Lean Premixed Combustion for Gas Turbines:
Review and Required Research, Fossil Fuel Combustion ASME, Vol. 33.
6. Cummins Northwest, www.cumminsnorthwest.com/powergen, Accessed
22 May 2004.
7. Czernichowski, A., Czernichowski, M., Wesolowska, K., 2003, Glidarc-
Assisted Production of Synthesis Gas from Rapeseed Oil,
www.waterstof.org/20030805EHECP1-66.pdf, Accessed 11 May 2004.
8. Davies, H. M., 1996, Engineering new Oil Seed Crops from Rapeseed,
www.hort.purdue.edu/newcorp/proceedings1996, 31 August 2004.
9. Elliot Micro Turbines, www.elliottmicroturbines.com/files/ta_100_r2.pdf,
Accessed 22 May 2004.
10. Gislason, S., 2004, The Book of Breathing,
www.nutramed.com/environment/monoxide.htm, Accessed 13 September
2004.
11. Ingersoll-Rand Energy Systems,
www.irpowerworks.com/product_mt_70l.htm, Accessed 22 May 2004.

64
12. Jecht, U., Bürssner, R., Flue Gas Analysis in Industry-Practical Guide for
Emission and Process Measurements, Testo AG, Germany.
13. Journey to Forever, Oil Yields and Characteristics,
http://journeytoforever.org/biodiesel_yield2.html, Accessed 5 May 2004.
14. Lefebvre, Arthur H., 1999, Gas Turbine Combustion, Second Edition,
Taylor and Francis, London.
15. Merryman, E. L., Levy, A., 1975, Nitric Oxide Formation in Flames: Role
of NO2 and Fuel Nitrogen, pp. 1073-1083, Fifteenth Symposium on
Combustion, The Combustion Institute, Pittsburgh.
16. Nicol, D., Malte, P. C., Lai, J., Marinov, N. N., Pratt, D. T., 1992, NOx
Sensitivities for Gas Turbine Engines Operated on Lean Premixed
Combustion and Conventional Diffusion Flames, ASME Paper 92-GT-
115.
17. Personal Conversation with Prof. Dielmann, Lecturer at Fachhochschule
Aachen, 22 September 2004.
18. Prevention of CO Poisoning from Petrol and Gas Powered Equipment,
www.safetyline.wa.gov.au/pagebin/guidwswa0069.pdf, Accessed 13
September 2004.
19. Przybylski, R., 2000, Canola Oil Physical and Chemical Properties,
www.canola-council.org/pubs.Chemical1-6.pdf, Accessed 5 May 2004.
20. RAE Systems, Theory and Operation of NDIR Sensors,
www.raesystems.com/~raedocs/App_Tech_Notes/Tech_Notes/TN-
169_NDIR_CO2 _Theory. PDF, Accessed 14 June 2004.
21. Rauber, M., 2004, Practical course of the lesson Energy Technology,
Technische Universität München.
22. Rink, K. K., Lefebvre, A. H., 1989, Influence on Fuel Drop Size and
Combustor Operating Conditions on Pollutant Emissions, International
Journal of Turbo and Jet Engines, Vol. 6 pp. 113-122.

65
23. Rink, K. K., Lefebvre, A. H., 1989, The Influence of Fuel Composition
and Spray Characteristics on Nitric Oxide Formation, Combustion
Science and Technology, Vol. 68. pp. 1-14.
24. Snyder, T. S., Rosfjord, T. J., McVey, J. B., Chiappetta, L. M., 1994,
Comparison of Liquid Fuel/Air Mixing and NOx Emissions for a
Tangential Entry Nozzle, ASME 94-GT-283.
25. TDI Club, Recommended Guideline on Diesel Fuel,
www.tdiclub.com/articles/Diesel_Fuel_Guidelines, Accessed 7 June 2004.
26. TSI Incorporated, The Theory behind Electrochemical Sensors,
http://www.tsi.com/combustion/app_note/ti-132.htm, Accessed 14 June
2004.
27. Turbec, www.turbec.com/products/t100chp.htm, Accessed 22 May 2004.
28. Umwelt-Online, Regelungen im Immissionsschutz, www.umwelt-
online.de/recht/luft/ueber_lu.htm, Accessed 7 July 2004.

66
Appendix A
Carbon Dioxide Calculations using the Combustion Chemical Equation
The basic chemical equation that predicts the combustion of hydrocarbons in air is
shown below.
( ) 22222yx N76.34yxOH
2y xCO N76.3O
4yxHC
×
+++→+
++
Applying this to Diesel fuel (C14.5H29) gives,
( ) 222222914.5 N78.81O14.5H 14.5CO N76.3O75.21HC ++→++
CO2 = 14.5 mol
H2O = 14.5 mol
N2 = 81.78 mol
Total Products = 110.78 mol
Molar Mass of CO2 = 44.01 g/mol
Molar Mass of H2O = 18.02 g/mol
Molar Mass of N2 = 28.02 g/mol
Total Mass of Products = 14.5x44.01 + 14.5x18.02 + 81.78 x 28.02 = 3190.2 g
Percentage of CO2:
By Mass = %0.20%1002.3190
01.445.14=×
×
By Volume = %1.13%10078.1105.14
=×

67
This is true for all combustion where all the available oxygen is consumed in
combustion. In reality this is rarely the case and introducing lambda (λ) into the
equation compensates for the presence of this excess air.
( )( )
2222
222914.5
O 2
35.14275.21 N 78.81 OH 14.5 CO 14.5
N76.3O 75.21 HC×−×
+++
→++λλ
λ
Using λ = 8;
CO2 = 14.5 mol
H2O = 14.5 mol
N2 = 654.24 mol
O2 = 152.25 mol
Total Products = 835.49 mol
Molar Mass of CO2 = 44.01 g/mol
Molar Mass of H2O = 18.02 g/mol
Molar Mass of N2 = 28.02 g/mol
Molar Mass of O2 = 32.00 g/mol
Total Mass of Products =
g24.2410325.15200.3224.65402.285.1402.185.1401.44 =×+×+×+×
Percentage of CO2:
By Mass = %65.2%10024.2410301.445.14
=××
By Volume = %74.1%10049.8355.14
=×
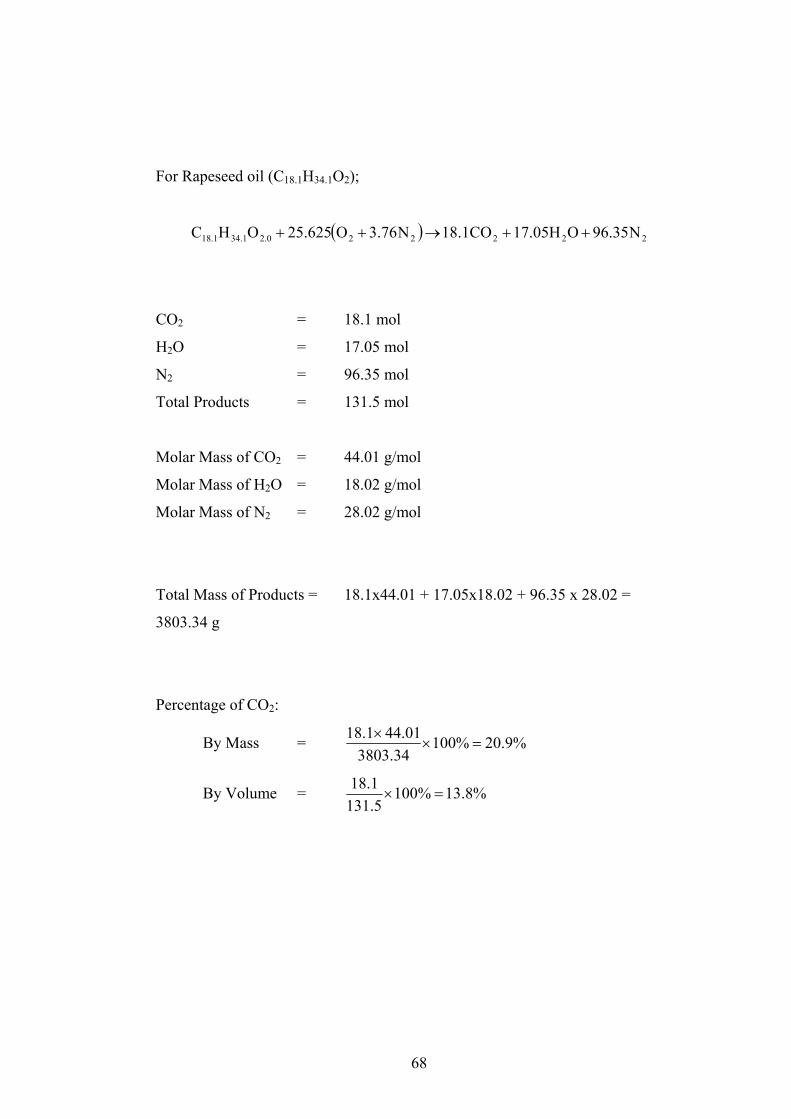
68
For Rapeseed oil (C18.1H34.1O2);
( ) 222222.034.118.1 N35.96O17.05H 18.1CO N76.3O625.25OHC ++→++
CO2 = 18.1 mol
H2O = 17.05 mol
N2 = 96.35 mol
Total Products = 131.5 mol
Molar Mass of CO2 = 44.01 g/mol
Molar Mass of H2O = 18.02 g/mol
Molar Mass of N2 = 28.02 g/mol
Total Mass of Products = 18.1x44.01 + 17.05x18.02 + 96.35 x 28.02 =
3803.34 g
Percentage of CO2:
By Mass = %9.20%10034.3803
01.441.18=×
×
By Volume = %8.13%1005.1311.18
=×

69
Introducing lambda (λ) into the equation to compensate for the presence of excess
air.
( )( ) ( )
2222
222.034.118.1
O2
05.1721.182225.625 N 6.359 OH 17.05 CO 18.1
N76.3O 625.25 OHC+×−+×
+++
→++λλ
λ
Using λ = 8;
CO2 = 18.1 mol
H2O = 17.05 mol
N2 = 770.8 mol
O2 = 179.38 mol
Total Products = 985.33 mol
Molar Mass of CO2 = 44.01 g/mol
Molar Mass of H2O = 18.02 g/mol
Molar Mass of N2 = 28.02 g/mol
Molar Mass of O2 = 32.00 g/mol
Total Mass of Products =
g59.2844138.17900.3280.77002.2805.1702.181.1801.44 =×+×+×+×
Percentage of CO2
By Mass = %80.2%10059.2844101.441.18
=××
By Volume = %84.1%10033.9851.18
=×

70
Appendix B
B.1 Efficiency
The following is the equation that is used to arrive at the efficiency. See B.3 for
further details.
( )
( )
+
−×−−=
−=
BO
AATFTEta
qALossesEta
2212100
100
B.2 Lambda
Lambda represents the ratio of fuel to air in a form that makes it understandable.
Simply claiming that the air to fuel ratio is, for example, 10 does not clarify
whether the combustion is lean, rich or stoichiometric. Lambda compares the
actual ratio to the stoichiometric ratio and expresses it as a number.
λφ 1
===AFAF
FAFA S
S
Where FA is the Fuel to Air ratio, FAS is the stoichiometric fuel air ratio, AF is
the air to fuel ratio, AFS is the stoichiometric air to fuel ratio and φ is the
equivalence ratio. The equivalence ratio is the inverse of lambda and is favoured
among the American culture.

71
B.3 Losses
The energy loss is based on the difference in heat capacity between the inlet air
and exhaust air which is compared to the heat value of the fuel using the Siegert
values and the oxygen volumetric concentration. This is used to express the
percentage of energy that is used to drive the turbine, based on the notion that all
the energy of a fuel is converted into exhaust heat and mechanical movement
(including friction etc).The equation is as follows.
( ) ( )
+
−×−= B
OAATFTqALosses
2212
Where FT is exhaust gas temperature, AT is ambient temperature, O2 is the
concentration of Oxygen in the exhaust gas and A2 and B are the Siegert Values.

72
Appendix C
Figure C.1 below shows the parameters recorded by the Capstone software and
VISIT data software.
Figure C.1 – The raw data from the VISIT and Capstone software.
The spreadsheet as shown in Figure C.2 was used to record data that was not
saved using software programs. This included all the data from the Promass Fluid
meter. The fuel flow rates, viscosity, density and temperature were recorded.
Power Mass Flow Volume Flow Dynamic Viscosity Kinematic Viscosity Density Temperature
8101214etc
Figure C.2 – Data collection spreadsheet.
T (s
ec)
T-Ai
r °C
T-Ga
s °C
O2 %
CO2
%
Loss
%
Eta
%
Lam
bda
NOxc
al m
g/m
3
P2 h
Pa
CO p
pm
CO m
g/m
3
NO p
pm
NO m
g/m
3
NO2
ppm
NO2
mg/
m3
NOx
ppm
NOx
mg/
m3
SO2
ppm
SO2
mg/
m3
CO2
ppm
Engin
e Sp
eed
(rpm
)
Turb
ine E
xit T
emp
(°C)
Com
pres
sor I
n Te
mp
(°C)
Powe
r Dem
and
(W)
Outp
ut P
ower
(W)
32 22.9 25.6 20.9 0 0 100 0 0 0 0 0 0 0 0 0 0 0 0 0 400 25086 36 23.9 8000 -168134 22.9 26.3 20.9 0 0 100 0 0 0 0 0 0 0 0 0 0 0 0 0 400 25116 41 23.8 8000 -153836 22.9 26.9 19.9 0.7 2.7 97.3 21.77 0 0 6 8 0 0 0 0 0 0 8 23 500 25830 96 23.8 8000 -132438 22.9 27.5 16.1 3.6 0.7 99.3 4.32 0 0 101 126 0 0 0 0 0 0 30 86 600 29962 288 23.8 8000 -110440 22.9 28.2 13.8 5.2 0.5 99.5 2.95 2 0 318 397 0 0 1 2 1 1 97 277 1700 33844 454 23.8 8000 -62142 22.9 29.2 12.2 6.4 0.5 99.5 2.39 6 0 876 1094 0 0 3 6 3 4 185 529 5200 37872 546 23.7 8000 -13744 22.9 30.7 11.2 7 0.6 99.4 2.15 10 0 1717 2145 0 0 5 10 5 7 274 783 11200 41816 639 23.7 8000 47246 22.9 33 10.9 7.2 0.8 99.2 2.1 19 0 2785 3479 2 3 7 14 9 12 318 909 18600 45244 692 23.5 8000 129148 22.9 35.4 12.3 6.1 1.1 98.9 2.43 21 0 3706 4629 2 3 8 16 10 14 318 909 25200 45244 692 23.5 8000 245550 22.9 37.2 12.8 5.8 1.3 98.7 2.59 25 0 4412 5511 3 4 9 19 12 17 295 843 32200 47284 670 23.5 8000 197252 22.9 38.1 13.4 5.2 1.5 98.5 2.8 25 0 4795 5989 3 4 9 19 12 17 259 741 38800 49502 653 23.5 8000 276354 22.9 38.6 13.6 5 1.6 98.4 2.88 27 0 4910 6133 4 5 9 19 13 18 220 629 44800 51446 647 23.4 8000 346156 22.9 39.1 13.7 5 1.6 98.4 2.91 29 0 4718 5893 4 5 10 21 14 19 179 512 48400 53018 647 23.3 8000 409858 22.9 39.6 13.8 5 1.7 98.3 2.96 29 0 4300 5371 4 5 10 21 14 19 144 412 50200 54300 647 23.3 8000 465360 22.9 40.1 14 4.9 1.8 98.2 3.02 33 0 3840 4796 5 7 11 23 16 22 118 337 51100 55604 650 23.2 8000 5164
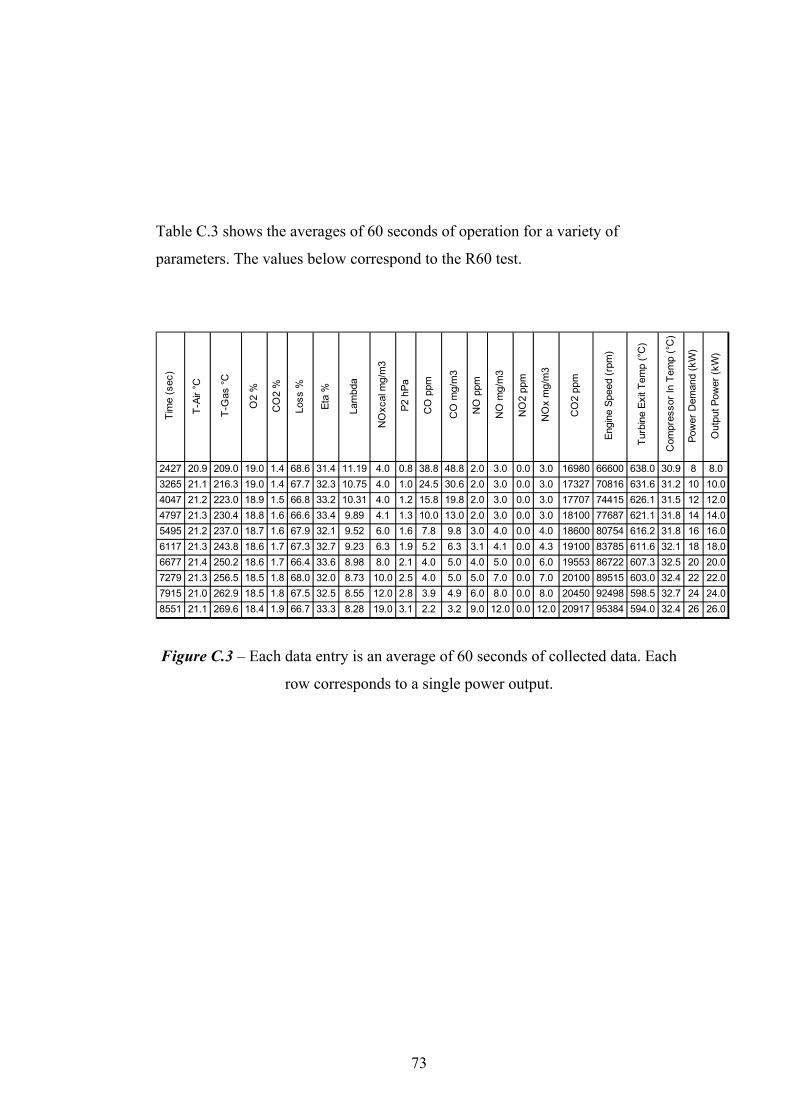
73
Table C.3 shows the averages of 60 seconds of operation for a variety of
parameters. The values below correspond to the R60 test.
Tim
e (s
ec)
T-Ai
r °C
T-G
as °C
O2
%
CO
2 %
Loss
%
Eta
%
Lam
bda
NO
xcal
mg/
m3
P2 h
Pa
CO
ppm
CO
mg/
m3
NO
ppm
NO
mg/
m3
NO
2 pp
m
NO
x m
g/m
3
CO
2 pp
m
Engi
ne S
peed
(rpm
)
Turb
ine
Exit
Tem
p (°
C)
Com
pres
sor I
n Te
mp
(°C
)
Pow
er D
eman
d (k
W)
Out
put P
ower
(kW
)
2427 20.9 209.0 19.0 1.4 68.6 31.4 11.19 4.0 0.8 38.8 48.8 2.0 3.0 0.0 3.0 16980 66600 638.0 30.9 8 8.03265 21.1 216.3 19.0 1.4 67.7 32.3 10.75 4.0 1.0 24.5 30.6 2.0 3.0 0.0 3.0 17327 70816 631.6 31.2 10 10.04047 21.2 223.0 18.9 1.5 66.8 33.2 10.31 4.0 1.2 15.8 19.8 2.0 3.0 0.0 3.0 17707 74415 626.1 31.5 12 12.04797 21.3 230.4 18.8 1.6 66.6 33.4 9.89 4.1 1.3 10.0 13.0 2.0 3.0 0.0 3.0 18100 77687 621.1 31.8 14 14.05495 21.2 237.0 18.7 1.6 67.9 32.1 9.52 6.0 1.6 7.8 9.8 3.0 4.0 0.0 4.0 18600 80754 616.2 31.8 16 16.06117 21.3 243.8 18.6 1.7 67.3 32.7 9.23 6.3 1.9 5.2 6.3 3.1 4.1 0.0 4.3 19100 83785 611.6 32.1 18 18.06677 21.4 250.2 18.6 1.7 66.4 33.6 8.98 8.0 2.1 4.0 5.0 4.0 5.0 0.0 6.0 19553 86722 607.3 32.5 20 20.07279 21.3 256.5 18.5 1.8 68.0 32.0 8.73 10.0 2.5 4.0 5.0 5.0 7.0 0.0 7.0 20100 89515 603.0 32.4 22 22.07915 21.0 262.9 18.5 1.8 67.5 32.5 8.55 12.0 2.8 3.9 4.9 6.0 8.0 0.0 8.0 20450 92498 598.5 32.7 24 24.08551 21.1 269.6 18.4 1.9 66.7 33.3 8.28 19.0 3.1 2.2 3.2 9.0 12.0 0.0 12.0 20917 95384 594.0 32.4 26 26.0
Figure C.3 – Each data entry is an average of 60 seconds of collected data. Each
row corresponds to a single power output.

74
Car
bon
Mon
oxid
e Em
issi
ons
05101520253035404550
810
1214
1618
2022
2426
Pow
er (k
W)
CO ppm
D10
0R
10
R20
R30
R40
R50
R60
R70
R80
R90
R10
0
Appendix D
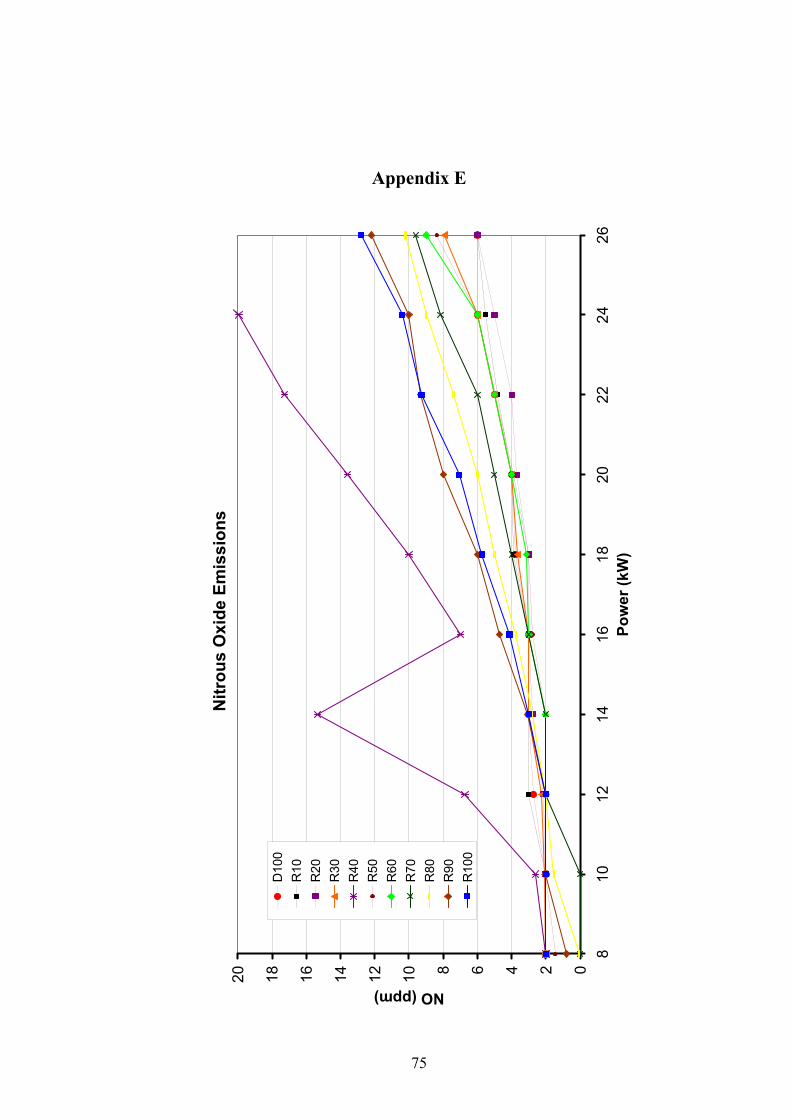
75
Nitr
ous
Oxi
de E
mis
sion
s
02468101214161820
810
1214
1618
2022
2426
Pow
er (k
W)
NO (ppm)
D10
0R
10R
20R
30R
40R
50R
60R
70R
80R
90R
100
Appendix E