Exhaled Nitric Oxide in Extreme Environments
52
Thesis for doctoral degree (Ph.D.) 2009 Exhaled Nitric Oxide in Extreme Environments Tryggve Hemmingsson Thesis for doctoral degree (Ph.D.) 2009 Tryggve Hemmingsson Exhaled Nitric Oxide in Extreme Environments
Transcript of Exhaled Nitric Oxide in Extreme Environments
Thesis for doctoral degree (Ph.D.)2009
Exhaled Nitric Oxide in Extreme Environments
Tryggve Hemmingsson
Thesis for doctoral degree (Ph.D.) 2009
Tryggve Hem
mingsson
Exhaled Nitric O
xide in Extreme Environm
ents
From the Department of Physiology and Pharmacology Section of Environmental Physiology
Karolinska Institutet, Stockholm, Sweden
Exhaled Nitric Oxide in
Extreme Environments
Tryggve Hemmingsson
Stockholm 2009

ii
Cover illustration - Airway tree and NO molecules - modified from High Resolution CT simulation of airway tree, Dr A. Kriete, Drexel University, Philadelphia PA, USA All previously published papers were reproduced with permission from the publisher Published by Karolinska Institutet. Printed by Larserics Digital Print AB, Sweden © Tryggve Hemmingsson, 2009 ISBN 978-91-7409-609-5

iii
To my family

iv
“The beginning is the most important part of the work” (Plato 427 - 347 B.C.)

ABSTRACT
Exhaled nitric oxide (NO) is a useful marker for lower airway inflammation. Since NO was found to be a component of an exhaled breath in the early 1990́s, the Fractional Exhaled Nitric Oxide (FENO 50) measurement is now well accepted among clinicians as a complementary test in the management of asthma. It is also used to some extent as a marker for other airway diseases, e.g. to map inflammation in the peripheral parts of the airway tree. The first study in this thesis reports the development of a novel hand-held and highly portable instrument for exhaled NO measurement. It is principally intended for clinical use, but also potentially suitable for use in extreme environments, such as high altitude and spaceflight. A second study investigated the effects of microgravity on exhaled NO and was based on results from cosmonauts and astronauts stationed on the International Space Station (ISS). It was concluded that the 45 % decrease in exhaled NO levels found in microgravity might be due to an increased backdiffusion of NO in the peripheral airways. The underlying mechanism leading to this increase is likely more homogenous distributions of the lung parenchyma and pulmonary-capillary blood. This would provide a more optimised airway caliber/length ratio which in turn would facilitate the gas diffusion from conducting airways to the alveoli. At the same time, the uptake of NO to the blood is likely to be enhanced due to an increased contact area between alveolar gas and pulmonary-capillary blood in microgravity. In the third study, two instruments designed to measure exhaled NO were investigated at altitude. Because of decreased gas density and increased gas diffusivity at altitude, they behaved differently with regard to flow control and detector sensitivity. The readings at, for example an altitude of 4000 m, became 60 % too high in one of the instruments. Procedures were recommended for correction of the instrument output, so that it becomes comparable to sea level use. It is also recommended that exhaled NO measurements are quantified as partial pressure of NO (PENO), which would make comparison of readings over a range of altitudes more simple. In the final study reported in this thesis, exhaled NO was studied in healthy humans at altitude. Measurements were performed at different levels of hypoxia down to an inspired PO2 of 10.7 kPa at simulated high altitude in a hypobaric chamber and were compared to similar levels of hypoxia at sea level. After corrections for the above instrument deviations, the exhaled NO levels at altitude were decreased with up to 33 % at 5000 m. The lowering of PENO could be related to the lower density and the higher binary diffusivity for NO in air at altitude. It is therefore proposed that the decrease was due to an increased backdiffusion of NO with increased uptake in pulmonary-capillary blood. The overall conclusion of the thesis is that changes in the physical environment (gravity, pressure) have profound effects on the measurements of exhaled NO. Keywords: exhaled nitric oxide, hand-held instrument, electrochemical detector, microgravity, International Space Station, high altitude, hypobaric hypoxia, normobaric hypoxia, backdiffusion.

2
LIST OF PUBLICATIONS The thesis is based on the following papers, which will be referred to in the text by their Roman numerals:
I. Hemmingsson T, Linnarsson D, Gambert R.
Novel hand-held device for exhaled nitric oxide-analysis in research
and clinical applications.
J Clin Monit Comput. 2004 Dec;18(5-6):379-387, Erratum in J Clin Monit
Comput. 2005 Dec;19(6):463-464.
II. Karlsson LL, Kerckx Y, Gustafsson LE, Hemmingsson TE, Linnarsson D.
Microgravity decreases and hypergravity increases exhaled nitric oxide.
J Appl Physiol. 2009 Nov;107(5):1431-1437.
III. Hemmingsson T, Horn A, Linnarsson D.
Measuring exhaled nitric oxide at high altitude.
Respir Physiol Neurobiol. 2009 Jul 31;167(3):292-298.
IV. Hemmingsson T, Linnarsson D.
Lower exhaled nitric oxide in hypobaric than in normobaric acute
hypoxia.
Respir Physiol Neurobiol. 2009 Oct 31;169(1):74-77.
All articles are reproduced by kind permission of the publishers.

3
CONTENTS
1 Abbreviations and definitions...................................................................... 4 2 Introduction .................................................................................................. 6
2.1 Nitric oxide synthesis and biological activity.................................... 6 2.2 NO in the airways............................................................................... 7 2.3 Requirements for a portable NO analyser ....................................... 12 2.4 Requirements for NO analysis at altitude........................................ 14 2.5 Effects of high altitude on exhaled NO ........................................... 14
3 Aims of the thesis....................................................................................... 15 4 Materials and methods ...............................................................................16
4.1 Study subjects ................................................................................... 16 4.2 Measurements and procedures......................................................... 16 4.3 Statistical analysis ............................................................................ 20
5 Results and Comments............................................................................... 21 5.1 Instrument design (Paper I) .............................................................. 21 5.2 Effects of gravity on exhaled NO (Paper II).................................... 26 5.3 Analyser performance at altitude (Paper III) ................................... 29 5.4 Acute effects of altitude on exhaled NO (Paper IV) ....................... 31
6 General discussion and perspectives ......................................................... 32 6.1 NO analysis technology ................................................................... 32 6.2 Exhaled NO and space flight............................................................ 33 6.3 Instrument performance at high altitude.......................................... 36 6.4 Exhaled NO at high altitude............................................................. 37
7 Conclusions ................................................................................................ 39 8 Acknowledgements....................................................................................40 9 References .................................................................................................. 42

4
1 ABBREVIATIONS AND DEFINITIONS
AC
Ambient pressure
ATP
ATS
Bpm
BTPS
CANO
CE
CO
CO2
cNOS
DC
DgNO
DLCO
DLNO
DmCO
DmNO
eNOS
ERS
ESA
EVA
FENO
FENO 0.05
FENO 50
FEV1
FVC
g
G
Alternating Current
Barometric pressure (or atmospheric pressure), i.e. the amount of
pressure exerted on a body by the sorrounding medium (normal
barometric pressure is 1013.25 hPa = 760 mm Hg (Torr) = 1 ATA
Ambient Temperature and Pressure
American Thoracic Society
Beats per minute
Body Temperature Pressure Saturated
Steady-state alveolar concentration of NO at an infinitely high
exhalation flow (ppb)
Counter Electrode
Carbon monoxide
Carbon dioxide
constitutive Nitric Oxide Synthase
Direct Current
Gas phase diffusing capacity for nitric oxide (ml·min−1·mm Hg-1)
Diffusing capacity of the lung for carbon monoxide (ml·min−1·mm Hg-1)
Diffusing capacity of the lung for nitric oxide (ml·min−1·mm Hg-1)
Membrane diffusing capacity for carbon monoxide (ml·min−1·mm Hg-1)
Membrane diffusing capacity of nitric oxide (ml·min−1·mm Hg-1)
endothelial Nitric Oxide Synthase
European Respiratory Society
European Space Agency
Extravehicular Activity (space walk)
Fractional Exhaled Nitric Oxide (ppb)
FENO measured at the standardised exhalation flow 50 ml·s-1 (ppb)
FENO measured at the standardised exhalation flow 50 ml·s-1 (ppb)
Forced Expiratory Volume in one second (l)
Forced Vital Capacity (l)
Gravitational constant or acceleration due to gravity (9.81 m·(s2)-1
Gravitoinertial force or the unit of the ratio of an applied acceleration to
the gravitational constant

5
Hypergravity
IBMP RAS
iNOS
ISS
JawNO
LDL
Microgravity
nA
nNOS
NO
NOS
NO2
NTP
PEEP
PEF
PECO2
PENO
PIO2
PO2
ppb
ppbv
ppm
PTM
RE
SD
TLC
V
VC
WE
Conditions where the gravitoinertial force is greater than that on the
surface of the Earth (greater than 1 G)
Institute for Biomedical Problems at the Russian Academy of Sciences
inducible Nitric Oxide Synthase
International Space Station
Rate at which NO is added to the exhaled gas as it passes through the
conducting airways (pl·s-1)
Lowest Detection Limit
Conditions where the gravitoinertial force is practically absent/less than
10-2 G
nanoAmpere
neuronal Nitric Oxide Synthase
Nitric Oxide (nitrogen monoxide)
Nitric Oxide Synthase
Nitrogen dioxide
Normal Temperature and Pressure (+20° C, 1013.25 hPa)
Positive End-Expiratory Pressure
Peak Expiratory Flow
Partial pressure of Exhaled carbon dioxide (kPa)
Partial pressure of Exhaled nitric oxide (mPa)
Partial pressure of Inhaled oxygen (kPa)
Partial pressure of oxygen (kPa)
parts per billion
parts per billion, volume fraction
parts per million
Pneumotachometer
Reference Electrode
Standard Deviation
Total Lung Capacity (l)
Volt
Vital Capacity (l)
Working Electrode
6
2 INTRODUCTION
2.1 Nitric oxide synthesis and biological activity
Nitric oxide (NO), also known as nitrogen monoxide, is a simple chemical molecule that has gained much interest among medical researchers in recent years due to its involvement in complex life processes. It is a member of the nitrogen oxides (NOx), all of which contain nitrogen and oxygen in varying amounts. For a long time it has been known to be an unstable gas formed during discharges in the atmosphere. NO is emitted from power generation plants and released in the exhaust of combustion engines of cars and trucks, where it plays a major role in the formation of photochemical smog. One of the main reasons that a large number of medical research studies involving NO were initiated in the past decade, was the presentation of the Nobel Prize to Robert F. Furchgott, Louis J. Ignarro and Ferid Murad in 1998 for their “discoveries concerning nitric oxide as a signalling molecule in the cardiovascular system”. NO had come to prominence somewhat earlier for these researchers. Endothelium-derived relaxing factor (EDRF) was first described in 1980 (Furchgott and Zawadzki, 1980), but its chemical structure was only identified in 1987 as nitric oxide (NO) by three independent research groups (Ignarro et al., 1987; Khan and Furchgott, 1987; Palmer et al., 1988). It was in 1992 that the Journal ‘Science’ heralded NO as “molecule of the year”. Some years previously the researcher Ignarro set out to identify the agent that acted to dilate blood vessels, which had been discovered and named EDRF by Furchgott. At that time, NO was primarily known as an air pollutant, but at a meeting of biomedical scientists in 1986, Ignarro officially proposed his theory that EDRF was NO. Furchgott, who independently had pursued the same theory, presented an equal proposal at the meeting. Subsequent research also supported their conclusions. Murad, the final member of the Nobel Prize winning team, had previously shown in his research on glyceryl trinitrate (nitroglycerin) and related vasodilators, that NO has a relaxing effect on vascular smooth muscle (Arnold et al., 1977). Thus, nitroglycerin has the effect of dilating blood vessels and is therefore prescribed today as a drug to prevent and relieve the pain symptoms from angina pectoris. Its beneficial effect was first discovered by Lauder Brunton in 1867 (Brunton, 1867), though the mechanism behind its benefits was obviously unknown. Somewhat ironically, Alfred Nobel, the inventor of the nitroglycerin-containing dynamite, was to be prescribed nitroglycerin for heart problems. He suffered from intense angina paroxysms towards the end of his life. During a visit to Paris in 1896, he wrote in a letter to his laboratory engineer and assistant Ragnar Sohlman (who played an important role in the execution of the will of Alfred Nobel and who also was instrumental in establishing the Nobel Foundation and organizing its cooperation with the prize-awarding institutions), that: “My heart trouble will keep me here in Paris for another few days at least, until my doctors are in complete agreement about my immediate treatment. Isn't it the irony of fate that I have been prescribed N/G 1, to be taken internally! They call it Trinitrin, so as not to scare the chemist and the public.” It is not known if he ever followed the advice of his doctors …

7
The investigations of the three Nobel Laureates paved the road to further findings related to numerous physiological and pathological properties of NO in living organisms. In humans, among other processes, it has been found to be involved in blood pressure regulation, neurotransmission, immune defense mechanisms and airway inflammation (Moncada and Higgs, 1993; Vallance and Leiper, 2002). The highly reactive nature of this free radical gas in biological tissue renders it to be scavenged by haem in haemoglobin and carried away from sites of activity via the blood circulation (Hyde et al., 1997; Silkoff et al., 1997; Dweik et al., 1998).
2.1.1 Human NO synthesis
Endogenous NO synthesis in the human body, where NO is synthesised from the amino acid L-Arginine and oxygen (Stuehr, 1999), is regulated by three NO synthase (NOS) isoenzymes; two constitutive NO synthases and a third inducible NO synthase:
• Constitutive (cNOS): • neuronal nNOS / type 1 NOS • endothelial eNOS / type 3 NOS (both are strictly Ca2+-regulated)
• Inducible: iNOS / type 2 NOS – upregulated by e.g. cytokine and endotoxine exposure Co-substrates for the NO synthesis are L-arginine, oxygen (O2) and nicotinamide adenine dinucleotide phosphate (NADPH), which forms NO via the co-factors flavin mononucleotide (FMN), flavin adenine dinucleotide (FAD), tetrahydrobiopterin (BH4) and haem (iron protoporphyrin IX). The co-products from the synthesis are NO and citrulline (Alderton et al., 2001; Vallance and Leiper, 2002).
Figure 1. Endogenous synthesis of nitric oxide. 2.2 NO in the airways
Endogenous NO was initially found in exhaled air from animals and humans in 1991 (Gustafsson et al., 1991). A few years later exhaled NO levels were found to be elevated in

8
asthmatics (Alving et al., 1993; Persson et al., 1994). Airway NO is formed in both the upper and the lower respiratory tract (Kobzik et al., 1993; Schedin et al., 1995; Kharitonov et al., 1996; Lundberg, 1996; Tsujino et al., 1996; Silkoff et al., 1998). In the upper airways, iNOS is particularly expressed in the nasal cavity mucosa and in the paranasal sinuses (Lundberg et al., 1995). In the lower airways, i.e. in the lungs, NO arises from production both within the conducting airways and in the alveolar part (Tsoukias et al., 1998; Tsoukias and George, 1998; Pietropaoli et al., 1999). NO production is generated by expression of iNOS, primarily in the epithelial cells (Robbins et al., 1994; Lane et al., 2004), where there is a continuous low expression of iNOS in the normal lower airway epithelium (Guo et al., 1995). The production is increased upon induction in the epithelial cells (Asano et al., 1994; Hamid et al., 1993), predominantly by proinflammatory cytokines (Robbins et al., 1994) or bacterial endotoxines (Guo et al., 1995). NO enters the airway lumen by gas diffusion via a concentration gradient, thereby conditioning the exhaled air with NO (Byrnes et al., 1997a, 1997b; St. Croix et al., 1999). All three forms of NOS are present in the airways (Ricciardolo et al., 2004), but only the expression of iNOS correlates to exhaled NO levels (Lane et al., 2004). As the gas phase concentration levels of exhaled NO in healthy humans is as low as in the 5 - 35 parts per billion (ppbv) (volume fraction) range, early measurements were limited to a purely qualitative analysis. Potential anatomical sites in the human body where gas phase NO samples might be collected and analysed, are hollow organs like the airways, the intestines and the urinary tract, but up until now, the airways have been by far the major site of interest. The early discoveries at Karolinska Instituet (Gustafsson et al., 1991; Alving et al., 1993; Persson et al., 1994) changed the diagnostic and therapeutic direction of asthma management. Today, it is established that exhaled NO measurements can be used as a complementary tool to monitor the degree of airway inflammation and the effect of pharmacological treatment, since exhaled NO concentrations drop towards normal during inhaled steroid treatment (Barnes and Kharitonov, 1996). It has been shown by several research groups that in asthmatics (Massaro et al., 1995; Baraldi et al., 1997; Saleh et al., 1998; Silkoff et al., 2001; Kharitonov et al., 2002) inhaled corticosteroids produce a marked reduction on exhaled NO in a dose-dependent way. As NO is a free radical with an unpaired electron, it is an unstable molecule. It has a short half-life of 0.1 to a few seconds in most biological systems, whereas inside erythrocytes it is consumed within 2 ms (Liu et al., 1998; Thomas et al., 2001). This property also makes the direct measurement of the existence and activity of NO difficult. This might be why in the past NO was sometimes quantified by an indirect determination of L-citrulline, a metabolite produced when NO is formed from L-arginine (Figure 1).
2.2.1 Measurement method and normal levels
The single breath technique, or more specifically the Fractional Exhaled Nitric Oxide (FENO) method, which requires a constant expiratory flow of 50 ml·s-1 and is reported in volume fraction units (ppb), is the recommended method to measure exhaled NO concentrations originating from the central part of the lower airways in humans (ATS/ERS, 2005). There is a broad concensus among researchers and clinicians today that this is an easy to perform, non-invasive and highly reproducible surrogate marker method to measure eosinophilic airway inflammation. A few years ago, recommendations for the interpretation of FENO values was published (Taylor et al., 2006). This guide was designed to be used as a
9
clinical tool primarily for asthma management, aiding in the diagnosis and monitoring of the therapeutic effect of anti-inflammatory medication. It was based on publications from a multitude of studies investigating exhaled NO levels in asthmatics made during the last decade or so. A normal NO concentration in healthy humans is in the range 10 - 35 ppb in adults and a little lower, at around 5 - 25 ppb, in children (Taylor et al., 2006; Olin et al., 2007). In asthma patients, who are not correctly treated with anti-inflammatory medication or in steroid-naïve asthmatics, the exhaled NO value commonly reaches 70 - 100 ppb, and sometimes well above that.
2.2.2 Multiple-flow models
The FENO test is taken at the level of mouth, though the aim of the test is to map the NO turnover of the entire airway tree. Therefore, to further understand the endogenous NO exchange and the strong interdependence between the exhalation flow and the NO concentration in different parts of the lower airways, a simplifying model is required (Hyde et al., 1997). Mapping is usually based on the classical Weibel model that is built around theoretical dicotomous branching of the airways (Weibel, 1963), with 23 airway generations from the trachea to the alveoli. Commonly, a two-compartment model with a rigid tube, resembling the conducting airway compartment (airway generation 1 - 16) and an alveolar compartment (airway generations 17 - 23) is used (Tsoukias and George, 1998; Pietropaoli et al. 1999; Jörres, 2000; Silkoff et al., 2000). By performing exhaled NO measurements in healthy subjects at several expiratory flows and plotting the measured NO concentration against 1/flow, a resulting linear regression line with high correlation is achieved. The slope of the line corresponds to the NO flux added to the gas stream by the conducting airways (JawNO) and the intercept with the y-axis is the extrapolated alveolar NO concentration (CANO), at an infinitely high exhalation flow (Tsoukias et al., 1998; Pietropaoli et al., 1999; Lehtimäki et al., 2001; George et al., 2004; van Veen et al., 2006). JawNO is in turn related to the cellular NO production rate and the diffusing capacity of NO in the conducting airway walls, i.e. the ability for NO to pass from the production site within the airway wall to the airway lumen. The intercept estimation is necessary as it is not practically achievable to perform the exhalation at an infinitely high flow to define the actual alveolar concentration. The advantage of using such models is the potential to differentiate between central airway diseases like asthma and mixed asthma and chronic obstructive pulmonary disease (COPD) pathology (Papi et al., 2000; Kharitonov and Barnes, 2006), from more peripherally related airway inflammations such as in isolated COPD without an asthma component (Brindicci et al., 2005), allergic alveolitis (Lehtimäki et al., 2001) and scleroderma lung disease (Girgis et al., 2002). The modelling approach also lends itself to the use of a range of exhalation rates, reasonably between 10 and 500 ml·s-1, instead of being restricted to pre-defined flows. In addition it aids in the selection of instrumentation and development of methodologies for such hitherto non-standardised applications.
2.2.3 Retrograde transport of NO in the peripheral airways
To further develop the algorithms for these measurements, a refined airway model, the Trumpet model, was more recently elaborated (Shin and George, 2002; Condorelli et al., 2007). Here, the model has a trumpet shape, where the epithelial cell surface has an increasing area per unit

10
volume in the peripheral direction of the airway tree. This model emphasizes the fact that there is a progressively decreasing axial gas velocity towards the periphery for a given airflow at the level of the mouth. It also adds the possibility of estimating the axial backdiffusion of NO. Backdiffusion denotes flow in the retrograde direction during exhalation, from more proximal airway generations to the transitional and respiratory zones of the airway tree (generations 17 - 23), where the NO molecules are effectively scavenged into the pulmonary capillary blood. This scavenging is due to the very high affinity of NO to haemoglobin, which serves as an infinite sink for NO (Rimar et al., 1993; van der Lee., 2007). It is thought that the NO taken up by the blood emanates from two anatomicaly distinct sources of the airways, namely the alveolar tissues and the conducting airways, where the latter is reaching the alveolar compartment by backdiffusion (Van Muylem et al., 2003; Kerckx et al., 2008). Their mathematical model, based on Weibel’s lung morphology data (Weibel, 1963), proposed that the distribution of the alveolar membrane area and the conducting airway surface area was such that there was a minimal distance between the two. This morphological design of the acinar region facilitates convective flow in the peripheral airway branches close to the alveoli but, as it is so slow, diffusive gas transport dominates. Therefore, NO formed, at least in the more peripheral parts of the conducting airways, should easily diffuse into the alveolar space. This theory was confirmed in another investigation, where the rate of backdiffusion of NO was modified by decreasing the molecular mass of the breathing medium, e.g. by using helium (He) as a dilutant in the breathing gas mixture instead of the nitrogen (N2) in air (Shin et al., 2004, 2006; Kerckx et al., 2008). With an He-O2 mixture in the airways, exhaled NO was reduced, most likely due to enhanced backdiffusion and alveolar uptake of NO to the blood. The lower density of the He-O2 mixture in comparison to air, leading to a concomitant increase in diffusivity of the gas mixture by a factor of 2.4, is most likely the reason for the change of the rate of backdiffusion of NO. Due to the extremely high affinity of NO to haemoglobin, NO is promptly captured by the blood in the lung capillaries. Model computations suggests that some 40 % of the NO formed in the conducting airways is transferred by backdiffusion to the alveoli (Condorelli et al., 2007) during normal air breathing. Therefore, NO production in the airways is 1.7 times larger than the amount of exhaled NO measured at the mouth. Enhanced axial backdiffusion may also be induced by reducing the ambient pressure since the binary diffusion coefficient for a mixture of two gases, in this case NO and air, is increased in an inverse proportion to the ambient pressure (Chang, 1985). As another additive mechanism, exhaled NO levels are also influenced by the degree of constriction/compression of the peripheral conducting airways (Verbanck et al., 2008). In the present thesis, the rate of alveolar-to-blood NO uptake, i.e. the lung diffusing capacity of NO, is a key parameter for the hypothesised decrease in exhaled NO level and increased backdiffusion of NO at decreasing gravity and at reduced ambient pressure. The traditional model that has been used to generally describe lung transfer of a gas x was presented by Roughton and Forster (Forster et al., 1957): 1 / TL = 1 / Dgx + 1 / Dmx + 1 / (θx · Vc) (Eq. 1) They compared the transfer of NO over the alveolo-capillary membrane to the classical study that used CO (instead of NO) (Carlsen and Comroe Jr., 1956), which was then further investigated (Carlsen and Comroe Jr., 1957, 1958) to show that the transfer rate of gas x is

11
determined by the conductance for x in the alveolar gas (Dgx), the conductance for x in the alveolo-capillary membrane (Dmx), the conductance for x within the erythrocyte (red cell θx), and by the volume of blood in the lung capillaries (Vc). The factor describing diffusion in the gas phase (Dgx) is usually considered negligible for inhaled test gases such as CO. As the reaction of NO with haemoglobin is about 280 times faster than that of CO (Tamhane et al., 2001; Zavorsky and Murias, 2006), the erythrocyte resistance to NO is negligible (Johnson et al., 1996). Therefore, the diffusing capacity of the lung for inhaled nitric oxide (DLNO) equals the membrane diffusing capacity for NO (DmNO), and is independent of lung capillary blood volume and the haemoglobin concentration. The theoretical ratio of DLNO/DmCO, calculated as the ratio between the solubility of the gas in plasma at + 37 °C (Bunsen coefficient) divided by the square root of their respective molecular weight, is 1.97 (Zavorsky et al., 2004; Zavorsky et al., 2008). In practical tests however, the ratio has been shown to be a little bit higher at between 2.0 and 2.5 (Tamhane et al., 2001; Murias and Zavorsky, 2007). In subjects exposed to increased gravity in the head-to-feet direction, a decrease in the lung diffusing capacity (DLCO) by 21 % at twice the normal gravity (2 G) and by 34 % at three times the normal gravity (3 G) (Rohdin et al., 2002) has been shown. Lung diffusing capacity (alveolar-to-blood transfer) for CO in microgravity was enhanced by 11 - 27 % (Prisk et al., 1993; Verbanck et al., 1997) during tests at sustained microgravity. Pulmonary diffusing capacity for NO, DLNO has been reported increased by 47 % at transient microgravity during parabolic flights (Vaïda et al., 1997). This was equal to the increase of DmCO, whereas the DLCO increase at the same time was 62 %.
2.2.4 Measurements of exhaled NO in extreme environments
2.2.4.1 Exhaled NO effects of decreased ambient pressure
As airway inflammation, primarily in the form of asthma, has a high prevalence in the population globally, it is important to ascertain that available methods for the analysis of exhaled NO can also be used wherever humans dwell or reside, for example at high altitude locations (Appendix A, Paper III ). In addition, NO formation in the lungs might be involved in high-altitude pulmonary oedema (Duplain et al., 2000; Beall et al., 2001; Hoit et al., 2005; Brown et al., 2006; Stuber et al., 2008), which has an implication on the health status for those people living, working and travelling at high altitude. There are several reasons why the present standard FENO technique may yield different measurement results at reduced ambient pressure, i.e. at high altitude, in comparison to investigations of the same subject at sea level: for example, molecular oxygen is necessary for the synthesis of NO (Gustafsson et al., 1991; Dweik et al., 1998), and the partial pressure of oxygen is reduced at high altitude. Results in this area are partly contradictory and require further studies. For instance, exhaled NO partial pressure has been shown to decrease during the first hours after arrival at altitude (Brown et al, 2006). On the other hand, a longer stay at high altitude has been demonstrated to result in an increased elimination of NO in the exhaled gas, especially in subjects not prone to high altitude pulmonary oedema (HAPE) (Duplain et al, 2000). In those who live at altitude, for example residents of Tibet and Bolivia, it has been found that they have a higher fractional concentration of NO in exhaled air than sea level residents (Beall et al, 2001). Stuber et al. (2008) proposed that an increased level of exhaled NO might be an indication of adaptation to long-term exposure to hypoxia in high-altitude populations. A proposed increase of the

12
synthesis of NO in airway epithelia is thought to be protective against pulmonary hypertension Hoit et al., 2005).
2.2.5 Effects of combined reductions in gravity and ambient pressure
2.2.5.1 Exhaled NO during space flight: Effects of gravity
The Russian Space Program reported that peak airflows during maximum inspiratory and expiratory efforts are reduced after long-term space flights (Baranov et al., 1992). Candidate mechanisms for the reduced flow capacity are airway inflammation due to continuous inhalation of dust and aerosol particles, as dust never settles in zero gravity (Sundblad et al., 2002) and deconditioning of respiratory muscles. However, findings during recent bed rest simulations contradict the latter explanation (Montmerle et al., 2002). Therefore, dust inhalation remains a potential health-degrading factor in long-term microgravity. For very long-term future space flights, exhaled NO monitoring of inflammatory airway reactions will be a vital safety feature, as chemically aggressive dust is likely to be found both on Mars and on the Moon (Latch et al., 2008). During the Apollo flights to the moon 40 years ago, a large amount of dust contaminated the interior of the moon landing module after extravehicular activity and astronauts reported that their eyes and airways were very irritated. The exhaled NO method is an easy way to investigate if degradation of lung capacity might be caused by inhalation of toxic dust. Gravity itself may also influence the rate of formation of NO in the airways. These factors include mechanical stretch/shear forces of lung tissue (Bannenberg and Gustafsson, 1997) and certain stress hormones (Adding et al., 2001). In microgravity, the volume to length geometry of the airways are optimised, which give the more peripheral airways a less rigid structure, with a homogenous shape, most likely resulting in facilitated backdiffusion and uptake of NO to alveolar blood. 2.2.5.2 Exhaled NO during space flight: Effects of reduced ambient pressure
Future space habitats on the moon and on planet Mars are likely to have an atmosphere with lower pressure than on Earth. The reduced pressure will lead to proportionally reduced gas density and an increased deposition of aerosol in the lung periphery (Peterson et al., 2008). It is therefore important to investigate the effects of reduced ambient pressure on airway NO, especially in association with microgravity conditions, where gas diffusion effects will be added or might even be synergistic. 2.3 Requirements for a portable NO analyser
2.3.1 Basic requirements for instrument development
With the currently available chemiluminescence instruments as a reference, the overall task in one of the studies in this thesis (Paper I) was to minimise the sampling system, find a suitable analysis technology and pack all of the constituent components into an attractive chassis, both for commercial appeal and for the ease of handling for the patient/user. There were also three methodological stipulations that had to be adhered to, in order to make the sample collection meet FENO guidelines (ATS/ERS, 2005):
• Exhalation at a fixed flow rate of 50 ml·s-1, due to the flow sensitivity of the exhaled NO measurement method (Silkoff et al., 1997; Kissoon et al., 2000)
13
• To apply an exhalation counter pressure to secure closure of velum palatinum (the soft
palate) during the exhalation. This causes the nasopharynx and nasal cavity to be isolated from the lower airways, which minimises the risk of contamination from the hundred- to ten thousand-fold higher NO concentration in the upper airways compared to in the lower airways (Kharitonov and Barnes, 1997; Silkoff et al., 1997)
• To ensure inhalation of NO-free air, therefore minimising the risk of potentially high
ambient levels of NO influencing the measurement. To achieve this, the breathing manoeuvre had to incorporate proper dead space separation during the sampling. An NO scrubber (filter) should be incorporated in the instrument and the subject should be forced to make a deep inhalation to Total Lung Capacity (TLC) from the instrument mouthpiece, thereby inhaling scrubbed NO free air and then performing the steady slow exhalation for sampling (Baraldi et al., 1998; Piacentini et al., 1998; Steerenberg et al. 2000)
A further key requirement for a new NO instrument was a reliable and robust analysis, system, without performance-degrading interference from other exhaled and ambient gaseous compounds. Human exhaled air consists of more than 200 different gaseous compounds (Pauling et al., 1971; Krotoszynski et al., 1977), albeit in trace amounts. These would be potential serious limitations for accurate analyses at low NO concentrations.
2.3.2 Earlier standard instrumentation
For decades, the generally accepted “gold standard” of gas phase NO analysis was the chemiluminescence method, although mass spectrometry (MS) was very occasionally used in combination with gas chromatography (GC). A number of vendors within the NO analysis instrumentation market were active in selling chemiluminescence instruments for environmental and industrial applications long before the realisation that NO in exhaled air was an important marker (Gustafsson et al.1991; Alving et al., 1993; Persson et al., 1994). Therefore, the most natural way of measuring exhaled NO in the early 1990´s was to apply the same principles. However, the mass of these instruments was around 50 kg, they were very costly and they needed a vacuum pump and an ozone generator. It was also necessary to perform regular reference gas calibrations to produce accurate measurement results. The chemiluminescence technique detects NO molecules on the basis of chemiluminescence energy. Ozone gas (O3) is generated in the instrument and, combined with the NO molecules in an air-stream sample, led into a depressurised reaction chamber. The following chemical reactions take place in the measurement chamber of the chemiluminescence analyser: NO + O3 → NO2* + O2 → NO2 + O2 + hν These reactions produce excited state nitrogen dioxide (NO2*) molecules. In the above formula, hv represents fotons formed by radiated emission, at a wavelength range of 600 - 3000 nm, with an intensity maximum of approximately 1200 nm. In the excited energy state, the NO2* molecule emits electromagnetic radiation (photons), which can be detected as light by a photomultiplier tube. The resulting electrical output signal is calculated and as long as O3 is present in an excess amount, it corresponds linearly to the NO concentration in the sample.

14
2.3.3 New instrument and detector technology
To date, apart from a few laboratory and research reports on laser techniques (Roller et al., 2002; Bakhirkin et al., 2004), chemiluminescence analysis was the only technique to be found effective for the application of clinical exhaled NO measurement. After intense development and testing of several analysis technologies, a semi-disposable electrochemical detector with the required performance regarding lowest detection level, linearity, accuracy, repeatability and insensitivity to potentially interfering gaseous analytes, was selected. The functional principles of the two instrument types are shown in Figure 1, Paper III . 2.4 Requirements for NO analysis at altitude
An established standard method for the measurement of exhaled NO in asthma patients should reasonably include the ability to monitor a population or perform research at any habitable altitude around the world (Appendix A, Paper III ). The proposed establishment of space stations on the lunar surface and on planet Mars would also most likely require available instrumentation to monitor lung health and exhaled NO according to current plans. These habitats are likely to have an atmosphere with lower pressure than that found on Earth or on the ISS. In combination with lowered gravity, the reduced ambient pressure will lead to an increased deposition of aerosol in the lung periphery, which might influence the health status of the inhabitants. To distinguish between potentially pathologic NO levels in the proximal airways vs. the peripheral airways, it is necessary to measure at a range of exhalation flows, using multiple flow models. Over all, the measurement system has to have the technical functionality to handle the required modalities, to be highly robust and be able to withstand the corresponding environmental situations within the warranted technical specification. Further, the measurement results need to be within the specified accuracy. As an alternative, the influence of environmental factors, such as gas density, on the analyser performance must be well known and compensated for in the data interpretation. 2.5 Effects of high altitude on exhaled NO
Observations on exhaled NO measurements in normobaric hypoxia show that FENO values decrease at very low inspired partial pressure of oxygen (PIO2) (Gustafsson et al., 1991; Dweik et al., 1998). Also, exhaled NO measurements in hypobaric hypoxia, when reported as partial pressures, were decreased during the first hours after arrival at altitude (Brown et al, 2006). On the other hand, Duplain et al. (2000) showed increased exhaled NO flux at high altitude in subjects not prone to high-altitude pulmonary oedema (HAPE). Based on these somewhat contradictory reports, it was considered to be important to perform studies of exhaled NO during acute hypoxia during both normobaric and hypobaric conditions.
15
3 AIMS OF THE THESIS
The aims of this thesis was to test the following hypotheses:
� That the performance of instruments made to measure exhaled NO is influenced by the ambient pressure. This could be determined using test procedures that investigate changes in exhaled flow and in the mass flow/volume flow ratio with pressure. Moreover, it is hypothesised that the gas density alters convective and diffusive flow within the NO detector
� That measurement of exhaled NO in hypobaric hypoxia and normobaric hypoxia are
performed in physically different conditions and therefore should provide different results. Thus, the reduced gas density in hypobaric environment promotes intrapulmonary diffusion of NO, which in turn may impact exhaled NO
� That changes in the gravity environment should have an impact on exhaled NO levels:
microgravity should result in a more homogenous distribution of gas, tissue and blood within the lungs, which in turn, may alter intrapulmonary NO exchange in comparison to normal gravity

16
4 MATERIALS AND METHODS This section covers general methodological considerations. For a more detailed description of the measurements and procedures, the reader is referred to the original papers. 4.1 Study subjects
In Paper I exhaled NO measurements were performed repeatedly in two study groups containing nine and nineteen healthy volunteers, respectively. The aim of the study was to investigate instrument accuracy and repeatability during the development of the hand-held NO instrument. All subjects gave their informed consent. Upon application for ethical approval to both the regional ethics committee and to the Swedish Medical Products Agency (MPA), both replied that they considered the study a quality assurance test and it was therefore not subject to ethical scrutiny. Papers II to IV involved test subjects and the studies were approved by the Regional Ethical Review Board in Stockholm, Sweden. All subjects gave their informed consent. In Paper II, a total of fifteen subjects were recruited. Five were healthy male Russian cosmonauts or ESA astronauts on the International Space Station (ISS). They made baseline pre-flight and post-flight measurements at 1 G gravity on Earth. These measurements were compared to regular in-flight measurements during their six months stay on the ISS. This sub-study was also approved by the European Space Agency (ESA). In another sub-study, seven healthy male and three healthy female volunteers performed exhaled NO measurements at normal gravity (1 G) and at hypergravity (2 G and 3 G) in the human centrifuge at Karolinska Institutet Stockholm, Sweden. In Paper III , nine healthy volunteers participated in the study. They performed exhaled NO measurements at normal gravity and ambient pressure. Measurements were made at several exhaled flow rates, where those relevant for high altitude applications, i.e. in the range 30 - 100 ml·s-1, were evaluated. In Paper IV eight healthy volunteers, six male and two female, were recruited. All subjects performed repeated exhaled NO measurements at an ambient pressure range of 1013 to 540 hPa. The same subjects also performed repeated measurements at normal ambient pressure with equivalently hypoxic breathing gases. 4.2 Measurements and procedures
Exhaled NO measurements and NO reference gas measurements were performed with approved prototypes of the novel hand-held instrument (to be known as NIOX MINO® once in production), comparing results with a reference instrument based on chemiluminescence technology (NIOX®, Aerocrine AB, Solna, Sweden) (Paper I). In gas measurements, an NO reference gas was diluted in nitrogen (NO/N2). The concentration of the NO calibration gas and the dilution gas was determined from the certificate labeling from the gas manufacturer. The gas manufacturer analyses were based upon gravimetrical methods with stability monitoring by use of chemiluminescence technique according to their internal procedures. FENO measurements were performed as pair-wise measurements with the hand-held instrument

17
and the reference instrument in accordance with the published guidelines for online exhaled NO measurements in adults (ATS/ERS, 2005). In the interference group of tests, where the effect of possible contaminant gases upon the instrument readings was tested, the interference compounds were mixed with nitrogen or air respectively, in order to obtain the intended interference gas concentrations. The tested mixtures were selected to simulate upper concentrations of environmental and endogenous compounds in human breath that might interfere with the NO detection. In Paper II, the serially produced hand-held NO instrument (NIOX MINO®, Aerocrine AB, Solna, Sweden) that was developed in Paper I, was approved for FENO measurements to be made by astronauts and cosmonauts onboard the ISS, after a number of modifications and qualification tests had been made. A practical gravity test in parabolic flight at a gravity level range of microgravity to 1.8 G was also performed before final space launch approval. FENO measurements (ATS/ERS, 2005) were performed with the hand-held instrument in five subjects at 50 ml·s-1 during long-term microgravity. FENO measurements (ATS/ERS, 2005) were performed with a chemiluminescence instrument in ten subjects at 50, 100, 200 and 500 ml·s-1 exhalation flows, respectively, during hypergravity in a human centrifuge on Earth.
4.2.1 Microgravity
In a research project made in cooperation with ESA and IBMP RAS, specific instrument functions of the hand-held NO instrument were redesigned to comply with the requirements of the space organisations. Modifications consisted of the design of a dedicated 28 V to 6 V DC/DC-converter with approved interfacing connectors, improvement of electromagnetical shielding and added material for flammability requirements. The redesign was performed in cooperation with the Damec Research Aps, Odense, Denmark, which has extensive experience from similar ESA projects.
Figure 2. Custom-designed DC/DC converter of the hand-held exhaled NO instrument used on the ISS. After rigorous laboratory testing and the final practical tests during parabolic flights, the instrument was approved for launch to the ISS, which was performed on 30 September 2005.

18
Figure 3. Modified instrument equipped for space research before launch to the ISS (Photo: Damec Research Aps). Microgravity measurements of exhaled NO were made in duplicate at 50 ml·s-1 exhalation flow by five healthy male ESA astronauts and Russian cosmonauts on a regular basis during their half-year stay onboard the ISS during the period 2005 - 2008. They also made baseline NO measurements at 1 G on Earth with at least four measurements made on one to three occasions before the spaceflight and then approximately every sixth week during their 23 - 28 weeks long stays onboard the ISS. On return to Earth, they performed daily measurements during the first week after landing for comparison. All subjects were declared as non-smokers and had no history of asthma or other inflammatory airway disease. They also refrained from food and beverages rich in nitrite and nitrate for 24 hours before the tests and rinsed their mouth with water before each test. Microgravity FENO readings were collected and evaluated for each subject and plotted as group mean values in a graph against flight time. Data from pre-flight tests and the follow-up week was added to the graph.
4.2.2 Hypergravity
Exhaled NO tests were made at normal gravity and in hypergravity in the human centrifuge at Karolinska Institutet. Subjects were seated in the centrifuge gondola against the backrest at a 28° angle to the direction of the gravitational vector. Tests were performed with a chemiluminescence instrument (NOA 280®, Sievers, Boulder CO, USA), at a range of exhalation flows. The subjects breathed into a mouthpiece which in turn was connected to a remotely controlled rotary valve. Breathing was shifted between cabin air breathing and a non-rebreathing valve for FENO measurement (Figure 1, Paper II). Inhaled air was taken via a charcoal scrubber, providing NO-free inspirate. The exhalation port was connected a flow meter and a variable resistance to obtain the desired exhalation flows. Measurements were performed according to the guidelines for online exhaled NO measurements on adults (ATS/ERS, 2005). Ten subjects were studied at exhalation flows of 50, 100, 200, and 500 ml·s-1 respectively. The NO tests were performed in triplicate at each combination of gravity condition (1 G pre, 2 G, 3 G, and 1 G post) and exhalation flow. To assure sufficient dead space separation, half of the subject’s vital capacity (VC) was exhaled at a rate of 500 ml·s-1 before shifting to the intended test flow. During the individually randomised 2 and 3 G sessions, subjects rested at 1.4 G

19
between the measurement sets instead of the normal 1 G, to reduce vestibular stimulation discomfort from repeated acceleration and retardation manoeuvres. For each subject, a mean FENO value was computed and plots were generated for FENO vs. 1/exhalation flow for each G and flow rate combination.
4.2.3 NO analyser performance at reduced ambient pressure
In preparation for high altitude applications of the portable exhaled NO instrument, the effects of a reduced ambient pressure on NO levels in reference gas measurements and the effects of exhalation flow on exhaled NO levels in healthy humans was investigated (Paper III ). Simulated exhaled air flow measurements were performed with separate flow regulators and with complete NO instruments (NIOX MINO®), including fifteen flow regulators in total (Figure 2, Paper III ). Air flow to the regulators was introduced by means of a one litre syringe which was kept at a constant simulated exhalation pressure by a PEEP valve. Volume flow through the flow regulator was determined with a pneumotachometer (PTM) and mass flow was measured with a mass flow meter. The PTM instrument was connected to a differential pressure transducer and was recalibrated at each ambient pressure level with a one litre syringe. The mass flow through the analysers/regulators was determined with a mass flow meter. Flow measurements were performed in triplicate at each ambient pressure. Measurements were performed in a randomised order at ambient pressures ranging 1013 to 540 hPa. In a second test, detector sensitivity was measured with an NO reference gas at ambient pressures of 1013 to 540 hPa, with eight hand-held NO instruments (NIOX MINO®) and one chemiluminescence instrument (NIOX®). The instrument order and ambient pressure sequence was randomised and all gas concentration measurements were performed in duplicate. The chemiluminescence exhaled NO analyser was recalibrated with NO reference gas at each ambient pressure. In a third set of experiments, exhaled NO measurements were performed in human subjects at flow rates of 30, 50 and 100 ml·s-1, respectively, using a NIOX® chemiluminescence NO instrument at normal ambient pressure, according to the manufacturer’s recommendations.
4.2.4 Effects of altitude and hypoxia on exhaled NO
To investigate the effect of hypoxia on exhaled NO, partial pressure of NO (PENO) was studied in eight healthy subjects (Table 1 in Paper IV) with four identical hand-held exhaled NO instruments (NIOX MINO®). Measurements were performed at sea level (1013 hPa) and at simulated altitudes in a hypobaric chamber. Simulated altitudes were up to 5000 m (540 hPa). The inspired partial pressure of oxygen (PIO2) was kept at the same predetermined levels, while altering either the inspired oxygen concentration or the ambient pressure (Table 2, Paper IV). Readings were corrected for instrument deviations due to the reduced ambient pressure and gas density, according to Paper III . The inhaled oxygen concentrations during normobaric measurements were 21.0 %, 14.5 % and 11.3 %, respectively in nitrogen. All measurements were performed according to the published guidelines for online exhaled NO measurements on adults (ATS/ERS, 2005) and reported as PENO values (in mPa).

20
4.3 Statistical analysis
In Paper I, statistical analysis of the data collected from both the instrument and detector and comparisons between the two NO-analysers was performed. Arithmetic mean calculations for agreement and standard deviation (SD) calculations for repeatability were made. In Paper II, differences in exhaled NO concentrations at different G levels were tested by analysis of variance. Linear curve fitting with regression analysis and calculations of mean values and SD were performed on data in Paper III for flows, exhaled NO readings and PNO/PENO differences vs. 1/flow. Data in Paper IV were analysed as group arithmetic means with SD and group data were analysed for differences between hypobaric and normobaric conditions using a two-tailed paired Student’s t-test.
21
5 RESULTS AND COMMENTS 5.1 Instrument design (Paper I)
5.1.1 Overall instrument design
The novel hand-held NO instrument, together with its custom-designed electrochemical detector forms an affordable, self-contained and truly portable system for exhaled NO analysis, with a mass of 0.8 kg and dimensions 240 x 130 x 100 mm. This is considerably less than the weight and dimensions of a chemiluminescence instrument (NIOX®), which is nearly 50 kg and 500 x 300 x 400 mm, respectively. The new hand-held instrument is functionally optimised for online sampling and buffering with subsequent delayed analysis of the sample (Figure 4). In contrast to the requirement for regular calibrations with a reference gas in chemiluminescence instruments, the electrochemical detector is precalibrated at manufacture, with no further calibration requirements during its 12 months life-time. The above characteristics makes the instrument eminently suitable for high altitude research applications and space operations. The instrument was developed and produced in conformance with Good Manufacturing Practice GMP, CE Medical Device Directive MDD 93/42/EEC Class IIa and U.S. FDA Quality System Requirements QSR. Hence, a number of test procedures were applied during the development, with performance checks against relevant international standards and regulations. The instrument was also fully qualified for a global market, as the relevant quality assurance procedures, i.e. CE labeling and FDA clearance were passed and the instrument is now traded as NIOX MINO® Asthma Inflammation Monitor by Aerocrine AB, Solna, Sweden. To further qualify the instrument for the space research projects onboard the International Space Station (ISS), additional tests were added, where the test requirements were stipulated by the European Space Agency (ESA) and the Institute for Biomedical Problems of Russian Academy of Sciences (IBMP RAS). During an ESA Parabolic Flight Campain in 2005, parabolic flight tests of the instrument system at a gravity level range of microgravity to 1.8 G were also performed.

22
Figure 4. Block diagram of the hand-held exhaled NO-instrument NIOX MINO®. A picture of the instrument and a detector is shown in the background. 5.1.2. Key features of the instrument
5.1.2.1 Ambient NO filtering
Apart from the ability to scrub (filter) NO, the instrument was also designed to withstand an environmental NO2 interference of up to 200 ppb. This level is above the EU and US guideline limits recommended for indoor air. 5.1.2.2 Flow regulator
As the FENO method is highly flow sensitive it is important to regulate the flow rate during the exhalation manoeuvre. The flow control component of the chemiluminescence exhaled NO instrument (NIOX®) was redesigned to fit the hand-held instrument. The flow regulator, which comprises a dynamic mechanical needle-valve type pressure-flow regulator with a fast feedback regulating system, was calibrated to the standardised flow (ATS/ERS, 2005) at manufacture. The specified performance is a constant flow of 50 +/- 5 ml·s-1 (BTPS) at a positive exhalation pressure of 10 - 20 cm H2O.

23
Figure 5. Flow regulator in the hand-held instrument (Photo: Aerocrine AB). 5.1.2.3 Electrochemical detector
Any gas that can be oxidized or reduced can also be detected by means of an electrochemical detector. The measurement principle of the current detector is called amperometric, which refers to the detection of a small electric current generated by the electrochemical reaction in the cell (Cao et al., 1992). This current is converted to an electrical voltage via a potentiostat.
Figure 6. Schematic drawing of the electrochemical cell with its potentiostat. WE – Working Electrode, RE – Reference Electrode, CE – Counter Electrode. The exhaled gas sample containing NO molecules is lead to the head of the detector, where it passes a delicate diffusion system of membranes and filters, which are designed to increase the sensitivity and selectivity for NO molecules. It is then led to a porous membrane soaked in an electrolyte inside the detector housing. The following oxidizing and reducing chemical reactions take place at the active electrodes of the detector:

24
Working electrode (WE) - oxidizing reaction NO + 2H2O => NO3- + 4H+ + 3e-
Counter electrode (CE) - reducing reaction O2 + 4H+ + 4e- => 2H2O The third detector electrode, the Reference electrode (RE) is shielded from the reaction and used to maintain a constant electrochemical potential (voltage bias) at the WE. This generates a reference point for the dynamic electrochemical reaction response. Via a chemical oxidation at the WE, an electrical current in the order of nA is generated between WE and RE. This small current is amplified by the potentiostat and transmitted to the instrument computer, which handles the presentation of the measurement result on the display. The reverse reaction, where oxygen (O2) is reduced back to water, takes place at the counter electrode (CE) and has the purpose of maintaining electro neutrality within the electrochemical cell. After reaching a maximum adsorption level and once the electrochemical reaction has taken place at the WE, the desorption phase is initiated, where the remaining analyte molecules are dissolving back into the electrolyte. 5.1.3 Performance tests
5.1.3.1 Agreement, precision, linearity and lowest detection limit
In Paper I, data from NO gas measurements and exhaled FENO measurements, comparing the new hand-held instrument with a chemiluminescence analyser (NIOX®) were presented. Measurements of exhaled gas were focused on defining the degree of FENO agreement and the precision at repeated measurements. Linearity and signal to noise level limitations were also tested with reference gas. 5.1.3.2 Comparison with reference gases
Reference gas measurements for a representative detector installed in the hand-held instrument with 5, 10, 20, 50, 100 and 218 ppb NO in N2 were performed, using ten consecutive measurements at each concentration level (Table 2, Paper I). The results showed a mean deviation from nominal gas concentrations of up to 13.6 ± 2.0 ppb (mean ± SD), within the whole concentration range. Within the 5 - 100 ppb range, the corresponding deviation was 3.5 ppb ± 0.9 ppb or less. 5.1.3.3 Linearity
System linearity was investigated with an NO reference gas for a representative detector (Figure 2, Paper I). Ten repetitive measurements at 5, 10, 20, 50, 100 and 219 ppb in N2 were performed. The mid-range deviation was 0.6 % with a coefficient of determination R2 of 0.9998. 5.1.3.4 Lowest detection limit
The lowest detection limit (LDL) of the electrochemical detector to the NO detector gas was defined as the system sensitivity. Measurements were performed with two different detectors in ten consecutive measurements. The lowest available gas concentration, blended in a gas mixer, was detected at a mean concentration of 2.4 ± 0.5 ppb (mean ± SD). The LDL was stated as below 3 ppb.

25
5.1.3.5 Interference with other compounds
Measurement interference was investigated for relevant compounds, including acetone, ammonia, carbon dioxide, carbon monoxide, ethanol, hydrogen, hydrogen peroxide, isoprene, nitrogen dioxide and oxygen. Data were obtained with representative detectors for potential interference compounds of both endogenous and environmental origin. Acceptance criteria included an interference level equivalent to 3 ppb NO or below over the whole operating range (0 - 300 ppb NO), i.e. maximum 1 % of full scale. A relevant safety margin was added for interindividual metabolic variations in humans and potential minor sensitivity differences between detector individuals. Applying these criteria, there was no significant interference for the tested compounds. 5.1.3.6 Agreement study
The FENO test agreement study in nine subjects showed a group mean disagreement of 0.9 ppb in 154 triplicate tests between the hand-held and the chemiluminescence instrument, during three consecutive test days.
Figure 7. FENO measurement agreement. Data show pair-wise agreement from a total of 462 measurements (154 triplicates) for the hand-held instrument and a chemiluminescence instrument (NIOX®), performed as three consecutive measurements in the two instrument types. For the hand-held instrument, two instruments with a total of six detectors were used during three consecutive days in healthy volunteers (n = 9). The data showed a highly acceptable mean agreement between the two instrument types. Occasional pair-wise comparisons differed by more than 10 ppb. It should be noted that in this dual device comparison, the instrument variations for the hand-held and the NIOX® chemiluminescence instrument were added, where the specified agreement of the latter was 2.5 ppb. The total deviation also included biological variations in intra-individual measurements, which meant that the repeatability of the new hand-held exhaled NO-instrument is quite similar to the established analyser technology regarding agreement performance.

26
5.1.3.7 Precision study
A precision (repeatability) study was performed to estimate the repeatability of three consecutive measurements (triplicate) with two hand-held instruments, using six different detectors in nine subjects (Figure 8 below) (Figure 3, Paper I). For reference, the same procedure was made with the chemiluminescence instrument NIOX® in a group of healthy subjects (Figure 4, Paper I). Results showed very good precision for both instrument types, being 1.3 ppb and 1.4 ppb (expressed as SD) in the hand-held and chemiluminescence instruments respectively.
0.0
0.5
1.0
1.5
2.0
2.5
1 2 3 4 5 6
Detector
Mea
n S
D (
pp
b)
Figure 8. Repeatability data calculated as mean SD from FENO measurements in nine subjects with two hand-held NO instruments for each of the six detectors used. The total number of triplicate measurements was 154 and the group mean SD was 1.3 ppb. 5.2 Effects of gravity on exhaled NO (Paper II)
5.2.1 Microgravity study on the ISS
After instrument modifications were made with approval from the representative space organisations and following launch from Kazakhstan, measurements were initiated onboard the ISS from October 2005. Measurements were regularly performed on long term visiting cosmonauts and astronauts during the years 2005 - 2008.

27
Figure. 9. Hand-held instrument used for exhaled NO measurements by cosmonauts and astronauts onboard the ISS (based on photos from ESA).
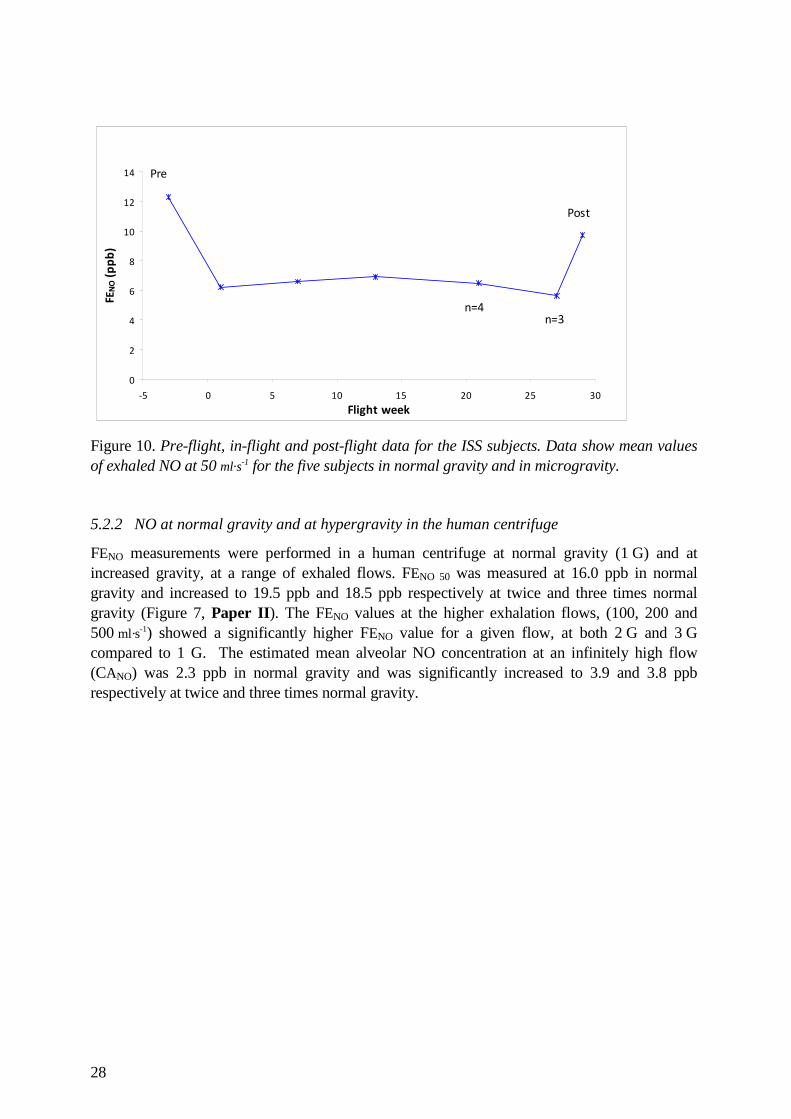
Exhaled NO data from the microgravity measurements were transmitted via the Baikunur Cosmodrome in Kazakhstan and were evaluated at the research laboratory at Karolinska Institutet in Stockholm. Final evaluation included pre-flight measurements and measurements from the follow-up week after landing. These data showed a decrease in exhaled NO levels at 50 ml·s-1 during microgravity (Figure 4, Paper II). Mean values for all five subjects were 6.6 ± 4.4 ppb (mean ± SD), compared to a ground control value of 12.3 ± 4.7 ppb (p = 0.016). Pooled data from the first week after landing was 9.7 ± 2.8 ppb, which are non-significant changes compared to pre-flight and inflight levels (p = 0.28 and 0.30, respectively).
28
0
2
4
6
8
10
12
14
-5 0 5 10 15 20 25 30
Flight week
FEN
O (
pp
b)
Pre
Post
n=3
n=4
Figure 10. Pre-flight, in-flight and post-flight data for the ISS subjects. Data show mean values of exhaled NO at 50 ml·s-1 for the five subjects in normal gravity and in microgravity. 5.2.2 NO at normal gravity and at hypergravity in the human centrifuge
FENO measurements were performed in a human centrifuge at normal gravity (1 G) and at increased gravity, at a range of exhaled flows. FENO 50 was measured at 16.0 ppb in normal gravity and increased to 19.5 ppb and 18.5 ppb respectively at twice and three times normal gravity (Figure 7, Paper II). The FENO values at the higher exhalation flows, (100, 200 and 500 ml·s-1) showed a significantly higher FENO value for a given flow, at both 2 G and 3 G compared to 1 G. The estimated mean alveolar NO concentration at an infinitely high flow (CANO) was 2.3 ppb in normal gravity and was significantly increased to 3.9 and 3.8 ppb respectively at twice and three times normal gravity.
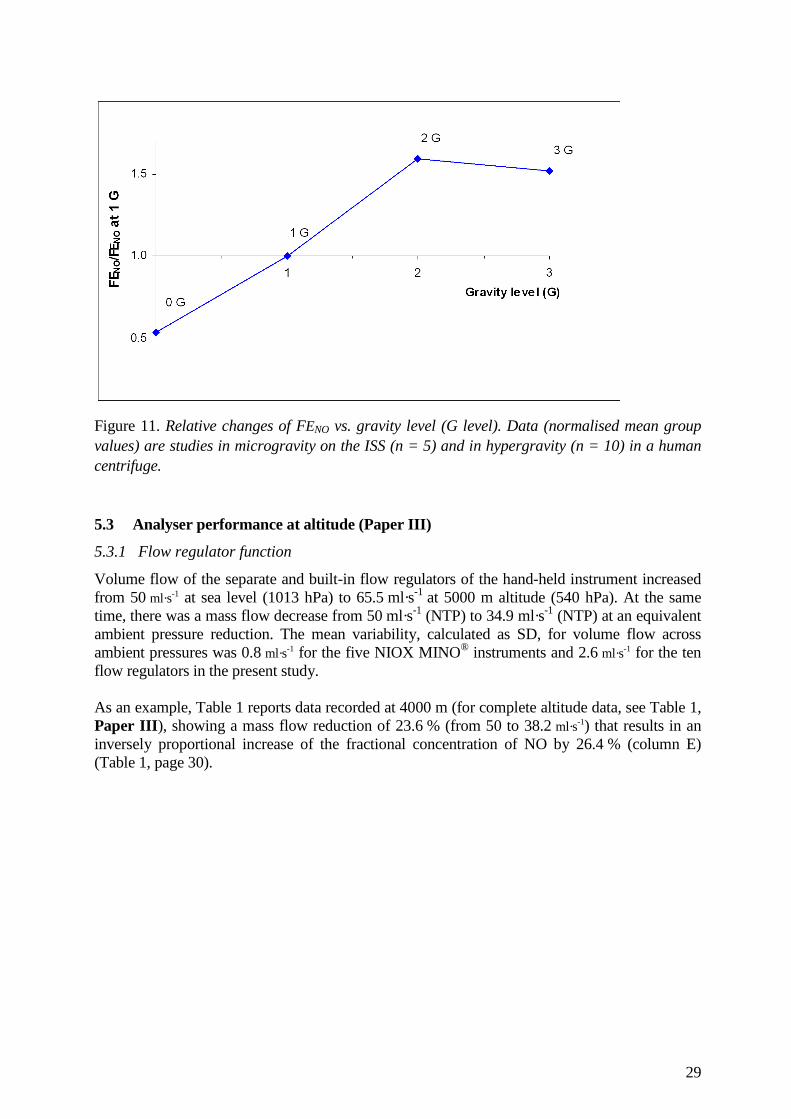
29
Figure 11. Relative changes of FENO vs. gravity level (G level). Data (normalised mean group values) are studies in microgravity on the ISS (n = 5) and in hypergravity (n = 10) in a human centrifuge. 5.3 Analyser performance at altitude (Paper III)
5.3.1 Flow regulator function
Volume flow of the separate and built-in flow regulators of the hand-held instrument increased from 50 ml·s-1 at sea level (1013 hPa) to 65.5 ml·s-1 at 5000 m altitude (540 hPa). At the same time, there was a mass flow decrease from 50 ml·s-1 (NTP) to 34.9 ml·s-1 (NTP) at an equivalent ambient pressure reduction. The mean variability, calculated as SD, for volume flow across ambient pressures was 0.8 ml·s-1 for the five NIOX MINO® instruments and 2.6 ml·s-1 for the ten flow regulators in the present study. As an example, Table 1 reports data recorded at 4000 m (for complete altitude data, see Table 1, Paper III ), showing a mass flow reduction of 23.6 % (from 50 to 38.2 ml·s-1) that results in an inversely proportional increase of the fractional concentration of NO by 26.4 % (column E) (Table 1, page 30).
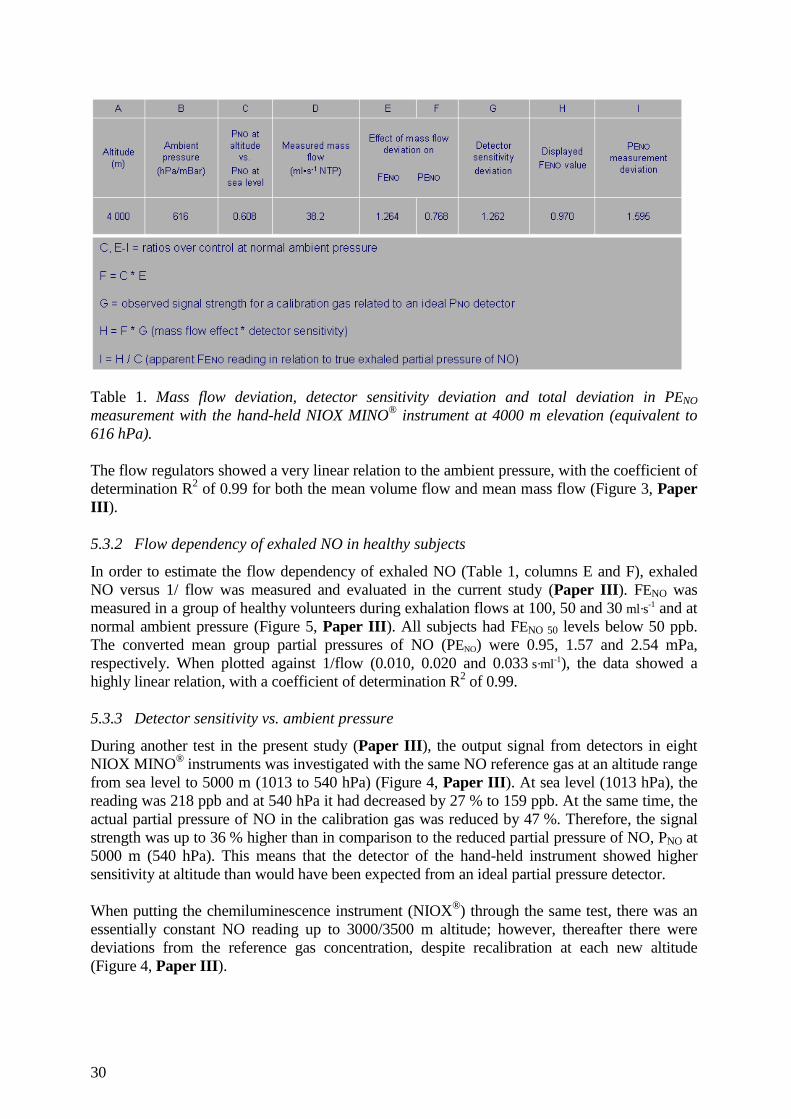
30
Table 1. Mass flow deviation, detector sensitivity deviation and total deviation in PENO measurement with the hand-held NIOX MINO® instrument at 4000 m elevation (equivalent to 616 hPa). The flow regulators showed a very linear relation to the ambient pressure, with the coefficient of determination R2 of 0.99 for both the mean volume flow and mean mass flow (Figure 3, Paper III ). 5.3.2 Flow dependency of exhaled NO in healthy subjects
In order to estimate the flow dependency of exhaled NO (Table 1, columns E and F), exhaled NO versus 1/ flow was measured and evaluated in the current study (Paper III ). FENO was measured in a group of healthy volunteers during exhalation flows at 100, 50 and 30 ml·s-1 and at normal ambient pressure (Figure 5, Paper III ). All subjects had FENO 50 levels below 50 ppb. The converted mean group partial pressures of NO (PENO) were 0.95, 1.57 and 2.54 mPa, respectively. When plotted against 1/flow (0.010, 0.020 and 0.033 s·ml-1), the data showed a highly linear relation, with a coefficient of determination R2 of 0.99. 5.3.3 Detector sensitivity vs. ambient pressure
During another test in the present study (Paper III ), the output signal from detectors in eight NIOX MINO® instruments was investigated with the same NO reference gas at an altitude range from sea level to 5000 m (1013 to 540 hPa) (Figure 4, Paper III ). At sea level (1013 hPa), the reading was 218 ppb and at 540 hPa it had decreased by 27 % to 159 ppb. At the same time, the actual partial pressure of NO in the calibration gas was reduced by 47 %. Therefore, the signal strength was up to 36 % higher than in comparison to the reduced partial pressure of NO, PNO at 5000 m (540 hPa). This means that the detector of the hand-held instrument showed higher sensitivity at altitude than would have been expected from an ideal partial pressure detector. When putting the chemiluminescence instrument (NIOX®) through the same test, there was an essentially constant NO reading up to 3000/3500 m altitude; however, thereafter there were deviations from the reference gas concentration, despite recalibration at each new altitude (Figure 4, Paper III ).

31
5.4 Acute effects of altitude on exhaled NO (Paper IV)
5.4.1 Hypobaric and normobaric hypoxia
In this study (Paper IV), the aim was to investigate potential differences in PENO between normobaric and hypobaric conditions during moderate (PIO2 13.2 - 13.8 kPa) and severe hypoxia (PIO2 10.0 - 10.7 kPa). Corrections of the PENO values were made for gas density effects and detector sensitivity deviations of the hand-held NIOX MINO® instruments at altitude, according to the recommendations in Paper III . In a hypobaric environment, with a decrease in ambient pressure down to 540 hPa that corresponds to 5000 m altitude, PENO group mean values (n = 8) were decreased by up to 41 %. However, when the same subjects were exposed to similar hypoxic breathing gases at normal ambient pressure (1013 hPa), PENO levels decreased by less than 5 % (Figure 1, Paper IV). Hypobaric mean PENO was reduced by 33 % at the lowest PIO2 compared to the normobaric control at the equivalent PIO2.
Figure 12. Relative PENO difference between hypobaric and normobaric hypoxia vs. relative change in binary diffusion coefficient for NO and air compared to sea level conditions. PENO data are group mean differences (n = 8) between hypobaric (693 and 540 hPa) and at normobaric (1013 hPa) conditions with similar inspired oxygen partial pressures.

32
6 GENERAL DISCUSSION AND PERSPECTIVES
The interest in this fascinating molecule, nitric oxide and in exhaled NO measurement has increased continuously since NO was first found in exhaled breath (Gustafsson et al., 1991). This interest has, perhaps, accelerated even further since humans with airway inflammation were found to have increased levels of exhaled NO (Alving et al., 1993; Persson et al., 1994). Today, more than 2000 peer-reviewed papers have been published on the subject. Specifically, the standardisation of a measurement procedure, the FENO method (ATS/ERS, 2005), has allowed scientists and clinicians to compare their findings more accurately. However, this expanding interest has also revealed that some of the methodological aspects of the FENO method need to be reconsidered. New inventions and technical progress often result in miniaturised and “more simple to handle” analysers. In the first part of the present thesis (Paper I), data describing the development of the first hand-held and truly portable exhaled NO instrument (NIOX MINO®, Aerocrine AB, Solna, Sweden) were presented. 6.1 NO analysis technology
Figure 13. Hand-held exhaled NO instrument (NIOX MINO®) (Photo: Aerocrine AB). The weight of the new hand-held instrument is 98 % less, the sales price is 90 % less and the volumetric dimension is 95 % less than commonly used, existing chemiluminescence instruments for exhaled NO analysis. The results described in Paper I show that its technical performance for the key parameters of analytical agreement and linearity, as well as clinical agreement and precision are in line with the established chemiluminescence technique. A preference for the use of this instrument in research applications should be obvious, given that unlike existing chemiluminescence instruments, it does not need any recalibration of the detector during its lifetime. With all of its benefits, it might have been tempting to use the NIOX MINO® in extreme environments such as at high altitude, in remote locations and during space flight. However, without knowledge to the contrary, it should not be a priori assumed that such instruments are designed for use in extreme environments, where for example, there may be reduced gas density,

33
lower and higher levels of gravity and where the physical behaviour of gases and performance of instrument components might not be the same as during normal conditions. To this end, the second part of the present thesis described exhaled NO data (Paper II) that were collected using the new hand-held NIOX MINO® instrument in such extreme environments. Exhaled NO data were collected from cosmonauts and astronauts in microgravity onboard the ISS, and from hypergravity experiments made on Earth, from both the conducting airways and the alveolar airways. To perform these measurements onboard the ISS, modifications of the hand-held NO instrument had to be made. A major modification was the redevelopment of a power supply unit for the instrument, as the electrical outlets in the space station are of low voltage DC instead of the normal AC voltage supplies on Earth. Further, the shielding against electromagnetic interference and fire protection was improved. A final practical qualification test, at a range of gravity levels was also performed during parabolic flights, before space launch. 6.2 Exhaled NO and space flight
The initial aim of this section of the work was to test the hypothesis (Paper II) that in microgravity, airway inflammation due to continuous inhalation of dust and aerosol particles might be the mechanism for the reduced lung capacity reported from the Russian Space Program in the 1990´s (Baranov et al., 1992). The contradictory finding that FENO concentrations were actually reduced during inflight observations onboard the ISS, did not support this hypothesis. However, a limitation of this study was that exhaled NO measurements could only be made at the standardised flow of 50 ml·s-1 (FENO 50). To exclude potential inflammation in the peripheral airways that might reduce airflow capacity, measurements made at higher exhalation flows would have been necessary. However, the principal observation from the microgravity experiments in subjects onboard the ISS and from the human centrifuge study on Earth (Paper II), was that exhaled NO in healthy humans, measured as FENO 50, is gravity dependent. There was a group mean decrease of 46 % in exhaled NO concentrations during long-term microgravity in space compared to pre-flight measurements. In parallel, ground experiments showed an elevated exhaled NO concentration of around 20 % in seated humans during acute hypergravity compared to measurements at normal gravity (1 G). Thus, the microgravity and hypergravity findings are mutually supportive. Unexpectedly, in the ISS subjects in space, there was no clear trend of a return to the same levels as during pre-flight in the daily FENO measurements during the follow-up week after space flight. There might be several reasons for this. Firstly, the sterile environment onboard would certainly reduce the bodies’ bacterial flora. Mouth colonisation would be reduced from that found on Earth (Duncan et al., 1995; Malinovschi et al., 2009), with fewer strains of bacteria as well as a reduction in the total numbers of bacteria found in the oropharyngeal tract. A reduction of these bacteria, which are able to convert nitrate to nitrite, then further into NO, would promote a lower exhaled NO level. Secondly, all food and drink onboard is sterilised, which could reasonably contribute to lower the NO concentration in exhaled air, because of the concomitant decrease in bacteria normally taken up via ingested food and drinks (Olin et al., 2001; Vints et al., 2005). Thirdly, although the subjects were declared non-smokers, at least one of the subjects had a large difference between the pre-flight baseline measurements and post-flight values, which would fit the FENO pattern of a smoker who had to refrain from smoking while on the ISS. Although the individual could not be questioned to this end, it is not unlikely that he did start or resume smoking after his return to Earth. Finally, there is no information on the air quality on the space station Mir for comparison with the current conditions on the ISS.

34
However, on the ISS, no major alterations were observed (Prisk et al., 2005) when comparing static and dynamic spirometry data before and after EVA. In another study (Prisk et al., 2008), there were no permanent changes in lung function after return from a six month long stay in normoxic and normobaric environment during long-term microgravity. 6.2.1 Pulmonary NO transport in microgravity
Exchange of gases, such as O2 and CO2, is considered to occur in three steps; namely the gas exchange within the airway gas (gas diffusivity), the gas exchange across the pulmonary membrane and finally, gas diffusion and chemical combination within the pulmonary capillary blood. When making diffusing capacity measurements with CO and NO, the first term of Eq. 1 (page 10) is usually ignored (Forster et al., 1957). However, in the case of NO generated in conducting airways, this approximation is not applicable due to the fact that this NO is produced along several generations of conducting airways and diffuses in retrograde direction to the alveoli. Therefore, the factor for diffusive transport in the gas phase highly influences the total resistance to NO transport in the lung, DLNO. Furthermore, the resistance to the NO transport within the erythrocyte is negligible. Therefore, in the case of NO, the total transfer equation of the lung would instead be: 1 / TLNO = 1 / DgNO + 1 / DmNO (Eq. 2) Thus, the transfer of NO is determined by the conductance of the diffusive flow along a concentration gradient for NO in the respiratory zone of the airways. The second factor of the equation is, as in the general case, the conductance of the alveolo-capillary membrane for the gas, in this case NO. A reasonable approach to explain the reduced FENO 50 levels in microgravity, is to apply the slope and intercept method (Tsoukias et al., 1998; Pietropaoli et al., 1999), adding the influence of axial diffusion (Shin and George, 2002; Condorelli et al., 2007). In Figure 14, the slope of the relationship between FENO and 1/flow represents the rate at which NO is added to the exhaled gas as it passes through the conducting airways (JawNO). Since measurements are made from the NO output at the mouth, it is the apparent JawNO that can be determined. The total JawNO also includes NO that diffuses in a retrograde direction to the alveoli (axial backdiffusion) (Condorelli et al., 2007). The Y intercept at an infinitely high flow (1/flow = 0) represents the alveolar NO concentration (CANO) in gas that instantaneously has passed the conducting airways without taking up additional NO.

35
Figure 14. Proposed slope and intercept model for International Space Station (ISS) subjects, based on FENO vs. 1/flow relations at normal gravity and microgravity. The 1 G curve (Normal gravity, solid line) is a transformation from multiple flow measurement data obtained in a group of subjects at 1 G (Figure 5, Paper III), so to fit the actual data point for the mean group pre-flight FENO 50 in normal gravity of the ISS subjects (12.3 ppb), with a correspondingly adjusted hypothetical CANO (2.1 ppb). The actual FENO 50 data point for the ISS subjects in microgravity was 6.6 ppb. A hypothetical dotted line is added for the microgravity case. The CANO value for the ISS subjects was hypothetically assumed as 1.2 ppb. The solid line shows the pre-flight JawNO slope (Normal gravity) and is a transformation from multiple flow measurement data obtained in a group of subjects at 1 G (Figure 5, Paper III ) so to fit the data point for the mean group pre-flight FENO 50 (12.3 ppb) in normal gravity of the ISS subjects. A value of 2.1 ppb was adopted for CANO in normal gravity. The dotted line represents the hypothetical JawNO slope in microgravity, where the inflight mean group FENO 50 value for the ISS subjects is known (6.6 ppb). The FENO vs. 1/flow line in microgravity must be defined by the actual data point for FENO 50 in microgravity and a CANO value that reasonably must be lower than that for 1 G but higher than zero. In the figure, a value of 1.2 ppb is adopted for the intercept in microgravity. Regardless of the exact CANO value, the slope in microgravity must have been much lower than that in normal gravity. It has been speculated that a decreased mechanical stress of the lung tissue at reduced gravity would in itself result in reduced NO production in the airways with lower NO flux in the airways (Strömberg et al., 1997; Artlich et al., 1999). In spite of this, it might here be reasonable to assume that there is an unchanged production of NO in the epithelia of both the conducting airways and the alveolar airways at sustained microgravity in comparison to normal gravity. Having made this assumption, Figure 14 shows that there is a reduced slope compared to normal gravity, with a lower apparent flux of NO (JawNO) in the conducting airways. The reduced apparent JawNO in microgravity compared to normal gravity can be explained by an increased backdiffusion of NO in the distal part of the conducting airways, from around airway generations 14 - 16.
36
This increased backdiffusion is thought to be due to a more homogenous and relaxed geometry of the lung parenchyma including the acinar airways and peripheral vessels, at reduced gravity. This in turn would promote a high total cross-sectional area vs. epithelial area ratio and a higher width/length ratio of the acinar airways in reduced gravity, which would then promote the axial backdiffusion of NO. Although the diffusing capacity of the lung for nitric oxide (DLNO) is independent of the lung capillary blood volume and the haemoglobin concentration (Eq. 1) (Johnson et al., 1996; Tamhane et al., 2001; Zavorsky et al., 2004), the central pooling of blood with a simultaneous increased capillary blood volume during microgravity (Vaïda et al., 1997), should lead to an increased contact area between alveolar air and blood. It is thus likely that both of the two serially operating factors (Eq. 2, backdiffusion and alveolar-to-blood transfer) act in concert to promote uptake of NO to the blood and then bind it to haemoglobin. The outcome of CANO would depend on the balance between the increases in backdiffusion and alveolar-to-blood uptake. As a corollary statement, the above reasoning tended to be confirmed in the hypergravity experiments of this study (Paper II), where the slope JawNO tended to be decreased, and the intercept value CANO was significantly decreased with decreasing gravity. The FENO 50 decrease was around 15 % at normal gravity compared with 2 G and 3 G. Hence, both studies in Paper II show congruent changes in the same direction upon a decreased gravity. Hence, it is speculated that, at a reduced gravity level, and during long-term microgravity in particular, two major optimisations occur to improve the conditions for retrograde NO transfer in the lungs. They are:
• A “slackening” of the lung parenchyma, allowing it to become more homogenous, with reduced stretch and deformation tendencies. These changes enable both a short and a wide geometry of the peripheral airways, which promotes axial diffusion
• An increase of the contact area between alveolar gas and pulmonary-capillary blood,
which promotes alveolar-to-blood NO uptake 6.3 Instrument performance at high altitude
The measurements of the technical performance of the two types of exhaled NO instruments at high altitude (Paper III) , revealed flow deviations that varied to such an extent that they have to be corrected for. There are alternative ways to handle the flow deviation, but the best way would be to readjust the flow regulator of the instrument in order to keep the volume flow constant at all altitudes. Surprisingly, there were also large deviations in detector sensitivity of the hand-held instrument at altitude. For example, at 4000 m altitude, the sensitivity was 26 % higher than expected, which was probably due to facilitated gas transport inside the detector, as the diffusivity within a binary gas mixture is faster with the decreasing gas density at altitude (Chang, 1985). To avoid such sensitivity deviations, recalibration of the detector at each altitude is recommended. In Paper III , corrections were made to the FENO reading at simulated altitude for both the flow and detector sensitivity deviations and alternative recommendations were given for a simplified, however not optimally accurate, corrective calculation of the FENO reading from the instrument. The total deviation of the NO reading was up to + 86 % at 5000 m altitude (540 hPa), which could confound exhaled NO measurement results in clinical studies or during asthma monitoring

37
at high altitude. It is proposed that the standard methods used in respiratory physiology for metabolically produced or consumed gases should also apply for exhaled NO. Hence, exhaled NO analysers should report results as a partial pressure of NO (PENO), preferably in mPa. Not until then, would it be possible to accurately compare results between altitudes. 6.4 Exhaled NO at high altitude
To our knowledge, the fourth part of this thesis, as reported in Paper IV, is the first where a comparison between exhaled NO in hypobaric hypoxia and normobaric hypoxia has been made. In these experiments, exhaled NO was measured in healthy subjects (Table 1, Paper IV) during acute hypobaria and normobaria (Table 2, Paper IV). It was found that PENO was reduced at altitude in comparison to an equivalent hypoxia at sea level (Figure 1, Paper IV). The study also confirmed similar findings made by other workers; there was no significant effect from moderate normobaric hypoxia (Dweik et al., 1998; Busch et al., 2001). This suggests that the main reason for the decrease was the reduced density of the breathing gas at altitude. The resulting linear PENO reduction correlates well to the concomitantly increased binary diffusion coefficient of NO and air in acute hypobaric exposure (Figure 2, Paper IV). In the present study, a considerable change in PENO (using similar hypoxic breathing gases as at 5000 m (540 hPa)) as compared to that at sea level), of - 33 %, was found. Similarly to the conclusions drawn from the exhaled NO measurement results in reduced gravity (Paper II), an enhanced axial backdiffusion with increased scavenging of NO by pulmonary-capillary blood is the most likely cause for the change in PENO. In the present case of a reduced ambient pressure (Paper IV) however, it is speculated that the mechanism is a reduced density of the breathing gas, which increases the binary diffusivity of NO and air. Therefore, the reduced gas density makes the axial backdiffusion of NO faster, so that an increased amount of NO can be taken up into alveolar blood. When measuring the effect at the interface between the airways and the measuring instrument, i.e. at the mouth, a decrease in exhaled NO level is seen.
The results correspond with findings reported by other research groups (Shin et al., 2004, 2006; Kerckx et al., 2008), who used a helium-oxygen breathing gas with lower density than air, to increase the rate of molecular diffusion in the lungs. These groups also found that the observed reduction of PENO was due to an enhanced axial gas diffusion with an associated alveolar uptake of NO into the blood. Another group of researchers (Condorelli et al., 2007), performed a model study in subjects breathing air at sea level. They proposed that around 40 % of the NO formed in the conducting airways is transported via axial backdiffusion to the alveoli and is then taken up into the blood and bound to haemoglobin. The data from the present study suggest that this fraction is substantially increased in a hypobaric air environment.
As shown in the present thesis, the FENO test may not necessarily work the same way in extreme environments, for example at high altitude and in microgravity in space, as it does in the hospital laboratory at sea level. The altitude study (Paper IV) suggests that less NO is exhaled at altitude due to an enhanced backdiffusion. Thus, it is speculated that the net NO formation in the lung may very well be the same at altitude as at sea level, and that the observed differences in FENO are entirely dependent on backdiffusion.
The same reasoning could be applied to microgravity. Again, it can be speculated that the rate of NO formation in the lung could be more or less the same in microgravity as in normal gravity, but an enhanced backdiffusion would lower the measured PENO and possibly also the net rate of

38
NO excretion. Further, it can be hypothesised that the geometry of the peripheral airways, possibly in combination with mechanical stretch vs. relaxation influence from the airway parenchyma, has an impact on the production and uptake of NO on a cellular level. However, further studies are needed to find such additional mechanisms.
In an Editorial article (Kayser, 2009), addressing two of the papers in the present thesis (Paper III and Paper IV), support was put forward for the arguments that axial backdiffusion of NO enhances its uptake into blood and due to the influence from changes in ambient pressure, normobaric and hypobaric hypoxia would be “physically and therefore probably also physiologically different”. The increased NO uptake by the blood, would also mean that there was an enhanced bioavailability of NO in conditions of hypobaric hypoxia. The author speculated that this new knowledge, where an increase in stores of NO in the body based on the backdiffusion mechanism, should be of value for athletes considering altitude training. Hypobaric hypoxia would be the only “real” altitude training, which is in line with reports that actual altitude training tends to give better results as compared to training at simulated altitude. The author further commented that there were reports of a more than tenfold higher circulating concentrations of bioactive NO products in Tibetans from 4200 m, as compared to low altitude dwellers (Erzurum et al. 2007). These authors proposed higher NO production in altitude natives as an explanation. The data from the present study (Paper IV) would instead indicate that “decreased air density at high altitude leads to higher uptake of NO by the blood leaving the lung because of increased axial backdiffusion”. The editorial’s author concluded that “Future work should include reference to this principle indicating the potential bias that normobaric hypoxia may introduce when the actual research question concerns hypobaric hypoxia”.

39
7 CONCLUSIONS
� The gas density and the rate of diffusion of gases at altitude have a great impact on the technical performance of the NO instruments used in the present study, so that both the exhaled volume flow and the detector sensitivity increased with decreasing ambient pressure. Since the exhaled mass flow nevertheless was reduced at altitude, both these deviations tended to increase the FENO readings substantially
� There is a significant decrease in exhaled NO concentration in hypobaric hypoxia,
probably due to the lower density with an increased binary diffusion of the breathing gases. There is almost no influence on FENO levels at moderate to severe hypoxia at normal ambient pressure. Hypobaric and normobaric hypoxia are therefore to be considered physically and probably also physiologically different and extrapolations from one condition to another should therefore be made with caution in future studies
� Exhaled NO concentrations decrease in microgravity, which might be due to a more
slackened lung parenchyma with accompanying changes in the diffusion area/airway generation length ratio in the acinar region of the lung. This gives an enhanced axial backdiffusion of NO, which lowers the exhaled NO concentration. At the same time, an increased contact area between alveolar air and blood promotes uptake of NO to the blood

40
8 ACKNOWLEDGEMENTS
I wish to express my sincere appreciation and gratitude to all those who have supported me in this project. In particular, I would like to thank: Dag Linnarsson, my supervisor, for always being so enthusiastic to share with him from his experience and knowledge en-masse, specifically, but not only within physiology and experiments. For highly productive discussions and paper writing sessions. For always being available to discuss my projects and coping with my sometimes stressed visits. For always being cheerful and optimistic and for all the jokes and laughter we shared. Håkan Elmqvist, my assistant supervisor, for great discussions and important input to my research project. Patrik Sundblad, my mentor and friend, for meetings on our common interest in my project and the ISS experiments. Lars Karlsson, my co-author and research colleague, for good cooperation and thrilling common parabolas over the Mediterranean Sea. Lars Gustafsson, my co-author and prime tutor to the world of exhaled nitric oxide, for good discussions and for always responding with sincere interest and great knowledge to my questions on the fascinating NO molecule. Astrid Horn, Lesley Blogg, Rudolf Gambert, Yannick Kerckx, Mikael Gennser and Peter Lindholm , my co-authors, for their expertise and fruitful cooperation. Cosmonauts and astronauts and all Telluric volunteers who participated in our experiments on the International Space Station, in the A300 and on Earth. Björn Johannesson, for excellent assistance during experiments and for generous technical support. Lili Andersson, Bo Tedner, Louise Bovin and Monica Pace-Sjöberg, for technical assistance and administrative support. Past and present colleagues at the Section of Environmental Physiology and FOI, for cooperation within our research departments. My mother Marie and my late father Erik for all the love and support during my childhood and throughout my life. Even if my professional life brought me far from home, you knew how to give me the energy and encouragement to flourish (“Tack för all kärlek och uppmuntran samt allt stöd som ni gett mig!”). Inger, my beloved wife, without whom this thesis and many other things in life had ever been, for your care and enormous efforts to keep up with me and my never-ending “projects” and for giving me

41
Our lovely children Andreas, Maria and Daniel, without whom my life had been diminutive, for your honesty, for the joy and for the warmth in my heart that each one of you spread when being around. Many friends, all remembered, none forgotten! This study was supported by the Swedish National Space Board, the European Space Agency and Fraenckel’s Fund for Medical Research.

42
9 REFERENCES
Adding LC, Agvald P, Artlich A, Gustafsson LE. Activation of sympathoadrenomedullary system increases pulmonary nitric oxide production in the rabbit. Eur J Pharmacol. 2001;411:311-318.
Alderton WK, Cooper CE, Knowles RG. Nitric oxide synthases: structure, function and inhibition. Biochem J. 2001;357:593-615.
Alving K, Weitzberg E, Lundberg JM. Increased amount of nitric oxide in exhaled air of asthmatics. Eur Respir J. 1993;6:1368-1370.
Arnold WP, Mittal CK, Katsuki S, Murad F. Nitric oxide activates guanylate cyclase and increases guanosine 3':5'-cyclic monophosphate levels in various tissue preparations. Proc Natl Acad Sci USA. 1977;74:3203-3207.
Artlich A, Adding C, Agvald P, Persson MG, Lonnqvist PA, Gustafsson LE. Exhaled nitric oxide increases during high frequency oscillatory ventilation in rabbits. Exp Physiol. 1999;84:959-969.
Asano K, Chee CBE, Gaston B, Lilly CM, Gerard C, Drazen JM, Stamler JS. Constitutive and inducible nitric oxide synthase gene expression, regulation, and activity in human lung epithelial cells. Proc Natl Acad Sci USA. 1994;91:10089-10093.
ATS/ERS recommendations for standardised procedures for the online and offline measurement of exhaled lower respiratory nitric oxide and nasal nitric oxide, 2005. Am J Respir Crit Care Med. 2005;171:912-930.
Bakhirkin YA, Kosterev AA, Roller C, Curl RF, Tittel FK. Mid-infrared quantum cascade laser based off-axis integrated cavity output spectroscopy for biogenic nitric oxide detection. Appl Opt. 2004 Apr 10;43(11):2257-2266.
Bannenberg GL and Gustafsson LE. Stretch-induced stimulation of lower airway nitric oxide formation in the guinea-pig: inhibition by gadolinium chloride. Pharmacol Toxicol. 1997;81:13-18.
Baraldi E, Azzolin NM, Zanconato S, Dario C, Zacchello F. Corticosteroids decrease exhaled nitric oxide in children with acute asthma. J Pediatr. 1997;131:381-385.
Baraldi E, Azzolin NM, Dario C, Carra S, Ongaro R, Biban P, Zacchello F. Effect of atmospheric nitric oxide (NO) on measurements of exhaled NO in asthmatic children. Pediatr Pulmonol. 1998;26:30-34.
Baranov VM, Tikhonov MA, Kotov AN. The external respiration and gas exchange in space missions. Acta Astronautica. 1992;27:45-50.
Barnes PJ and Kharitonov SA, Exhaled nitric oxide: a new lung function test. Thorax. 1996;51:233–237.
Beall CM, Laskowski D, Strohl KP, Soria R, Villena M, Vargas E, Alarcon AM, Gonzales C, Erzurum SC. Pulmonary nitric oxide in mountain dwellers. Nature. 2001 Nov 22;414(6862):411-412.
Brindicci C, Ito K, Resta O, Pride NB, Barnes PJ, Kharitonov SA. Exhaled nitric oxide from lung periphery is increased in COPD. Eur Respir J. 2005;26:52-59.
Brown DE, Beall CM, Strohl KP, Mills PS. Exhaled nitric oxide decreases upon acute exposure to high-altitude hypoxia. Am J Hum Biol. 2006 Mar-Apr;18(2):196-202.
Brunton TL. On the use of nitrate of amyl in angina pectoris. Lancet. 1867;90:97-98. Busch T, Bärtsch P, Pappert D, Grünig E, Hildebrandt W, Elser H, Falke KJ, Swenson ER.
Hypoxia decreases exhaled nitric oxide in mountaineers susceptible to high-altitude pulmonary edema. Am J Respir Crit Care Med. 2001;163:368-373.
Byrnes CA, Dinarevic S, Busst C, Bush A, Shinebourne EA. Is nitric oxide in exhaled air produced at airway or alveolar level? Eur Respir J. 1997a;10:1021-1025.
43
Byrnes CA, Dinarevic S, Busst CA, Shinebourne EA, Bush A. Effect of measurement conditions on measured levels of peak exhaled nitric oxide. Thorax. 1997b;52:697-701.
Cao Z, Buttner WJ, Stetter JR. The properties and applications of amperometric gas sensors. Electroanalysis. 1992;4:253-266.
Carlsen E and Comroe Jr. JH. Rate of gas uptake by intact human erythrocytes. Am J Physiol. 1956;187:590.
Carlsen E and Comroe Jr. JH. Effect of change in erythrocyte size and shape on rate of nitric oxide uptake. Fed Proc. 1957;16:19.
Carlsen E and Comroe Jr. JH. The rate of uptake of carbon monoxide and of nitric oxide by normal human erythrocytes and experimentally produced spherocytes. J Gen Physiol. 1958 Sep 20;42(1):83-107.
Chang HK. General Concepts of Molecular Diffusion. In Engel LA, Paiva M. (Eds) Gas Mixing and Distribution in the Lung. Marcel Dekker, Inc. New York, USA. 1985, pp. 1-22.
Condorelli P, Shin H-W, Aledia AS, Silkoff PE, George SC. A simple technique to characterize proximal and peripheral nitric oxide exchange using constant flow exhalations and an axial diffusion model. J Appl Physiol. 2007 Jan;102(1):417-425.
Duncan C, Dougall H, Johnston P, Green S, Brogan R, Leifert C, Smith L, Golden M, Benjamin N. Chemical generation of nitric oxide in the mouth from the enerosalivary circulation of dietary nitrate. Nat Med. 1995 Jun;1(6):546-551.
Duplain H, Sartori C, Lepori M, Egli M, Allemann Y, Nicod P, Scherrer U. Exhaled nitric oxide in high-altitude pulmonary edema: Role in the regulation of pulmonary vascular tone and evidence for a role against inflammation. Am J Respir Crit Care Med. 2000 Jul;162(1):221-224.
Dweik RA, Laskowski D, Abu-Soud HM, Kaneko F, Hutte R, Stuehr DJ, Erzurum SC. Nitric oxide synthesis in the lung. Regulation by oxygen through a kinetic mechanism. J Clin Invest. 1998 Feb 1;101(3):660-665.
Erzurum SC, Ghosh S, Janocha AJ, Xu W, Bauer S, Bryan NS, Tejero J, Hemann C, Hille R, Stuehr DJ, Feelisch M, Beall CM. Higher blood flow and circulating NO products offset high-altitude hypoxia among Tibetans. Proc Natl Acad Sci USA. 2007;104(45):17593-17598.
Forster RE, Roughton FJ, Cander L, Briscoe WA, Kreuzer F. Apparent pulmonary diffusing capacity for CO at varying alveolar O2 tensions. J Appl Physiol. 1957 Sep;11(2):277-289.
Furchgott RF and Zawadzki JV. The obligatory roll of endothelial cells in the relaxation of arterial smooth muscle by acetylcholine. Nature. 1980;288:373-376.
George SC, Hogman M., Permutt S, Silkoff PE. Modeling pulmonary nitric oxide exchange. J Appl. Physiol. 2004;96:831-839.
Girgis RE, Gugnani MK, Abrams J, Mayes MD. Partitioning of alveolar and conducting airway nitric oxide in scleroderma lung disease. Am J Respir Crit Care Med. 2002;165:1587-1591.
Guo FH, De Raeve HR, Rice TW, Stuehr DJ, Thunnissen FBJM, Erzurum SC. Continuous nitric oxide synthesis by inducible nitric oxide synthase in normal human airway epithelium in vivo. Proc Natl Acad Sci USA. 1995;92:7809-7813.
Gustafsson LE, Leone AM, Persson MG, Wiklund NP, Moncada S. Endogenous nitric oxide is present in the exhaled air of rabbits, guinea pigs and humans. Biochem Biophys Res Commun. 1991;181:852-857.
Hamid Q, Springall DR, Riveros-Moreno V, Chanez P, Howarth P, Redington A, Bousquet J, Godard P, Holgate S, Polak JM. Induction of nitric oxide synthase in asthma. Lancet. 1993;342:1510-1513.
Hoit BD, Dalton ND, Erzurum SC, Laskowski D, Strohl KP, Beall CM. Nitric oxide and cardiopulmonary hemodynamics in Tibetan highlanders. J Appl Physiol. 2005 Nov;99(5):1796-1801.

44
Hyde RW, Geigel EJ, Olszowka AJ, Krasney JA, Forster II RE, Utell MJ, Frampton MW. Determination of production of nitric oxide by lower airways of humans—theory. J Appl Physiol. 1997;82:1290-1296.
Ignarro LJ, Buga GM, Wood KS, Byrns RE, Chaudhuri G. Endothelium-derived relaxing factor produced and released from artery and vein is nitric oxide. Proc Natl Acad Sci USA. 1987 Dec;84(24):9265-9269.
Johnson Jr. RL, Heigenhauser GJF, Hsia CCW, Jones NL, Wagner PD. Determinants of gas exchange and acidbalance during exercise. In: Rowell LB, Shepard JT, eds. Handbook of Physiology. Section 12: Exercise: Regulation and Integration of Multiple Systems. New York, Oxford University Press. 1996, pp. 522-545.
Jörres RA. Modelling the production of nitric oxide within the human airways. Eur Respir J. 2000 Sep;16:555-560.
Kayser B. Disentangling hypoxia and hypobaria. Respir Physiol Neurobiol. (2009), Epub ahead of print, doi:10.1016/j.resp.2009.09.010.
Kerckx Y, Michils A, Van Muylem A. Airway contribution to alveolar nitric oxide in healthy subjects and stable asthma patients. J Appl Physiol. 2008 Apr;104:918-924.
Khan MT and Furchgott RF. Similarities of behaviour of nitric oxide (NO) and endothelium-derived relaxing factor in a perfusion cascade bioassay system. Fed Proc. 1987;46:385 (Abstract).
Kharitonov SA, Chung KF, Evans D, O’Connor BJ, Barnes PJ. Increased exhaled nitric oxide in asthma is mainly derived from the lower respiratory tract. Am J Respir Crit Care Med. 1996;153:1773–1780.
Kharitonov SA and Barnes PJ. Nasal contribution to exhaled nitric oxide during exhalation against resistance or during breath holding. Thorax. 1997 Jun;52(6):540-544.
Kharitonov SA, Donnelly LE, Montuschi P, Corradi M, Collins JV, Barnes PJ. Dose-dependent onset and cessation of action of inhaled budesonide on exhaled nitric oxide and symptoms in mild asthma. Thorax. 2002;57:889-896.
Kharitonov SA and Barnes PJ. Exhaled biomarkers. Chest. 2006;130:1541-1546. Kissoon N, Duckworth LJ, Blake KV, Murphy SP, Taylor CL, Silkoff PE. FE(NO):
relationship to exhalation rates and online versus bag collection in healthy adolescents. Am J Respir Crit Care Med. 2000;162:539-545.
Kobzik L, Bredt DS, Lowenstein CJ, Drazen J, Gaston B, Sugarbaker D, Stamler JS. Nitric oxide synthase in human and rat lung: immunocytochemical and histochemical localization. Am J Respir Cell Mol Biol. 1993;9:371-377.
Krotoszynski B, Gabriel G, O’Neill H. Characterization of human expired air: A promising investigative and diagnostic technique. J Chromatogr Sci. 1977 July;15:239–244.
Lane C, Knight D, Burgess S, Franklin P, Horak F, Legg J, Moeller A, Stick S. Epithelial inducible nitric oxide synthase activity is the major determinant of nitric oxide concentration in exhaled breath. Thorax. 2004;59:757-760.
Latch JN, Hamilton RF, Jr., Holian A, James JT, Lam CW. Toxicity of lunar and martian dust simulants to alveolar macrophages isolated from human volunteers. Inhal Toxicol. 2008;20:157-165.
Lehtimaki L, Kankaanranta H, Saarelainen S, Hahtola P, Jarvenpaa R, Koivula T, Turjanmaa V, Moilanen E. Extended exhaled NO measurement differentiates between alveolar and bronchial inflammation. Am J Respir Crit Care Med. 2001;163:1557-1561.
Liu X, Miller MJS, Joshi MS, Sadowska-Krowicka H, Clark DA, Lancaster JR. Diffusion-limited Reaction of Free Nitric Oxide with Erythrocytes. J Biol Chem. 1998;273(30):18709-18713.
Lundberg JO, Farkas-Szallasi T, Weitzberg E, Rinder J, Lidholm J, Anggaard A, Hokfelt T, Lundberg JM, Alving K. High nitric oxide production in human paranasal sinuses. Nat Med. 1995;1:370–373.
45
Lundberg JO. Airborne nitric oxide: inflammatory marker and aerocrine messenger in man. Acta Physiol Scand Suppl. 1996;633:1-27.
Malinovschi A, Jansson C, Holm L, Nordvall L, Alving K. Basal and induced NO formation in the pharyngo-oral tract influences estimates of alveolar NO levels. Appl Physiol. 2009;106:513-519.
Massaro AF, Gaston B, Kita D, Fanta C, Stamler JS, Drazen JM. Expired nitric oxide levels during treatment of acute asthma. Am J Respir Crit Care Med. 1995;152:800-803.
Moncada S and Higgs A. The L-arginine-nitric oxide pathway. N Engl J Med. 1993 Dec 30;329(27):2002-2012.
Montmerle S, Spaak J, Linnarsson D. Lung function during and after prolonged headdown bed rest. J Appl Physiol. 2002;92:75-83.
Murias JM and Zavorsky GS. Short-term variability of nitric oxide diffusing capacity and its components. Resp Physiol Neurobiol. 2007;157:316-325.
Olin A-C, Aldenbratt A, Ekman A, Ljungkvist G, Jungersten L, Alving K, Torén K. Increased nitric oxide in exhaled air after intake of a nitrate-rich meal. Respir Med. 2001;95:153-158.
Olin A-C, Bake B, Torén K. Fraction of exhaled nitric oxide at 50 mL/s: reference values for adult lifelong never-smokers. Chest. 2007;131:1852-1856.
Palmer RM, Rees DD, Ashton DS, Moncada S. L-arginine is the physiological precursor for the formation of nitric oxide in endothelium-dependent relaxation. Biochem Biophys Res Commun. 1988 Jun 30;153(3):1251-1256.
Papi A, Romagnoli M, Baraldo S, Braccioni F, Guzzinati I, Saetta M, Ciaccia A, Fabbri LM. Partial reversibility of airflow limitation and increased exhaled NO and sputum eosinophilia in chronic obstructive pulmonary disease. Am J Respir Crit Care Med. 2000;162:1773-1777.
Pauling L, Robinson AR, Teranishi R, Cary P. Quantitative analysis of urine vapor and breath by gas-liquid partition chromatography. Proc Natl Acad Sci USA. Oct 1971;68(10):2374-2376.
Persson MG, Zetterstrom O, Agrenius V, Ihre E, Gustafsson LE. Single-breath nitric oxide measurements in asthmatic patients and smokers. Lancet. 1994 Jan 15;343:146-147.
Peterson JB, Prisk GK, Darquene C. Aerosol deposition in the human lung periphery is increased by reduced-density. J Aerosol Med. 2008 Jun;21(2):159-168.
Piacentini GL, Bodini A, Vino L, Zanolla L, Costella S, Vicentini L, Boner AL. Influence of environmental concentrations of NO on the exhaled NO test. Am J Respir Crit Care Med. 1998;158:1299-1301.
Pietropaoli AP, Perillo IB, Torres A, Perkins PT, Frasier LM, Utell MJ, Frampton MW, Hyde RW. Simultaneous measurement of nitric oxide production by conducting and alveolar airways of humans. J Appl Physiol. 1999 Oct;87(4):1532-1542.
Prisk GK, Guy HJ, Elliott AR, Deutschman III RA, West JB. Pulmonary diffusing capacity, capillary blood volume, and cardiac output during sustained microgravity. J Appl Physiol. 1993;75:15-26.
Prisk GK, Fine JM, Cooper TK, West JB. Lung function is unchanged in the 1 G environment following 6-months exposure to microgravity. Eur J Appl Physiol. 2008 Aug;103(6):617-623.
Prisk GK, Fine JM, Cooper TK, West JB. Pulmonary gas exchange is not impaired 24 h after extravehicular activity. J Appl Physiol. 2005;99:2233-2238.
Ricciardolo FLM, Sterk PJ, Gaston B, Folkerts G. Nitric oxide in health and disease of the respiratory system. Physiol Rev. 2004;84:731-765.
Rimar S and Gillis CN. Selective pulmonary vasodilation by inhaled nitric oxide is due to hemoglobin inactivation. Circulation. 1993;88;2884-2887.
Robbins, RA, Barnes, PJ, Springall DR, Warren JB, Kwon, OJ, Buttery LD, Wilson, AJ, Geller DA, Polak JM, Expression of inducible nitric oxide in human lung epithelial cells. Biochem Biophys Res Commun. 1994;203:209-218.

46
Rohdin M and Linnarsson D. Differential changes of lung diffusing capacity and tissue volume in hypergravity. J Appl Physiol. 2002;93:931-935.
Roller C, Namjou K, Jeffers JD, Camp M, Mock A, McCann PJ, Grego J. Nitric oxide breath testing by tunable-diode laser absorption spectroscopy: application in monitoring respiratory inflammation. Appl Opt. 2002 Oct 1;41(28):6018-6029.
Saleh D, Ernst P, Lim S, Barnes PJ, Giaid A. Increased formation of the potent oxidant peroxynitrite in the airways of asthmatic patients is associated with induction of nitric oxide synthase: effect of inhaled glucocorticoid. FASEB J. 1998 Aug;12(11):929-937.
Schedin U, Frostell C, Persson MG, Jakobsson J, Andersson G, Gustafsson LE. Contribution from upper and lower airways to exhaled endogenous nitric oxide in humans. Acta Anaesthesiol Scand. 1995;39:327-332.
Shin H-W and George SC. Impact of axial diffusion on nitric oxide exchange in the lungs. J Appl Physiol. 2002; 93:2070-2080.
Shin H-W, Condorelli P, Rose-Gottron CM, Cooper DM, George SC. Probing the impact of axial diffusion on nitric oxide exchange dynamics with heliox. J Appl Physiol. 2004 Sep;97(3):874-882.
Shin H-W, Condorelli P, George SC. Examining axial diffusion of nitric oxide in the lungs using heliox and breath hold. J Appl Physiol. 2006 Feb;100(2):623-630.
Silkoff PE, McClean PA, Slutsky AS, Suguru Wakita HG, Chapman KR, Szalai JP, Zam N. Marked flow-dependence of exhaled nitric oxide using a new technique to exclude nasal nitric oxide. Am J Respir Crit Care Med. 1997;155:260-267.
Silkoff PE, McClean PA, Caramori M, Slutsky AS, Zamel N. A significant proportion of exhaled nitric oxide arises in large airways in normal subjects. Respir Physiol. 1998 Jul;113(1):33-38.
Silkoff PE, Sylvester JT, Zamel N, Permutt S. Airway nitric oxide diffusion in asthma: Role in pulmonary function and bronchial responsiveness. Am J Respir Crit Care Med. 2000;161:1218-1228.
Silkoff PE, McClean P, Spino M, Erlich LA, Slutsky AS, Zamel N. Dose-response relationship and reproducibility of the fall in exhaled nitric oxide after inhaled beclomethasone dipropionate therapy in asthma patients. Chest. 2001;119:1322-1328.
St. Croix C, Wetter TJ, Pegelow DF, Meyer KC, Dempsey JA. Assessment of Nitric Oxide Formation During Exercise. Am J Respir Crit Care Med. 1999;59:1125-1133.
Steerenberg PA, Nierkens S, van Loveren H, van Amsterdam JGC. A simple method to sample exhaled NO not contaminated by ambient NO from children and adults in epidemiological studies. Nitric Oxide. 2000;4:168-174.
Strömberg S, Lönnqvist PA, Persson MG, Gustafsson LE. Lung distension and carbon dioxide affect pulmonary nitric oxide formation in the anaesthetized rabbit. Acta Physiol Scand. 1997 Jan;159(1):59-67.
Stuber T, Sartori C, Salmòn CS, Hutter D, Thalmann S, Turini P, Jayet P-Y, Schwab M, Sartori-Cucchia C, Villena M, Scherrer U, Allemann Y. Respiratory nitric oxide and pulmonary artery pressure in children of aymara and European ancestry at high altitude. Chest. 2008 Nov;134(5):996-1000.
Stuehr DJ. Mammalian nitric oxide synthases. Biochim Biophys Acta. 1999 May 5;1411(2-3):217-230.
Sundblad B-M, Larsson B-M, Palmberg L, Larsson K. Exhaled nitric oxide and bronchial responsiveness in healthy subjects exposed to organic dust. Eur Respir J. 2002;20:426-431.
Tamhane RM, Johnson RL, Hsia CCW. Pulmonary Membrane Diffusing Capacity and Capillary Blood Volume Measured During Exercise From Nitric Oxide Uptake. Chest. 2001;120:1850-1856.
Taylor DR, Pijnenburg MW, Smith AD, De Jongste JC. Exhaled nitric oxide measurements: clinical application and interpretation. Thorax. 2006;61:817-827.
47
Thomas DD, Liu X, Kantrow SP, Lancaster Jr. JR. The biological lifetime of nitric oxide: Implications for the perivascular dynamics of NO and O2. Proc Natl Acad Sci USA. 2001;98:355-360.
Tsoukias NM, Tannous Z, Wilson AF, George SC. Single-exhalation profiles of NO and CO2 in humans: effect of dynamically changing flow rate. J Appl Physiol. 1998;85:642-652.
Tsoukias NM, George SC. A two-compartment model of pulmonary nitric oxide exchange dynamics. J Appl Physiol. 1998 Aug;85(2):653-666.
Tsujino I, Miyamoto K, Nishimura M, Shinano H, Makita H, Saito S, Nakano T, Kawakami Y. Production of nitric oxide (NO) in intrathoracic airways of normal humans. Am J Respir Crit Care Med. 1996;154:1370-1374.
Vaïda P, Kays C, Rivière D, Téchoueyres P, Lachaud J-L. Pulmonary diffusing capacity and pulmonary capillary blood volume during parabolic flights. J Appl Physiol. 1997;82:1091-1097.
Vallance P and Leiper J. Blocking NO synthesis: How, where and why? Nat Rev Drug Discov. 2002;1:939-950.
van der Lee I, Zanen P, Stigter N, van den Bosch JM, Lammers J-WJ. Diffusing capacity for nitric oxide: Reference values and dependence on alveolar volume. Resp Med. 2007;101:1579-1584.
Van Muylem A, Noël C, Paiva M. Modeling of impact of gas molecular diffusion on nitric oxide expired profile. J Appl Physiol. 2003;94:119-127.
van Veen IH, Sterk PJ, Schot R, Gauw SA, Rabe KF, Bel EH. Alveolar nitric oxide versus measures of peripheral airway dysfunction in severe asthma. Eur Respir J. 2006;27:951-956.
Verbanck S, Larsson H, Linnarsson D, Prisk GK, West JB, Paiva M. Pulmonary tissue volume, cardiac output, and diffusing capacity in sustained microgravity. J Appl Physiol. 1997;83:810-816.
Verbanck S, Kerckx Y, Schuermans D, Vincken W, Paiva M, Van Muylem A. Effects of airways constriction on exhaled nitric oxide. J Appl Physiol. 2008;104:925-930.
Vints A-M, Oostveen E, Eeckhaut G, Smolders M, De Backer WA. Time-Dependent Effect of Nitrate-Rich Meals on Exhaled Nitric Oxide in Healthy Subjects. Chest. 2005;128;2465-2470.
Weibel E. Morphometry of the Human Lung. New York: Springer-Verlag, 1963. Zavorsky GS, Quiron KB, Massarelli PS, Lands LC. The relationship between single-breath
diffusion capacity of the lung for nitric oxide and carbon monoxide during various exercise intensities. Chest. 2004 Mar;125(3):1019-1027.
Zavorsky GS and Murias JM. A small amount of inhaled nitric oxide does not increase lung diffusing capacity. Eur Respir J. 2006;27:1251-1257.
Zavorsky GS, Cao J, Murias JM. Reference values of pulmonary diffusing capacity for nitric oxide in an adult population. Nitric Oxide. 2008 Feb;18(1):70-79.


![oxide, and to improve asthma control in obese...recruited obese (body mass index [BMI] >30) asthmatics on controller therapy with a baseline fractional exhaled nitric oxide (FeNO)](https://static.fdocuments.us/doc/165x107/60329309f844087c8b43c44c/oxide-and-to-improve-asthma-control-in-obese-recruited-obese-body-mass-index.jpg)