Exergy and energy analysis of a load regulation method of...
53
Exergy and energy analysis of a load regulation method of CVO of air separation unit Tong, Lige; Zhang, Aijing; Li, Yongliang; Yao, Li; Wang, Li; Li, Huazhi; Li, Libing; Ding, Yulong DOI: 10.1016/j.applthermaleng.2015.01.074 License: Other (please specify with Rights Statement) Document Version Peer reviewed version Citation for published version (Harvard): Tong, L, Zhang, A, Li, Y, Yao, L, Wang, L, Li, H, Li, L & Ding, Y 2015, 'Exergy and energy analysis of a load regulation method of CVO of air separation unit' Applied Thermal Engineering, vol 80, pp. 413-423. DOI: 10.1016/j.applthermaleng.2015.01.074 Link to publication on Research at Birmingham portal Publisher Rights Statement: NOTICE: this is the author’s version of a work that was accepted for publication. Changes resulting from the publishing process, such as peer review, editing, corrections, structural formatting, and other quality control mechanisms may not be reflected in this document. Changes may have been made to this work since it was submitted for publication. A definitive version was subsequently published as L. Tong, A. Zhang, Y. Li, L. Yao, L. Wang, H. Li, L. Li, Y. Ding, Exergy and energy analysis of a load regulation method of CVO of air separation unit, Applied Thermal Engineering (2015), doi: 10.1016/j.applthermaleng.2015.01.074. General rights Unless a licence is specified above, all rights (including copyright and moral rights) in this document are retained by the authors and/or the copyright holders. The express permission of the copyright holder must be obtained for any use of this material other than for purposes permitted by law. • Users may freely distribute the URL that is used to identify this publication. • Users may download and/or print one copy of the publication from the University of Birmingham research portal for the purpose of private study or non-commercial research. • User may use extracts from the document in line with the concept of ‘fair dealing’ under the Copyright, Designs and Patents Act 1988 (?) • Users may not further distribute the material nor use it for the purposes of commercial gain. Where a licence is displayed above, please note the terms and conditions of the licence govern your use of this document. When citing, please reference the published version. Take down policy While the University of Birmingham exercises care and attention in making items available there are rare occasions when an item has been uploaded in error or has been deemed to be commercially or otherwise sensitive. If you believe that this is the case for this document, please contact [email protected] providing details and we will remove access to the work immediately and investigate. Download date: 28. May. 2018
Transcript of Exergy and energy analysis of a load regulation method of...
Exergy and energy analysis of a load regulationmethod of CVO of air separation unitTong, Lige; Zhang, Aijing; Li, Yongliang; Yao, Li; Wang, Li; Li, Huazhi; Li, Libing; Ding, Yulong
DOI:10.1016/j.applthermaleng.2015.01.074
License:Other (please specify with Rights Statement)
Document VersionPeer reviewed version
Citation for published version (Harvard):Tong, L, Zhang, A, Li, Y, Yao, L, Wang, L, Li, H, Li, L & Ding, Y 2015, 'Exergy and energy analysis of a loadregulation method of CVO of air separation unit' Applied Thermal Engineering, vol 80, pp. 413-423. DOI:10.1016/j.applthermaleng.2015.01.074
Link to publication on Research at Birmingham portal
Publisher Rights Statement:NOTICE: this is the author’s version of a work that was accepted for publication. Changes resulting from the publishing process, such aspeer review, editing, corrections, structural formatting, and other quality control mechanisms may not be reflected in this document. Changesmay have been made to this work since it was submitted for publication. A definitive version was subsequently published as L. Tong, A.Zhang, Y. Li, L. Yao, L. Wang, H. Li, L. Li, Y. Ding, Exergy and energy analysis of a load regulation method of CVO of air separation unit,Applied Thermal Engineering (2015), doi: 10.1016/j.applthermaleng.2015.01.074.
General rightsUnless a licence is specified above, all rights (including copyright and moral rights) in this document are retained by the authors and/or thecopyright holders. The express permission of the copyright holder must be obtained for any use of this material other than for purposespermitted by law.
•Users may freely distribute the URL that is used to identify this publication.•Users may download and/or print one copy of the publication from the University of Birmingham research portal for the purpose of privatestudy or non-commercial research.•User may use extracts from the document in line with the concept of ‘fair dealing’ under the Copyright, Designs and Patents Act 1988 (?)•Users may not further distribute the material nor use it for the purposes of commercial gain.
Where a licence is displayed above, please note the terms and conditions of the licence govern your use of this document.
When citing, please reference the published version.
Take down policyWhile the University of Birmingham exercises care and attention in making items available there are rare occasions when an item has beenuploaded in error or has been deemed to be commercially or otherwise sensitive.
If you believe that this is the case for this document, please contact [email protected] providing details and we will remove access tothe work immediately and investigate.
Download date: 28. May. 2018
Accepted Manuscript
Exergy and energy analysis of a load regulation method of CVO of air separation unit
Lige Tong, Ph.D, Associate Professor, Aijing Zhang, Yongliang Li, Ph.D, Lecture, LiYao, Ph.D, Professor, Li Wang, Professor, Huazhi Li, Professor, Libing Li, Professor,Yulong Ding, Ph.D, Professor
PII: S1359-4311(15)00103-9
DOI: 10.1016/j.applthermaleng.2015.01.074
Reference: ATE 6345
To appear in: Applied Thermal Engineering
Received Date: 20 October 2014
Accepted Date: 28 January 2015
Please cite this article as: L. Tong, A. Zhang, Y. Li, L. Yao, L. Wang, H. Li, L. Li, Y. Ding, Exergy andenergy analysis of a load regulation method of CVO of air separation unit, Applied Thermal Engineering(2015), doi: 10.1016/j.applthermaleng.2015.01.074.
This is a PDF file of an unedited manuscript that has been accepted for publication. As a service toour customers we are providing this early version of the manuscript. The manuscript will undergocopyediting, typesetting, and review of the resulting proof before it is published in its final form. Pleasenote that during the production process errors may be discovered which could affect the content, and alllegal disclaimers that apply to the journal pertain.
MANUSCRIP
T
ACCEPTED
ACCEPTED MANUSCRIPT
MANUSCRIP
T
ACCEPTED
ACCEPTED MANUSCRIPT
1 / 28
Exergy and energy analysis of a load regulation 1
method of CVO of air separation unit 2
Lige Tong1,2,3 Aijing Zhang1 Yongliang Li2 Li Yao4 Li Wang1,3 Huazhi Li1 3
Libing Li4 Yulong Ding2 4
1) School of Mechanical Engineering, University of Science & Technology 5
Beijing, Beijing, 100083, China 6
2) School of Chemical Engineering, University of Birmingham, Birmingham, 7
B152TT, United Kingdom 8
3) Beijing Engineering Research Center for Energy Saving and Environmental 9
Protection, University of Science and Technology Beijing, Beijing 100083, 10
China 11
4) Tangshan Tangsteel Gas Co. Ltd., Tangshan, 063016, China 12
*Corresponding author: Lige Tong, Associate Professor, Ph.D, School of 13
Mechanical Engineering, University of Science & Technology Beijing, Beijing, 14
100083, China. Email: [email protected], Tel: +86-10-62334971, Fax: 15
+86-10-62332741. 16
Aijing Zhang 17
School of Mechanical Engineering, University of Science & Technology Beijing, 18
Beijing, 100083, China. Email: [email protected], Tel: +86-10-62332741, 19
Fax: +86-10-62332741. 20
Yongliang Li 21
MANUSCRIP
T
ACCEPTED
ACCEPTED MANUSCRIPT
2 / 28
Lecture, Ph.D, School of Chemical Engineering, University of Birmingham, 22
Birmingham, B152TT, United Kingdom. Email: [email protected], Tel.: 44 23
(0)121-4145276, Fax: 44 (0)121-4145377. 24
Li Yao 25
Professor, Ph.D, Tangshan Tang steel Gas Co. Ltd., Tangshan, 063016, China. 26
Email: [email protected]. Tel: +86-10-62332741, Fax: +86-10-62332741. 27
Li Wang 28
Professor, School of Mechanical Engineering, University of Science & 29
Technology Beijing, No.30 Xueyuan Road, Haidian District, Beijing, China. 30
100083. [email protected]. Tel: +86-10-62334425, Fax: 31
+86-10-62329145. 32
Huazhi Li 33
Professor, School of Mechanical Engineering, University of Science & 34
Technology Beijing, Beijing, 100083, China. Email: [email protected]. 35
Libing Li 36
Professor, Tangshan Tang steel Gas Co. Ltd., Tangshan, 063016, China. Email: 37
Yulong Ding 39
Professor, Ph.D, School of Chemical Engineering, University of Birmingham, 40
Birmingham, B152TT, United Kingdom. Email: [email protected]. Tel 41
+441214145279, Fax: +441214145279. 42
MANUSCRIP
T
ACCEPTED
ACCEPTED MANUSCRIPT
3 / 28
Exergy and energy analysis of a load regulation 43
method of CVO of air separation unit 44
Lige Tong1,2,3 Aijing Zhang1 Yongliang Li2 Li Yao4 Li Wang1,3 Huazhi Li1 45
Libing Li4 Yulong Ding2 46
1) School of Mechanical Engineering, University of Science & Technology 47
Beijing, Beijing, 100083, China 48
2) School of Chemical Engineering, University of Birmingham, Birmingham, 49
B152TT, United Kingdom 50
3) Beijing Engineering Research Center for Energy Saving and Environmental 51
Protection, University of Science and Technology Beijing, Beijing 100083, 52
China 53
4) Tangshan Tangsteel Gas Co. Ltd., Tangshan, 063016, China 54
Abstract 55
Generally in the Chinese iron and steel industry, the electricity consumption of 56
cryogenic air separation unit (ASU) is about 14 % of the overall electricity use. To 57
reduce the electricity consumption, the combined variable oxygen (CVO) supply 58
method for ASU is proposed. The exergy calculation program for ASU was 59
developed and the detailed analysis of CVO method was performed. The results show 60
that the general exergy efficiency (GEE) of ASU combined with a liquefaction unit is 61
increased by 11 % to 31 %. The consumption of unit oxygen, the total electricity 62
consumption and the overall consumption of unit oxygen (OCUO) was compared. 63
The OCUO is a suitable method to evaluate the energy-saving potential of CVO. 64
Compared with the load regulation method of Automatic Load Control (ALC), the 65
MANUSCRIP
T
ACCEPTED
ACCEPTED MANUSCRIPT
4 / 28
OCUO and the unit consumption of compression of CVO reduced more than 4.47 % 66
and 30 %, respectively. It means that CO2 emission of every reduction 1 % of gaseous 67
oxygen release in a year in Chinese iron and steel industry will contribute 68
approximately 0.75 % to the 2020s CO2 emission reduction target of China. 69
Key words: air separation unit; variable load; exergy analysis; energy 70
consumption; CO2 emission 71
1 Introduction 72
Chinese iron and steel industry has become the largest crude steel producer in the 73
world since 1996[1], the iron and steel industry requires quantities of high-purity 74
industrial gas which would be 100 ~ 140 m3 of O2 per ton of steel, 100 ~ 140 m3 of N2 75
per of ton steel and 3 ~ 4 m3 of Ar per ton of steel. For the process of direct reduction 76
iron making, the oxygen demand should be 550 to 650 m3 per ton of steel [2]. 77
According to a report by World Steel Association in 2013, 779.04 million ton of crude 78
steel in mainland China [3] accounts for 49.23 % of the total production of the whole 79
world. It means that from 7.79 to 10.91 billion m3 of O2 is consumed by the Chinese 80
iron and steel industries. The electricity cost of cryogenic air separation unit (ASU) is 81
more than 10 billion US dollars in 2010[4]. The electricity consumption of the iron and 82
steel industry is about 15.2 % of the total electricity consumption in China in 2007 [5], 83
in which the electricity consumption of ASU and the oxygen compression and 84
transportation pipeline (OCTP) unit is about 14 % of the total electricity consumption 85
of iron and steel industries in China[6]. The data is steady in recent years. The net 86
MANUSCRIP
T
ACCEPTED
ACCEPTED MANUSCRIPT
5 / 28
demand for electricity of the industrial gases industry is 31,460 million kilowatt hours 87
(kWh) in the USA in 1998[7]. The demand increased to 39,431 million kWh in 2010, 88
which accounts for 2.8 % of the total electricity purchased by the manufacturing 89
industry and is an increase of 25.4 % compared with the amount in 1998[8]. Due to the 90
high electricity consumption of industrial gases industry, it’s meaningful to reduce its 91
electricity consumption by researching new load regulation method of ASU. 92
Most of the iron and steel industries in China have their own gas production 93
plant in which multiple ASUs operate together to supply whole customers of 94
industry or other customers rather than supply product via pipeline to multiple 95
customers [9]. The gaseous production from ASU is compressed into the OCTP unit to 96
transport to the customers. With large-scale ASU as well as large-scale blast furnaces 97
and converters, the contradiction between supply and demand of gaseous oxygen (GO) 98
has become increasingly prominent because oxygen demand in fluctuation, which 99
causes the oxygen release ratio (ORR, defined as the proportion of the amount of 100
released oxygen product to the oxygen production capacity of ASU) of China to 101
increase. To decrease the ORR in China, three measures were taken. The first is 102
automatic load control (ALC) technique. The second is the variable oxygen (VAROX) 103
supply technique made by the Linde Group [10]. The third is using the liquefaction unit 104
(LU) to liquefy excessive gaseous oxygen (EGO) into a liquid product tank [11~13]. 105
However, the load transition speed of ALC is slow [14, 15] and the ALC should be 106
configured for each ASU. Moreover, load regulation of ALC and VAROX would 107
MANUSCRIP
T
ACCEPTED
ACCEPTED MANUSCRIPT
6 / 28
change the distillation conditions of ASU [16]. In 2010, the average ORR in Chinese 108
large-scale ASUs is more than 3.0 % [11], with an example of Hangzhou Hangyang Co. 109
Ltd which uses ALC as its ORR is 3.75 % [17]. The liquefaction capacity is also 110
limited by the capacity of the liquid product tank. The other countries’ gas production 111
plant also consumed large amount of electricity purchased by the manufacturing 112
industry. Therefore, researching new operation strategies to reduce the ORR will 113
result in substantial economic benefits. 114
For variable load regulation (VLR) of ASU, the load regulation method to 115
change the distillation operation conditions such as ALC is called the internal VLR 116
method. The regulation method to change product flow and pressure in OCTP unit is 117
called the external VLR method. The variable load regulation method combining 118
ALC and LU is called Combine Variable Oxygen (CVO) supply method. This novel 119
method is as follows. Variable load operation of ASU uses ALC, combining 120
liquefaction unit in which the EGO is liquefied by LU or the cold energy recovery 121
(CER) unit using cold from liquid oxygen (LO) or liquid nitrogen (LN) from a storage 122
tank. The exergy analysis of ASU and liquefaction process of CVO is carried out. The 123
electricity consumption of ASU with CVO is compared and evaluated with the 124
electricity consumption of ASU with ALC. It provides guidance for reducing of the 125
electricity consumption of ASU in the next decade. 126
MANUSCRIP
T
ACCEPTED
ACCEPTED MANUSCRIPT
7 / 28
2 The proposed variable load regulation method 127
2.12.12.12.1 ALCALCALCALC operationoperationoperationoperation methodmethodmethodmethod 128
Cryogenic air separation is currently the most efficient technology for producing 129
large quantities of oxygen, nitrogen, and argon as gaseous or liquid products [18]. The 130
customer’s demand always has fluctuations. Therefore, ASU must rapidly change the 131
product to meet the customers’ demand. Otherwise, the EGO has to be released. 132
Today, the EGO is stored into the OCTP unit including oxygen compressor (OC), 133
oxygen pipeline and the storage tank of gaseous oxygen (GO) or LO, whose pressure 134
is maintained at 2.5 to 3.0 MPa. However, the lowest required pressure of GO in 135
steelmaking process is about 1.2 MPa. The important aim to increase the pressure of 136
the oxygen pipeline is for more storage of GO for reducing ORR and balancing 137
between the production and the demand easily. When the demand is larger than the 138
production, the GO in the sphere tank is quickly sent to the customers. Emergency 139
vents must be opened to release GO when the pressure exceeds the upper pressure 140
limits. The electricity consumption of OC could be reduced if we had a quickly load 141
regulation method of ASU. 142
There are two reasons which cause the gaseous product to release. First, it is far 143
more difficult for ASU to rapidly respond to the changing product to meet the 144
customer demand at the transition speed. The transition speed of ALC is about 145
4-5minutes per 1 % of rated load. The shorter the transition time of load change, the 146
lesser the energy consumption [15]. Besides, in many manufacturing processes, gaseous 147
MANUSCRIP
T
ACCEPTED
ACCEPTED MANUSCRIPT
8 / 28
product demand is not fixed but intermittent, especially the converter smelting process 148
where oxygen demand lasts 15 minutes while the whole cycle lasts 30 minutes. 149
Secondly, the down-regulation of the load according to the demand of one production 150
may lead to insufficient supply of another gaseous product, because the large-scale 151
ASU is a multi-product production equipment in which the production and purity of 152
one product is related to that of the other products. Moreover, the ASU would be 153
more efficient while it operates under rated load as described by Li [19]. 154
Therefore, load regulation of ASU is necessary not only to take the distillation 155
operation stability of ASU and make the balance between the production and demand 156
for each product of ASU, but also to match the customer demand with the transition 157
speed of load regulation of ASU. With the development of the production technology 158
of iron and steel industry, the ASU has to run under a load condition meeting the 159
increasing demand for GN and argon (Ar). At such load condition, more GO could 160
not be consumed leading to more EGO being released. With oxygen supply system as 161
an example, the CVO is analyzed. 162
2.22.22.22.2 CVOCVOCVOCVO regulation methodregulation methodregulation methodregulation method 163
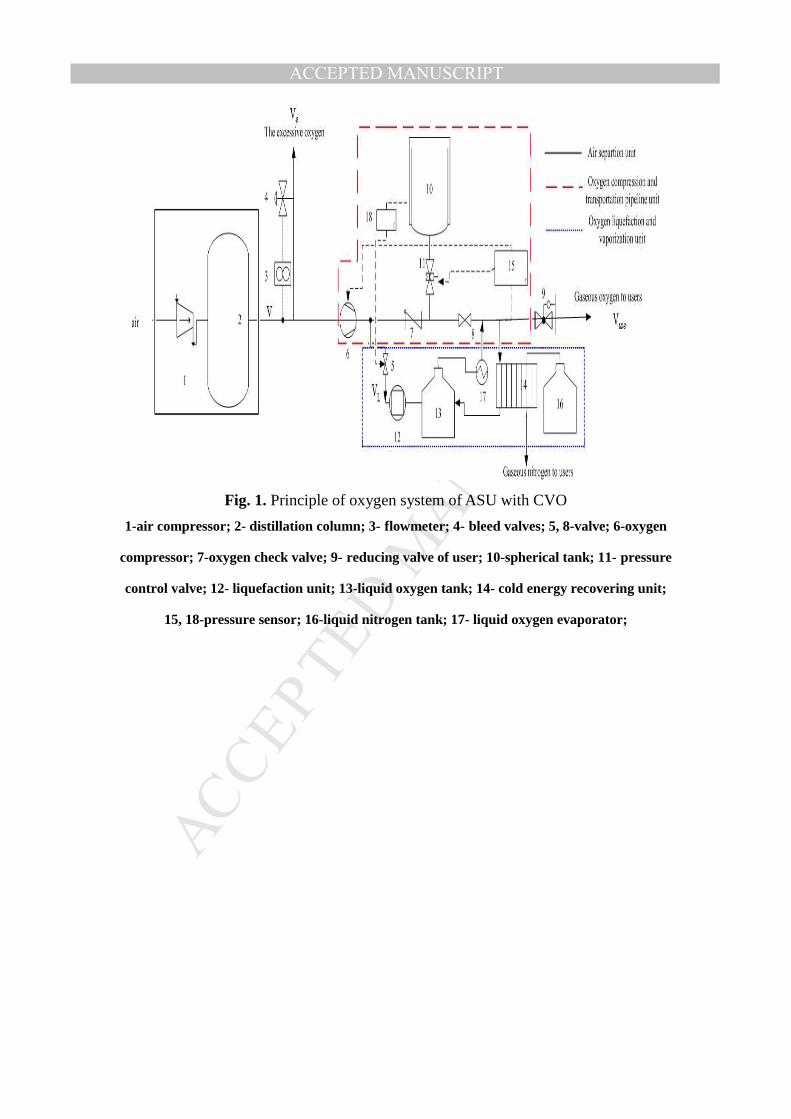
Fig.1 shows the principle of oxygen system of ASU with CVO, which consists of 164
ASU, OCTP unit, and oxygen liquefaction and vaporization unit. The product load 165
rate γ is defined as Eq. (1). The γ means the load rate of oxygen production in this 166
paper unless specified otherwise. 167
n
Vγ= 100%
V× (1) 168
MANUSCRIP
T
ACCEPTED
ACCEPTED MANUSCRIPT
9 / 28
The CVO system has two operational modes to meet the customer’s demand: 169
(1) The internal VLP method for ASU: the γ is increased closely to 100% 170
(described as section 4.1). Then, the ASU operates steadily at some constant γ, until a 171
substantial reduction of the gaseous oxygen demand lasts for more than 4 hours (such 172
as the annual repair of the blast furnace). 173
(2) The external VLP method for OCTP unit and oxygen liquefaction and 174
vaporization unit: The discharge pressure of valve 9 (see in Fig.1) is set as 1.5 MPa 175
and the average pressure of OCTP unit is maintained around 1.5 MPa. At trough 176
hours when the pressure of OCTP unit is greater than (1.5+∆p) MPa, the EGO is 177
pressurized first by an oxygen compressor and then is liquefied by the LU 12 and 178
CER unit 14 to store in the liquid tank 13. At peak hours, the oxygen demand 179
increases while the production of ASU is not enough, the GO is taken from sphere 180
tank 10 or LO evaporator 14. The principle of operation of CER unit is making the 181
liquid product exchange heat with gaseous product so that the cold energy in the 182
liquid product could be recovered. The ∆p is influenced by the capacity of OCTP unit. 183
The volume of the EGO to be liquefied is shown as Eq. (2). 184
V V Ve usel V= = − (2) 185
In the circumstances described in (1), the down-regulation of load is carried out 186
in ASU by ALC, and the EGO is liquefied into liquid storage tank by oxygen 187
liquefaction and vaporization unit consisting of LU, CER, liquid tank and LO 188
evaporator. 189
MANUSCRIP
T
ACCEPTED
ACCEPTED MANUSCRIPT
10 / 28
With the increase in γ of ASU, the amount of GO product would also raise so 190
that the instantaneous larger GO demand in steelmaking process could be met. 191
Besides, the EGO could be liquefied into a liquid tank by the oxygen liquefaction and 192
vaporization unit, stopping oxygen from being released; When the GO demand 193
becomes larger, the LO could be evaporated to users. Thus, with increased production 194
and storage of GO, the contradiction between continuous production of ASU and 195
fluctuant demand of users can be solved. 196
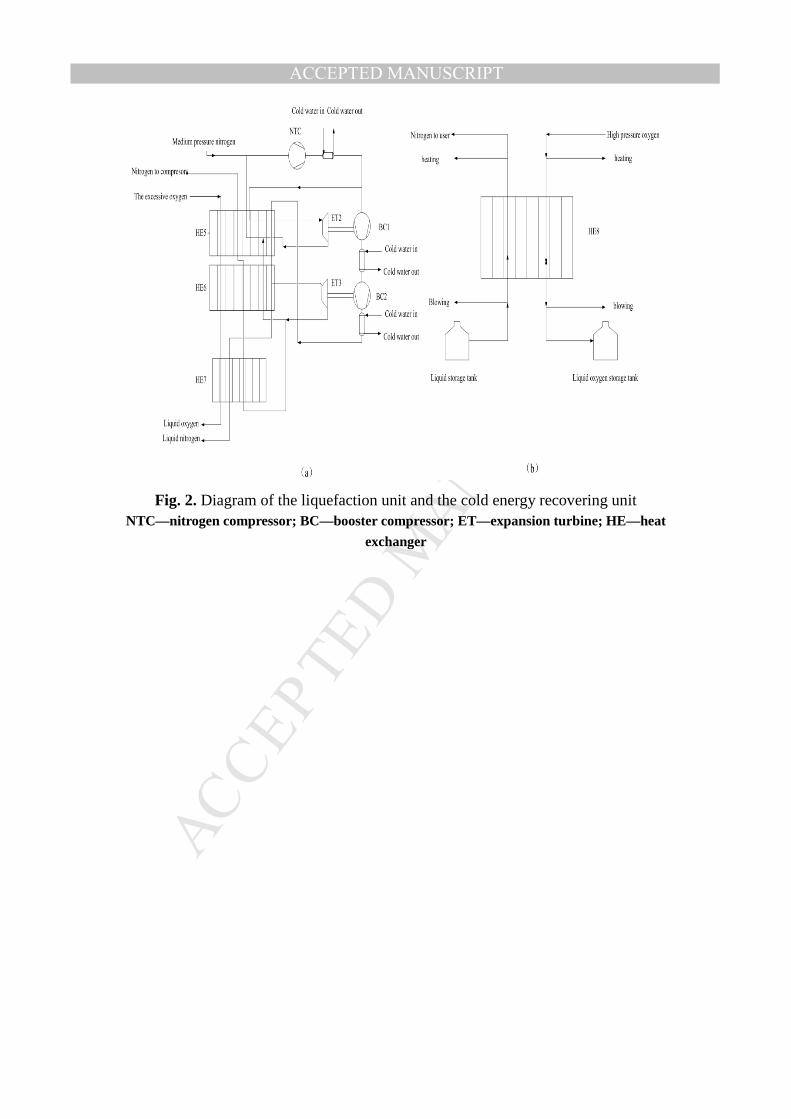
The LU of CVO, shown as Fig.2 (a), is used to liquefy the EGO. The 197
low-pressure nitrogen from ASU, mixed with the nitrogen out of heat exchanger HE5, 198
is compressed by a nitrogen compressor. Then part of the low-pressure nitrogen goes 199
through the expander ET2 to a low pressure and produces cold energy for HE5. The 200
other part of the low-pressure nitrogen undergoes two stages of booster compressors 201
BC and then is cooled by the water coolers. The nitrogen is cooled by heat exchanger 202
HE5 and HE6. Most of the nitrogen is withdrawn to expander ET3 to a specific 203
temperature; the other part of the nitrogen is cooled by heat exchanger HE7 to be LN. 204
The feed oxygen gas undergoes the heat exchangers HE5, HE6 and HE7 to be 205
liquefied as LO. 206
The CER unit including liquid product storage tank, plate heat exchanger (HE8) 207
and several throttle valves, shown as Fig.2 (b), was similar to the device in ref. 20 and 208
ref.21. The GO from OCTP system undergoes the heat exchanger E8 and then is 209
MANUSCRIP
T
ACCEPTED
ACCEPTED MANUSCRIPT
11 / 28
liquefied as LO, while the LO from liquid tank is vaporized in HE8 and then is sent to 210
OCTP system. 211
Switching time from full-liquid nitrogen conditions to full-liquid oxygen 212
conditions is about 10 minutes. Under full liquid oxygen conditions, the maximum 213
oxygen production liquefied from gaseous oxygen is 8,750 m3�h-1. The liquefaction 214
capacity of the CER unit is 5000 m3�h-1 and its start-up time is 4 min. Therefore, the 215
oxygen supply can be reduced by 13,750 m3�h-1 within 10 minutes. For example, if 216
applying the CVO, the transition speeds of eight ASUs with product capacity of 217
102,000 m3�h-1 would be 1.35 % of rated load per minute and is twice the transition 218
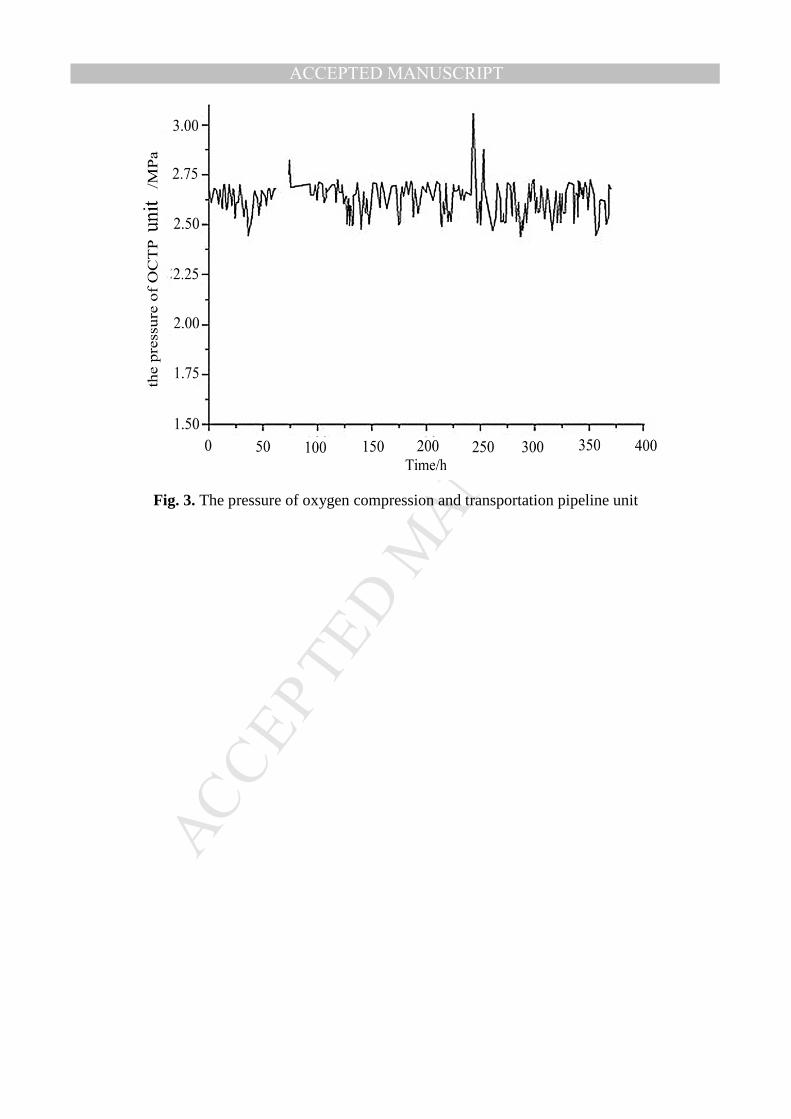
speed of the ASU with ALC. For example, the pressure of OCTP unit at different time 219
is shown in Fig.3. Fig. 3 shows the fluctuation of the pipeline pressure, which can 220
reflect the change of gaseous oxygen demand. Therefore, the shorter the transition 221
time of load change, the quicker the users’ demand is met. 222
The following summarizes three advantages of the CVO regulation: 1) The ASU 223
is running closely to rated load (detailed analysis shown in section 4.3), thus the 224
efficiency of the ASU is higher. 2) The pressure of OCTP unit runs at lower level to 225
reduce the energy consumption of compression. 3) The EGO is liquefied by the LU 226
and CER unit so that the ORR is lower and the LO production is higher. Moreover, 227
the transition speed of CVO is faster than of ALC described as in section 2.2. 228
However, the total energy consumption may increase because the LU would consume 229
a lot of electricity. 230
MANUSCRIP
T
ACCEPTED
ACCEPTED MANUSCRIPT
12 / 28
3 Exergy analysis of ASU with CVO regulation method 231
Based on the exergy analysis, a 40,000 m3�h-1 of external ASU with CVO 232
regulation method and the liquefaction system have been evaluated and the exergy 233
efficiency of single ASU is compared with the ASU combing LU . 234
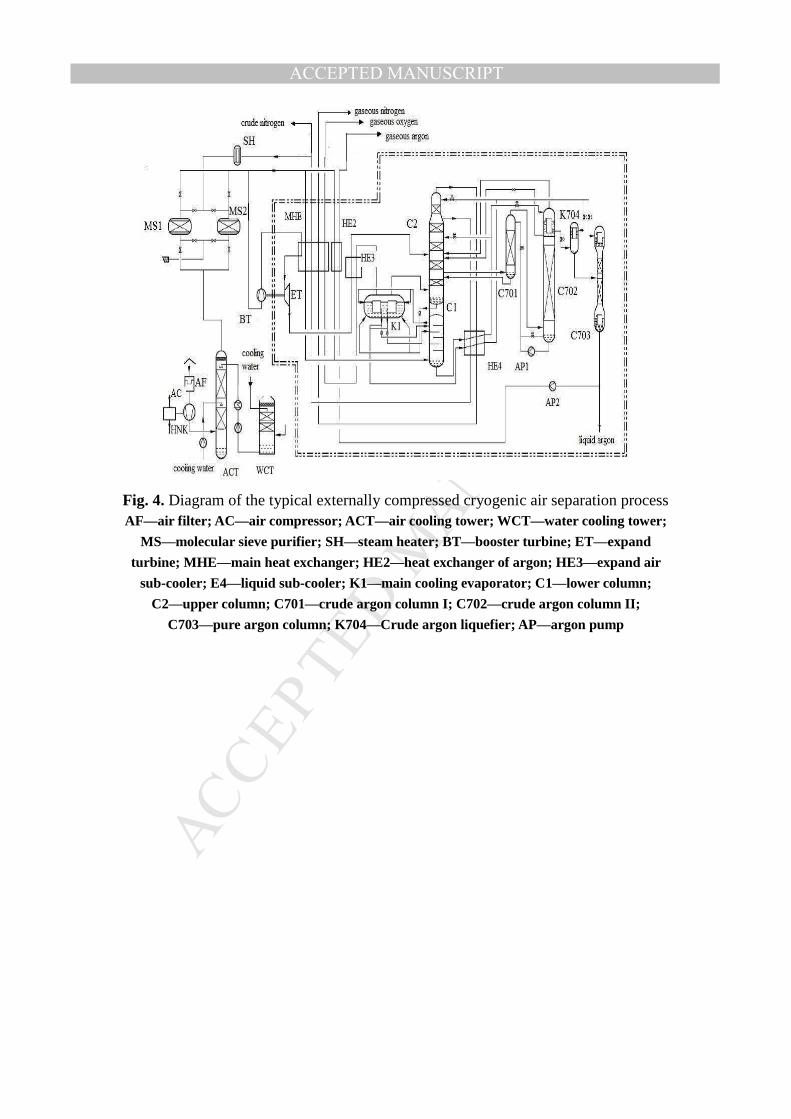
3.1 A TYPICAL EXTERNAL COMPRESSED CRYOGENIC AIR SEPARATION PROCESS 235
The external ASU studied in this paper uses the principle of two-column 236
separation based on a low- and high-pressure distillation column, shown as Fig. 4[22]. 237
Air is firstly compressed in the main air compressor (AC), and then purified to 238
remove the primary impurities such as H2O, CO2, and C2H2 via molecular sieves 239
absorbers (MS). Part of the pure air is cooled in the main heat exchanger (MHE1) to 240
saturation temperature and enters the lower column (C1). The others enter a 241
turbocharger; then the air is cooled in HE1 to 164 K and is expanded in an expansion 242
turbine (ET); subsequently, the air enters the upper column (C2). The crude argon 243
column (C701, C702 and C703) is configured in the cold box. The product index is 244
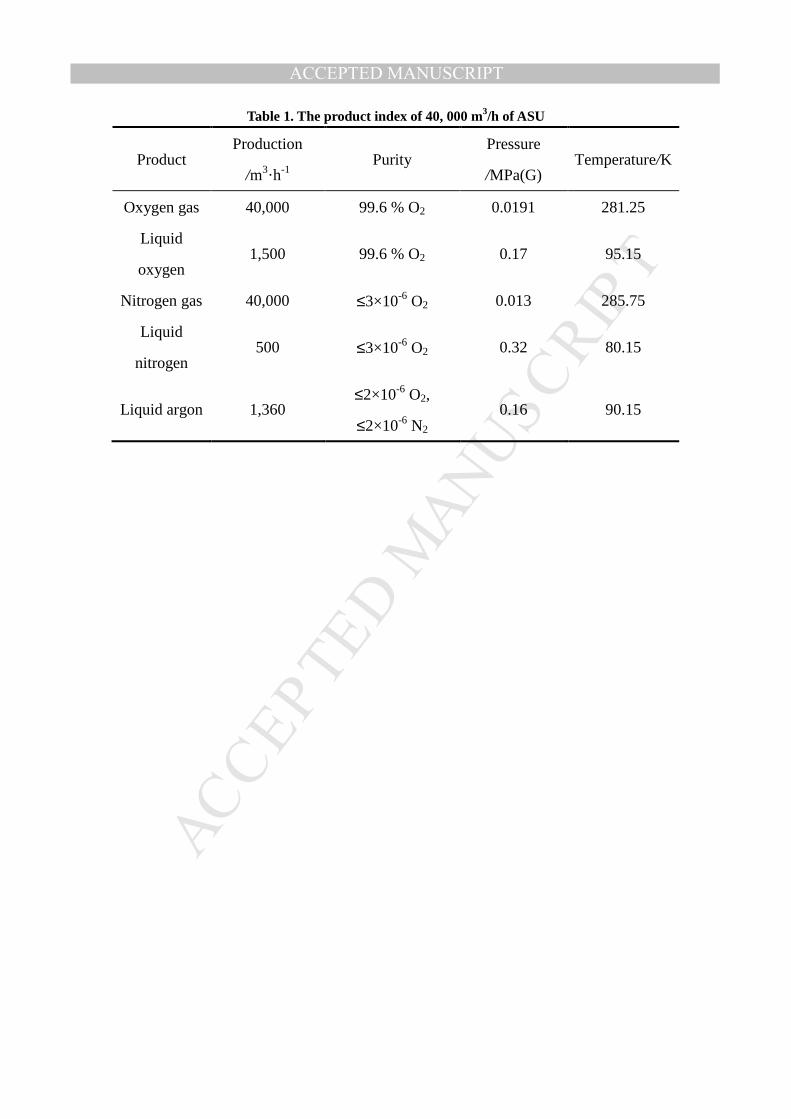
shown in Table 1. 245
3.2 The exergy efficiency 246
According to Chinese GB/T 14909-2005, named the technical guides for exergy 247
analysis in energy system, the exergy and the general exergy efficiency [23] is 248
calculated by Eq. (3) and Eq. (4), respectively. 249
mmixi
iiimim H
T
T
f
fxRTpTExpTE ∆−++=∑ ∑ )1(ln),(),( 0
00, (3) 250
MANUSCRIP
T
ACCEPTED
ACCEPTED MANUSCRIPT
13 / 28
intgen 1out
in in
E I
E Eη = = − (4) 251
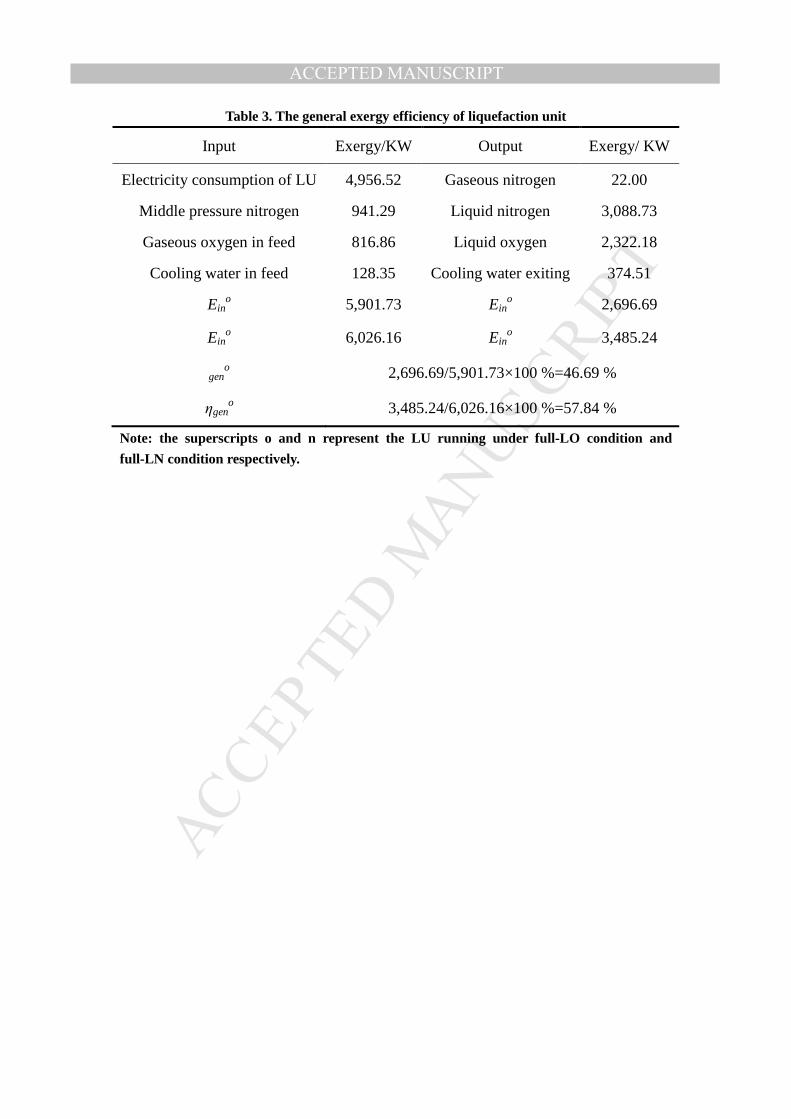
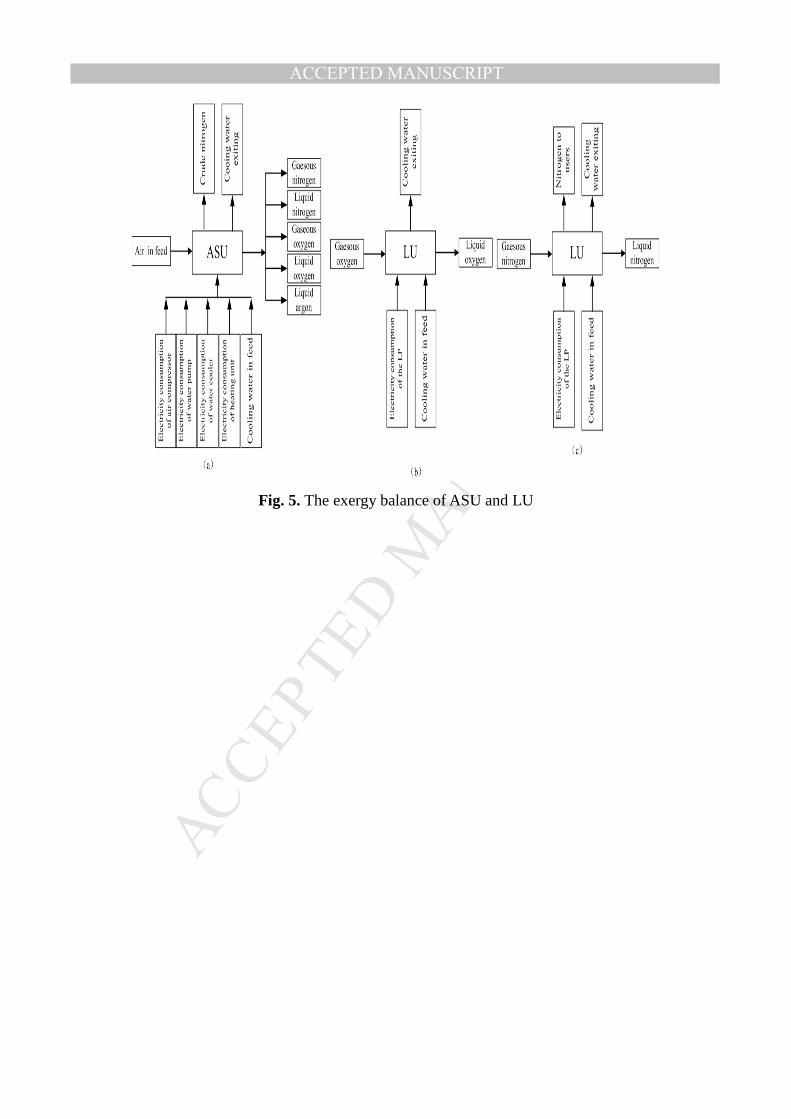
The exergy balance of ASU is shown as Fig.5 (a). The LU can be under three 252
conditions these are full-LO condition without LN production, full-LN condition 253
without LO production and liquid oxygen-nitrogen condition. The exergy balance of 254
LU under full-LO condition is shown as Fig.5 (b), whose total exergy inputs consist 255
of the exergy in the feed and the electricity consumption while the total exergy 256
outputs consist of the exergy of LO and cold water. Similarly, the exergy balance of 257
LU under full-LN condition is shown as Fig. 5(c), whose total exergy inputs consist of 258
the exergy in the feed and the electricity consumption while the total exergy outputs 259
consist of the exergy of LN and cold water. 260
The exergy calculation software for oxygen-nitrogen-argon mixed working fluid 261
based on Peng–Robinson equation of state was developed by VC ++ 6.0 [24]. 262
The general exergy efficiency (GEE) of ASU and LU is shown in Table 2 and 263
Table 3. The GEE of ASU combined with LU under full-LO condition and full-LN 264
condition is 26.33 % and 31.23 % respectively, which is 1.11 times and 1.31 times of 265
than that of single ASU respectively. It indicates that the process of ASU with LU 266
would be more efficient. 267
4 Energy analysis of the CVO regulation method 268
Exergy is the useful analysis method of an amount of energy that can be equally 269
converted into work. Exergy analysis can be used to indicate thermodynamic 270
MANUSCRIP
T
ACCEPTED
ACCEPTED MANUSCRIPT
14 / 28
efficiency of a process, including all quality losses of materials and energies. While 271
an energy analysis of a system is able to evaluate the energy consumption of the 272
proposed strategy. The energy analysis for air separation unit, OCTP unit and oxygen 273
liquefaction and vaporization unit is carried out in this section. 274
4.1 the energy analysis of the air separation unit 275
The electricity consumption of ASU varies with γ. Based on JBT 8693-1998, 276
named standard for large and medium scale air separation unit; the consumption of 277
unit oxygen (CUO) is calculated by Eq. (5). The CUO represents the electricity 278
consumption of one m3 of GO. 279
2
1
w3ASU
Olj
W
V V=
+ ∑ (5) 280
where WASU is the total electricity consumption for ASU production, including the 281
electricity of the main air compressor, auxiliary device and workshop. 282
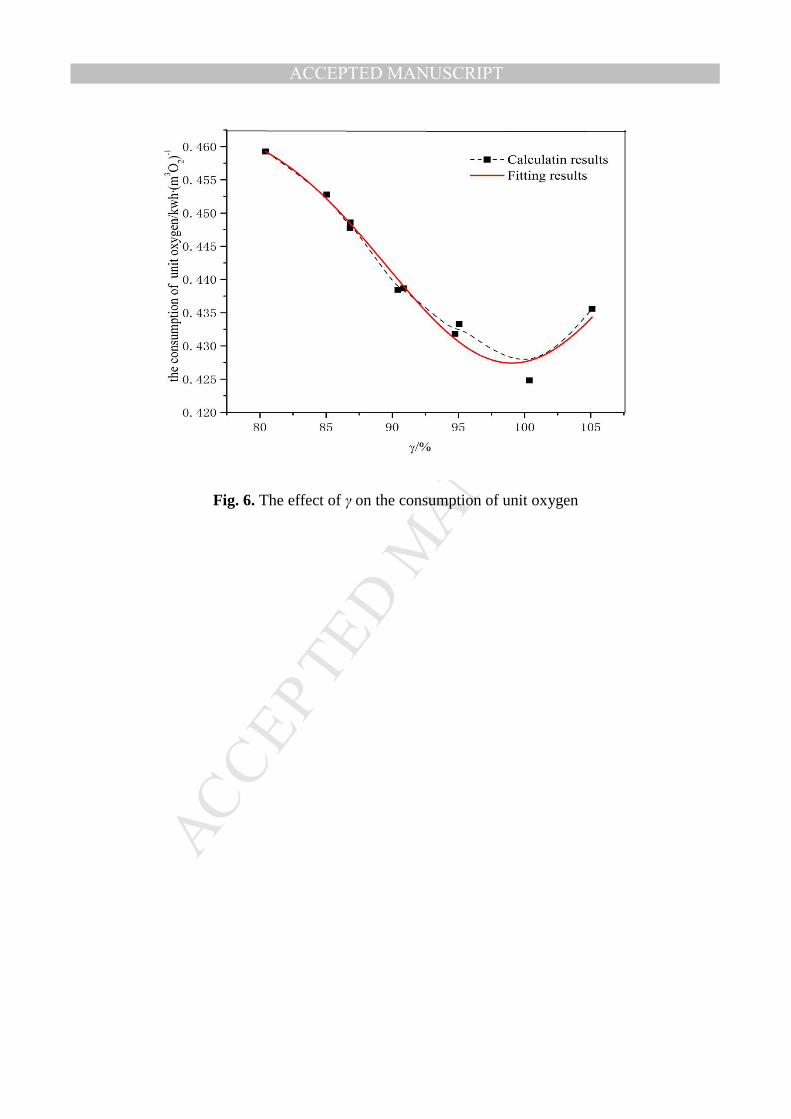
To find effects of various γ on the electricity consumption of ASU, the CUO is 283
calculated. Based on the actual operation data of the 40,000 m3�h-1 ASU, the result is 284
shown in Fig. 6. The principle of selecting such data is as follows: 285
1) Ignoring the energy consumption of air pre-purification system; 2) Ignoring the 286
effect of liquid product; 3) Based on the data including inlet airflow, gaseous oxygen 287
flow and gaseous oxygen flow at rated load, both the inlet air flow and gaseous 288
product flow changes in the same proportion, according to ref. [25]. 289
The CUO has dramatic changes with various γ. With increasing the γ, the CUO 290
reduces gradually until γ is equal to 100 %. Then the unit consumption of ASU begins 291
MANUSCRIP
T
ACCEPTED
ACCEPTED MANUSCRIPT
15 / 28
to increase if the γ continues to increase. The ranges of the unit consumption of ASU 292
with different γ is from 0.459 to 0.425 kW�h �(m3O2)-1. The CUO with γ of 80 % 293
increases by 5.99 % compared to the one with γ under rated load condition. The effect 294
of the load regulation process on the CUO is significant. It means that the appropriate 295
load regulation method can save energy. 296
4.2 The electricity analysis of the oxygen compression and transportation 297
pipeline unit 298
Thus the electricity consumption of OCTP unit would induce further if the 299
pressure of it decreases to 1.5 MPa as described in section 2.1. The electricity 300
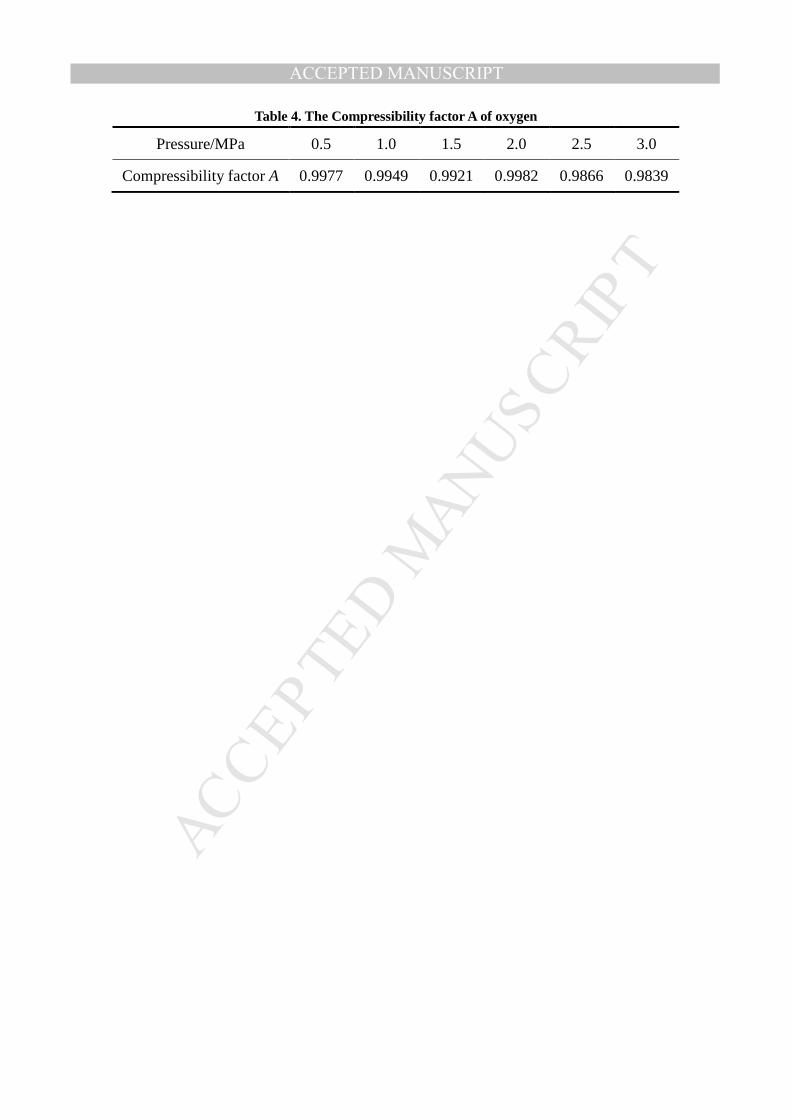
consumption of OC in OCTP unit is calculated by Eq. (6) [26]. Part of the 301
compressibility factor A calculated by the program developed in section 3.2 is listed in 302
Table 4. 303
1
11
1
k
kout
com min
pkw AR T
k pµ
− = − −
(6) 304
Ignoring the exergy of cold water and the exergy loss of the compressed oxygen 305
into the OCTP unit, the exergy analysis of the OC in OCTP unit is carried out. Its 306
exergy inputs include the exergy of inlet oxygen and electricity consumption feeding 307
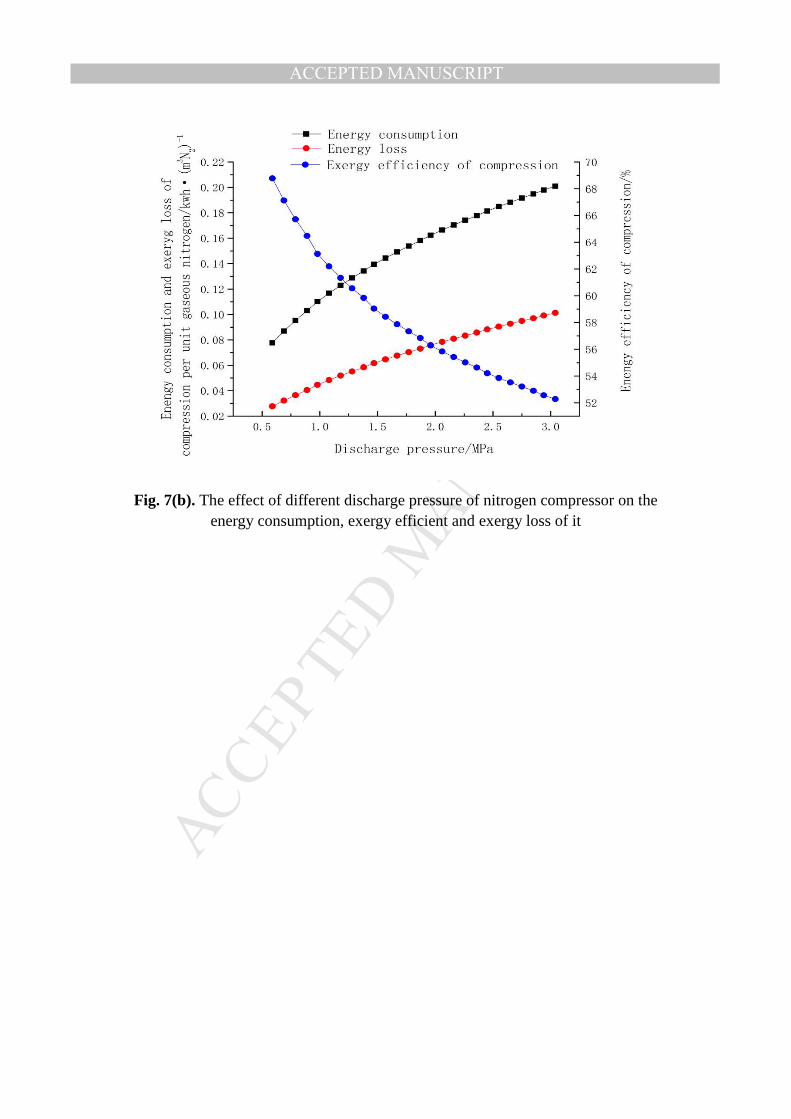
to the OC and its exergy outputs include the exergy of outlet oxygen. 308
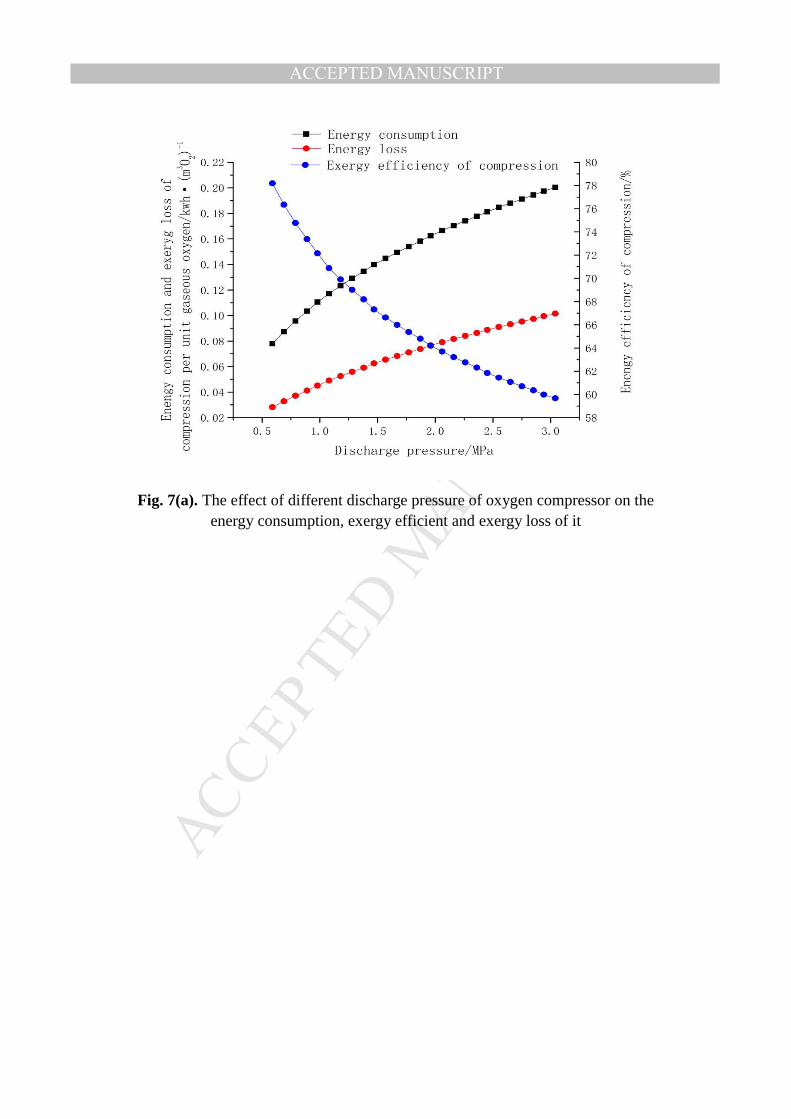
Fig. 7 shows the effect of different discharge pressures of oxygen/nitrogen 309
compressors on the electricity consumption, general exergy efficiency and exergy loss 310
of that. In Fig. 7 (a), with the discharge pressure of the OC decreasing from 3.04MPa 311
to 1.5MPa, the electricity consumption and exergy loss of the OC reduces 30.22% and 312
MANUSCRIP
T
ACCEPTED
ACCEPTED MANUSCRIPT
16 / 28
38.38% respectively, while its general exergy efficiency increases from 59.67% to 313
67.33%. Thus in order to save electricity, it is very necessary to decrease the pressure 314
of OCTP unit. Similarly, the electricity consumption, general exergy efficiency and 315
exergy loss of the nitrogen compressor at different discharge pressure are shown in 316
Fig. 7 (b). 317
4.3 Comparison of three evaluation methods at different load regulation methods 318
The total electricity consumption includes that of ASU, the OCTP unit and 319
oxygen liquefaction and vaporization unit. The total electricity consumption on three 320
cases is compared. For CASE 1, the ALC is used on ASU as described section 2.1. 321
For CASE 2 and CASE 3, the CVO is applied on ASU. The γ in CASE 2 raised only 322
5 % than before while the γ in CASE 3 increases to 100 %. The γ is made equal to 323
100 % in the above comparison process especially when the (γ +5 %) is larger than 324
100 %. Moreover, it is assumed that there is enough space for liquid storage tanks. 325
The total electricity on CASE 1, CASE2 and CASE3 is calculated by Eq. (7), Eq. 326
(8) and Eq. (9) respectively. Where VCASE1 is the production of ASU in CASE 1; Vuse 327
is the user’s demand; Vl is the EGO to be liquefied; w, wcom and wl is the consumption 328
of unit oxygen, the consumption of unit oxygen compression and the consumption of 329
unit oxygen liquefaction respectively. The VCASE1� w, Vuse� wcom and Vl� wl in Eq. (7) 330
represent the CUO, the electricity of OCTP unit and the electricity of oxygen 331
liquefaction and vaporization unit. 332
1 CASE1 use comW = V w+ V w + V wCASE ll⋅ ⋅ ⋅ (7) 333
MANUSCRIP
T
ACCEPTED
ACCEPTED MANUSCRIPT
17 / 28
2 2 22 2comuse use )W = V w+ V w + (V V wCASE CASE CASE LCASE CASE−⋅ ⋅ ⋅� �
(8) 334
3 3 33 3comuse use )W = V w+ V w + (V V w LCASE CASE CASECASE CASE−⋅ ⋅ ⋅� �
(9) 335
The consumption of unit oxygen, calculated by Eq. (10), is fitted by the data 336
derived from Fig.6. The consumption of unit oxygen compression is obtained by 337
Eq.(6) . The consumption of unit oxygen liquefaction is achieved from the actual data. 338
When 8,750 m3�h-1 of oxygen is liquefied, the electricity consumption of LU is 4, 339
956.52 kW⋅h�h-1, thus the consumption of unit oxygen liquefaction is 0.57 340
kW�h�m-3O2. 341
298.99815 18.8380( 2 (( )/ ) )1
( / 2
-0.83530.44277
18.838 1 )0vw e
π− × −×
×= + (10) 342
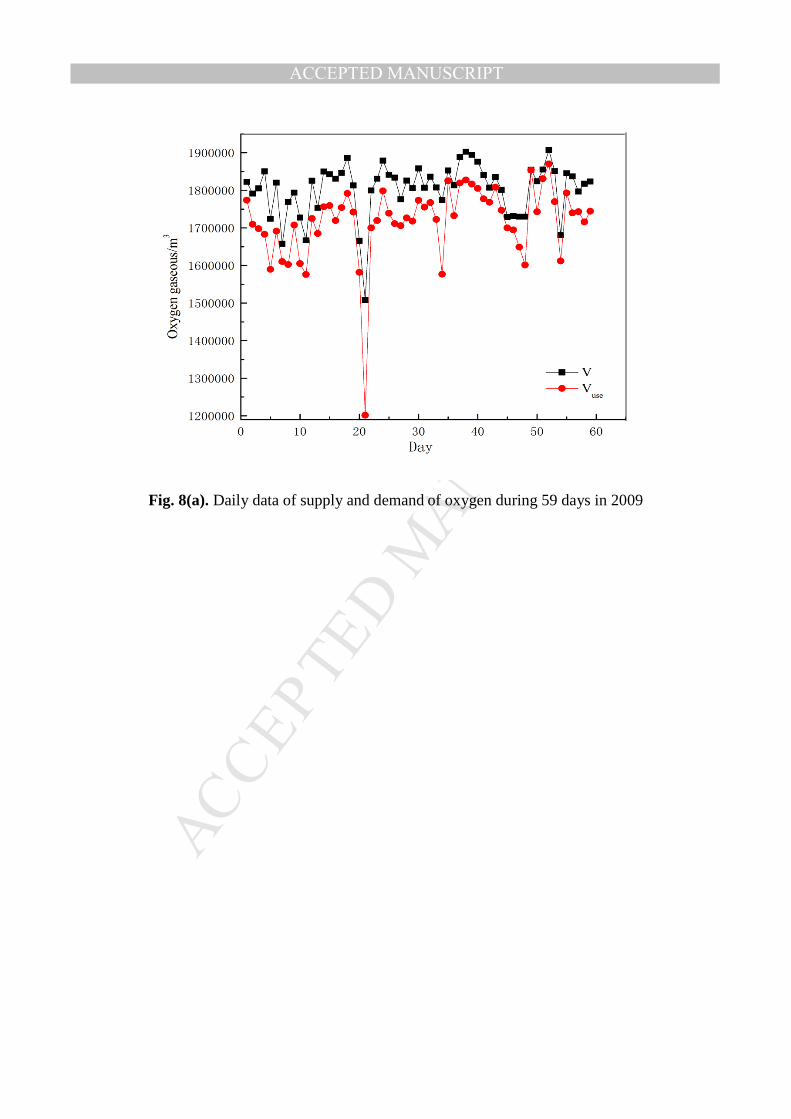
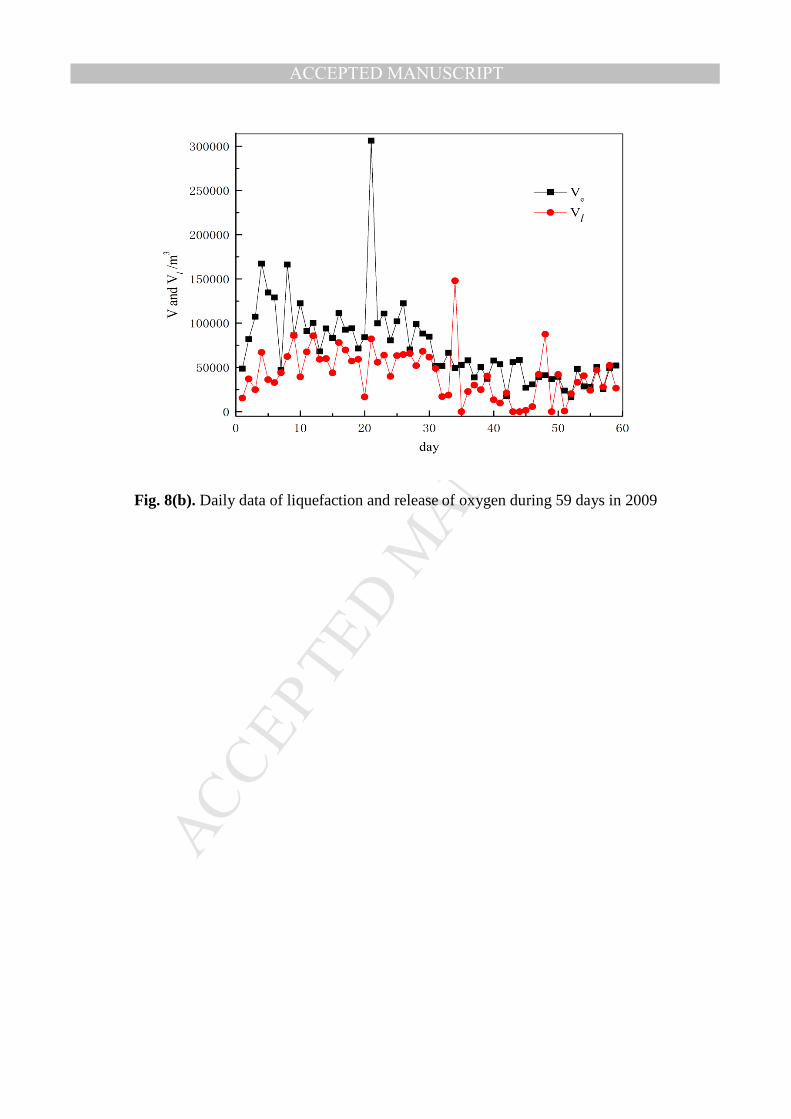
The daily data of supply and demand as well as liquefaction and release of 343
oxygen during 59 days in 2009 is shown in Fig.8. The V is always beyond Vuse. As 344
the data in Fig.8 is randomly selected, the results could be used to analyze other days 345
of the year 2009. 346
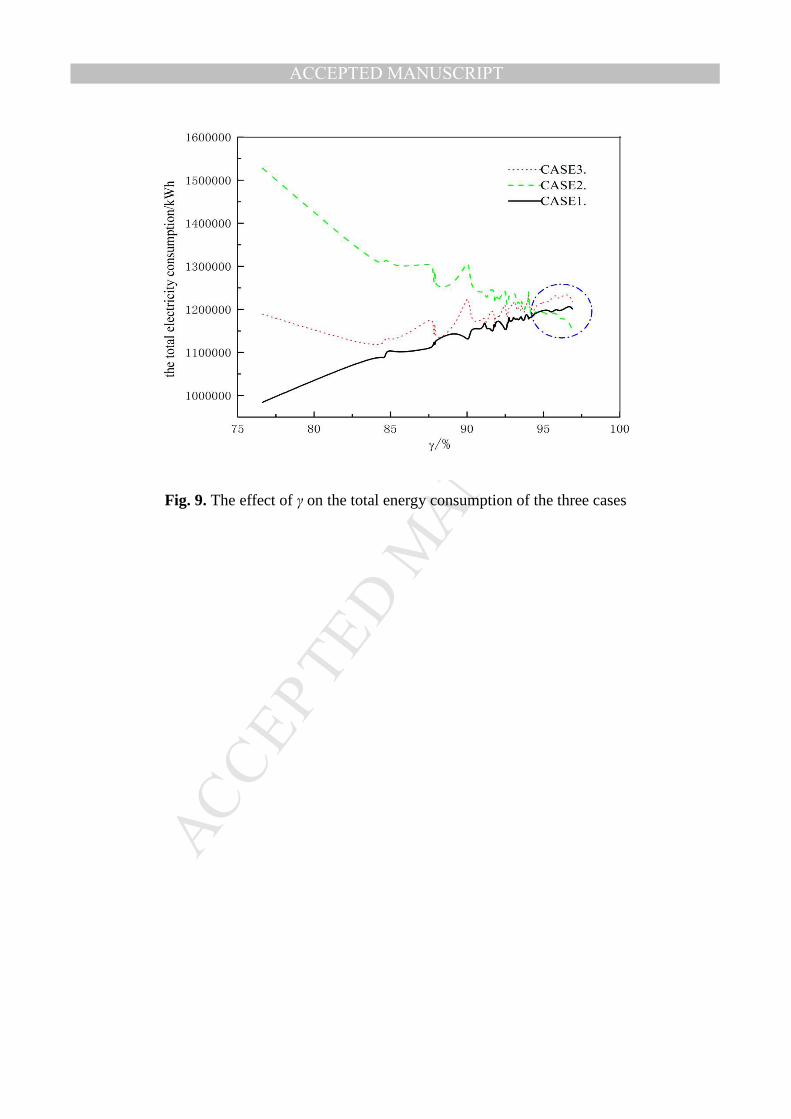
The effect of γ on the total electricity consumption on the three cases ( CASE 1, 347
CASE 2 and CASE 3) is shown in Fig. 9. The increase of γ suggests an increase of the 348
total energy consumption of CASE 1 and CASE 3 as well as the gradual reduction of 349
the total energy consumption of CASE 2. When γ varies from 84 % to 95 %, The 350
descending order of the electricity consumption on the three cases is CASE 2, CASE 351
3 and CASE 1, but the electricity consumption on CASE3 is closer to that on CASE 1. 352
While γ is greater than 95 %, the electricity consumption of CASE 2 is the lowest 353
among the three cases. It means that the total electricity consumption is influenced by 354
MANUSCRIP
T
ACCEPTED
ACCEPTED MANUSCRIPT
18 / 28
the γ. For several points in Fig.9, for example γ is equal to 76 %, 87 % and 90 %; the 355
value of V0/Vuse is greater 1.04. Thus, it can be referred that the EGO should be 356
released rather than be liquefied if the value of V0/Vuse is greater than 1.04. 357
The electricity consumption of CASE 2 is the lowest among the three cases 358
while γ is greater than 95 %, hence the CASE 2 should be studied further by applying 359
CER. The amount of EGO liquefied by CER is Vr. The medium pressure nitrogen 360
(MN) is liquefied by LO to be LN which is used to liquefy the EGO. 361
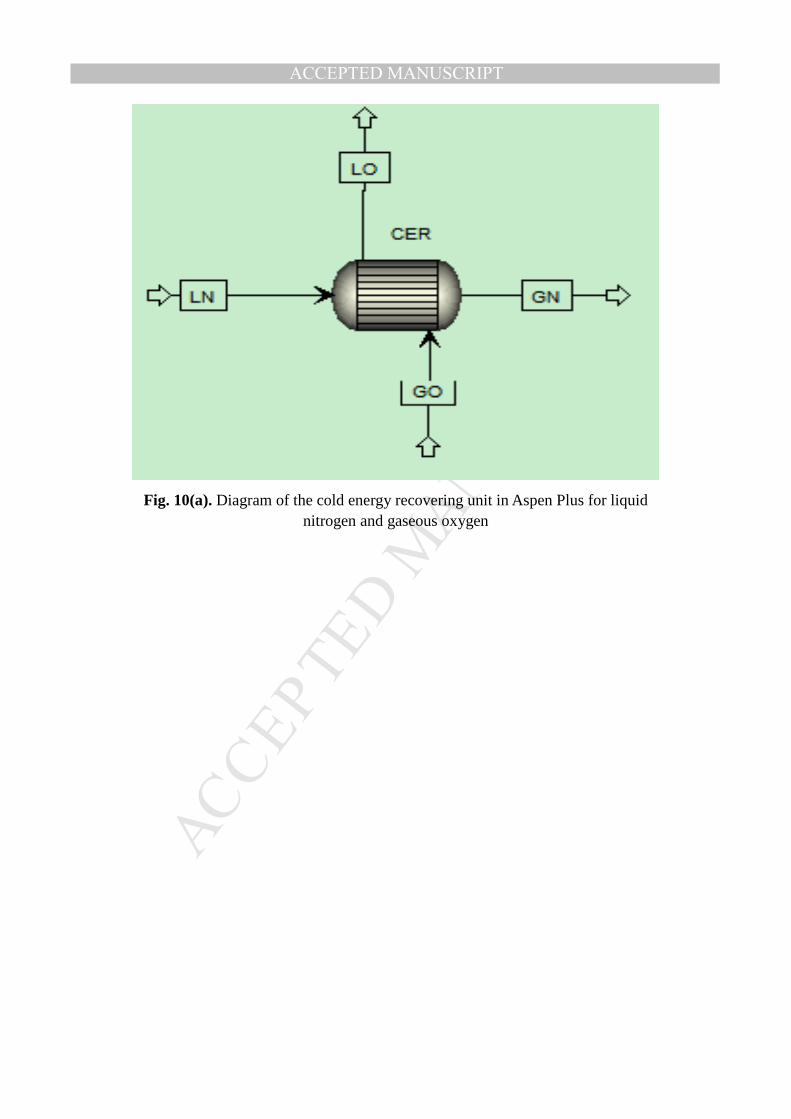
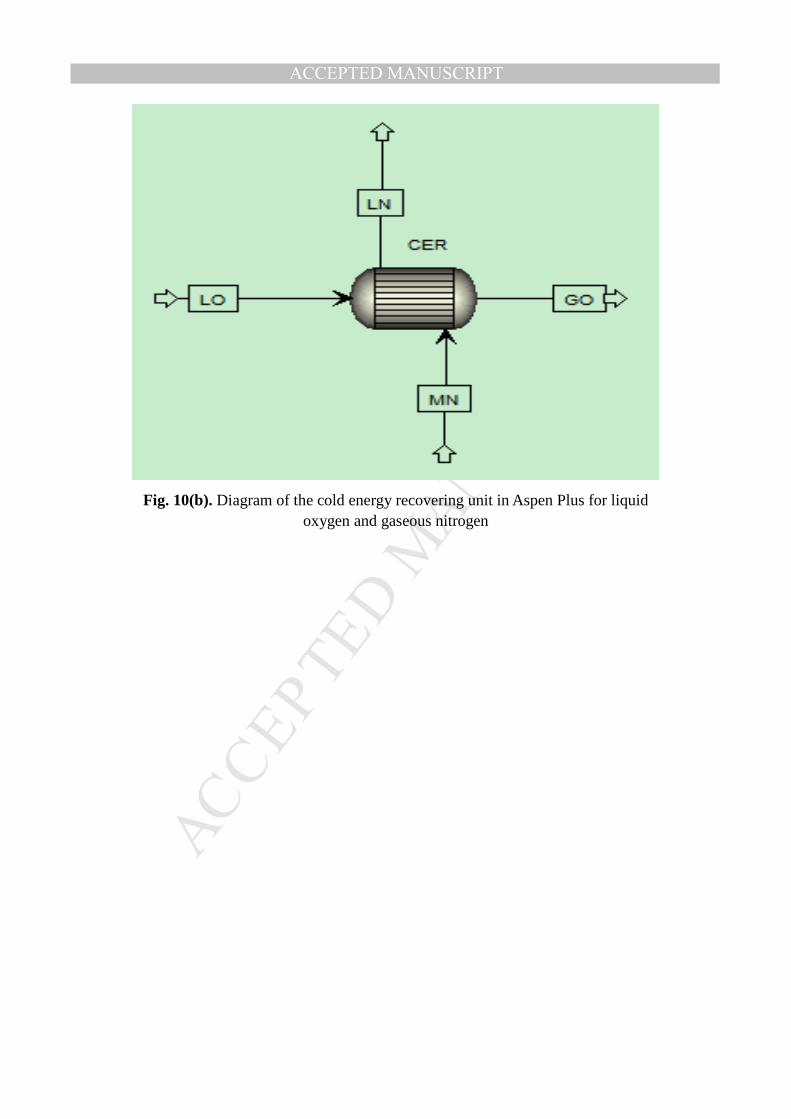
Fig.10 shows a flow diagram of the cold energy recovering unit in Aspen Plus. 362
Where, (a) represents that 1 kmol�h-1 EGO is liquefied by LN and (b) represents that 1 363
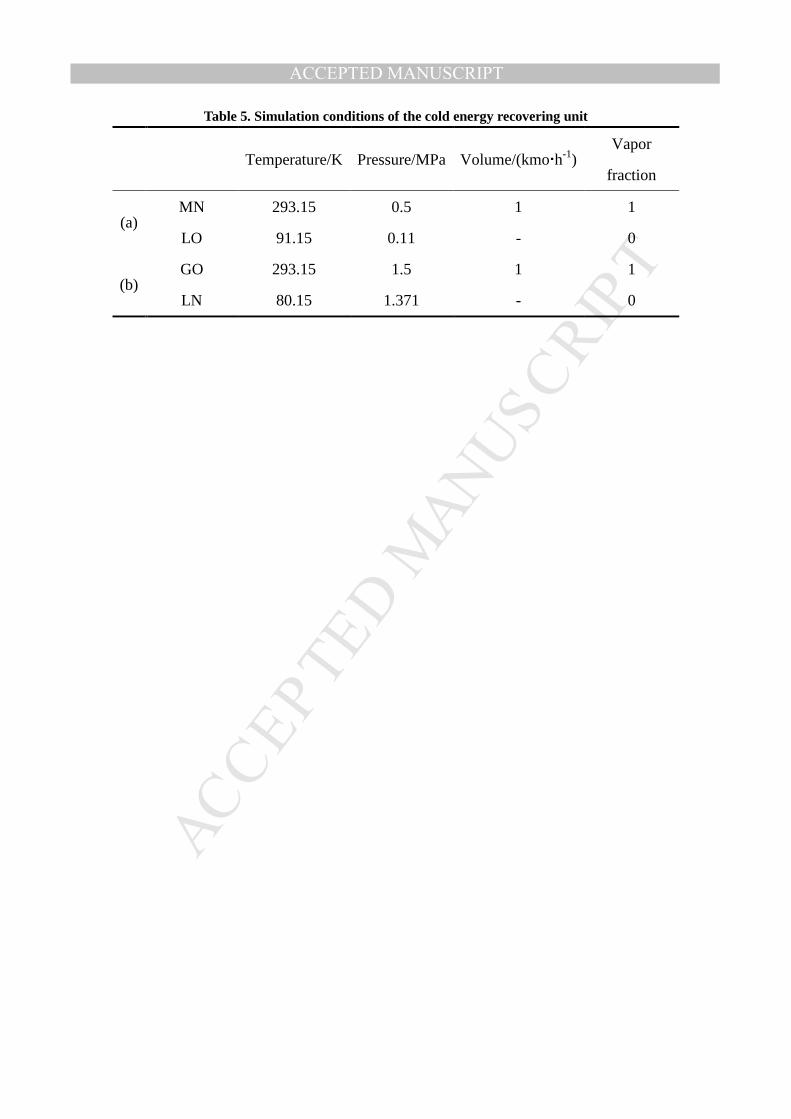
kmol�h-1 MN is liquefied by LO. Table 5 shows the simulation conditions of CER 364
process. 365
The simulation results show that liquefying 1 kmol�h-1 EGO need about 0.89 366
kmol�h-1LN, which means that the ratio of EGO and LN is 1:0.89; Liquefying 1 367
kmol�h-1 MN need about 1.6 kmol�h-1LO, which means that the ratio of LO and MN is 368
1.6:1. Such ratio would not change until the temperature and pressure of product in 369
table 5 changed. 370
The energy consumption of CER unit consists of the electricity consumption of 371
MN compression and the cold loss of liquid product exchanging heat with gaseous 372
product. 373
The electricity consumption of MN compression is calculated by Eq. (11). 374
rW V 0.896N Nw= ⋅ ⋅ (11) 375
MANUSCRIP
T
ACCEPTED
ACCEPTED MANUSCRIPT
19 / 28
where WN is the electricity consumption of MN compression; the wN is the unit 376
consumption of nitrogen compression, shown as Fig.7 (b). 377
The cold loss is calculated by Eq. (12). 378
pQ V c t= ⋅ ⋅ ∆ (12) 379
where Q is cold loss; cp is heat capacity at constant pressure; ∆t is the temperature 380
difference at warm end of CER unit. 381
Based on the conditions in table 5, the total energy consumption can be 382
calculated by Eq. (13). 383
r rr
V 0.94239 t V 1.0482 tW V 0.896
3600 1.6 3600O N
r Nw⋅ ⋅ ∆ ⋅ ⋅ ∆
= ⋅ ⋅ + +×
(13) 384
If the CER is not applied, the EGO would be released. The electricity due to the 385
EGO released is calculated by Eq. (14). 386
W = V wre ⋅ (14) 387
where We is the electricity of EGO released; w is the unit consumption of oxygen, 388
shown as Fig. 6. 389
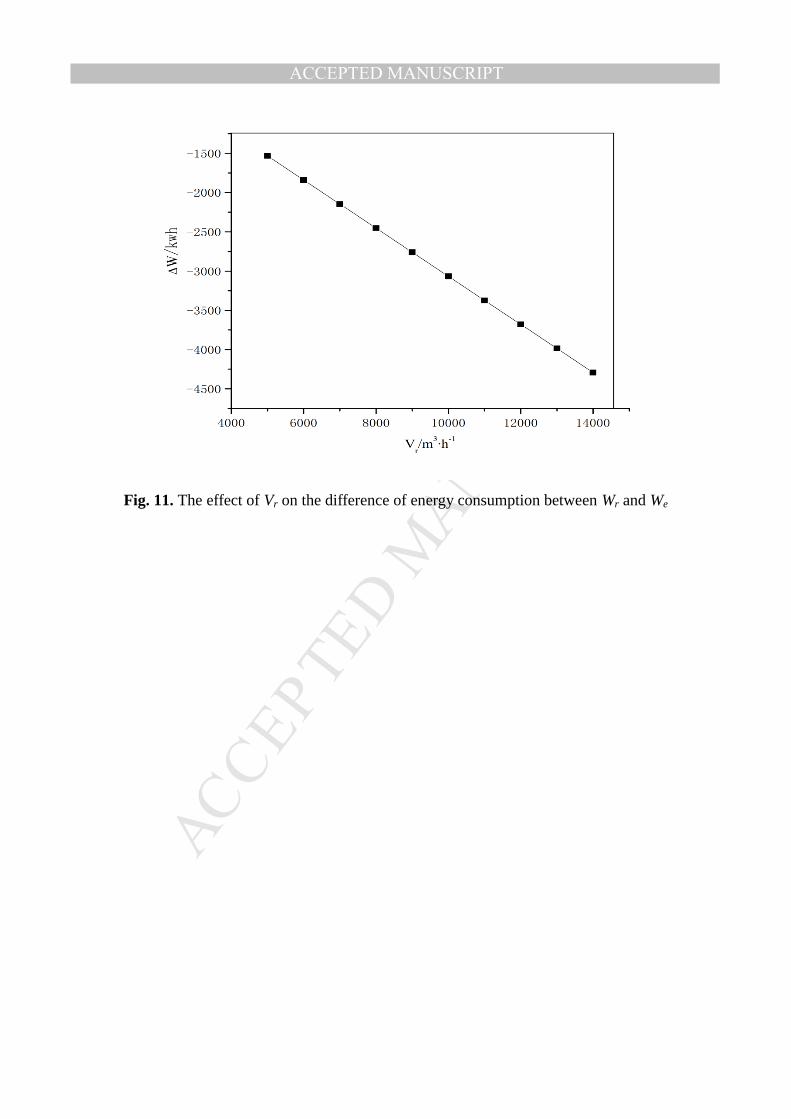
The difference of energy consumption between CER unit and EGO released is 390
set as ∆W. Fig. 11 shows the effect of Vr on such difference of energy consumption. It 391
indicates that if the ASU operates stable, Wr is always smaller than We, which means 392
that the total energy consumption of CER unit would decrease with increasing Vr. 393
Thus, applying the CER unit is an energy-saving measure. 394
The CUO is selected to evaluate the electricity consumption of various methods. 395
Table 6 lists the average of the CUO of the above three cases during 59 days in Fig. 8. 396
MANUSCRIP
T
ACCEPTED
ACCEPTED MANUSCRIPT
20 / 28
Regardless of electricity consumption of liquefaction, the CUO of CASE 2 and CASE 397
3 compared to CASE 1 reduce by 2.73 % and 1.82 % respectively, and the unit 398
consumption of oxygen compression decreases by 30 %. 399
Table 6 also reveals that the unit consumption of oxygen liquefaction is greater 400
than of ASU and compression, which means that the electricity consumption of OCTP 401
unit would increase because of using LU. 402
To evaluate the actual energy-saving potential of CVO method further, the 403
overall consumption of unit oxygen (OCUO) is selected. The OCUO is defined as the 404
ratio of the total electricity consumption and the actual amount of gaseous product Vi 405
including the gaseous product consumed and stored but not including the released 406
gases. The OCUO is calculated as Eq. (15) [27]. The other product capacities of a 407
multi-product production ASU should be converted into oxygen product capacity, the 408
converted factor can be obtained by the minimum separation work of each component 409
calculated by Eq. (16)[27]. 410
Here i=1, 2 and 3 respects O, N and Ar, respectively 411
w3
tolO
i i Lj
W
V Vα=
+∑ ∑ (15) 412
1y ln
yii
N nRT= ∑ (16) 413
It is assumed that air consists of O, N and Ar where the mole fraction of them is 414
20.95%, 78.12% and 0.93% respectively. The minimum separation work of one mole 415
of air to be separated is 62.4 kJ �(m3air)-1. 416

MANUSCRIP
T
ACCEPTED
ACCEPTED MANUSCRIPT
21 / 28
Thus the minimum separation work of oxygen is: 417
1 1N =N/y =297.80 kJ �(m3O2)-1 418
And the minimum separation work of argon is: 419
2 2N =N/y =6708.60 kJ �(m3Ar)-1 420
So, 1, 22.527, 0.026826O Ar Nα α α= = = . 421
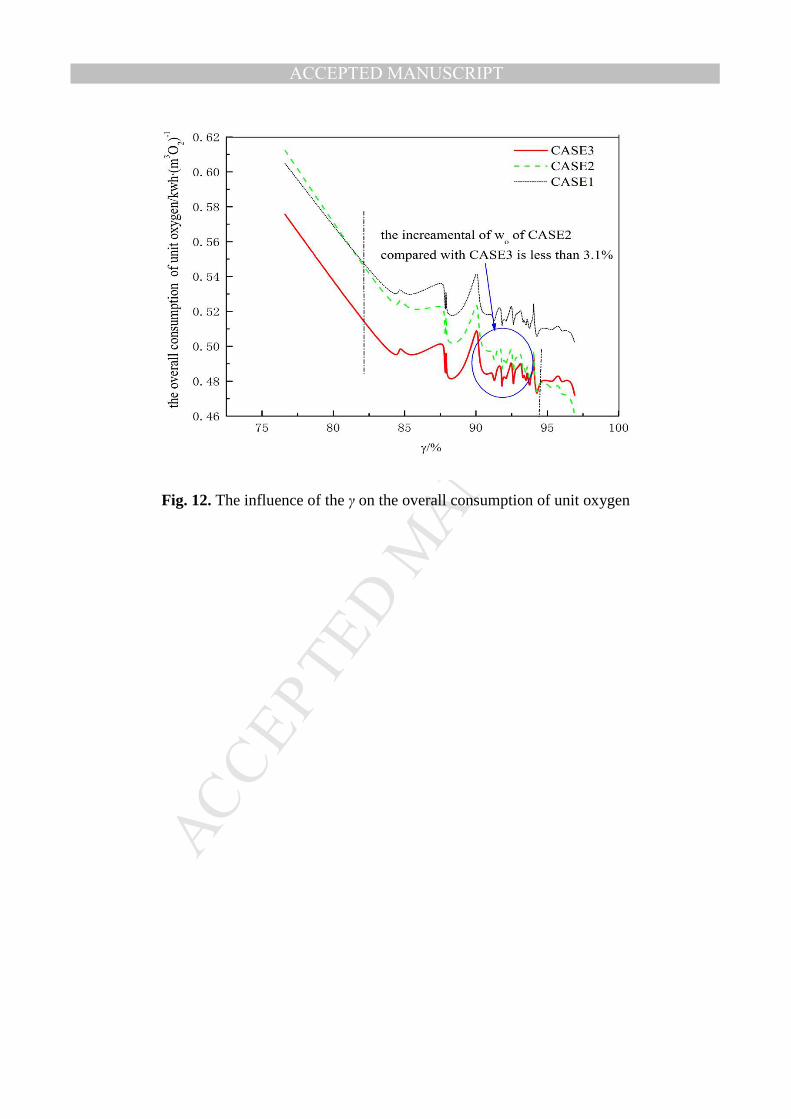
Fig. 12 shows the influence of γ on the wO on the three cases. An increase of γ 422
shows a reduction of the wO. The wO under CASE 3 and CASE 2 reduces 6.22% and 423
4.48% compared to CASE 1 respectively. When the γ is bigger than 95 %, the wO 424
under CASE 3 is greater than under CASE 2, consistent with the releations of total 425
energy shown in Fig.9. When the γ varies between 90 % and 95 %, the wO under 426
CASE 3 gets the minimum, and the incremental of wo under CASE 2 compared with 427
CASE 3 is less than 3.1%. The reason for decreasing the wO is that the Vi increases, 428
which is achieved by liquefying the EGO without oxygen released. However, the total 429
electricity consumption increases due to the liquefying process. When the γ is more 430
than 95%, the wO under CASE 2 is minimal within the lowest total elecrictiy 431
consumption, because the whole EGO is liquefied rather than released. 432
To sum up, the CVO regulation method is influenced by γ. The CVO regulation 433
method is modified based on the actual conditions as follow. When the ratio of V0 to 434
Vuse is less than 1.04 and the product rate is greater than 95 %, the ASU system should 435
operate under rated load condition. While the γ varies from 85 % to 95 %, the γ should 436
be increased by 5 %. If γ is less than 85 %, the ALC should be applied to ASU system. 437
MANUSCRIP
T
ACCEPTED
ACCEPTED MANUSCRIPT
22 / 28
While the ratio of V0 to Vuse is more than 1.04, keeping V0 constant, the EGO should 438
be released. For example, after applying the CVO regulation method, an ASU system 439
whose production is 82,000 m3/h and its OCTP unit in particular, achieves 1.25 440
million kWh electricity-saving due to the EGO being liquefied rather than be released. 441
In China, the total oxygen consumption is about 10.91 billion m3 of O2 while the 442
unit consumption of oxygen is assumed to be 0.42 kWh �(m3�O2)
-1 in 2013. If the 443
oxygen release ratio decreases by every 1 % of the above oxygen consumption, the 444
electricity-saving would be 4.58×10¹⁰ kWh for ASU system. As the CO2 emission of 445
unit electricity generated by coal-fired power generation system is 1.03 kg/kWh [28], 446
the CO2 emissions could reduce 5.28×10⁷ tons at least annually with the above 447
energy-saving. China promised to reduce the CO2 intensity by 40-45 % by 2020 from 448
2005 levels, and China’s CO2 emission reduction must exceed 6994.9 [29] million tons 449
to fulfill the promised CO2 emission reduction target of China in 2020. It can be 450
inferred that the CO2 emission reduction of iron and steel industry contributes 0.67 % 451
to China’s CO2 emission reduction in 2020 if the oxygen releasing rate decreases by 452
every 1 % of gaseous oxygen consumption in 2013. 453
5555 CCCConclonclonclonclusionusionusionusion 454
Aiming at achieving energy savings and reducing oxygen release ratio, the 455
exergy calculation program was devoloped. Besides, the unit consumption of oxygen, 456
the total energy consumption and the overall unit consumption of oxygen were 457
MANUSCRIP
T
ACCEPTED
ACCEPTED MANUSCRIPT
23 / 28
selected to determine energy-saving of different load regulation method. After that, 458
the CVO regulation method is proposed for ASU 459
Compared with the current regulation method, the CVO regulation strategy 460
presented in the paper has following features. 461
(1) The contradiction between continuous production of ASU and fluctuant 462
demand of users can be solved, because of increase of production and storage of 463
gaseous oxygen. 464
(2) The transition speed of CVO regulation method is about 3.125 %/min twice 465
as the transition speed of current regulation method. 466
(3) The general exergy efficiency of ASU combining with liquefaction unit is 467
increased by 11 % to 31 %. The OCUO is suitable method to evaluate the 468
energy-saving potential of CVO. The OCUO and the unit consumption of 469
compression of CVO reduced more than 4.47 % and 30 %, respectively. Besides, 470
using the cold energy recovering unit is an energy-saving way. 471
(4) The proposed regulation method is related to product load rate. While the 472
product load rate is more than 95 %, the ASU operates under rated load and the CVO 473
regulation method is energy-saving. 474
AcknowledgementsAcknowledgementsAcknowledgementsAcknowledgements 475
This study is supported by the National Natural Science Foundation of China 476
(Grant No. 51206010), National Basic Research Program of China (973 Program) 477
(No.2012CB720406) and the CSC Scholarship. 478
MANUSCRIP
T
ACCEPTED
ACCEPTED MANUSCRIPT
24 / 28
479
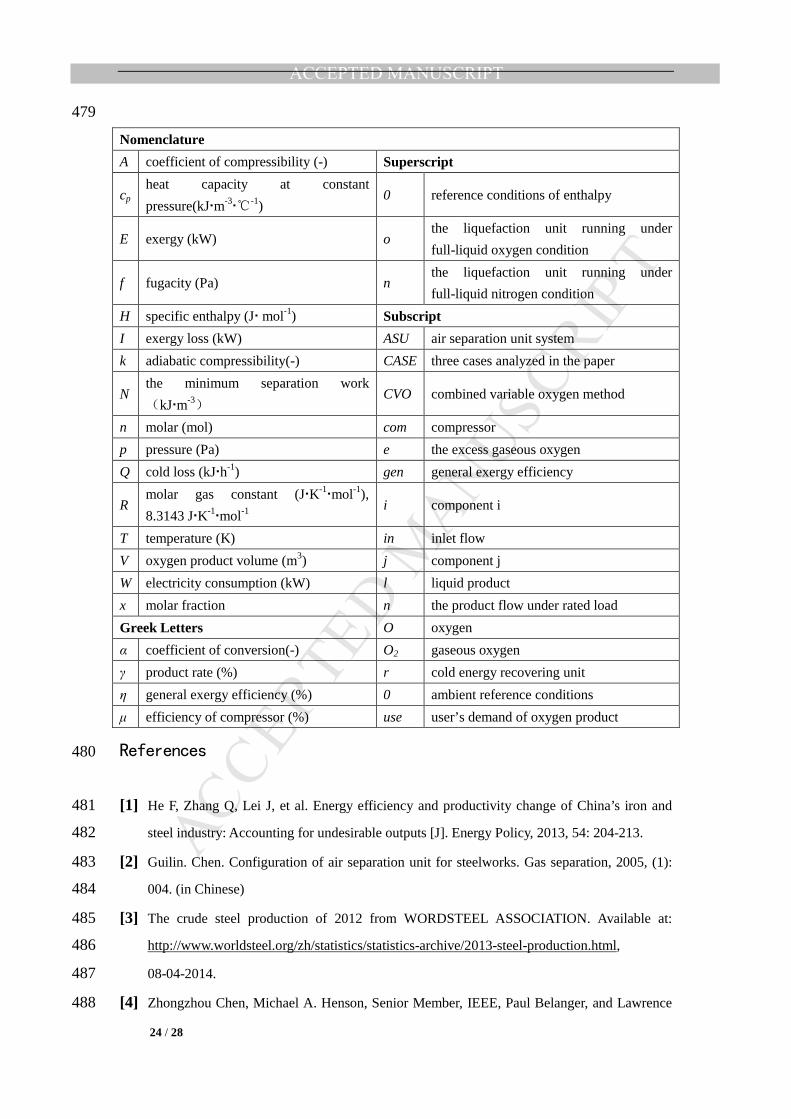
Nomenclature
A coefficient of compressibility (-) Superscript
cp
heat capacity at constant
pressure(kJ�m-3�
-1) 0 reference conditions of enthalpy
E exergy (kW) o
the liquefaction unit running under
full-liquid oxygen condition
f fugacity (Pa) n the liquefaction unit running under
full-liquid nitrogen condition
H specific enthalpy (J� mol-1) Subscript
I exergy loss (kW) ASU air separation unit system
k adiabatic compressibility(-) CASE three cases analyzed in the paper
N the minimum separation work
kJ�m-3 CVO combined variable oxygen method
n molar (mol) com compressor
p pressure (Pa) e the excess gaseous oxygen
Q cold loss (kJ�h-1) gen general exergy efficiency
R molar gas constant (J�K-1
�mol-1),
8.3143 J�K-1�mol-1 i component i
T temperature (K) in inlet flow
V oxygen product volume (m3) j component j
W electricity consumption (kW) l liquid product
x molar fraction n the product flow under rated load
Greek Letters O oxygen
α coefficient of conversion(-) O2 gaseous oxygen
γ product rate (%) r cold energy recovering unit
η general exergy efficiency (%) 0 ambient reference conditions
µ efficiency of compressor (%) use user’s demand of oxygen product
References 480
[1] He F, Zhang Q, Lei J, et al. Energy efficiency and productivity change of China’s iron and 481
steel industry: Accounting for undesirable outputs [J]. Energy Policy, 2013, 54: 204-213. 482
[2] Guilin. Chen. Configuration of air separation unit for steelworks. Gas separation, 2005, (1): 483
004. (in Chinese) 484
[3] The crude steel production of 2012 from WORDSTEEL ASSOCIATION. Available at: 485
http://www.worldsteel.org/zh/statistics/statistics-archive/2013-steel-production.html, 486
08-04-2014. 487
[4] Zhongzhou Chen, Michael A. Henson, Senior Member, IEEE, Paul Belanger, and Lawrence 488
MANUSCRIP
T
ACCEPTED
ACCEPTED MANUSCRIPT
25 / 28
Megan. Nonlinear model predictive control of high purity distillation columns for cryogenic 489
air separation [J]. Control Systems Technology, IEEE Transactions on, 2010, 18(4): 811-821. 490
[5] Z.C. Guo, Z.X. Fu. Current situation of energy consumption and measures taken for energy 491
saving in the iron and steel industry in China [J]. Energy, 2010, 35 (11): 4356-4360. 492
[6] Lige Tong, Li Wang, Yanping Zhang, Huazhi Li. The oxygen utilization decision support 493
system and operation simulation system for air separation units [J]. Iron and Steel (Beijing), 494
2003, 38(3): 53-56.(in Chinese) 495
[7] Karwan MH, Keblis M. Operations planning with real time pricing of a primary input. 496
Computers & Operation Research. 2007, 34(3): 848-867. 497
[8] Energy information association. Manufacturing energy consumption survey. Available at: 498
http://www.eia.doe.gov/consumption/manufacturing/data/2010/#r1.html, 019-09-2014. 499
[9] Vinson D R. Air separation control technology [J]. Computers & Chemical Engineering, 500
2006, 30(10): 1436-1446. 501
[10] Xueshen Yang. 50000m3/h air separation plant employing quick variable-load model made by 502
Linde. Cryogenic Technology, 2003,(4): 22-25.(in Chinese) 503
[11] Jianqing Chen. Baosteel's practice of reducing the oxygen emission rate [J]. Energy for 504
Metallurgical Industry, 2012, 31(3): 9-10.(in Chinese) 505
[12] Chenglong Li. Analysis of the operation to balance the oxygen supply-demand pipeline net 506
[J]. Cryogenic Technology, 2012, (3): 10-12. (in Chinese) 507
[13] Luanfeng Zhai, Wenqiang Lin. Summary on measures for reducing oxygen bleeding from air 508
separation unit at steel enterprises [J]. Cryogenic Technology, 2008, (3): 61-63. (in Chinese) 509
[14] Junfen Liu. Automatic load control technique for air separation plants [J]. Cryogenic 510
Technology. 2002, (4): 14-16. (in Chinese) 511
[15] B.Roffel, B.H.LBetleln, J.A.EdeRuijter. First principles dynamic modeling and multivariable 512
control of a cryogenic distillation process [J]. Computer & Chemical Engineering, 2000, 24: 513
111-123. 514
[16] Lvnan Fu, Chengan Wu. Feasibility analysis of the application of interchange of LO2 and 515
LN2 to 10000m3/h air separation unit [J]. Cryogenic Technology, 2003, (4): 9-14. (in 516
Chinese) 517
[17] Xu Z, Zhao J, Chen X, et al. Automatic load change system of cryogenic air separation 518
process [J]. Separation and Purification Technology, 2011, 81(3): 451-465. 519
[18] R.L Cornelissen, G.G Hirs. Exergy analysis of cryogenic air separation [J]. Energy 520
Conversion and Management, 1998, 39(16): 1821-1826. 521
MANUSCRIP
T
ACCEPTED
ACCEPTED MANUSCRIPT
26 / 28
[19] Huazhi Li, Lige Tong, Ting Gao. Economic operation analysis on modern air separation unit: 522
Part II--Production with multi-product [J]. Gases Separation, 2012, (5): 19-24. (in Chinese) 523
[20] Enwei Sun, Changhong Sun. Technique involving recovering the refrigeration capacity of 524
liquid argon [J]. Cryogenic Technology, 2002, (5): 13-15. (in Chinese) 525
[21] Bernd Ameel, Christophe T'Joen, Kathleen De Kerpel, Peter De Jaeger, Henk Huisseune, 526
Marnix Van Belleghem, Michel De Paepe. Thermodynamic analysis of energy storage with a 527
liquid air Rankine cycle [J]. Applied Thermal Engineering, 2013, 52(1):130-140. 528
[22] Hualing Fu, Xinzhong, Shumei Cai, Jianmin Ning. Configuration and summarization of 529
operation of two sets of 40000m3/h air separation plant of Bayi Iron & Steel [J]. Cryogenic 530
Technology, 2012, (2): 17-20. (in Chinese) 531
[23] L.V. Van der Ham. Improving the exergy efficiency of a cryogenic air separation unit as part 532
of an integrated gasification combined cycle [J]. Energy Conversion and Management, 2012, 533
61: 31-42. 534
[24] Li Yao, Lige Tong, Yunfei Xie, Jianbiao Shen, Shiqi Li. Exergy Analysis for Air Separation 535
Unit [J]. Industrial Heating, 2013, (2): 22-24. (in Chinese) 536
[25] Fugen Xu, Jianyu Wan, Li Wang. Analysis and computation of main operating parameters for 537
variable load adjustment of air separation unit [J]. Cryogenic Technology, 2006, (04): 38-46. 538
(in Chinese) 539
[26] Chunyang Dong, Li Wang, Yanping Zhang. Energy consumption structure of air-separation 540
products in steel plants [J]. Journal of University of Science and Technology Beijing, 2008, 541
30(11): 1307-1311. (in Chinese) 542
[27] Huazhi Li. Technology of oxygen production (the second edition) [M]. Beijing: Metallurgical 543
Industry Press, 2009. (in Chinese) 544
[28] Ping Hou, Hongtao Wang, Hao Zhang, Dong Ci, Na Huang. Greenhouse gas emission factor 545
of Chinese power grids for organization and product carbon footprint [J]. China Environment 546
Science, 2012, 32(6): 961-967. (in Chinese) 547
[29] Xia Chen, Li Wang, Lige Tong. Energy saving and emission reduction of China’s urban 548
district heating [J]. Energy Policy, 2013, 55: 677-682. 549
550
MANUSCRIP
T
ACCEPTED
ACCEPTED MANUSCRIPT
27 / 28
Tables 551
Table 1 The product index of 40, 000 m3/h of ASU 552
Table 2 The general exergy efficiency of ASU under rated load condition 553
Table 3 The general exergy efficiency of liquefaction unit 554
Table 4 Compressibility factor A of oxygen 555
Table 5 Simulation conditions of the cold energy recovering unit 556
Table 6 The average of the consumption of different cases557
MANUSCRIP
T
ACCEPTED
ACCEPTED MANUSCRIPT
28 / 28
Figures: 558
Fig.1. Principle of oxygen system of ASU with CVO 559
Fig.2. Diagram of the liquefaction unit and the cold energy recovering unit 560
Fig.3. The pressure of oxygen compression and transportation pipeline unit 561
Fig.4. Diagram of the typical externally compressed cryogenic air separation 562
process 563
Fig.5. The exergy balance of ASU and LU 564
Fig.6. The effect of γ on the consumption of unit oxygen 565
Fig.7. The effect of different discharge pressure of oxygen (a) / nitrogen (b) 566
compressor on the energy consumption, exergy efficient and exergy loss of it 567
Fig.8. Daily data of supply and demand (a) as well as liquefaction and release (b) 568
of oxygen during 59 days in 2009 569
Fig.9. The effect of γ on the total electricity consumption of the three cases 570
Fig.10. Diagram of the cold energy recovering unit in Aspen Plus 571
Fig.11. The effect of Vr on the difference of energy consumption between Wr and 572
We 573
Fig.12. The influence of the γ on the overall consumption of unit oxygen 574
MANUSCRIP
T
ACCEPTED
ACCEPTED MANUSCRIPT
Table 1. The product index of 40, 000 m3/h of ASU
Product Production
/m3·h-1 Purity
Pressure
/MPa(G) Temperature/K
Oxygen gas 40,000 99.6 % O2 0.0191 281.25
Liquid
oxygen 1,500 99.6 % O2 0.17 95.15
Nitrogen gas 40,000 ≤3×10⁻⁶ O2 0.013 285.75
Liquid
nitrogen 500 ≤3×10⁻⁶ O2 0.32 80.15
Liquid argon 1,360 ≤2×10⁻⁶ O2,
≤2×10⁻⁶ N2 0.16 90.15

MANUSCRIP
T
ACCEPTED
ACCEPTED MANUSCRIPT
Table 2. The general exergy efficiency of ASU under rated load condition
Input Exergy/kW Output Exergy/kW
Air in feed 0 Gaseous
nitrogen 455.79
Electricity
consumption
air
compressor 20,600 Liquid nitrogen 121.06
water pump 400 Gaseous oxygen 2,125.29
water cooler 182 Liquid oxygen 413.16
heating unit 456 Liquid argon 485.22
Cooling water in feed 33.28 Crude nitrogen 1,231.36
Cooling water
exiting 334.12
Ein 21,671.28 Eout 5,166
The GEE (ηgen) Eout/Ein×100 %=23.84 %
MANUSCRIP
T
ACCEPTED
ACCEPTED MANUSCRIPT
Table 3. The general exergy efficiency of liquefaction unit
Input Exergy/KW Output Exergy/ KW
Electricity consumption of LU 4,956.52 Gaseous nitrogen 22.00
Middle pressure nitrogen 941.29 Liquid nitrogen 3,088.73
Gaseous oxygen in feed 816.86 Liquid oxygen 2,322.18
Cooling water in feed 128.35 Cooling water exiting 374.51
Eino 5,901.73 Ein
o 2,696.69
Eino 6,026.16 Ein
o 3,485.24
geno 2,696.69/5,901.73×100 %=46.69 %
ηgeno 3,485.24/6,026.16×100 %=57.84 %
Note: the superscripts o and n represent the LU running under full-LO condition and
full-LN condition respectively.
MANUSCRIP
T
ACCEPTED
ACCEPTED MANUSCRIPT
Table 4. The Compressibility factor A of oxygen
Pressure/MPa 0.5 1.0 1.5 2.0 2.5 3.0
Compressibility factor A 0.9977 0.9949 0.9921 0.9982 0.9866 0.9839
MANUSCRIP
T
ACCEPTED
ACCEPTED MANUSCRIPT
Table 5. Simulation conditions of the cold energy recovering unit
Temperature/K Pressure/MPa Volume/(kmo�h-1) Vapor
fraction
(a) MN 293.15 0.5 1 1
LO 91.15 0.11 - 0
(b) GO 293.15 1.5 1 1
LN 80.15 1.371 - 0

MANUSCRIP
T
ACCEPTED
ACCEPTED MANUSCRIPT
Table 6. The average of the consumption of different cases
wO2
/kW�h�(m3O2)-1
wcom
/kW⋅h�(m3O2)-1
wl
/kW�h�(m3O2)-1
CASE1 0.439 0.200 0.566
CVO CASE2 0.427 0.140 0.566
CASE3 0.431 0.140 0.566
MANUSCRIP
T
ACCEPTED
ACCEPTED MANUSCRIPT
Fig. 1. Principle of oxygen system of ASU with CVO
1-air compressor; 2- distillation column; 3- flowmeter; 4- bleed valves; 5, 8-valve; 6-oxygen
compressor; 7-oxygen check valve; 9- reducing valve of user; 10-spherical tank; 11- pressure
control valve; 12- liquefaction unit; 13-liquid oxygen tank; 14- cold energy recovering unit;
15, 18-pressure sensor; 16-liquid nitrogen tank; 17- liquid oxygen evaporator;
MANUSCRIP
T
ACCEPTED
ACCEPTED MANUSCRIPT
Fig. 2. Diagram of the liquefaction unit and the cold energy recovering unit NTC—nitrogen compressor; BC—booster compressor; ET—expansion turbine; HE—heat
exchanger
MANUSCRIP
T
ACCEPTED
ACCEPTED MANUSCRIPT
Fig. 3. The pressure of oxygen compression and transportation pipeline unit
MANUSCRIP
T
ACCEPTED
ACCEPTED MANUSCRIPT
Fig. 4. Diagram of the typical externally compressed cryogenic air separation process AF—air filter; AC—air compressor; ACT—air cooling tower; WCT—water cooling tower;
MS—molecular sieve purifier; SH—steam heater; BT—booster turbine; ET—expand
turbine; MHE—main heat exchanger; HE2—heat exchanger of argon; HE3—expand air
sub-cooler; E4—liquid sub-cooler; K1—main cooling evaporator; C1—lower column;
C2—upper column; C701—crude argon column I; C702—crude argon column II;
C703—pure argon column; K704—Crude argon liquefier; AP—argon pump
MANUSCRIP
T
ACCEPTED
ACCEPTED MANUSCRIPT
Fig. 5. The exergy balance of ASU and LU
MANUSCRIP
T
ACCEPTED
ACCEPTED MANUSCRIPT
Fig. 6. The effect of γ on the consumption of unit oxygen
MANUSCRIP
T
ACCEPTED
ACCEPTED MANUSCRIPT
Fig. 7(a). The effect of different discharge pressure of oxygen compressor on the energy consumption, exergy efficient and exergy loss of it
MANUSCRIP
T
ACCEPTED
ACCEPTED MANUSCRIPT
Fig. 7(b). The effect of different discharge pressure of nitrogen compressor on the energy consumption, exergy efficient and exergy loss of it
MANUSCRIP
T
ACCEPTED
ACCEPTED MANUSCRIPT
Fig. 8(a). Daily data of supply and demand of oxygen during 59 days in 2009
MANUSCRIP
T
ACCEPTED
ACCEPTED MANUSCRIPT
Fig. 8(b). Daily data of liquefaction and release of oxygen during 59 days in 2009
MANUSCRIP
T
ACCEPTED
ACCEPTED MANUSCRIPT
Fig. 9. The effect of γ on the total energy consumption of the three cases
MANUSCRIP
T
ACCEPTED
ACCEPTED MANUSCRIPT
Fig. 10(a). Diagram of the cold energy recovering unit in Aspen Plus for liquid nitrogen and gaseous oxygen
MANUSCRIP
T
ACCEPTED
ACCEPTED MANUSCRIPT
Fig. 10(b). Diagram of the cold energy recovering unit in Aspen Plus for liquid oxygen and gaseous nitrogen
MANUSCRIP
T
ACCEPTED
ACCEPTED MANUSCRIPT
Fig. 11. The effect of Vr on the difference of energy consumption between Wr and We
MANUSCRIP
T
ACCEPTED
ACCEPTED MANUSCRIPT
Fig. 12. The influence of the γ on the overall consumption of unit oxygen
MANUSCRIP
T
ACCEPTED
ACCEPTED MANUSCRIPT
1 / 1
Highlights:
� Novel regulation method of ASU to reduce the electricity consumption was
proposed.
� General exergy efficiency of ASU used the new method increased by 11 %.
� Overall consumption of unit oxygen was used to evaluate energy-saving
potential.
� Overall consumption of unit oxygen used CVO method reduces about 4.47 to
6.22 %.