Exercise Four - Analyzing flood data
37
Exercise 4 Analyzing floods and floodplains along the Front Range, Colorado In this exercise, you will have the opportunity to assess flash flood risk using GIS, historical and current records, imagery, and vector features. You will also consider the effect that using public domain spatial data from a local government has on your final decision. Map produced through the analysis of historical floods in Boulder, Colorado. Exercises for The GIS Guide to Public Domain Data
-
Upload
jill-clark -
Category
Education
-
view
1.565 -
download
3
Transcript of Exercise Four - Analyzing flood data
Exercise 4
Analyzing floods and floodplains along the Front Range, Colorado
In this exercise, you will have the opportunity to assess flash flood risk using GIS, historical and current records, imagery, and vector features. You will also consider the effect that using public domain spatial data from a local government has on your final decision.
Map produced through the analysis of historical floods in Boulder, Colorado.
Exercises for The GIS Guide to Public Domain Data

Context
Flash floods are a recurrent problem in mountainous areas as runoff from rainfall is routed through many narrow river valleys. Many cities on the high plains at the base of mountain fronts, such as along the Front Range including Denver, Boulder, Loveland, and Fort Collins in Colorado were founded where rivers flowed from the mountains onto the plains (the South Platte, Boulder, Big Thompson, and Cache la Poudre, respectively). Historically these locations provided settlers and miners with access to the mountains, as well as access to water sources for irrigating crops grown on the plains. However, these sites were also constantly subject to flash flooding from these same rivers. Despite the construction of dams and reservoirs in most of these canyons, flash floods continue to be a threat to the present day.
Loveland suffered the Big Thompson Flood in 1976, in which 139 people died. In 1997, five people died and several buildings on the Colorado State University campus were destroyed by flooding in Fort Collins.

Problem
Flow volume in the city’s rivers
Specific underpasses and other human construction that impact flooding
History of flood events in Boulder and their implications for the future
Public awareness and safety campaigns
The City of Boulder has hired you to assess flash flood hazards for the city. You will use historical and current aerial imagery, floodplains, buildings, streets, and other data in a GIS environment to do your research and to make your final assessment. You will consider the following in your assessment of flood hazards for Boulder: Historical and current imagery of the land,
focusing on Four Mile Canyon Creek
The stream network in the area and the 100-year and the 500-year floodplains
The number, size, and type of buildings inside and outside of the floodplains
The land use inside and outside of the floodplains

Resources Skills Required
Downloading and formatting data from a local government public domain data source
Analyzing both vector and raster data
Integrating historical and current aerial photography, text-based narratives, and present-day ground photographs into the analysis
Providing a critical assessment of the public domain data used in the exercise
TIME This exercise contains sixty-nine questions and will require three to five hours to complete. SOFTWARE ArcGIS 10.0 or later, from Esri.

Work package 1: Accessing, downloading, and formatting data Steps 1 - 13
Create a folder on your computer or network to store data. Make sure the folder has a descriptive name (so you can easily recall its contents) and choose a name without spaces to avoid problems in ArcGIS.
1) Preparation
2) Access the City of Boulder data
Access the City of Boulder, Colorado, GIS data layers site, at http://www.bouldercolorado.gov. Go to City A-Z, click the letter P, and find Planning & Development Services > eMaps > Downloadable GIS Data. You should be at the following page: http://www.bouldercolorado.gov/index.php?option=com_content&task=view&id=3551&Itemid=1280
Accessing the GIS data from the City of Boulder, Colorado, website.

Work package 1: Accessing, downloading, and formatting data Steps 1 - 13
Select the layers listed below: Building Footprints City Floodplain City Limits Hydrology Land Use Main Roads and Street Centerlines After downloading the data archives, unzip each file using an extraction program such as WinZip, 7-zip, or the file extraction program built into Windows.
3) Select layers
4) Add layers to ArcGIS
Start ArcGIS with a blank map document and add the following layers: City Limits City Floodplain Hydrology_Lakes Main Roads Street Centerlines
Adjust the symbology of the layers if required. 5) Adjust symbology
6) Examine view Examine the following perspective view of the Boulder area, including the 4X enlarged view: http://www.floodsafety.com/media/maps/colorado/Boulder/index.htm.

Work package 1: Accessing, downloading, and formatting data Steps 1 - 13
In this exercise, you will pay particular attention to Four Mile Canyon Creek. To download a historical aerial photograph of the area, access the historical aerial photographs of Colorado as scanned by the University of Colorado map library: http://ucblibraries.colorado.edu/aerialphotos/home.asp Select Search by Map and then enter the year “1938” under Start Search in the box on the left. Next, select Boulder County and then the northern tip of the easternmost flight line. Access the photograph named BOW1–21. You should be at the following location: http://ucblibraries.colorado.edu/aerialphotos/flightline.asp?CID=1&FLID=9 Right-click the aerial photograph and save it to your Boulder data folder. Add the aerial photograph to your map document using the Add Data command.
7) Download historical photograph
8) Find Four Mile Canyon Creek
Turn on the Georeferencing toolbar. On the Georeferencing toolbar, select Fit To Display. Make your aerial photograph and the Hydrology_Lakes layer visible. The coordinates you entered are for Wonderland Lake, a lake that appears in the 1938 aerial photograph as well as on the Hydrology_Lakes layer. You should see the lake on the aerial photograph just to the northwest and smaller in size than the lake on the Hydrology_Lakes layer.
9) Fit to Display
On the Tools toolbar, access the Tools > Go to XY command. Change the units to feet, and enter the following values: X: 3059260 Y: 1261150. Use the Flash tool to find Four Mile Canyon Creek, and then the Zoom To tool to zoom to it. Adjust the scale of the map to approximately 1:13,400.

Work package 1: Accessing, downloading, and formatting data Steps 1 - 13
On the Georeferencing Toolbar, use the Add Control Points tool to add a point on the aerial photograph. Start with a point on the southern end of the dam on Wonderland Lake on the 1938 aerial photograph and then select the corresponding point on the Hydrology_Lakes layer. Your image will move as it fits to the real world coordinates of the Hydrology_Lakes layer.
10) Add control points
11) Update georeferencing
Repeat the process of adding control points to the image and then to the lakes vector layer. (Tip: You may find it helps to remove any polygon shading from the Hydrology_Lakes layer.) Add at least six pairs of control points. One pair of control points could be located where Broadway crosses the major stream (Four Mile Canyon Creek) about 2,700 feet northeast of Wonderland Lake. When at least six pairs of control points have been added, select Update Georeferencing on the Georeferencing Toolbar. The aerial photograph should line up with the Street Centerlines and hydrology as shown next:

Work package 1: Accessing, downloading, and formatting data Steps 1 - 13
11) Update Georeferencing (contd.)
Georeferenced aerial photography and vector data.
Save your map document in your data folder.
12.1) What is the name of the metadata file you downloaded that provides information about data layers and their attributes?
12) Save
Work package 1: Accessing, downloading, and formatting data Steps 1 - 13
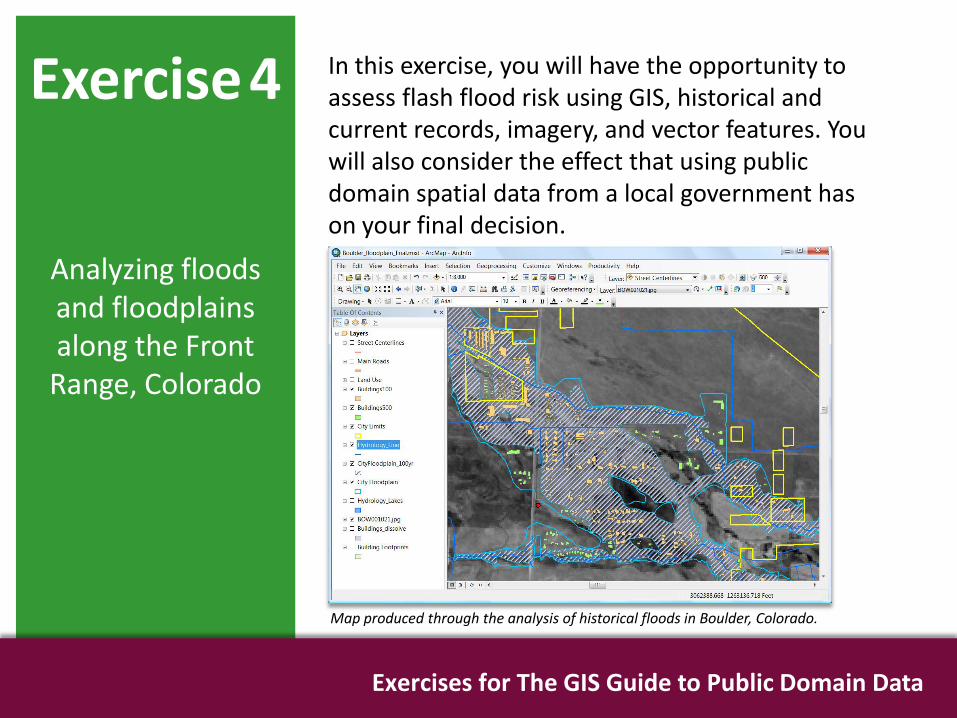
12.2) What is the projection and datum of your map layers? 12.3) At what scale were the data generated? 12.4) What are the restrictions on the use of the data, if any? 12.5) Which pieces of information that you need to use the data are contained in this metadata document? Which pieces are missing? 12.6) In the companion book to these exercises, The GIS Guide to Public Domain Data, we discussed data quality in some detail. Does the disclaimer make any claims about the quality of the data that you will use? How can you determine if the data are of sufficient quality to conduct the floodplain study?
12) Save (contd.)
13) Examine map Visually examine your map.
13.1) What is the primary direction that the creeks flow in the Boulder area? From _________________ to ________________________ 13.2) In what part of Boulder is Four Mile Canyon Creek?
End of work package

Work package 2: Formatting and analyzing data Steps 14 - 27
Label the Main Roads and Street Centerlines layers using the field Label_Name. 14) Label layers
15) Use find tool Use the find tool and select the Features tab. Find Wardenburg in the Street Centerlines layer:
Add the Building Footprints layer. You are examining an area on the University of Colorado campus. Notice how the some buildings are composed of multiple polygons. These buildings may either have had an extension added or for some other reasons are maintained by the City of Boulder’s GIS staff as multiple polygons. In this activity, you will be determining the largest buildings in the floodplain. As these internal polygons will be interpreted as multiple buildings, they will interfere with your calculation. Therefore, you will first need to remove the internal lines that divide these buildings into multiple polygons.
Finding Wardenburg Drive.
17) Add building footprints layer
16) Zoom to street Right-click the results and zoom to this street. Change the scale to 1:3000.

Work package 2: Formatting and analyzing data Steps 14 - 27
To remove these internal polygons you will need to dissolve the internal lines. Do this by opening Windows > Catalog, navigate to the Systems Toolboxes, and select Data Management Tools > Generalization > Dissolve function, and enter the arguments set out below. Note: As your goal is to have one attribute per polygon feature, make certain that you uncheck the Create multipart features choice, as this would create one feature with many polygons. Make sure the path name points to the location where your other Boulder layers are stored. Note that your new layer will be named Buildings_Dissolve.shp.
Removing internal polygons from the Building Footprints layer.
18) Remove internal polygons

Work package 2: Formatting and analyzing data Steps 14 - 27
Save your map document in your data folder. 19) Save
20) Access table Access the table for your Buildings_Dissolve layer.
20.1) Compare the number of rows in your dissolved buildings table to the number of rows in your original Building Footprints layer. Which one contains fewer rows? Why? 20.2) Does the Buildings_Dissolve layer include an attribute indicating the areal size of the buildings?
You have two options for adding the area for each building. You could access the System Toolboxes and run Spatial statistics tools > Utilities > Calculate areas. However, with over 42,000 building polygons, this approach may require a long time to process. The second option is to create a geodatabase, and then load the dissolved buildings shapefile into the geodatabase as a feature class. All vector layers in a geodatabase contain information on the area and length of each feature. For this exercise, use the second option; it will be faster and serve to illustrate one of the advantages of working with geodatabases.

Work package 2: Formatting and analyzing data Steps 14 - 27
First, open an ArcCatalog window, navigate to your workspace, right-click, and select New > Personal Geodatabase, as shown next:
Name your new geodatabase buildings.mdb.
21) Create new geodatabase
Creating a new personal geodatabase.

Work package 2: Formatting and analyzing data Steps 14 - 27
Next, navigate to your buildings personal geodatabase and select Import > Feature Class (Single), as follows:
Select your dissolved buildings shapefile as the input features, your new empty buildings database as the output location, and name the new feature class Buildings_Dissolve as follows:
22) Import data
Configuring the feature class import settings.
23) Create feature class
Importing a feature class into a personal geodatabase.

Work package 2: Formatting and analyzing data Steps 14 - 27
From the ArcCatalog window, add the new buildings feature class to your ArcMap document, if the layer is not already present.
Identify each layer in your ArcMap document to familiarize yourself with your layers, and rename your new buildings feature class to a more descriptive name.
24) Add layer to ArcMap
25) Rename feature class
24.1) Do you now have areal sizes for each building? In what units (square meters, square feet, square kilometers) are these areas reported?
26) Create new layer Open the attribute table for the City Floodplain layer and select all features that represent the 100-year flood event. Create a new layer from those features to help visualize the different flood events. Rename the new layer to City Floodplain_100yr. Switch the selection in the original City Floodplain layer to see the 500-year flood event.
26.1) Which should be larger in spatial extent, a 100-year flood event or a 500-year flood event? Why? 26.2) Examine the extent of the 100-year floodplain and the 500-year floodplain. Does the data appear to match what you predicted in the previous question? 26.3) Does the 500-year floodplain dataset include all of the areas that could be underwater in a 100-year flood?
27) Save Save your map document in your data folder. End of work package

Work package 3: Analyzing data - Floodplains Steps 28 - 39
Add the Hydrology_Line layer to your map document and find line Feature ID (FID) 2303.
28) Find feature
29) Examine floodplain data
Finding a feature in the Hydrology_Line layer.
This is a section of Four Mile Canyon Creek on the north side of Boulder. If this feature is located somewhere else in your dataset, zoom to the north side of Boulder and examine this creek.
Become familiar with the entire path of Four Mile Canyon Creek and of Boulder Creek as they wind through the city.
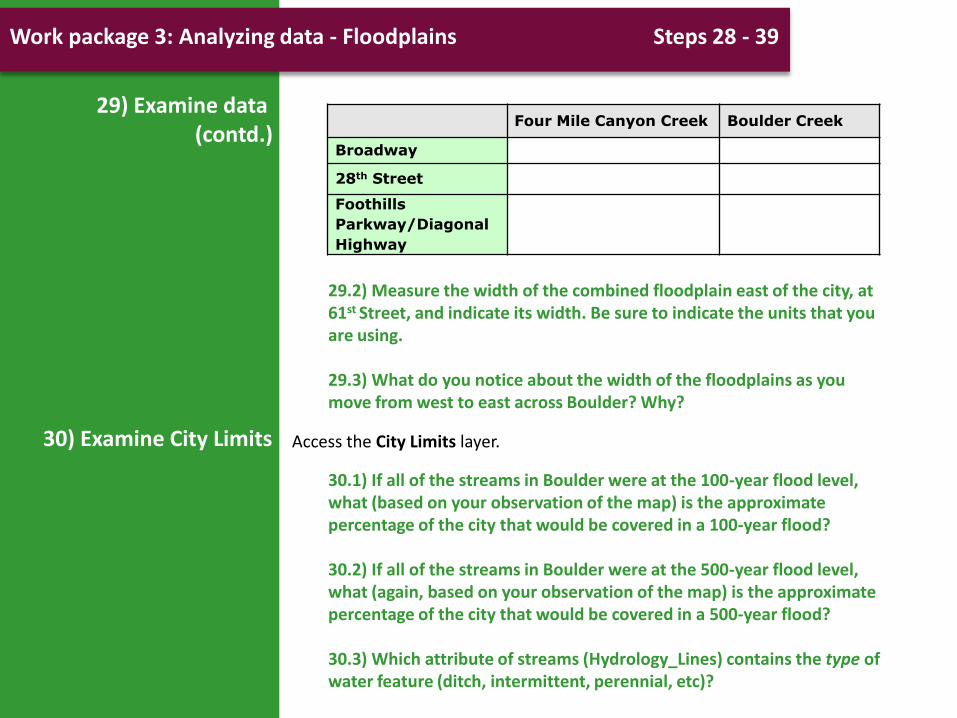
29.1) Measure the width of the 500-year floodplain at Four Mile Canyon Creek and the Boulder Creek floodplain at the three points indicated next, where the following roads cross the floodplain. Be sure to indicate in the following table the units of measurement that you are using.
Work package 3: Analyzing data - Floodplains Steps 28 - 39
29) Examine data (contd.)
Access the City Limits layer.
Four Mile Canyon Creek Boulder Creek
Broadway
28th Street
Foothills
Parkway/Diagonal
Highway
29.2) Measure the width of the combined floodplain east of the city, at 61st Street, and indicate its width. Be sure to indicate the units that you are using. 29.3) What do you notice about the width of the floodplains as you move from west to east across Boulder? Why?
30) Examine City Limits
30.1) If all of the streams in Boulder were at the 100-year flood level, what (based on your observation of the map) is the approximate percentage of the city that would be covered in a 100-year flood? 30.2) If all of the streams in Boulder were at the 500-year flood level, what (again, based on your observation of the map) is the approximate percentage of the city that would be covered in a 500-year flood? 30.3) Which attribute of streams (Hydrology_Lines) contains the type of water feature (ditch, intermittent, perennial, etc)?
Work package 3: Analyzing data - Floodplains Steps 28 - 39
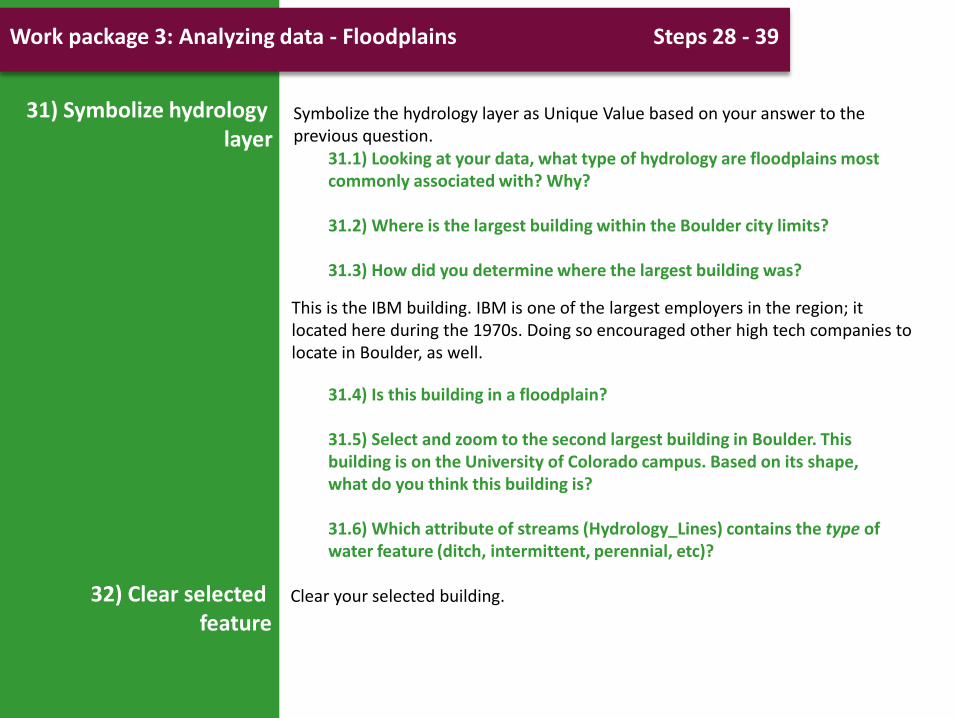
31) Symbolize hydrology layer
31.1) Looking at your data, what type of hydrology are floodplains most commonly associated with? Why? 31.2) Where is the largest building within the Boulder city limits? 31.3) How did you determine where the largest building was?
31.4) Is this building in a floodplain? 31.5) Select and zoom to the second largest building in Boulder. This building is on the University of Colorado campus. Based on its shape, what do you think this building is? 31.6) Which attribute of streams (Hydrology_Lines) contains the type of water feature (ditch, intermittent, perennial, etc)?
Symbolize the hydrology layer as Unique Value based on your answer to the previous question.
This is the IBM building. IBM is one of the largest employers in the region; it located here during the 1970s. Doing so encouraged other high tech companies to locate in Boulder, as well.
32) Clear selected feature
Clear your selected building.

Work package 3: Analyzing data - Floodplains Steps 28 - 39
33) Select buildings in floodplain
Next, use Select By Location to select all of the buildings within the 500-year floodplain, as shown next. (Remember to use the currently selected features in the City Floodplain layer.)
Selecting buildings within the 500-year floodplain.

Work package 3: Analyzing data - Floodplains Steps 28 - 39
34) Export data Select the buildings layer in the table of contents and right-click. Click Data > Export Data and save these buildings in your buildings geodatabase as a feature class named buildings500.
Creating a new feature class containing the buildings in the 500-year flood plain.
Save the buildings500 feature class in the same projection as the layer’s source data.
35) Examine buildings table
Examine the buildings500 attribute table.
35.1) What percentage of all the buildings in Boulder is in the 500-year floodplain? Show your work. 35.2) Near what street intersection is the largest building in the 500-year floodplain?

Work package 3: Analyzing data - Floodplains Steps 28 - 39
36) Interrogate map This building is the lone remnant of Crossroads Mall that formerly occupied the site. View the map of this area (the Twenty Ninth Street shops) at http://www.twentyninthstreet.com/map.
Select the largest building in the 100-year floodplain and zoom to it. 38) Examine buildings table
36.1) What is the name of the store that is the largest building in the 500 year floodplain?
37) Create 100-year floodplain layer
Repeat the above procedures, using the City Floodplain_100yr layer you created earlier, to create a feature class in your buildings geodatabase that represents buildings in the 100-year floodplain. Name this feature class buildings100.
37.1) How many buildings are in the 100-year floodplain? Are there more or fewer buildings in the 100-year floodplain than in the 500-year floodplain? Why?
38.1) How far is the nearest part of this building from Boulder Creek?
This building is Boulder High School, one of two public high schools in the city.
38.2) Considering the types of buildings you have just discovered, compare the relative danger—of damage to property and potential loss of life—of the largest building in the 500-year floodplain versus the largest building in the 100-year floodplain.

Work package 3: Analyzing data - Floodplains Steps 28 - 39
39) Read about the flood warning system
Examine the evaluation of the Boulder Creek flood warning system at http://www.udfcd.gisworkshop.com/pdfs/Boulder Creek Local Flood Warning System 2002.pdf
39.1) Do you think that the recommendations for the high school are adequate? Why or why not? 39.2) The land west of Boulder High School, between the school and Broadway, was full of streets until it was cleared as part of the flood control plan. How large an area was cleared? Be sure to indicate the units you are using.
End of work package

Work package 4: Incorporating land use and stream flow data Steps 40 - 47
40) Add land use layer
Add the Land Use layer and symbolize as Unique Value on the attribute “LANDUSE.” Use the data below to construct a 2-column spreadsheet in Excel.
LANDUSE DESCRIPTION
AG Agricultural
CB Community Business
CI Community Industrial
EP Environmental Protection
GB General Business
GI General Industrial
HR High Density Residential
LI Light Industrial
LR Low Density Residential
MH Manufactured Housing
MR Medium Density Residential
MUB Mixed Use Business
MU-B Mixed Use Business
MUI Mixed Use Industrial
MU-I Mixed Use Industrial
MUR Mixed Use Residential
MXR Mixed Density Residential
OS-A Open Space, Acquired
OS-DR Open Space, Development Rights
OS-O Open Space, Other
PI Performance Industrial
PK-U/O Park, Urban and Other
PUB Public
RB Regional Business
SC Service Commercial
TB Transitional Business
VLR Very Low Density Residential

Work package 4: Incorporating land use and stream flow data Steps 40 - 47
40) Add land use layer (contd.)
Add the spreadsheet to your ArcMap session. Use a tabular join on the Landuse code to join the spreadsheet to your Land Use layer. Note how much HR (high density residential) and LR (low density residential) land is inside the floodplain.
40.1) Why do you think these two types of land use are some of the worst possible land uses in a floodplain? 40.2) What land use do you consider to be most appropriate in a floodplain?
Four Mile Canyon Creek is a typical portion of the Boulder Creek watershed. It has experienced several flood events in the last 100 years, although most of the time it is a very unimposing watercourse. In fact, water only flows in the creek during times of heavy snowmelt or after fairly substantial rains.

Work package 4: Incorporating land use and stream flow data Steps 40 - 47
41) Examine photograph Examine the photograph below of Four Mile Canyon Creek, looking west from about 1 kilometer west of Broadway.
Four Mile Canyon Creek, Colorado. Photograph by Joseph Kerski.
41.1) Describe the landscape’s vegetation, river channel, and topography. 41.2) Can a river flood even if it is not flowing all the time?

Work package 4: Incorporating land use and stream flow data Steps 40 - 47
42) Examine Four Mile Creek watershed
Next, examine Four Mile Canyon Creek in more detail by studying the resources on BASIN, the Boulder Area Sustainability Information Network. Funded by the US Environmental Protection Agency (EPA), BASIN is a public resource that provides information about the Boulder Creek watershed. You will focus your examination on one small portion of the watershed—Four Mile Canyon Creek in North Boulder. The articles you will read next deal with the characteristics of the creek and its flood history over the last 100 years. Start by going to the BASIN website: http://bcn.boulder.co.us/basin/. Go to Select and Theme: Watershed, Under Inside the Watershed, and select Four Mile Canyon Creek.
42.1) Approximately where does the creek begin and end?
The 100-year flood flow for Four Mile Canyon Creek is 3,520 cubic feet per second at Broadway.
Access the Boulder Creek watershed on the BASIN website. 43) Examine Boulder Creek watershed 43.1) What would be the flow in cubic feet per second (CFS) at the
confluence of Boulder Creek with Four Mile Canyon Creek during a 100-year flood?

Work package 4: Incorporating land use and stream flow data Steps 40 - 47
44) Access stream gauging data
Access the USGS stream gauging station’s current information (and note the underscores in the website address) below: http://waterdata.usgs.gov/co/nwis/uv/?site_no=06730200&PARAmeter_cd=00065,00060 Alternatively, access this gauging station by visiting the USGS real-time data for Colorado streamflow resource: http://waterdata.usgs.gov/co/nwis/current/?type=flow Scroll down to Boulder Creek. This is the USGS stream gauge listed as follows: BOULDER CREEK AT NORTH 75TH ST NEAR BOULDER, CO
44.1) What is the discharge in CFS flowing right now through the gauging station? 44.2) How many more times the current flow is the 100-year flow? Show your work. 44.3) Is this gauging station upstream or downstream from the Four Mile Canyon Creek area near Broadway?

Work package 4: Incorporating land use and stream flow data Steps 40 - 47
45) Examine photograph Examine the ground photograph below, where Broadway spans Four Mile Canyon Creek.
Four Mile Canyon Creek at Broadway. Photograph by Joseph Kerski.
46) Examine watershed Go back to Four Mile Canyon Creek on the BASIN website and study this watershed.
46.1) Do any potential problems exist as a result of the roadway bridge and culvert over Four Mile Canyon Creek at Broadway?
47) Examine floodplain Examine the shape of the floodplain west of Broadway in your GIS.
47.1) How might this problem explain the shape of the 100-year floodwaters west of Broadway?
End of work package

Work package 5: Incorporating historical evidence Steps 48 - 53
48) Examine article
There have been two recorded periods of major flood events. The first was at the beginning of the twentieth century. The second was a series of floods during the middle of the same century. The articles listed discuss floods during both periods. Access the articles by clicking the 1916, 1950, 1951, and 1955 history of flash floods, under Basin History at http://bcn.boulder.co.us/basin/history/floodhistory1.html Read these articles, and then answer the following questions.
48.1) In the 1916 flood, how deep were the floodwaters on the Terry Ranch? 48.2) On what date (day and month) did each of the floods occur that you read about in the following years? 1916 ______________ 1950 ______________ 1951 ______________ 1955 ______________ 48.3) Based on this analysis, what is the dominant flood season in this region? 48.4) Considering where this region is located, why is this the dominant flood season? 48.5) Why do you suppose that Four Mile Canyon Creek rarely flows, unlike 100 years ago when it was a perennial stream?

Work package 5: Incorporating historical evidence Steps 48 - 53
49) Read eye-witness account
Read the account of Dolores Benson in the 1950 flood, and note the location of her home, at http://bcn.boulder.co.us/basin/history/1950lood.html. Find the location of Ms. Benson’s home in your GIS map document using the Find tool. Under Locations, select 9.3.1 US Streets Geocode Service (ArcGIS Online), and enter the intersection indicated by the 1950 flood account, as shown next.
50) Using the find tool
Locating Broadway and Tamarack.
In the results line, right-click, zoom to the intersection, and add a graphic point to mark the spot.
50.1) Near what river’s floodplain is Ms. Benson’s home? Is it nearest to the 100-year floodplain of this river, or the 500-year floodplain? 50.2) Why is Ms. Benson’s home outside the floodplain, if it was indeed flooded in 1950?

Work package 5: Incorporating historical evidence Steps 48 - 53
51) Zoom to 1938 photograph
Right-click your 1938 aerial photograph and zoom to the extent of this layer. Toggle the current streets off and on.
52) Using the transparency tool
51.1) What was the predominant land use in this area of north Boulder in 1938?
Toggle between the floodplains several times so that you can examine the photograph underneath or use the transparency feature in the Effects toolbar.
52.1) What evidence can you find on the aerial photograph to suggest that it has a history of flooding? 52.2) What is the current predominant land use in this area according to the Land Use layer and as indicated by the street pattern? 52.3) After visually assessing the number of housing units in the historical image, how many people would you estimate were living in the area covered by the photo in 1938? 52.4) After visually assessing housing units on the current imagery and also after examining the street layer, how many people would you estimate live in the same area today? 52.5) Do you believe that development has encroached on the floodplain? Explain.

Work package 5: Incorporating historical evidence Steps 48 - 53
52) Using the transparency tool
(contd.)
52.6) How many buildings are inside the Four Mile Canyon Creek 500-year floodplain in this area? 52.7) How did you derive your answer about how many buildings are inside the Four Mile Canyon Creek 500-year floodplain?
53) Create a layout Create a layout of the buildings inside the Four Mile Canyon floodplain with your 1938 aerial as a base, including whatever map layers you feel are necessary to communicate the map’s purpose of assessing flood hazards, and export the layout as a .jpg file.
End of work package

Work package 6: Analyzing data - Assessing the results Steps 54 - 57
54.1) What, if any, are the similarities between this 1997 flood and the historical floods in Boulder?
54) Read flood report Fort Collins and the Colorado State University campus suffered a damaging, fatal flash flood in 1997. Read about it in the Fort Collins Coloradoan at: http://www.coloradoan.com/news/coloradoanpublishing/SpringCreekFlood/index.html
55) Read university notes
Examine the Boulder Creek Flood Notebook from the University of Colorado at: http://www.colorado.edu/hazards/bcfn/flood1.html Use CTRL + F to find the section titled “The Decisions in Retrospect;” read this section.
55.1) Make three observations about the issues involved with preparing for a flash flood in Boulder, and by extension, in other communities.
56) Analyze flood drill Analyze the flood drill described at: http://www.bouldercolorado.gov/index.php?option=com_content&view=article&id=4921&Itemid=2070
56.1) How adequate do you think the drill described here is in alerting and preparing the public for a flood event?
Work package 6: Analyzing data - Assessing the results Steps 54 - 57
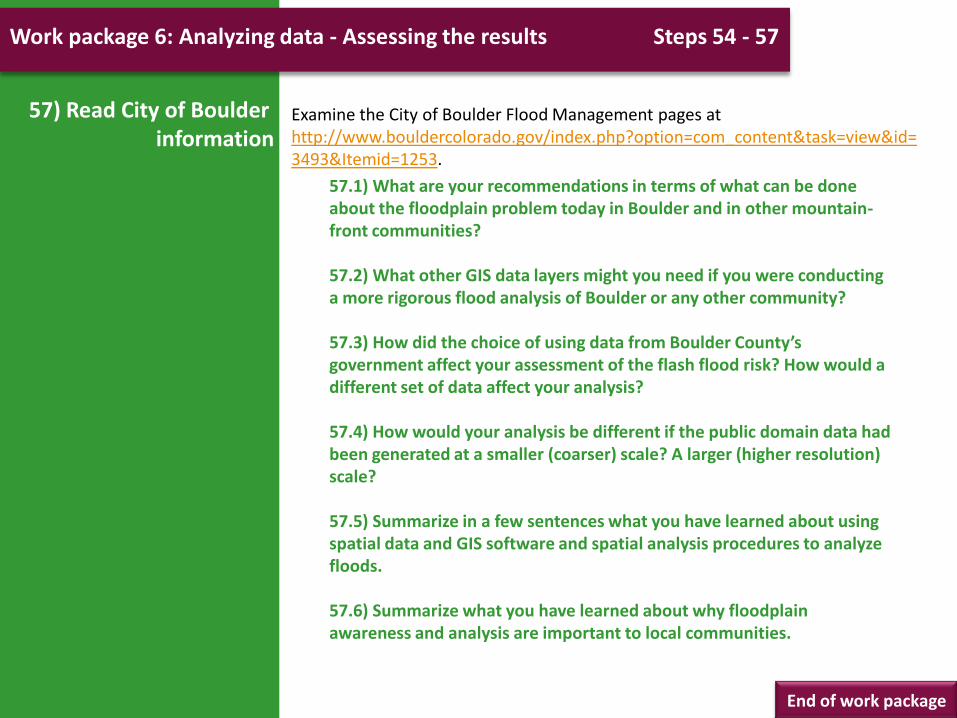
57.1) What are your recommendations in terms of what can be done about the floodplain problem today in Boulder and in other mountain-front communities? 57.2) What other GIS data layers might you need if you were conducting a more rigorous flood analysis of Boulder or any other community? 57.3) How did the choice of using data from Boulder County’s government affect your assessment of the flash flood risk? How would a different set of data affect your analysis? 57.4) How would your analysis be different if the public domain data had been generated at a smaller (coarser) scale? A larger (higher resolution) scale? 57.5) Summarize in a few sentences what you have learned about using spatial data and GIS software and spatial analysis procedures to analyze floods. 57.6) Summarize what you have learned about why floodplain awareness and analysis are important to local communities.
57) Read City of Boulder information
Examine the City of Boulder Flood Management pages at http://www.bouldercolorado.gov/index.php?option=com_content&task=view&id=3493&Itemid=1253.
End of work package
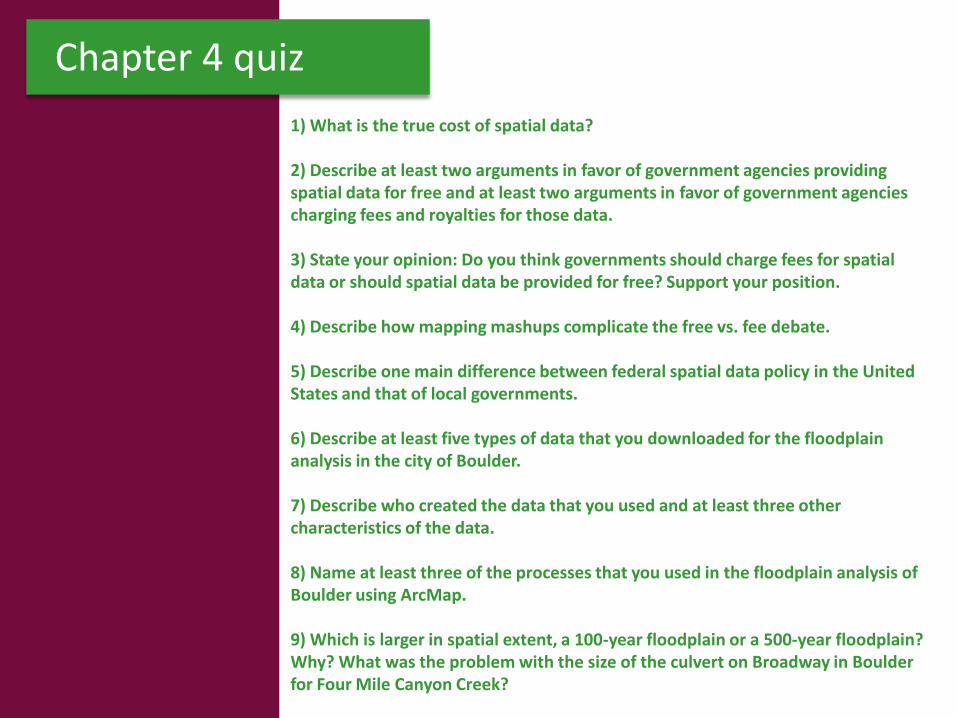
1) What is the true cost of spatial data? 2) Describe at least two arguments in favor of government agencies providing spatial data for free and at least two arguments in favor of government agencies charging fees and royalties for those data. 3) State your opinion: Do you think governments should charge fees for spatial data or should spatial data be provided for free? Support your position. 4) Describe how mapping mashups complicate the free vs. fee debate. 5) Describe one main difference between federal spatial data policy in the United States and that of local governments. 6) Describe at least five types of data that you downloaded for the floodplain analysis in the city of Boulder. 7) Describe who created the data that you used and at least three other characteristics of the data. 8) Name at least three of the processes that you used in the floodplain analysis of Boulder using ArcMap. 9) Which is larger in spatial extent, a 100-year floodplain or a 500-year floodplain? Why? What was the problem with the size of the culvert on Broadway in Boulder for Four Mile Canyon Creek?
Chapter 4 quiz
10) The choice of using data from Boulder County’s government affected your assessment of the flash flood risk. The data were collected under certain quality criteria, at a certain scale, and using specific techniques. Using a different set of data would affect the final analysis in terms of the numbers of land parcels impacted by floods, the location of those parcels, the amount of flooding that would take place, and much more. Beyond the quantitative analysis, a different dataset would alter the qualitative assessment and the subsequent recommendations that one would make from the study. Data from a variety of different sources would likewise affect the final results. How can the use of GIS help inform citizens about the risk of flash floods and help in the development of a flood mitigation plan, for example, the emergency preparedness guides on the Boulder Office of Emergency Management (http://boulderoem.com/). How did the availability of public domain data for the City of Boulder affect your ability to study floods in the area using GIS?
Chapter 4 quiz